changes in litter quality induced by n deposition alter
TRANSCRIPT

1
Type of contribution: Regular paper 1
Date of preparation: August 25, 2018 2
Number of text pages: 36 3
Number of tables: 2 4
Number of figures: 5 5
Changes in litter quality induced by N deposition alter soil microbial 6
communities 7
Yingbin Li a, e, T. Martijn Bezemer c, d Junjie Yang b, Xiaotao Lü a, Xinyu Li a, Wenju 8
Liang* a, Xingguo Han a, b, e, Qi Li* a 9
a Institute of Applied Ecology, Chinese Academy of Sciences, Shenyang 110016, China 10
b State Key Laboratory of Vegetation and Environmental Change, Institute of Botany, 11
Chinese Academy of Sciences, Beijing 100093, China 12
c Netherlands Institute of Ecology (NIOO-KNAW), Department of Terrestrial Ecology, 13
P.O. Box 50, Wageningen 6700 AB, The Netherlands 14
d Institute of Biology, Section Plant Ecology and Phytochemistry, Leiden University, 15
P.O. Box 9505, 2300 RA Leiden, The Netherlands 16
e University of Chinese Academy of Sciences, Beijing 100049, China 17
* Corresponding author: Dr. Qi Li and Prof. Wenju Liang 18
Tel.: +86-24-83970359; fax: +86-24-83970300 19
E-mail address: [email protected] or [email protected] 20
21

2
Abstract 22
Soil microbial community composition and litter quality are important drivers of litter 23
decomposition, but how litter quality influences the soil microbial composition largely 24
remains unknown. We conducted a microcosm experiment to examine the effects of 25
changes in litter quality induced by long-term N deposition on soil microbial 26
community composition. Mixed-species litter and single-species litter were collected 27
from a field experiment with replicate plots exposed to long-term N-addition in a 28
semiarid grassland in northern China. The litters were decomposed in a standard live 29
soil after which the composition of the microbial community was determined by 30
Illumina MiSeq Sequencing. Changes in litter stoichiometry induced by N-addition 31
increased the diversity of the fungal community. The alpha-diversity of the fungal 32
community was more sensitive to the type of litter (mixed- or single-species) than to 33
the N-addition effects, with higher abundance of fungal OTUs and Shannon-diversity 34
observed in soil with mixed-species litter. Moreover, the relative abundance of 35
saprophytic fungi increased with increasing N-addition rates, which suggests that fungi 36
play an important role in the initial stages of the decomposition process. Litter type and 37
N addition did not significantly change the diversity of bacterial community. The 38
relative abundance of ammonia-oxidizing bacteria was lower in high N-addition 39
treatments than in those with lower N input, indicating that changes in litter 40
stoichiometry could change ecosystem functioning via its effects on bacteria. Our 41

3
results presented robust evidence for the plant-mediated pathways through which N-42
deposition affects the soil microbial community and biogeochemical cycling. 43
Keywords: N addition; Litter quality; Decomposition; Soil microbial community; 44
Illumina MiSeq Sequencing; Diversity. 45
46
1. Introduction 47
Plant litter inputs are important resources for soil organisms in terrestrial ecosystems. 48
Litter decomposition depends on litter quality and the composition of the decomposer 49
community (Hättenschwiler et al., 2005; van der Heijden, et al., 2008; Bardgett and 50
Wardle 2010). Litter chemical properties, particularly lignin and N-contents are 51
important controllers of litter decomposition that may explain up to 70% of the variation 52
in decomposition rates (Aerts, 1997; Zhang et al., 2008). Changes in soil microbial 53
community composition can also alter decomposition processes (de Boer et al., 2005; 54
van der Wal et al., 2013). For instance, only some specific taxa of fungi and bacteria 55
can decay lignin (Bugg et al., 2011; van der Wal et al., 2013; Brown and Chang, 2014) 56
and the abundance of these microbes in soils varies greatly at local scales (Leite et al., 57
2017). 58
The number of fungal and bacterial species (richness) and their relative abundance 59
(evenness) are important characteristics of the soil microbial community (Nannipieri et 60
al., 2003; van der Wal et al., 2013). Several authors have argued that microbial diversity 61
is positively related to decomposition processes (e.g. Naeem et al., 2000; McGuire et 62

4
al., 2010). Increased microbial diversity generally leads to a more efficient use of 63
organic substrates because of greater functional exploitation (Loreau, 2001; 64
Hättenschwiler et al., 2011). Competitive interactions between species within a 65
community can also lead to negative relationships between microbial diversity and litter 66
decomposition (Fukami et al., 2010; Nielsen et al., 2010; Song et al., 2012;). How the 67
diversity of the soil decomposer community responds to variation in litter quality within 68
one grassland soil is less well understood (Zak et al., 2003; Strickland et al., 2009). 69
Litter mixtures may have different nutrient contents depending on the composition 70
of plant species making up the mixture and may provide different substrate qualities or 71
chemical compounds to the microbial community decomposing this litter (Hooper et 72
al., 2000; Pei et al., 2017). Hence, a higher diversity in litter characteristics, 73
representing more diverse substrates for decomposition, may lead to higher microbial 74
diversity than litter from a single plant species (Hu et al., 2006; Szanser et al., 2011). 75
Shihan et al. (2017) found that enhanced litter species richness increased the catabolic 76
diversity of the soil microbial community. How the diversity of the soil decomposer 77
community responds to the changes of litter composition is less well understood. 78
Litter quality is a broad term that includes chemical variables such as energy source 79
(C or lignin contents), and nutrients content (e.g. N and P) and their ratios (C/N, C/P, 80
N/P, and lignin/N) (Cadisch and Giller, 1997). It can affect not only the diversity of the 81
microbial community, but also the relative abundance of specific taxa that are involved 82
in the decomposition process. Bacteria and fungi in the soil differ greatly in growth 83

5
strategies, competitiveness and in how they use resources, and hence the quality of litter 84
can influence soil microbial community composition (Schneider et al., 2012; Kaiser et 85
al., 2014). Fungi have lower nutrient requirements than bacteria and exhibit a high 86
carbon-use efficiency on poor-quality substrates (Six et al., 2006; Keiblinger et al., 87
2010), with the capacity to degrade more recalcitrant substrates such as lignin (McGuire 88
et al., 2010). Most enzymes that can degrade recalcitrant C-substrates are secreted by 89
fungi such as the ones that belong to saprobes (Schneider et al., 2012). As a result, the 90
relative abundance of fungi may decrease with increases of litter quality, especially for 91
saprobes fungi. Bacteria often have fast growth and turnover rates, contain higher 92
amounts of N, P and organic compounds and favor low substrate C/N ratios (Güsewell 93
and Gessner, 2009; Kaiser et al., 2014). Increased quality of resources would increase 94
substrate availability to the microbial community, increase rates of N transformations 95
by higher available organic N stocks for N mineralization, and coincide with an increase 96
in the relative abundance of microbial functional groups that cycle N (Wieder et al., 97
2013). Thus, increases in the quality of resources can change bacterial composition e.g. 98
via increasing the relative abundance of bacteria related to N-cycling. Although 99
previous studies have shown that soil microbial communities can shift in response to 100
resource quality, how specific microbial taxa or lineages responses to decomposition of 101
different types of litter is not clear. 102
With the rapid increase of fossil fuel combustion and agricultural practices, human 103
activities have dramatically increased the deposition of reactive N (Galloway et al., 104

6
2008; Gruber and Galloway, 2008). Since most of the terrestrial ecosystems are N 105
limited, N-enrichment resulting from N-deposition has greatly changed ecosystem 106
processes, structure, and functioning (Elser et al., 2007; Pierik et al., 2011). N-107
deposition could reduce plant species richness and alter community composition in 108
grasslands (Bai et al., 2010; Bobbink et al., 2010; Pierik et al., 2011). Furthermore, N-109
deposition would enhance litter quality by increasing litter N concentration and 110
decreasing C/N ratios (Henry et al., 2005; Han et al., 2014). Therefore, N-deposition 111
can influence decomposition processes through altering both litter composition and 112
intra-specific chemical quality (Hobbie, 2005; Knorr et al., 2005). 113
To evaluate how changes in litter quality following N-deposition would influence 114
soil microbial communities, we conducted a microcosm experiment. Mixed-species and 115
single-species litters were collected from a long-term experiment with different N-116
addition levels in a semiarid grassland in northern China. After four months of 117
decomposition on a standard soil in microcosms, soil samples were collected, and the 118
bacterial and fungal community was analyzed by sequencing. Specifically, we address 119
the following hypotheses: (i) decomposer communities exposed to mixed-species litter 120
will exhibit higher diversity than those exposed to single-species litter; (ii) higher litter 121
quality following long-term N deposition will increase microbial community diversity 122
(higher richness or evenness); (iii) increased litter quality will change the composition 123
of the microbial community, with a decrease in the relative abundance of saprophytic 124
fungi, and an increase in the relative abundance of bacteria related to N-cycling. 125

7
2. Materials and methods 126
2.1 Litter and soil collection 127
Litter and soil samples were collected from a long-term N-addition experiment 128
conducted in a natural steppe ecosystem near the Inner Mongolia Grassland Ecosystem 129
Research Station (IMGERS, 116˚14ˈE, 43˚13ˈN) of the Chinese Academy of Sciences. 130
The mean annual temperature was 0.9 ˚C, with mean monthly temperatures ranging 131
from -21.4 ˚C in January to 19.7 ˚C in July (mean temperature of May to September is 132
around 16˚C). The mean annual precipitation is 355.3 mm, with 60%-80% falling 133
during the growing season (May to August). According to the FAO (Food and 134
Agriculture Organization of the United Nations) classification system, the soil is 135
classified as Haplic Calcisol. The perennial rhizomatous grass Leymus chinensis (Trin.) 136
Tzvel. and the perennial bunchgrass Stipa grandis P. Smirn account for more than 60% 137
of the total aboveground biomass in the plant community. More information about the 138
plant species in this experiment can be found in Zhang et al. (2014b) and Zhang et al. 139
(2017). This area had received no fertilizer before the experiment started and ambient 140
total N-deposition is less than 1.5g N m-2 yr-1 (Lue and Tian, 2007). 141
The long-term N-addition experiment was established in September 2008. There 142
were nine of N-addition levels (0, 1, 2, 3, 5, 10, 15, 20, 50 g N m-2 yr-1) applied at two 143
frequencies (2 times and 12 times per year). For the present study, seven N-addition 144
levels (0, 2, 5, 10, 15, 20, 50 g N m-2 yr-1, 2 times per year) were selected. Hereafter, 145
the N-addition treatments will be denoted as: N0, N2, N5, N10, N15, N20, and N50. To 146

8
mirror the seasonal pattern of natural N-deposition, in June, NH4NO3 was mixed with 147
purified water (9.0 L per plot; the N0 treatment received only purified water) and 148
sprinkled evenly using a sprayer to each plot to simulate wet deposition. In November, 149
NH4NO3 was mixed with clean sand (0.5 kg sand per plot; the N0 treatment received 150
only sand) and broadcasted evenly by hand to simulate dry deposition. The experiment 151
was designed according to a randomized block design with 10 replicate blocks; each 152
block was 45 × 70 m. The blocks were separated by 2-m walkways. There were nine 153
plots treated with nine N-addition levels in each block. Each plot measured 8 × 8 m, 154
and plots were separated by 1m walkways. We randomly selected five blocks for litter 155
collection (7 N treatments × 5 replicate blocks = 35 plots). 156
At the end of September 2014, when most of the aboveground plants material had 157
senesced, we collected litter from each treated plot and soil with no N-additions (as 158
standard soil) from outside the plots but within the fence. Litter was collected in two 159
ways, mixed species litter and litter from one dominant species (L. chinensis), hereafter 160
called ‘mixed-species litter’ and ‘single-species litter’. To obtain a representative and 161
homogenous litter sample for the mixed-species litter treatment in each plot, litter was 162
sampled by clipping 2 cm above soil surface in three randomly quadrats (15 × 15 cm). 163
The three quadrats were separated by at least 50 cm and the samples collected from one 164
plot were merged and homogenized. Senesced plant material of L. chinensis was 165
clipped at 2 cm above soil surface and collected throughout the plot. Since soil biotic 166
and abiotic characteristics in the experiment plots were significantly affected by N-167

9
addition treatments (Zhang et al., 2014a). Standard soil was collected from an area 168
inside the fence of the experimental area but outside the experimental plots to eliminate 169
the effect of N addition. Therefore, the standard soil had not received additional N. 170
After removal of the litter layer, thirty 10 × 10 × 10 cm soil blocks (at least 50 cm apart) 171
were dug out using a spade and then placed individually in plastic bags. 172
Litter and soil were transported to the laboratory within 3 days after collection. In 173
the laboratory, the litter samples were divided into two parts. One part was oven-dried 174
at 60 ˚C for 48 h to constant weight and then clipped into fragments of 1 cm in length 175
for the decomposition experiment. The other part was oven-dried at 40 ˚C for 48h for 176
chemical analysis (See below). All soil blocks were passed through a 5-mm sieve and 177
then homogenized thoroughly to one composite sample. 178
2.2 Microcosm experiment 179
We tested how the addition of the two types of litter from seven N-addition treatments 180
influenced the composition of the soil microbial community in a microcosm experiment. 181
To eliminate spatial variation in microclimate and soil heterogeneity, we used a 182
microcosm approach. We constructed 70 microcosms (7 N treatments × 5 replicate 183
blocks × 2 litter types) in plastic containers (10 cm diameter, 10 cm height). The 184
containers were filled with 400g soil ensuring a bulk density of 1 g cm-3 to resemble 185
the situation in the field. The depth of the soil layer in each container was 6 cm. Soil 186
water content was determined by oven-drying subsamples and soils were adjusted to 187
20% soil moisture with distilled water. Microcosms were incubated at constant 188

10
temperature conditions (10 ˚C at night and 20 ˚C at daytime) in the laboratory to 189
simulate the temperature of May to September in field (mean temperature around 16 190
˚C) when microbial activity is strongest, and most of the decomposition is occurring. 191
After ten days, 4.0 g litter (1 cm in length) was evenly mixed into the 1 cm surface layer 192
of the standard live soil. A non-transparent perforated plastic film was used to cover 193
each microcosm to reduce light availability and water loss. Soil moisture in each 194
microcosm was maintained by weighing and adding distilled water once every three 195
days. After 120 days, the 1 cm surface layer of the soil was collected, passed through a 196
2-mm sieve to remove large pieces of litter, but smaller pieces of partly decomposed 197
litter went through the mesh of the sieve and hence this litter was included during DNA 198
extraction. Then the soil was stored at -80 ˚C to be used later for DNA extraction (See 199
below). Since the litter was partly decomposed and soil and humus material attached to 200
the litter could not be removed, we did not measure litter quality at the end of the 201
experiment. 202
2.3 Chemical analyses of litter samples 203
Litter samples were ground and passed through a 0.25 mm sieve for chemical analyses. 204
Total C (TC) was determined using an elemental analyzer (Jena Corporation, Germany). 205
Total N (TN) was measured using the modified Kjeldahl method (ISO, 1995). Total P 206
(TP) was measured colorimetrically after reaction with molybdenum blue. Lignin 207
content was fractionated into acid insoluble material and acid soluble material by 208
sulfuric acid hydrolysis. The acid insoluble material was determined by Muffle furnace 209

11
(Ney Vulcan, USA). The acid soluble material was measured by UV-Vis spectroscopy 210
TU-1901 (Purkinje General Instrument Ltd., China). Litter C/N, C/P, N/P, Lignin/N 211
and Lignin/P were calculated using TC, TN, TP and lignin dataset. 212
2.4 DNA isolation, amplification and illumina Miseq sequencing 213
Microbial genomic DNA was extracted from 0.5g soil using the FastDNA SPIN Kit for 214
Soil (MP Biomedicals LLC. Solon, OH, USA) according to the manufacturer’s 215
instructions. The quality and concentration of the extracted DNA was quantified based 216
on 260/280 nm and 260/230 nm absorbance ratios measured by NanoDrop ND-2000 217
Spectrophotometer (NanoDrop Technologies Inc., Wilmington, DE, USA). To 218
determine the soil bacterial and fungal community composition and diversity, an 219
amplicon survey of the 16S and ITS rRNA was implemented. The V4 hypervariable 220
regions of 16S rRNA gene was amplified using the 515F (5′-221
GTGCCAGCMGCCGCGG-3′) and 907R (5′-CCGTCAATTCMTTTRAGTTT-3′) 222
primer set. The primers ITS1F (5′-GTGCCAGCMGCCGCGG-3′) and 2043R (5′-223
GCTGCGTTCTTCATCGATGC-3′) were used to amplify the ITS1 region of the 224
fungal rRNA. Both primers were tagged with an adaptor, a pad, and a linker, and a 225
unique barcode sequence to each sample. 226
Each sample was amplified in triplicate using a Gene Amp PCR-System 9700 227
(Applied Biosystems, Foster City, CA, USA) in a 20 μl reaction system containing 4 μl 228
5×FastPfu Buffer, 0.5 unit of TransStart FastPfu DNA Polymerase (TransGen Biotech 229
Co. Ltd. Beijing, China), 2 μl of 2.5 mM dNTPs, 0.8 μl of 5 μM forward and reverse 230

12
primer, and 10 ng template DNA. 16S rRNA thermal cycling conditions were as follows: 231
an initial denaturation at 95 ˚C for 3 min, followed by 27 cycles of denaturation at 95 ˚ 232
C for 30 s, 55 ˚ C for 30 s, 72 ˚ C for 45 s, and a final extension at 72 ˚ C for 10 min. 233
ITS rRNA thermal cycling were performed in the same way, except that 32 cycles of 234
denaturation were used. After amplification, 3 μl of the PCR product was used for 235
agarose gel (2%) detection. The triplicate PCR reactions for each sample were 236
combined and quantified with PicoGreen. Then equimolar amounts of the PCR product 237
were pooled together and purified with an AxyPrepDNA gel extraction kit (Axygen 238
Scientific, Union City, CA, USA). Sequencing was performed on 300PE Miseq 239
sequencer at the Majorbio Bio-Pharm Technology Co. Ltd. Shanghai, China. 240
2.5 Processing of molecular data 241
The sequences were trimmed, merged and assigned in QIIME v 1.7.0. Low quality 242
sequences (< 200bp in length with an average quality score < 20) were removed. After 243
removing the chimera, high quality sequences were clustered into Operational 244
Taxonomic Units (OTUs) at a 97% similarity. A representative sequence was aligned 245
using the Python Nearest Alignment Space Termination (PyNAST) against sequence 246
within the Sliver database for bacteria and Unite database for fungi. To correct for 247
sampling effects on diversity, sequence numbers of each sample were rarified to the 248
sample with the lowest number of reads (15000 reads for bacteria and 20000 reads for 249
fungi). 250
2.6 Statistical analysis 251

13
Four alpha-diversity indices, the number of OTUs, the Chao1 estimator of richness, 252
Shannon diversity, and Shannon evenness, were calculated in QIIIME (Caporaso et al., 253
2010). Significant differences among N-addition levels were tested separately for each 254
litter type by one-way analysis of variance (ANOVA) followed by a Tukey HSD test. 255
The relationships between alpha-diversity indices and litter quality parameters were 256
tested with a Spearman correlation analysis using SPSS 19.0. Bacterial and fungal 257
community composition was visualized by non-metric multidimensional scaling 258
(NMDS) plots based on the Bray Curtis similarity matrix. Adonis analysis was used to 259
determine whether bacterial and fungal community structure were significantly 260
influenced by N-addition level and litter type. The significance of the relationship 261
between community similarity and litter quality dissimilarity (Euclidean distance based 262
on nine litter quality parameters) for each litter type was analyzed using a Mantel test 263
(Spearman’s rank correlation). The Bray-Curtis similarity between samples, based on 264
OTUs, was used to compare the bacterial and fungal community similarity (1-Bray-265
Curtis distance). A distance-based RDA (db-RDA) was used to examine the effect of 266
each litter quality parameter on the bacterial and fungal community (based on OTUs 267
composition) in CANOCO Version 5.0 (Plant Research International, Wageningen, 268
The Netherlands). Two-way ANOVA was used to test the effects of litter type (mixed- 269
and single-species), N-addition level and their interaction on bacterial and fungal 270
phylogenetic taxa (Phylum, Class, Order and Family), litter quality and alpha diversity. 271
3. Results 272

14
3.1 Effect of N-addition on litter quality 273
Both litter type and N-addition rate significantly affected litter quality (Table S1 and 274
Fig. 1). The concentrations of total C and lignin, and the ratios of C/N, C/P, Lignin/N, 275
Lignin/P were higher in mixed-species litter than in single-species litter, whereas the 276
concentrations of total N and P were higher in single-species litter than in mixed-species 277
litter. For both single-species and mixed-species litters, the concentration of total N, P 278
and the ratio of N/P increased, and the ratios of C/N, C/P, Lignin/N and Lignin/P 279
decreased with increasing N-addition rates. There was no significant variation of total 280
C and lignin across different N-addition rates (Fig. 1). 281
3.2 Bacterial and fungal alpha-diversity 282
Neither N-addition rates nor litter type significantly affected bacterial alpha-diversity 283
(Fig. 2). Higher number of fungal OTUs, Chao1 estimator and diversity (H′) were 284
observed in soil with mixed-species litter than in soil with single-species litter, whereas 285
the Shannon evenness index was higher in soil with single-species litter (Fig. 2). N-286
addition significantly affected fungal diversity. For mixed-species litter, the Shannon 287
diversity of the fungal community slightly increased with increasing N-addition rates 288
and the number of fungal OTUs was positively correlated with the litter N/P ratio, and 289
negatively correlated with the C/N and Lignin/N ratios. The fungal Chao1 estimator 290
was negatively correlated with the Lignin/N ratio for mixed-species litter treatments. 291
For single-species litter, the number of fungal OTUs and the Chao1 estimator were 292
negatively correlated with the total C content of the litter, and the Shannon diversity 293

15
and evenness indices were negatively correlated with the C/N ratio (Table S2). For the 294
bacterial community, we only detected a significant negative correlation between the 295
Shannon evenness index and the total P of the litter in soil with single-species litter 296
(Table S2). 297
3.3 Bacterial and fungal composition 298
The NMDS plot revealed a clear separation between samples collected from mixed-299
species litter and single-species litter treatments (Fig. 3). The distribution of bacterial 300
communities was not clearly separated by N-addition rates (Fig. 3 a). Results from 301
Adonis analysis also showed that soil bacterial community composition was 302
significantly influenced by litter type (F=4.37, P<0.01), but not by N-addition rate 303
(F=1.60, P=0.17). 304
For fungal communities, the samples from the two types of litter were clearly 305
separated by the first axis of the NMDS plot, while the second axis differentiated the 306
samples with litter from low N-addition levels (N0 to N10) and higher N-addition levels 307
(N15 to N50) (Fig. 3b). Results from Adonis analysis showed that the fungal community 308
composition was significantly affected by N-addition rate (F=1.60, P<0.01) and litter 309
type (F=15.89, P<0.01). 310
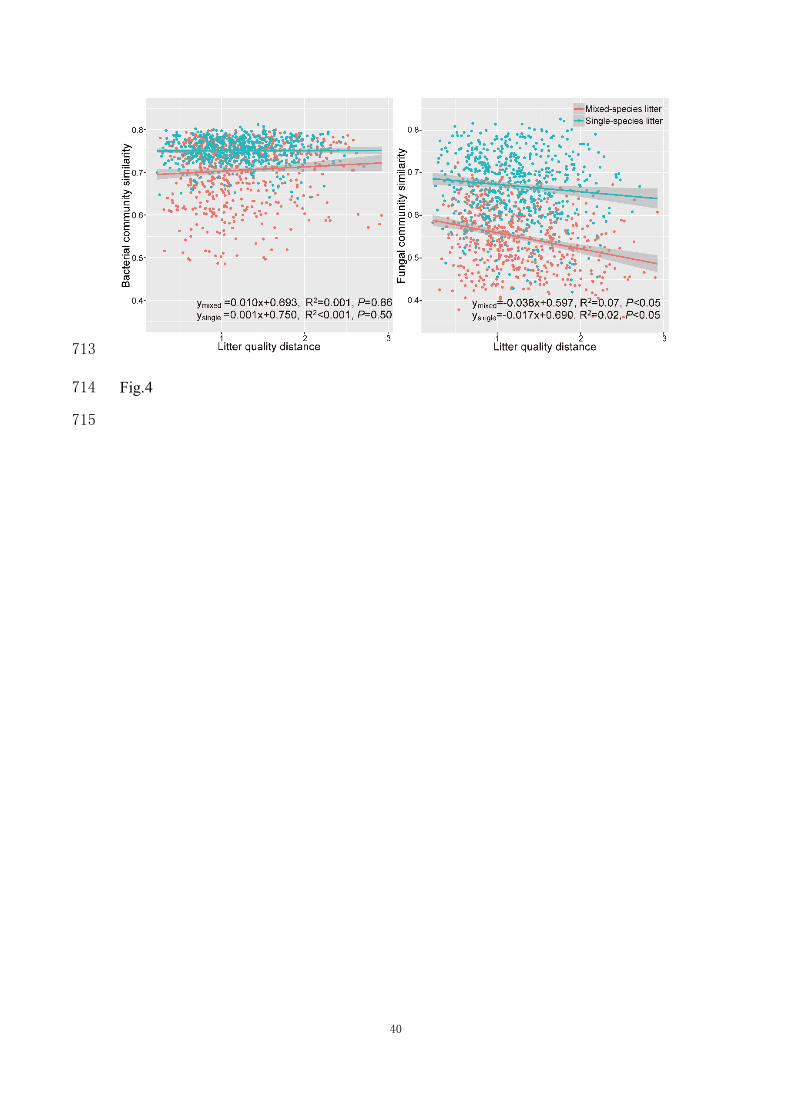
There was no relationship between similarity of bacterial communities and similarity 311
in litter quality (Fig. 4a). The similarity of the fungal communities was negatively 312
correlated with litter quality distance (Fig. 4b). Distance-based RDA analysis based on 313
OTUs composition indicated that bacterial communities in both litter types were not 314

16
related to the litter characteristics. In contrast, fungal communities for both types of 315
litter were significantly correlated with total N and total P, and the ratios of C/N, C/P 316
and N/P of the litter (Table 1). 317
Across all the treatments, the dominant bacterial phyla with relative abundance > 1% 318
were: Proteobacteria, Acidobacteria, Bacteroidetes, Actinobacteria, Planctomycetes, 319
Chloroflexi, Nitrospirae, and Gemmatimonadetes (Fig. 5a). The dominant fungi classes 320
(relative abundance > 1%) were: Zygomycota (incertae sedis), Sordariomycetes, 321
Dothideomycetes, Agaricomycetes and Eurotiomycetes (Fig 5b). None of the relative 322
abundances of phyla or classes taxa were affected by N-addition level for both bacteria 323
and fungi. At the order level, the relative abundance bacteria Nitrosomonadales, 324
Rhodospirillales and fungi Pleosporales were significantly affected by N-addition level 325
(Table 2). The relative abundance of Nitrosomonadales was higher in the mixed-species 326
litter treatments than in the single-species litter treatments (Fig. 5c). Conversely, the 327
relative abundance of Pleosporales was lower in mixed-species litter and increased with 328
increasing N-addition levels (Fig. 5d). The bacterial families Nitrosomonadaceae, 329
Oxalobacteraceae, Rhodospirillaceae and fungal families Pleosporaceae, 330
Hypocreaceae, Bionectriaceae were significantly affected by N-addition (Table 2). 331
Pearson’s coefficients revealed a significant correlation between those taxa and litter 332
quality properties (Fig S1). The relative abundance of order Nitrosomonadales and its 333
family Nitrosomonadaceae were negatively related to the litter N and P concentrations, 334
and positively correlated with litter C/N, C/P ratios and lignin content. Rhodospirillales 335

17
and Rhodospirillaceae were most closely related to litter lignin content. In contrast, the 336
fungal order Pleosporales and family Pleosporaceae were positively related to litter N 337
and P concentrations. Family Bionectriaceae was negatively related to litter lignin 338
content (Fig S1). 339
4. Discussion 340
4.1 Litter quality changed fungal diversity but not bacterial diversity 341
In agreement with our first hypothesis, our results showed that fungal diversity was 342
higher in soils with mixed-species litter than in soil with single-species litter. Mixed-343
species litter can improve the substrate heterogeneity and therefore create a more 344
complex and beneficial environment for decomposers (García-Palacios et al., 2013). 345
Further, litter species traits can physically change the litter surface area in diverse 346
mixtures and increase the number and diversity of microhabitats (Hector et al., 2000; 347
Pei et al., 2017). Our study emphasizes the importance of litter species characteristics 348
for fungal communities. A recent study in the same Long-term N addition experiment 349
found that the litter quality of seven dominant species was consistently increased with 350
N-addition rates (Hou et al., 2018). This suggests that the effects of N-addition via 351
changing litter quality on the soil microbial community, that we observed in our single-352
species treatment, which unfortunately due to practical reasons could only be done with 353
one plant species, may be extrapolated to other grassland species. However, further 354
studies are needed to confirm the generality of litter changes via N-addition effects on 355
soil microbial communities. Theoretically, fungi are more strongly influenced by 356

18
substrate quality than substrate heterogeneity (Cadisch and Giller, 1997). In this study, 357
N-addition slightly increased the fungal Shannon index, only in the mixed-species litter 358
treatments. Our results show that fungal alpha-diversity appears to be more sensitive to 359
the litter heterogeneity by mixing species than to the litter quality changed by N-360
addition. 361
Fungal community similarity (beta-diversity) was significantly correlated with litter 362
quality distance in both litter type treatments, and the sampling points in the fungal 363
ordination plot, clearly separated between the low and high levels of N-addition in both 364
litter treatments. This confirms that heterogeneity in litter quality alters the composition 365
of the fungal community. Fungal beta-diversity, generally, is strongly related to the less 366
abundant operational taxonomic units (OTUs) in the community (Carvalho et al., 2016). 367
Therefore, changes in litter quality induced by long-term N-addition may have a greater 368
impact on rare than on dominant species in the fungal community. Our results show 369
that changes in litter quality can evoke bottom-up effects in the fungal community. 370
Fungi are key players during litter decomposition due to their ability to degrade 371
recalcitrant compounds such as lignin and cellulose with extracellular enzymes 372
(Schneider et al., 2012). Further studies should examine how N-driven changes in 373
fungal community composition influence ecosystem processes. 374
We found that bacterial diversity did not change in response to variation of litter 375
quality and litter species composition. How bacteria respond to litter quality is poorly 376
understood, although some studies have shown a relationship with changes in litter 377

19
quality during decomposition (Cadisch and Giller, 1997; Dilly et al., 2004). It is 378
generally considered that bacteria are more sensitive than fungi to alteration of nutrient 379
availability because they have much shorter turnover times than fungi and react faster 380
to changes in soil nutrients (Yin et al., 2010). In our study, the relatively short duration 381
of litter decomposition may have limited effects on soil nutrients. Sun et al. (2015) 382
found that incorporation of wheat straw into soil did not change the composition of 383
bacterial communities. Furthermore, bacterial populations are largely regulated by 384
predation, and this implies that the nature of resources that are available will less likely 385
affect bacterial communities (Wardle et al., 1995; Cadisch and Giller, 1997). Although 386
bacterial community composition did not change significantly during the initial stages 387
of decomposition, in the longer term, litter quality may still influence bacterial 388
communities (Keiser et al., 2011; Kaiser et al., 2014). Decomposer communities can be 389
specialized to break down the locally available plant litter, leading to a ʻhome-field 390
advantage (HFA)’ effect (Ayres et al., 2009; Keiser et al., 2013). Recently we showed 391
that long-term N-deposition in grasslands influenced litter HFA effects and that these 392
effects differed between single-species and mixed-species litters (Li et al., 2017). The 393
substantial changes in fungal communities but not in bacterial communities, as found 394
in this study, imply that fungi may play important roles in these HFA effects during the 395
initial stage of decomposition. 396
4.2 Effect of litter quality on bacterial and fungal community composition 397

20
There are many mechanisms for the responses of microbial decomposer to the large 398
complexity and variability of substrates quality (Fanin et al., 2013; Mooshammer et al., 399
2014), such as adjust extracellular enzymes production (Sinsabaugh et al., 2008; 400
Moorhead et al., 2012) and element use efficiencies (Manzoni et al., 2012; Kaiser et al., 401
2014). In addition, hyphae of saprophytic fungi have been shown to often extend 402
beyond the resource that they decompose (Strickland and Rousk, 2010) and to mediate 403
nutrient import from poor-nutrient patches to rich-nutrient patches (Chigineva et al., 404
2011). Saprophytic fungi thereby can facilitate decomposition by supporting bacterial 405
decomposer communities at site where elements are lack. We observed a significant 406
increase in the relative abundance of Pleosporales, the largest order in the fungal class 407
Dothideomycetes. Most of these species are saprobes and live on decaying plant 408
material (Zhang et al., 2009). The increase in saprophytic fungi supports the important 409
role of fungi in decomposition processes, especially in the decomposition of high-410
quality litter. 411
Bacteria belonging to the family Nitrosomonadaceae were negatively correlated with 412
litter N contents. Members of the genus Nitrosomonas oxidize ammonia to nitrite, a 413
process known as nitrification. The majority of the N-demand in an ecosystem is met 414
via internal N recycling through litter decomposition, mineralization, and assimilation 415
(Likens, 2013). Increased litter N content inputs would increase soil N pool and 416
associated rates of soil N transformations and availability (Wieder et al., 2013). Thus, 417
increasing N availability via litter inputs could also increase the abundance of 418

21
ammonia-oxidizing bacteria, and accelerate NO3- production. Unexpectedly, our results 419
did not support our third hypothesis. Wieder et al. (2013) reported that doubling leaf 420
litter inputs into the soil decreased the gross nitrification rates, and the relative 421
abundance of ammonia-oxidizing microorganisms. Augmenting litter N-inputs to soil 422
exacerbated the stoichiometric imbalance between microbes and their resources 423
(Mooshammer et al., 2014). Furthermore, ammonia-oxidizing bacteria are generally 424
worse competitors for amonia than heterotrophic microbes (Gerards et al., 1998). This 425
may explain why the relative abundance of Nitrosomonadaceae was lower in high N-426
addition treatments. Ammonia-oxidizing bacteria play an essential role in nitrogen 427
transformation and related processes during litter decomposition (Carey et al., 2016). 428
The decreased relative abundance of Nitrosomonadaceae suggests that the 429
biogeochemical consequences of N-deposition in grasslands may be influenced by the 430
quality of the litter that is produced and its effect on bacterial-mediated ecosystem 431
functions. 432
5. Conclusions 433
Our study shows that changes in litter quality following N-deposition alters soil fungal 434
community diversity in our grassland soils but that it had no significant impacts on soil 435
bacterial diversity. Our results, therefore, suggest that changes in litter quality and 436
species composition can drive specialization in fungal communities, at least at the initial 437
stage of decomposition. Increased saprophytic fungi and decreased ammonia-oxidizing 438
bacteria with the enhancement of litter quality suggest that N-deposition via its effects 439

22
on plant composition and nutritional quality, can also impact ecosystem functions such 440
as decomposition through litter quality mediated changes in the microbial community. 441
This may have a profound influence on the biogeochemical cycling in terrestrial 442
ecosystems. 443
444
Acknowledgements 445
This research was supported by Strategic Priority Research Program of the Chinese 446
Academy of Sciences (XDB15010402), the National Natural Science Foundation of 447
China (31570519, 3143000565, and 31400370), the Chinese Academy of Sciences 448
Visiting Professorship Program for Senior International Scientists ( 2017VCA0004) 449
and Youth Innovation Promotion Association CAS (2014174). 450
451
References 452
Aerts, R., 1997. Climate, leaf litter chemistry and leaf litter decomposition in terrestrial 453
ecosystems: A triangular relationship. Oikos 79, 439–449. 454
Ayres, E., Steltzer, H., Simmons, B.L., Simpson, R.T., Steinweg, J.M., Wallenstein, 455
M.D., Mellor, N., Parton, W.J., Moore, J.C., Wall, D.H., 2009. Home-field 456
advantage accelerates leaf litter decomposition in forests. Soil Biology & 457
Biochemistry 41, 606–610. 458
Bai, Y., Wu, J., Clark, C.M., Naeem, S., Pan, Q., Huang, J., Zhang, L., Han, X., 2010. 459
Tradeoffs and thresholds in the effects of nitrogen addition on biodiversity and 460

23
ecosystem functioning: evidence from inner Mongolia Grasslands. Global Change 461
Biology 16, 358–372. 462
Bardgett, R.D., Wardle, D.A., 2010. Aboveground-Belowground Linkages: Biotic 463
Interactions, Ecosystem Processes, and Global Change. Oxford University Press, 464
Oxford. 465
Bobbink, R., Hicks, K., Galloway, J., Spranger, T., Alkemade, R., Ashmore, M., 466
Bustamante, M., Cinderby, S., Davidson, E., Dentener, F., Emmett, B., Erisman, J., 467
Fenn, M., Gilliam, F., Nordin, A., Pardo, L., de Vries, W., 2010. Global assessment 468
of nitrogen deposition effects on terrestrial plant diversity: a synthesis. Ecological 469
Applications 20, 30–59. 470
Brown, M.E., Chang, M.C.Y., 2014. Exploring bacterial lignin degradation. Current 471
Opinion in Chemical Biology 19, 1–7. 472
Bugg, T.D.H., Ahmad, M., Hardiman, E.M., Singh, R., 2011. The emerging role for 473
bacteria in lignin degradation and bio-product formation. Current Opinion in 474
Biotechnology 22, 394–400. 475
Cadisch, G., Giller, K.E., 1997. Driven by Nature: Plant Litter Quality and 476
Decomposition. CABI Publishing, Wallingford. 477
Caporaso, J.G., Kuczynski, J., Stombaugh, J., Bittinger, K., Bushman, F.D., Costello, 478
E.K., Fierer, N., Pena, A.G., Goodrich, J.K., Gordon, J.I., Huttley, G.A., Kelley, S.T., 479
Knights, D., Koenig, J.E., Ley, R.E., Lozupone, C.A., McDonald, D., Muegge, B.D., 480
Pirrung, M., Reeder, J., Sevinsky, J.R., Tumbaugh, P.J., Walters, W.A., Widmann, 481
24
J., Yatsunenko, T., Zaneveld, J., Knight, R., 2010. QIIME allows analysis of high-482
throughput community sequencing data. Nature Methods 7, 335–336. 483
Carey, C.J., Dove, N.C., Beman, J.M., Hart, S.C., Aronson, E.L., 2016. Meta-analysis 484
reveals ammonia-oxidizing bacteria respond more strongly to nitrogen addition than 485
ammonia-oxidizing archaea. Soil Biology & Biochemistry 99, 158–166. 486
Chigineva, N.I., Aleksandrova, A.V., Marhan, S., Kandeler, E., Tiunov, A.V., 2011. 487
The importance of mycelial connection at the soil–litter interface for nutrient 488
translocation, enzyme activity and litter decomposition. Applied Soil Ecology 51, 489
35–41. 490
Carvalho, T.S., Jesus, E.d., Barlow, J., Gardner, T.A., Soares, I.C., Tiedje, J.M., 491
Moreira, F.M., 2016. Land use intensification in the humid tropics increased both 492
alpha and beta diversity of soil bacteria. Ecology 97, 2760–2771. 493
de Boer, W., Folman, L.B., Summerbell, R.C., Boddy, L., 2005. Living in a fungal 494
world: impact of fungi on soil bacterial niche development. FEMS Microbiology 495
Reviews 29, 795–811. 496
Dilly, O., Bloem, J., Vos, A., Munch, J.C., 2004. Bacterial diversity in agricultural soils 497
during litter decomposition. Applied and Environmental Microbiology 70, 468–474. 498
Elser, J.J., Bracken, M.E., Cleland, E.E., Gruner, D.S., Harpole, W.S., Hillebrand, H., 499
Ngai, J.T., Seabloom, E.W., Shurin, J.B., Smith, J.E., 2007. Global analysis of 500
nitrogen and phosphorus limitation of primary producers in freshwater, marine and 501
terrestrial ecosystems. Ecology Letters 10, 1135–1142. 502
25
Fanin, N., Fromin, N., Buatois, B., Hättenschwiler, S., 2013. An experimental test of 503
the hypothesis of non-homeostatic consumer stoichiometry in a plant litter–microbe 504
system. Ecology Letters 16, 764–772. 505
Fukami, T., Dickie, I.A., Paula Wilkie, J., Paulus, B.C., Park, D., Roberts, A., Buchanan, 506
P.K., Allen, R.B., 2010. Assembly history dictates ecosystem functioning: evidence 507
from wood decomposer communities. Ecology Letters 13, 675–684. 508
Galloway, J.N., Townsend, A.R., Erisman, J.W., Bekunda, M., Cai, Z., Freney, J.R., 509
Martinelli, L.A., Seitzinger, S.P., Sutton, M.A., 2008. Transformation of the 510
nitrogen cycle: recent trends, questions, and potential solutions. Science 320, 889–511
892. 512
García-Palacios, P., Maestre, F.T., Kattge, J., Wall, D.H., 2013. Climate and litter 513
quality differently modulate the effects of soil fauna on litter decomposition across 514
biomes. Ecology Letters 16, 1045–1053. 515
Gerards, S., Duyts, H., Laanbroek, H.J., 1998. Ammonium-induced inhibition of 516
ammonium-starved Nitrosomonas europaea cells in soil and sand slurries. FEMS 517
Microbiology Ecology 26, 269–280. 518
Gruber, N., Galloway, J.N., 2008. An Earth-system perspective of the global nitrogen 519
cycle. Nature 451, 293–296. 520
Güsewell, S., Gessner, M.O., 2009. N: P ratios influence litter decomposition and 521
colonization by fungi and bacteria in microcosms. Functional Ecology 23, 211–219. 522

26
Hättenschwiler, S., Fromin, N., Barantal, S., 2011. Functional diversity of terrestrial 523
microbial decomposers and their substrates. Comptes Rendus Biologies 334, 393–524
402. 525
Hättenschwiler, S., Tiunov, A.V., Scheu, S., 2005. Biodiversity and litter 526
decomposition in terrestrial ecosystems. Annual Review of Ecology, Evolution, and 527
Systematics 36, 191–218. 528
Han, X., Sistla, S.A., Zhang, Y., Lü, X., Han, X., 2014. Hierarchical responses of plant 529
stoichiometry to nitrogen deposition and mowing in a temperate steppe. Plant and 530
Soil 382, 175–187. 531
Hector, A., Beale, A.J., Minns, A., Otway, S.J., Lawton, J.H., 2000. Consequences of 532
the reduction of plant diversity for litter decomposition: effects through litter quality 533
and microenvironment. Oikos 90, 357–371. 534
Henry, H.A., Cleland, E.E., Field, C.B., Vitousek, P.M., 2005. Interactive effects of 535
elevated CO2, N deposition and climate change on plant litter quality in a California 536
annual grassland. Oecologia 142, 465–473. 537
Hobbie, S.E., 2005. Contrasting effects of substrate and fertilizer nitrogen on the early 538
stages of litter decomposition. Ecosystems 8, 644–656. 539
Hooper, D.U., Bignell, D.E., Brown, V.K., Brussard, L., Dangerfield, J.M., Wall, D.H., 540
Wardle, D.A., Coleman, D.C., Giller, K.E., Lavelle, P., van Der Putten, W.H., de 541
Ruiter, P.C., Rusek, J., Silver, W.L., Tiedje, J.M., Wolters, V., 2000. Interactions 542
between Aboveground and Belowground Biodiversity in Terrestrial Ecosystems: 543

27
Patterns, Mechanisms, and Feedbacks: We assess the evidence for correlation 544
between aboveground and belowground diversity and conclude that a variety of 545
mechanisms could lead to positive, negative, or no relationship–depending on the 546
strength and type of interactions among species. BioScience 50, 1049–1061. 547
Hou, S., Freschet, G.T., Yang, J., Zhang, Y., Yin, J., Hu, Y., Wei, H., Han, X., Lü, X., 548
2018. Quantifying the indirect effects of nitrogen deposition on grassland litter 549
chemical traits. Biogeochemistry 139, 261–273. 550
Hu, Y., Wang, S., Zeng, D., 2006. Effects of single Chinese fir and mixed leaf litters 551
on soil chemical, microbial properties and soil enzyme activities. Plant and Soil 282, 552
379–386. 553
Keiblinger, K.M., Hall, E.K., Wanek, W., Szukics, U., Hämmerle, I., Ellersdorfer, G., 554
Böck, S., Strauss, J., Sterflinger, K., Richter, A., 2010. The effect of resource 555
quantity and resource stoichiometry on microbial carbon-use-efficiency. FEMS 556
Microbiology Ecology 73, 430–440. 557
Kaiser, C., Franklin, O., Dieckmann, U., Richter, A., 2014. Microbial community 558
dynamics alleviate stoichiometric constraints during litter decay. Ecology Letters 17, 559
680–690. 560
Keiser, A.D., Knoepp, J.D., Bradford, M.A., 2013. Microbial communities may modify 561
how litter quality affects potential decomposition rates as tree species migrate. Plant 562
and Soil 372, 167–176. 563

28
Keiser, A.D., Strickland, M.S., Fierer, N., Bradford, M.A., 2011. The effect of resource 564
history on the functioning of soil microbial communities is maintained across time. 565
Biogeosciences 8, 1477–1486. 566
Knorr, M., Frey, S.D., Curtis, P.S., 2005. Nitrogen additions and litter decomposition: 567
a meta-analysis. Ecology 86, 3252–3257. 568
Leite, M.F., Pan, Y., Bloem, J., ten Berge, H., Kuramae, E.E., 2017. Organic nitrogen 569
rearranges both structure and activity of the soil-borne microbial seedbank. 570
Scientific Reports 7, 42634. 571
Likens, G.E., 2013. Biogeochemistry of a Forested Ecosystem, 3nd edn. Springer, New 572
York. 573
Li, Y., Li, Q., Yang, J., Lü, X., Liang, W., Han, X., Bezemer, T.M., 2017. Home-field 574
advantages of litter decomposition increase with increasing N deposition rates: a 575
litter and soil perspective. Functional Ecology 31, 1792–1801. 576
Loreau, M., 2001. Microbial diversity, producer–decomposer interactions and 577
ecosystem processes: a theoretical model. Proceedings of the Royal Society of 578
London. Series B: Biological Sciences 268, 303–309. 579
Lue, C., Tian, H., 2007. Spatial and temporal patterns of nitrogen deposition in China: 580
Synthesis of observational data. Journal of Geophysical Research: Atmospheres 112, 581
2156–2202. 582
29
Manzoni, S., Taylor, P., Richter, A., Porporato, A., Ågren, G.I., 2012. Environmental 583
and stoichiometric controls on microbial carbon-use efficiency in soils. New 584
Phytologist 196, 79–91. 585
McGuire, K.L., Bent, E., Borneman, J., Majumder, A., Allison, S.D., Treseder, K.K., 586
2010. Functional diversity in resource use by fungi. Ecology 91, 2324–2332. 587
Moorhead, D.L., Lashermes, G., Sinsabaugh, R.L., 2012. A theoretical model of C- and 588
N-acquiring exoenzyme activities, which balances microbial demands during 589
decomposition. Soil Biology & Biochemistry 53, 133–141. 590
Mooshammer, M., Wanek, W., Zechmeister-Boltenstern, S., Richter, A., 2014. 591
Stoichiometric imbalances between terrestrial decomposer communities and their 592
resources: mechanisms and implications of microbial adaptations to their resources. 593
Frontiers in Microbiology 5, 22. 594
Naeem, S., Hahn, D.R., Schuurman, G., 2000. Producer–decomposer co-dependency 595
influences biodiversity effects. Nature 403, 762–764. 596
Nannipieri, P., Ascher, J., Ceccherini, M.T, Landi, L., Pietramellara, G., Renella, G., 597
2003. Microbial diversity and soil functions. European Journal of Soil Science 54, 598
655–670. 599
Nielsen, U.N., Ayres, E., Wall, D.H., Bardgett, R.D., 2010. Soil biodiversity and carbon 600
cycling: a review and synthesis of studies examining diversity–function 601
relationships. European Journal of Soil Science 62, 105–116. 602

30
Pei, Z., Leppert, K.N., Eichenberg, D., Bruelheide, H., Niklaus, P.A., Buscot, F., 603
Gutknecht, J.L., 2017. Leaf litter diversity alters microbial activity, microbial 604
abundances, and nutrient cycling in a subtropical forest ecosystem. Biogeochemistry 605
134, 163–181. 606
Pierik, M., van Ruijven, J., Bezemer, T.M., Geerts, R.H., Berendse, F., 2011. Recovery 607
of plant species richness during long-term fertilization of a species-rich grassland. 608
Ecology 92, 1393–1398. 609
Schneider, T., Keiblinger, K.M., Schmid, E., Sterflinger-Gleixner, K., Ellersdorfer, G., 610
Roschitzki, B., Richter, A., Eberl, L., Zechmeister-Boltenstern, S., Riedel, K., 2012. 611
Who is who in litter decomposition? Metaproteomics reveals major microbial 612
players and their biogeochemical functions. The ISME Journal 6, 1749–1762. 613
Shihan, A., Hattenschwiler, S., Milcu, A., Joly, F.X., Santonja, M., Fromin, N., 2017. 614
Changes in soil microbial substrate utilization in response to altered litter diversity 615
and precipitation in a Mediterranean shrubland. Biology and Fertility of Soils 53, 616
171–185. 617
Sinsabaugh, R.L., Lauber, C.L., Weintraub, M.N., Ahmed, B., Allison, S.D., Crenshaw, 618
C., Contosta, A.R., Cusack, D., Frey, S., Gallo, M.E., Gartner, T.B., Hobbie, S.E., 619
Holland, K., Keeler, B.L., Powers, J.S., Stursova, M., Takacs-Vesbach, C., Waldrop, 620
M.P., Wallenstein, M.D., Zak, D.R., Zeglin, L.H., 2008. Stoichiometry of soil 621
enzyme activity at global scale. Ecology Letters 11, 1252–1264. 622

31
Six, J., Frey, S.D., Thiet, R.K., Batten, K.M., 2006. Bacterial and fungal contributions 623
to carbon sequestration in agroecosystems. Soil Science Society of America Journal 624
70, 555–569. 625
Strickland, M.S., Lauber, C., Fierer, N., Bradford, M.A., 2009. Testing the functional 626
significance of microbial community composition. Ecology 90, 441–451. 627
Strickland, M.S., Rousk, J., 2010. Considering fungal:bacterial dominance in soils–628
Methods, controls, and ecosystem implications. Soil Biology & Biochemistry 42, 629
1385–1395. 630
Song, Z., Vail, A., Sadowsky, M.J., Schilling, J.S., 2012. Competition between two 631
wood-degrading fungi with distinct influences on residues. FEMS Microbiology 632
Ecology 79, 109–117. 633
Sun, R., Zhang, X., Guo, X., Wang, D., Chu, H., 2015. Bacterial diversity in soils 634
subjected to long-term chemical fertilization can be more stably maintained with the 635
addition of livestock manure than wheat straw. Soil Biology & Biochemistry 88, 9–636
18. 637
Szanser, M., Ilieva-Makulec, K., Kajak, A., Górska, E., Kusińska, A., Kisiel, M., 638
Olejniczak, I., Russel, S., Sieminiak, D., Wojewoda, D., 2011. Impact of litter 639
species diversity on decomposition processes and communities of soil organisms. 640
Soil Biology & Biochemistry 43, 9–19. 641

32
van der Heijden, M.G., Bardgett, R.D., van Straalen, N.M., 2008. The unseen majority: 642
soil microbes as drivers of plant diversity and productivity in terrestrial ecosystems. 643
Ecology Letters 11, 296–310. 644
van der Wal, A., Geydan, T.D., Kuyper, T.W., de Boer, W., 2013. A thready affair: 645
linking fungal diversity and community dynamics to terrestrial decomposition 646
processes. FEMS Microbiology Reviews 37, 477–494. 647
Wardle, D.A., Yeates, G.W., Watson, R.N., Nicholson, K.S., 1995. Development of the 648
decomposer food-web, trophic relationships, and ecosystem properties during a 649
three-year primary succession in sawdust. Oikos 73, 155–166. 650
Wieder, W.R., Cleveland, C.C., Taylor, P.G., Nemergut, D.R., Hinckley, E.L., 651
Philippot, L., Bru, D., Weintraub, S.R., Martin, M., Townsend, A.R., 2013. 652
Experimental removal and addition of leaf litter inputs reduces nitrate production 653
and loss in a lowland tropical forest. Biogeochemistry 113, 629–642. 654
Yin, C., Jones, K.L., Peterson, D.E., Garrett, K.A., Hulbert, S.H., Paulitz, T.C., 2010. 655
Members of soil bacterial communities sensitive to tillage and crop rotation. Soil 656
Biology & Biochemistry 42, 2111–2118. 657
Zak, D.R., Holmes, W.E., White, D.C., Peacock, A.D., Tilman, D., 2003. Plant 658
diversity, soil microbial communities, and ecosystem function: are there any links? 659
Ecology 84, 2042–2050. 660

33
Zhang, D., Hui, D., Luo, Y., Zhou, G., 2008. Rates of litter decomposition in terrestrial 661
ecosystems: global patterns and controlling factors. Journal of Plant Ecology 1, 85–662
93. 663
Zhang, Y., Han, X., He, N., Long, M., Huang, J., Zhang, G., Wang, Q., Han, X., 2014a. 664
Increase in ammonia volatilization from soil in response to N deposition in Inner 665
Mongolia grasslands. Atmospheric Environment 84, 156–162. 666
Zhang, Y., Lu, X., Isbell, F., Stevens, C., Han, X., He, N., Zhang, G., Yu, Q., Huang, 667
J., Han, X., 2014b. Rapid plant species loss at high rates and at low frequency of N 668
addition in temperate steppe. Global Change Biology 20, 3520–3529. 669
Zhang, Y., Schoch, C.L., Fournier, J., Crous, P.W., de Gruyter, J., Woudenberg, J.H.C., 670
Hirayama, K., Tanaka, K., Pointing, S.B., Spatafora, J.W., Hyde K.D., 2009. Multi-671
locus phylogeny of Pleosporales: a taxonomic, ecological and evolutionary re-672
evaluation. Studies in Mycology 64, 85–102. 673
Zhang, Y., Wang, J., Stevens, C.J., Lü, X., He, N., Wang, C., Han, X., 2017. Effects of 674
the frequency and the rate of N enrichment on community structure in a temperate 675
grassland. Journal of Plant Ecology 11, 685–695. 676

34
Table. 1 The influence of litter chemical characters on bacterial and fungal community 677
determined by distance-based redundancy analysis (Bray-Curtis distance). 678
Litter
Bacterial community Fungal community
Mixed-species litter Single-species litter Mixed-species litter Single-species litter
Explained % P Explained % P Explained % P Explained % P
TC 2.3 0.41 4.1 0.23 1.4 0.80 4.0 0.40
TN 4.7 0.16 5.0 0.17 16.1 <0.01 16.8 <0.01
TP 3.1 0.31 5.8 0.13 9.0 0.02 12.0 <0.01
C:N 4.4 0.23 5.0 0.17 16.1 <0.01 17.4 <0.01
C:P 2.9 0.38 5.5 0.13 9.9 <0.01 11.7 <0.01
N:P 2.1 0.47 0.4 0.95 9.4 0.01 10.1 0.01
Lignin 2.1 0.49 2.0 0.54 7.2 0.06 2.9 0.40
Lignin:N 2.4 0.43 1.9 0.64 8.2 0.04 7.2 0.05
Lignin:P 2.0 0.48 3.0 0.36 3.6 0.34 3.4 0.32
Total 23.3 0.62 25.3 0.54 39.7 0.02 37.5 0.03
679

35
Table. 2 Two-way ANOVAs (F- and P values) of the effect of litter type (L), nitrogen 680
addition (N) on bacterial and fungal order and family. Only those with significant N 681
effects are presented. 682
Taxa L N L×N
F P F P F P
Bacteria Order Nitrosomonadales 21.29 <0.001 3.06 0.02 0.79 0.58
Rhodospirillales 7.76 0.01 3.56 0.01 1.03 0.43
Family Nitrosomonadaceae 21.29 <0.001 3.06 0.02 0.79 0.58
Oxalobacteraceae 3.48 0.08 4.58 <0.01 0.98 0.46
Rhodospirillaceae 5.55 0.03 3.35 0.02 1.55 0.21
Fungi Order Pleosporales 14.33 <0.01 4.27 <0.01 0.53 0.78
Family Pleosporaceae 49.77 <0.001 2.73 0.04 0.73 0.63
Hypocreaceae 8.19 <0.01 5.79 <0.01 6.54 <0.001
Bionectriaceae 20.26 <0.001 6.89 <0.001 1.37 0.27
683

36
Figure legend 684
Fig. 1 Effects of nitrogen addition (0, 2, 5, 10, 15, 20, 50 g N m-2 year -1) and litter type 685
(Mix, mixed-species litter; Mono, single-species litter) on litter stoichiometry. Data are 686
shown as mean ± 1 SE. R2 and P values are from a Pearson correlation analysis. 687
Fig. 2 Effects of nitrogen addition and litter type (Mix, mixed-species litter; Mono, 688
single-species litter) on bacterial and fungal alpha-diversity. Error bars indicate ± 1 SE. 689
P- values from a two-way ANOVA on the effects of the litter type (L) and nitrogen (N) 690
are also presented. 691
Fig. 3 Nonmetric multidimensional scaling (NMDS) ordination of the bacterial and 692
fungal community composition. Communities are compared using Bray-Curtis distance 693
similarities based on the abundance of OTUs. 694
Fig. 4 Correlation between bacterial and fungal community similarity (Bray Curtis) and 695
litter quality similarity (Euclidean distance). 696
Fig. 5 Mean relative abundance of dominant (a) bacterial phyla across different nitrogen 697
additions and (b) fungal classes for the two litter types and the different nitrogen 698
addition levels. Lower pannels present box charts showing the relative abundance of 699
the order (c) Nitrosomonadales and (d) Pleosporales for the two litter types and the 700
different nitrogen addition treatments. 701
702
703

37
704
Fig.1 705
706

38
707
Fig.2 708
709

39
710
Fig.3 711
712
40
713
Fig.4 714
715

41
716
Fig.5 717