changes in measurement of savings: perspectives from a consumer (of na data)
DESCRIPTION
Changes in measurement of savings: Perspectives from a consumer (of NA data). Alain de Serres* OECD Florian Pelgrin * Bank of Canada. * Personal views, not to be attributed to the OECD or Bank of Canada. Motivation for adjusting saving rates: cross-section dimension. - PowerPoint PPT PresentationTRANSCRIPT
Changes in measurement of savings: Perspectives from a consumer (of NA
data)
Alain de Serres*
OECD
Florian Pelgrin *
Bank of Canada
* Personal views, not to be attributed to the OECD or Bank of Canada.

Motivation for adjusting saving rates: cross-section dimension
Direct international comparability of saving levels: cross-sectional dimension Large cross-country differences in saving
rates not fully understood May reflect institutional rather than
differences in behaviour or preferences May matter for investment, productive
capacity, growth

3
How to deal with the problems in panel data analysis
Use country-specific constant terms to control for cross-country institutional or measurement differences (SFE):
works only if differences remain more or less constant over time
could results in biased estimates and misleading conclusions

Motivation for adjusting saving rates: time series dimension
Properly identify the behavioural response of private agents to changes in economic incentives (relative prices, taxes, income, etc.)
Change in a potential determinant of saving over time may induce shift in measured saving even in absence of behavioural response re-valuation of financial assets may exaggerate
wealth effects
5
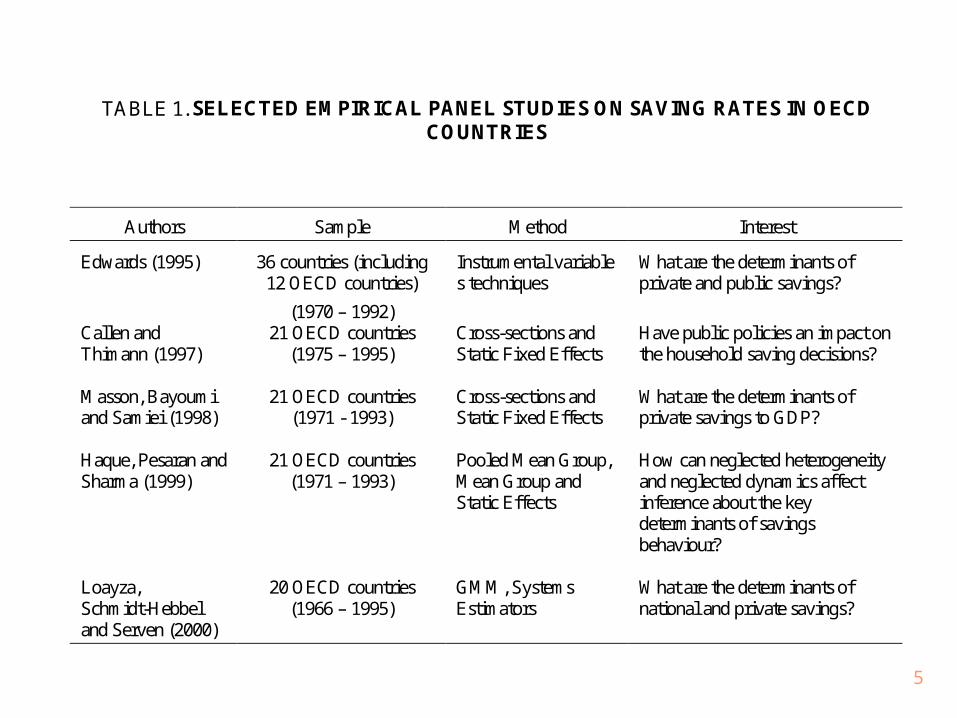
TABLE 1. SELECTED EMPIRICAL PANEL STUDIES ON SAVING RATES IN OECDCOUNTRIES
Authors Sample Method Interest
Edwards (1995) 36 countries (including12 OECD countries)
(1970 – 1992)
Instrumental variables techniques
What are the determinants ofprivate and public savings?
Callen andThimann (1997)
21 OECD countries(1975 – 1995)
Cross-sections andStatic Fixed Effects
Have public policies an impact onthe household saving decisions?
Masson, Bayoumiand Samiei (1998)
21 OECD countries(1971 - 1993)
Cross-sections andStatic Fixed Effects
What are the determinants ofprivate savings to GDP?
Haque, Pesaran andSharma (1999)
21 OECD countries(1971 – 1993)
Pooled Mean Group,Mean Group andStatic Effects
How can neglected heterogeneityand neglected dynamics affectinference about the keydeterminants of savingsbehaviour?
Loayza,Schmidt-Hebbeland Serven (2000)
20 OECD countries(1966 – 1995)
GMM, SystemsEstimators
What are the determinants ofnational and private savings?

6
Adjustments discussed / proposed
INSEE paper: individually identifiable consumption indirect taxes pension saving consumption of fixed capital consumer durables

7
Adjustments discussed / proposed
BEA paper: Defined benefit pension plans Inflation Taxation of capital gains consumer durables

8
Two complementary sets of adjusted series for US personal saving rates
Study by OFCE on comparison of saving rates between US and France (Baudchon and Chauvin, 1999)
BEA study (Perozek and Reinsdorf, 2002)

9
Broad motives for household saving
Retirement and bequests (LCH) Smooth consumption over time (LCH
or PIH) Unexpected loss of income
(precautionary) Financing of large lifetime
expenditures (Durables?)

10
Basic determinants in empirical work
government gross / net saving ratio net public transfers to households growth in GDP per capita old-age dependency ratio real interest rate inflation financial and non-financial wealth
11
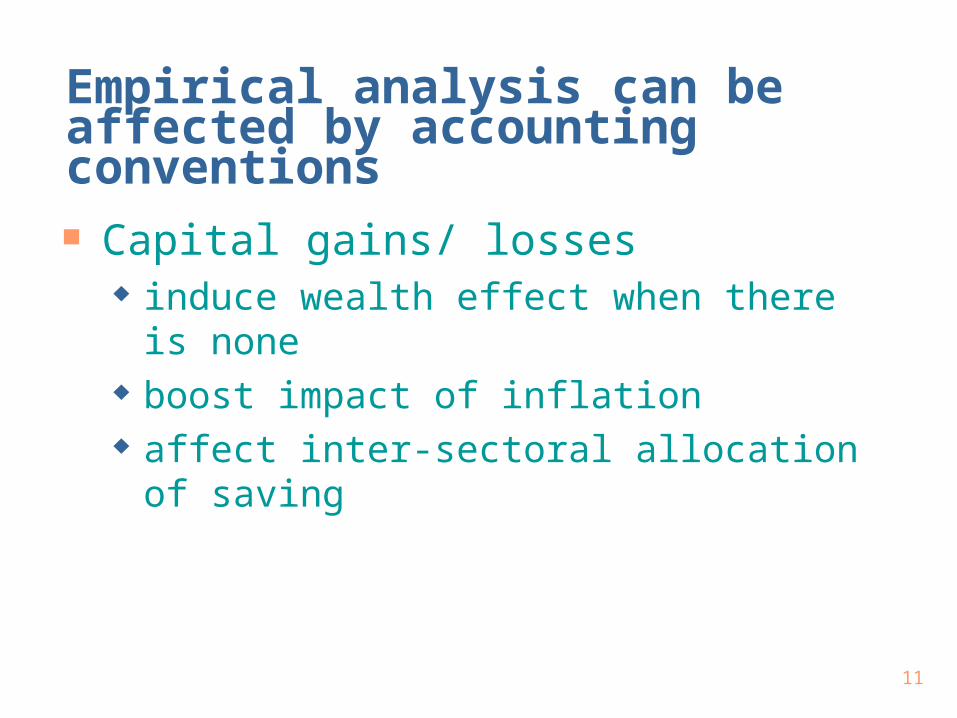
Empirical analysis can be affected by accounting conventions
Capital gains/ losses induce wealth effect when there is none boost impact of inflation affect inter-sectoral allocation of saving

12
Table 1 A. Effects of adjustment on long-run parametersOFCE adjustments
Variables NIPA DEPRECIATION PUBLIC GOODSCONSUMPTION
INDIRECT TAXES
Public saving -0.350**(0.139)
-0.342**(0.144)
-0.312**(0.133)
-0.360**(0.153)
Net transfers -0.956***(0.246)
-0.850***(0.254)
-0.792***(0.235)
-0.937***(0.271)
Inflation rate 0.604***(0.108)
0.646***(0.111)
0.589***(0.102)
0.692***(0.118)
Real interest rate 0.198**(0.077)
0.229***(0.079)
0.222***(0.073)
0.246***(0.084)
Net financial wealth -0.014**(0.007)
-0.015**(0.007)
-0.014**(0.006)
-0.015*(0.007)
Net non financial wealth -0.061***(0.013)
-0.051***(0.014)
-0.045***(0.012)
-0.058***(0.014)
Growth in GDP percapita
----- ------ ------- ------
MemorandumAdjusted R-square 0.90 0.90 0.90 0.90Durbin-Watson 1.66 1.63 1.63 1.61

13
TABLE 1 B. Effect of adjustment on long-run parameterBEA adjustments
Variables NIPA CAPITAL GAINS DEFINED BENEFITPENSION
INFLATION
Public saving -0.350**(0.139)
-0.426***(0.151)
-0.390**(0.153)
-0.320*(0.171)
Net transfers -0.956***(0.246)
-1.040***(0.268)
-0.577**(0.271)
-0.613**(0.303)
Inflation rate 0.604***(0.108)
0.590***(0.117)
0.435***(0.118)
0.451***(0.132)
Real interest rate 0.198**(0.077)
0.186**(0.083)
0.131(0.084)
0.284***(0.094)
Net financial wealth -0.014**(0.007)
-0.009(0.007)
-0.009(0.007)
-0.016*(0.009)
Net non financial wealth -0.061***(0.013)
-0.058***(0.014)
-0.044***(0.014)
-0.060***(0.016)
Growth in GDP percapita
----- ------ ------ ------
MemorandumAdjusted R-square 0.90 0.87 0.80 0.82Durbin-Watson 1.66 1.66 1.41 1.47

14
TABLE 1 C. Effect of adjustment on long-run parameters(Consumer Durables)
Variables NIPA CONSUMERDURABLES -- BEA
CONSUMERDURABLES -- OFCE
GROSS PRIVATESAVING
Public saving -0.350**(0.139)
-0.586***(0.091)
-0.537***(0.076)
-0.417***(0.068)
Net transfers -0.956***(0.246)
-1.137***(0.239)
-1.371***(0.199)
------
Inflation rate 0.604***(0.108)
0.584***(0.079)
0.703***(0.066)
0.663***(0.059)
Real interest rate 0.198**(0.077)
0.171**(0.085)
0.075(0.071)
0.220***(0.063)
Net financial wealth -0.014**(0.007)
----- ----- -----
Net non financial wealth -0.061***(0.013)
-0.042***(0.015)
-0.043***(0.012)
-0.018*(0.010)
Growth in GDP percapita
----- 0.136* (0.081)
0.309***(0.067)
0.249***(0.056)
MemorandumAdjusted R-square 0.90 0.83 0.90 0.87Durbin-Watson 1.66 1.68 2.01 1.76

15
TABLE 2 - Effect of adjustment on short run parametersVariables NIPA CAPITAL GAINS DEFINED BENEFIT
PENSIONINFLATION
Inflation rate 0.351***(0.113)
0.342**(0.140)
0.371***(0.129)
0.310*(0.152)
Real interest rate 0.135*(0.074)
0.099(0.091)
0.145*(0.083)
0.189*(0.010)
Net financial wealth -0.022***(0.006)
-0.012(0.008)
-0.012(0.007)
-0.013(0.008)
Net non financial wealth -0.056**(0.023)
-0.071**(0.028)
-0.070**(0.026)
-0.082**(0.016)
Error correction term -0.744***(0.198)
-0.676***(0.245)
-0.707***(0.026)
-0.695***(0.031)
MemorandumAdjusted R-square 0.56 0.33 0.43 0.36Durbin-Watson 1.75 1.76 1.55 1.53

16
Nature of the problem:
Try to explain movements in broad aggregates on the basis of:
Theory that applies to individual agents
Concepts that can not always be easily matched in National Accounts

Raises a number of issues
How far should one go in aggregation across agents or economic units with heterogeneous characteristics
Increase the risks of inter-sectoral reallocation induced by accounting conventions

Nature of the trade-off
Desirable to raise correspondence between between theoretical concept (or economic unit) and measure...
…but only to the extent that the cost in terms of adding new sources of measurement errors is limited…
…and that adjusted series can be retropolated sufficiently far back to allow for statistical analysis

19
Overall assessment
Development of a more comparable/ harmonised series of household saving across countries is desirable
Control for main institutional differences Complement rather than a substitute for
current series

20
Reservations -- Durables
Controlling for consumer durables appear to be trickier with far reaching implications -- sensitivity to assumptions
Not useful if purpose is to assess funds available to expand business capital stock
May be useful to assess models of household behaviour

21
Reservations -- capital gains
Not useful to add capital gains to income: adds too much noise
Adjustment for taxes paid on capital gains, inflation and DB plan is useful
Better to work on a comparable measure of financial and non-financial wealth

22
Net financial wealth and cumulation of saving rates -- USA
0
0.5
1
1.5
2
2.5
3
3.5
Cumul. saving
Financial wealth

23
Net financial wealth and cumulation of saving rates --Japan
0
0.5
1
1.5
2
2.5
3
Financial wealth
Cumul. saving