changes in motivational and higher level cognitive
TRANSCRIPT

Changes in motivational and higher level cognitive processes when interacting with
in-vehicle automation
Dissertation
zur Erlangung des akademischen Grades
doctor rerum naturalium (Dr. rer. nat.)
vorgelegt der Human- und Sozialwissenschaftlichen Fakultät
der Technischen Universität Chemnitz
vorgelegt von: Matthias Beggiato, geboren am 11.03.1976 in Bruneck (Südtirol)
eingereicht am: 27.10.2014
Disputation am: 30.03.2015
Erstgutachter: Prof. Dr. Josef F. Krems, Technische Universität Chemnitz
Zweitgutachter: Prof. Dr. Martin Baumann, Universität Ulm
Zitation / Citation:
Beggiato, M. (2015). Changes in motivational and higher level cognitive processes when interacting with in-vehicle automation. (Doctoral dissertation). Retrieved from http://nbn-resolving.de/urn:nbn:de:bsz:ch1-qucosa-167333.

This monograph presents an extended compilation of the articles listed below. Thesis chapters
including article text are listed in the last column.
Article Chapters including article text
I Beggiato, M. (2014). Effect of ADAS use on drivers' information processing and Situation Awareness. In A. Stevens, C. Brusque & J. Krems (Eds.) Driver adaptation to information and assistance systems (pp. 57-80). London: The Institution of Engineering and Technology (IET). ISBN 978-1-84919-639-0. Reproduced by permission of the Institution of Engineering & Technology.
2.1, 2.3.1, 2.3.2, 2.3.3, 2.3.4, 2.4, 6.4, 7.1, 7.2
II Beggiato, M., & Krems, J. F. (2013). The evolution of mental model, trust and acceptance of adaptive cruise control in relation to initial information. Transportation Research Part F, 18, 47-57. dx.doi.org/10.1016/j.trf.2012.12.006
2.3.1, 2.3.2, 5.2, 5.3.1, 5.3.2, 5.4, 7.1, 7.3
III Beggiato, M., & Krems, J. F. (2013). Auswirkungen erwarteter und unerwarteter Systemgrenzen von Adaptive Cruise Control auf das Situationsbewusstsein im Zeitverlauf. In VDI (Eds.). Der Fahrer im 21. Jahrhundert. VDI-Berichte 2205 (pp.119-132). Düsseldorf: VDI-Verlag. ISBN 978-3-18-092205-8.
2.4.2, 2.4.4, 5.3.3, 5.4
IV Beggiato, M., & Krems, J.F. (2012). The effects of preliminary information about adaptive cruise control on trust and the mental model of the system: a matched-sample longitudinal driving simulator study. In de Waard, D., Merat, N., Jamson, H., Barnard, Y., and Carsten, O.M.J. (Eds.), Human Factors of Systems and Technology (pp. 63-74). Maastricht, the Netherlands: Shaker Publishing. ISBN 978-90-423-0416-1.
2.4.3, 5.2.1, 5.4; 7.1
V Dotzauer, M., Berthon-Donk, V., Beggiato, M., Haupt, J., & Piccinini, G. (2014). Methods to assess behavioural adaptation over time as a result of ADAS use. In A. Stevens, C. Brusque & J. Krems (Eds). Driver adaptation to information and assistance systems (pp. 35-55). London: The Institution of Engineering and Technology (IET). ISBN 978-1-84919-639-0. Reproduced by permission of the Institution of Engineering & Technology.
4.1
VI Beggiato, M., Pereira, M., Petzoldt, T., & Krems, J. (submitted 30.07.2014). Development and stabilization of trust, acceptance and the mental model of ACC. A longitudinal on-road study.
2.5, 6.1, 6.2, 6.3.2, 6.3.3, 6.3.4, 6.4
VII Pereira, M., Beggiato, M., & Petzoldt, T. (submitted 15.06.2014). Use of adaptive cruise control functions on motorways and urban roads: changes over time in an on-road study.
6.3.1

Table of contents
LIST OF FIGURES ................................................................................................................. I
LIST OF TABLES .................................................................................................................. II
LIST OF ABBREVIATIONS ................................................................................................... III
ACKNOWLEDGEMENTS .................................................................................................... IV
SUMMARY ....................................................................................................................... V
ZUSAMMENFASSUNG .................................................................................................... VIII
1 INTRODUCTION ........................................................................................................ 12
2 THEORETICAL BACKGROUND .................................................................................... 14
2.1 BEHAVIOURAL ADAPTATION AND HIGHER COGNITIVE PROCESSES ............................................... 14
2.2 VEHICLE AUTOMATION AND ADAPTIVE CRUISE CONTROL ........................................................ 17
2.3 MENTAL MODELS ............................................................................................................ 20
2.3.1 Definition ....................................................................................................................... 20 2.3.2 Mental model construction and update ........................................................................ 20 2.3.3 Discussion of existing measures .................................................................................... 21 2.3.4 Development of the mental model questionnaire ......................................................... 23
2.4 SITUATION AWARENESS.................................................................................................... 24
2.4.1 Definition ....................................................................................................................... 24 2.4.2 Relationship between mental models and Situation Awareness .................................. 26 2.4.3 Situation Awareness as comprehension process ........................................................... 27 2.4.4 Discussion of existing measures .................................................................................... 27 2.4.5 Development of the Situation Awareness measurement technique ............................. 29
2.5 LEARNING, ACCEPTANCE AND TRUST IN AUTOMATION ............................................................. 30
2.5.1 Power law of learning ................................................................................................... 30 2.5.2 Acceptance .................................................................................................................... 31 2.5.3 Trust in automation ....................................................................................................... 31 2.5.4 Related research on learning, acceptance and trust in ACC ......................................... 32
3 OVERALL RESEARCH QUESTIONS ............................................................................... 34
4 OVERALL METHODOLOGICAL CONSIDERATIONS ....................................................... 35
4.1 DRIVING SIMULATOR STUDIES AND ON-ROAD TESTS ................................................................ 35
4.2 DATABASE-FRAMEWORK FOR DATA STORAGE AND ANALYSIS .................................................... 37
5 DRIVING SIMULATOR STUDY..................................................................................... 42
5.1 AIMS AND RESEARCH QUESTIONS ........................................................................................ 42
5.2 METHOD AND MATERIAL .................................................................................................. 43
5.2.1 Sampling and participants............................................................................................. 43 5.2.2 Research design and procedure .................................................................................... 44 5.2.3 Facilities and driving simulator track ............................................................................ 45 5.2.4 Secondary task SURT ..................................................................................................... 46

5.2.5 System description......................................................................................................... 46 5.2.6 Dependent variables trust, acceptance and mental model........................................... 47 5.2.7 Contrast analysis ........................................................................................................... 48
5.3 RESULTS ........................................................................................................................ 49
5.3.1 Mental model ................................................................................................................ 49 5.3.2 Trust and acceptance .................................................................................................... 51 5.3.3 Situation Awareness ...................................................................................................... 52
5.4 DISCUSSION ................................................................................................................... 56
6 ON-ROAD STUDY ...................................................................................................... 59
6.1 AIMS AND RESEARCH QUESTIONS ........................................................................................ 59
6.2 METHOD AND MATERIAL .................................................................................................. 59
6.2.1 Research design and procedure .................................................................................... 59 6.2.2 Sampling and participants............................................................................................. 60 6.2.3 Facilities and apparatus ................................................................................................ 60 6.2.4 Dependent variables mental model, trust, acceptance, learning and ACC usage ........ 62
6.3 RESULTS ........................................................................................................................ 63
6.3.1 ACC usage ...................................................................................................................... 63 6.3.2 Trust and acceptance .................................................................................................... 64 6.3.3 Learning ......................................................................................................................... 65 6.3.4 Mental model ................................................................................................................ 67
6.4 DISCUSSION ................................................................................................................... 68
7 GENERAL DISCUSSION AND CONCLUSIONS ............................................................... 70
7.1 THEORETICAL AND PRACTICAL CONSIDERATIONS .................................................................... 70
7.2 METHODOLOGICAL CONSIDERATIONS .................................................................................. 71
7.3 LIMITATIONS AND DIRECTIONS FOR FUTURE RESEARCH ............................................................ 74
8 REFERENCES ............................................................................................................. 76
9 APPENDIX ................................................................................................................. 88
9.1 QUESTIONNAIRES USED IN THE DRIVING SIMULATOR STUDY ...................................................... 88
9.1.1 Original German version ............................................................................................... 88 9.1.2 English translation ......................................................................................................... 91
9.2 ACC DESCRIPTIONS USED IN THE DRIVING SIMULATOR STUDY ................................................... 94
9.2.1 Correct description ........................................................................................................ 94 9.2.2 Incomplete description .................................................................................................. 95 9.2.3 Incorrect description ...................................................................................................... 96
9.3 SCHEMATIC OVERVIEW OF THE DRIVING SIMULATOR TRACK ...................................................... 97
9.4 QUESTIONNAIRES USED IN THE ON-ROAD STUDY .................................................................... 99
9.4.1 Original German version ............................................................................................... 99 9.4.2 English translation ....................................................................................................... 103
9.5 SEMINAR PROGRAMME: DATABASES AS ANALYSIS TOOL IN SOCIAL SCIENCE ............................... 107
9.6 CURRICULUM VITAE AND PUBLICATIONS ............................................................................. 109

I List of figures
List of figures
FIGURE 1. QUALITATIVE MODEL OF BEHAVIOURAL ADAPTATION (RUDIN-BROWN & NOY, 2002, AS CITED IN RUDIN-
BROWN & PARKER, 2004, P. 61; REPRINTED WITH PERMISSION). ............................................................. 15
FIGURE 2. A CONCEPTUAL MODEL OF DRIVER APPROPRIATION (ADAPTED FROM COTTER & MOGILKA, 2007, P. 14). . 16
FIGURE 3. SITUATION AWARENESS MODEL (ENDSLEY, 1995, P. 35; REPRINTED WITH PERMISSION). ....................... 25
FIGURE 4 RELATIONSHIP BETWEEN MENTAL MODEL AND SITUATION AWARENESS (ENDSLEY, 2000, P. 62; REPRINTED
WITH PERMISSION). ............................................................................................................................ 26
FIGURE 5. DEGREE OF EXPERIMENTAL CONTROL, REALISM AND TECHNOLOGY USE IN DIFFERENT RESEARCH SETTINGS
(ADAPTED FROM LIETZ ET AL., 2011). ................................................................................................... 35
FIGURE 6. DATABASE-FRAMEWORK FOR DATA STORAGE AND ANALYSIS. ............................................................. 38
FIGURE 7. USE CASES AND POSITIONING OF DATABASES IN THE RESEARCH PROCESS. ............................................. 39
FIGURE 8. GRAPHICAL SQL-MANAGEMENT TOOL NAVICAT PREMIUM. ............................................................. 41
FIGURE 9. DESIGN AND PROCEDURE OF THE MATCHED-SAMPLE DRIVING SIMULATOR STUDY. ................................. 44
FIGURE 10. DRIVING SIMULATOR SETUP AND SURT. ....................................................................................... 46
FIGURE 11. DEVELOPMENT OF ACC MENTAL MODEL (1 = TOTALLY DISAGREE, 6 = TOTALLY AGREE). ....................... 49
FIGURE 12. EVOLVEMENT OF TRUST IN ACC................................................................................................... 51
FIGURE 13. EVOLVEMENT OF ACCEPTANCE SCORES. ........................................................................................ 52
FIGURE 14. EXPLORATORY ANALYSIS OF SECONDARY TASK FREQUENCY FOR A SINGLE TRIP (LEFT) AND AVERAGED FOR
THE THREE EXPERIMENTAL GROUPS (RIGHT)............................................................................................ 53
FIGURE 15. PERCENTAGE OF SURT-TASKS SOLVED DURING THE CONSTRUCTION ZONE WITH THE WHITE TRUCK LEADING.
....................................................................................................................................................... 54
FIGURE 16. PERCENTAGE OF SURT-TASKS SOLVED DURING THE CUT-IN SITUATION WITH THE MOTORBIKE................ 55
FIGURE 17. FIRST BRAKE REACTION AFTER ACC TRACKING LOST (*P < .05, ** P < .01, ***P < .001, N.S. P > .05). . 56
FIGURE 18. ROUTE DRIVEN DURING EVERY SESSION (OPENSTREETMAP CONTRIBUTORS, 2014). ............................ 61
FIGURE 19. EXPERIMENT VEHICLE WITH VIDEO CAMERAS AND DATA ACQUISITION SYSTEM. .................................... 62
FIGURE 20. ACC USAGE RATE IN PERCENTAGE OF KILOMETRES WITH STANDARD ERROR BARS. ................................ 63
FIGURE 21. DEVELOPMENT OF TRUST IN ACC AND FITTED POWER LAW. ............................................................. 64
FIGURE 22. DEVELOPMENT OF ACC ACCEPTANCE AND FITTED POWER LAW. ........................................................ 65
FIGURE 23. DEVELOPMENT OF SELF-REPORTED LEARNING AND FITTED POWER LAW. ............................................. 66
FIGURE 24. DEVELOPMENT OF MENTAL MODEL (*P < .05, ** P < .01, ***P < .001, NS P > .05). ......................... 67

II List of tables
List of tables
TABLE 1. LEVELS OF AUTOMATION (PARASURAMAN ET AL., 2000; BASED ON SHERIDAN & VERPLANK, 1978). ........ 17
TABLE 2. SAMPLE CHARACTERISTICS AND RESULTS OF THE MATCHING PROCESS. ................................................... 43
TABLE 3. INITIAL ACC INFORMATION IN THE THREE EXPERIMENTAL GROUPS. ....................................................... 47
TABLE 4. MENTAL MODEL PROFILE DISTANCE BETWEEN CORRECT AND INCOMPLETE/INCORRECT GROUPS. ................ 50
TABLE 5. POWER FUNCTIONS AND GOODNESS-OF-FIT. ..................................................................................... 66

III List of Abbreviations
List of Abbreviations
ACC Adaptive Cruise Control
ACID Atomicity, Consistency, Isolation, Durability
ADAS Advanced Driver Assistant System
AIDE Adaptive Integrated Driver-vehicle interfacE
ANOVA Analysis Of Variance
BASt Bundesanstalt für Straßenwesen, Federal Highway Research Institute
BFI Big Five Inventory
BSSS Brief Sensation Seeking Scale
DBMS Database Management System
DLR Deutsches Zentrum für Luft- und Raumfahrt, German Aerospace Center
GOMS Goals, Operators, Methods and Selection rules
HUMANIST HUMAN centred design for Information Society Technologies
FOT Field Operational Test
GPS Global Positioning System
NDS Naturalistic Driving Studies
NLR Non Linear Regression
OECD Organization for Economic Co-operation and Development
OLAP Online Analytical Processing
RMSE Root Mean Square Error
SA Situation Awareness
SA-SWORD Situation Awareness-Subjective Workload Dominance Technique
SAGAT Situation Awareness Global Assessment Technique
SARS Situation Awareness Rating Scales
SART Situation Awareness Rating Technique
SD Standard deviation
SPAM Situation Present Awareness Method
SQL Structured Query Language
SURT Surrogate Reference Task
UMTRI University of Michigan Transportation Research Institute
VTTI Virginia Tech Transportation Institute
ZVT Zahlenverbindungstest

IV Acknowledgements
Acknowledgements
This PhD project was conducted in the framework of the Marie Curie Initial Training Network
ADAPTATION, funded by the European Community’s Seventh Framework Programme (FP7/2010-
2014) under the grant agreement no. 238833. I would like to thank the European Commission for
offering this inspiring opportunity of doing collaborative research work in another European country
combined with an ambitious training programme including network activities as well as the
participation in workshops and conferences.
The stimulating research environment at Chemnitz University of Technology allowed for combining
and enhancing my skills in computer science, psychology and educational science. This environment
is primarily constituted by the team of the Institute for Cognitive and Engineering Psychology. My
great thanks to all of them for giving me a very warm welcome in Chemnitz, continuous support and
inspiration, and for meanwhile being very good friends. The team, combined with a high and
affordable quality of life in Chemnitz made (and still makes) the answer easy to the most frequently
asked question “Why did you move from Vienna to Chemnitz?”
I would like to thank my supervisor, Prof. Dr. Josef F. Krems for his continuous support, trustworthy
leadership and valuable advice. Great thanks as well to all senior and early stage researchers within
the ADAPTATION network for the support and feedback, especially to Marta Pereira.
A special thank goes to Claudia, who dared to leave the job and life in Vienna for joining me on this
new adventure in Chemnitz.
Last but not least I want to thank the student assistants Matthias Metzner, Hanna Bellem and Julia
Wichmann for their competent and dedicated help in conducting the studies.
V Summary
Summary
Many functions that at one time could only be performed by humans can nowadays be carried out by
machines. Automation impacts many areas of life including work, home, communication and
mobility. In the driving context, in-vehicle automation is considered to provide solutions for
environmental, economic, safety and societal challenges. However, automation changes the driving
task and the human-machine interaction. Thus, the expected benefit of in-vehicle automation can be
undermined by changes in drivers’ behaviour, i.e. behavioural adaptation. This PhD project focuses
on motivational as well as higher cognitive processes underlying behavioural adaptation when
interacting with in-vehicle automation. Motivational processes include the development of trust and
acceptance, whereas higher cognitive processes comprise the learning process as well as the
development of mental models and Situation Awareness (SA). As an example for in-vehicle
automation, the advanced driver assistance system Adaptive Cruise Control (ACC) was investigated.
ACC automates speed and distance control by maintaining a constant set cruising speed and
automatically adjusting vehicle’s velocity in order to provide a specified distance to the preceding
vehicle. However, due to sensor limitations, not every situation can be handled by the system and
therefore driver intervention is required. Trust, acceptance and an appropriate mental model of the
system functionality are considered key variables for adequate use and appropriate SA.
To systematically investigate changes in motivational and higher cognitive processes, a driving
simulator as well as an on-road study were carried out. Both of the studies were conducted using a
repeated-measures design, taking into account the process character, i.e. changes over time. The
main focus was on the development of trust, acceptance and the mental model of novice users when
interacting with ACC. By now, only few studies have attempted to assess changes in higher level
cognitive processes, due to methodological difficulties posed by the dynamic task of driving.
Therefore, this PhD project aimed at the elaboration and validation of innovative methods for
assessing higher cognitive processes, with an emphasis on SA and mental models. In addition, a new
approach for analyzing big and heterogeneous data in social science was developed, based on the
use of relational databases.
The driving simulator study investigated the effect of divergent initial mental models of ACC (i.e.,
varying according to correctness) on trust, acceptance and mental model evolvement. A longitudinal
study design was applied, using a two-way (3×3) repeated measures mixed design with a matched
sample of 51 subjects. Three experimental groups received (1) a correct ACC description, (2) an
incomplete and idealised account omitting potential problems, and (3) an incorrect description
including non-occurring problems. All subjects drove a 56-km track of highway with an identical ACC
system, three times, and within a period of 6 weeks. Results showed that after using the system,

VI Summary
participants’ mental model of ACC converged towards the profile of the correct group. Non-
experienced problems tended to disappear from the mental model network when they were not
activated by experience. Trust and acceptance grew steadily for the correct condition. The same
trend was observed for the group with non-occurring problems, starting from a lower initial level.
Omitted problems in the incomplete group led to a constant decrease in trust and acceptance
without recovery. This indicates that automation failures do not negatively affect trust and
acceptance if they are known beforehand. During each drive, participants continuously completed a
visual secondary task, the Surrogate Reference Task (SURT). The frequency of task completion was
used as objective online-measure for SA, based on the principle that situationally aware driver would
reduce the engagement in the secondary task if they expect potentially critical situations. Results
showed that correctly informed drivers were aware of potential system limitations and reduced their
engagement in the secondary task when such situations arose. Participants with no information
about limitations became only aware after first encounter and reduced secondary task engagement
in corresponding situations during subsequent trials. However, trust and acceptance in the system
declined over time due to the unexpected failures. Non occurring limitations tended to drop from the
mental model and resulted in reduced SA already in the second trial.
The on-road study investigated the learning process, as well as the development of trust, acceptance
and the mental model for interacting with ACC in real conditions. Research questions aimed to model
the learning process in mathematical/statistical terms, examine moments and conditions when these
processes stabilize, and assess how experience changes the mental model of the system. A sample of
fifteen drivers without ACC experience drove a test vehicle with ACC ten consecutive times on the
same route within a 2-month period. In contrast to the driving simulator study, all participants were
fully trained in ACC functionality by reading the owner’s manual in the beginning. Results showed
that learning, as well as the development of acceptance and trust in ACC follows the power law of
learning, in case of comprehensive prior information on system limitations. Thus, the major part of
the learning process occurred during the first interaction with the system and support in explaining
the systems abilities (e.g. by tutoring systems) should therefore primarily be given during this first
stage. All processes stabilized at a relatively high level after the fifth session, which corresponds to
185 km or 3.5 hours of driving. No decline was observable with ongoing system experience.
However, in line with the findings from the simulator study, limitations that are not experienced
tended to disappear from the mental model if they were not activated by experience.
With regard to the validation of the developed methods for assessing mental models and SA, results
are encouraging. The studies show that the mental model questionnaire is able to provide insights
into the construction of mental models and the development over time. Likewise, the implicit
measurement approach to assess SA online in the driving simulator is sensitive to user’s awareness

VII Summary
of potentially critical situations. In terms of content, the results of the studies prove the enduring
relevance of the initial mental model for the learning process, SA, as well as the development of
trust, acceptance and a realistic mental model about automation capabilities and limitations. Given
the importance of the initial mental model it is recommended that studies on system trust and
acceptance should include, and attempt to control, users’ initial mental model of system
functionality. Although the results showed that also incorrect and incomplete initial mental models
converged by experience towards a realistic appreciation of system functionality, the more cognitive
effort needed to update the mental model, the lower trust and acceptance. Providing an idealised
description, which omits potential problems, only leads to temporarily higher trust and acceptance in
the beginning. The experience of unexpected limitations results in a steady decrease in trust and
acceptance over time.
A trial-and-error strategy for in-vehicle automation use, without accompanying information, is
therefore considered insufficient for developing stable trust and acceptance. If the mental model
matches experience, trust and acceptance grow steadily following the power law of learning –
regardless of the experience of system limitations. Provided that such events are known in advance,
they will not cause a decrease in trust and acceptance over time. Even over-information about
potential problems lowers trust and acceptance only in the beginning, and not in the long run.
Potential problems should therefore not be concealed in over-idealised system descriptions; the
more information given, the better, in the long run. However, limitations that are not experienced
tend to disappear from the mental model. Therefore, it is recommended that users be periodically
reminded of system limitations to make sure that corresponding knowledge becomes re-activated.
Intelligent tutoring systems incorporated in automated systems could provide a solution. In the
driving context, periodic reminders about system limitations could be shown via the multifunction
displays integrated in most modern cars. Tutoring systems could also be used to remind the driver of
the presence of specific in-vehicle automation systems and reveal their benefits.
VIII Zusammenfassung
Zusammenfassung
Viele Aufgaben, die ehemals von Menschen ausgeführt wurden, werden heute von Maschinen
übernommen. Dieser Prozess der Automatisierung betrifft viele Lebensbereiche von Arbeit, Wohnen,
Kommunikation bis hin zur Mobilität. Im Bereich des Individualverkehrs wird die Automatisierung
von Fahrzeugen als Möglichkeit gesehen, zukünftigen Herausforderungen wirtschaftlicher,
gesellschaftlicher und umweltpolitischer Art zu begegnen. Allerdings verändert Automatisierung die
Fahraufgabe und die Mensch-Technik Interaktion im Fahrzeug. Daher können beispielsweise
erwartete Sicherheitsgewinne automatisch agierender Assistenzsysteme durch Veränderungen im
Verhalten des Fahrers geschmälert werden, was als Verhaltensanpassung (behavioural adaptation)
bezeichnet wird. Dieses Dissertationsprojekt untersucht motivationale und höhere kognitive
Prozesse, die Verhaltensanpassungen im Umgang mit automatisierten Fahrerassistenzsystemen
zugrunde liegen. Motivationale Prozesse beinhalten die Entwicklung von Akzeptanz und Vertrauen in
das System, unter höheren kognitiven Prozessen werden Lernprozesse sowie die Entwicklung von
mentalen Modellen des Systems und Situationsbewusstsein (Situation Awareness) verstanden. Im
Fokus der Untersuchungen steht das Fahrerassistenzsystem Adaptive Cruise Control (ACC) als ein
Beispiel für Automatisierung im Fahrzeug. ACC regelt automatisch die Geschwindigkeit des
Fahrzeugs, indem bei freier Fahrbahn eine eingestellte Wunschgeschwindigkeit und bei einem
Vorausfahrer automatisch ein eingestellter Abstand eingehalten wird. Allerdings kann ACC aufgrund
von Einschränkungen der Sensorik nicht jede Situation bewältigen, weshalb der Fahrer übernehmen
muss. Für diesen Interaktionsprozess spielen Vertrauen, Akzeptanz und das mentale Modell der
Systemfunktionalität eine Schlüsselrolle, um einen sicheren Umgang mit dem System und ein
adäquates Situationsbewusstsein zu entwickeln.
Zur systematischen Erforschung dieser motivationalen und kognitiven Prozesse wurden eine
Fahrsimulatorstudie und ein Versuch im Realverkehr durchgeführt. Beide Studien wurden im
Messwiederholungsdesign angelegt, um dem Prozesscharakter gerecht werden und Veränderungen
über die Zeit erfassen zu können. Die Entwicklung von Vertrauen, Akzeptanz und mentalem Modell in
der Interaktion mit ACC war zentraler Forschungsgegenstand beider Studien. Bislang gibt es wenige
Studien, die kognitive Prozesse im Kontext der Fahrzeugführung untersucht haben, unter anderem
auch wegen methodischer Schwierigkeiten in diesem dynamischen Umfeld. Daher war es ebenfalls
Teil dieses Dissertationsprojekts, neue Methoden zur Erfassung höherer kognitiver Prozesse in dieser
Domäne zu entwickeln, mit Fokus auf mentalen Modellen und Situationsbewusstsein. Darüber
hinaus wurde auch ein neuer Ansatz für die Analyse großer und heterogener Datenmengen im
sozialwissenschaftlichen Bereich entwickelt, basierend auf dem Einsatz relationaler Datenbanken.

IX Zusammenfassung
Ziel der der Fahrsimulatorstudie war die systematische Erforschung des Effekts von unterschiedlich
korrekten initialen mentalen Modellen von ACC auf die weitere Entwicklung des mentalen Modells,
Vertrauen und Akzeptanz des Systems. Eine Stichprobe von insgesamt 51 Probanden nahm an der
Studie teil; der Versuch wurde als zweifaktorielles (3x3) gemischtes Messwiederholungsdesign
konzipiert. Die 3 parallelisierten Versuchsgruppen zu je 17 Personen erhielten (1) eine korrekte
Beschreibung des ACC, (2) eine idealisierte Beschreibung unter Auslassung auftretender
Systemprobleme und (3) eine überkritische Beschreibung mit zusätzlichen Hinweisen auf
Systemprobleme, die nie auftraten. Alle Teilnehmer befuhren insgesamt dreimal im Zeitraum von
sechs Wochen dieselbe 56 km lange Autobahnstrecke im Fahrsimulator mit identischem ACC-System.
Mit zunehmendem Einsatz des ACC zeigte sich im anfänglich divergierenden mentalen Modell
zwischen den Gruppen eine Entwicklung hin zum mentalen Modell der korrekt informierten Gruppe.
Nicht erfahrene Systemprobleme tendierten dazu, im mentalen Modell zu verblassen, wenn sie nicht
durch Erfahrung reaktiviert wurden. Vertrauen und Akzeptanz stiegen stetig in der korrekt
informierten Gruppe. Dieselbe Entwicklung zeigte sich auch in der überkritisch informierten Gruppe,
wobei Vertrauen und Akzeptanz anfänglich niedriger waren als in der Bedingung mit korrekter
Information. Verschwiegene Systemprobleme führten zu einer konstanten Abnahme von Akzeptanz
und Vertrauen ohne Erholung in der Gruppe mit idealisierter Beschreibung. Diese Resultate lassen
darauf schließen, dass Probleme automatisierter Systeme sich nicht zwingend negativ auf Vertrauen
und Akzeptanz auswirken, sofern sie vorab bekannt sind. Bei jeder Fahrt führten die
Versuchsteilnehmer zudem kontinuierlich eine visuell beanspruchende Zweitaufgabe aus, die
Surrogate Reference Task (SURT). Die Frequenz der Zweitaufgabenbearbeitung diente als objektives
Echtzeitmaß für das Situationsbewusstsein, basierend auf dem Ansatz, dass situationsbewusste
Fahrer die Zuwendung zur Zweitaufgabe reduzieren wenn sie potentiell kritische Situationen
erwarten. Die Ergebnisse zeigten, dass die korrekt informierten Fahrer sich potentiell kritischer
Situationen mit möglichen Systemproblemen bewusst waren und schon im Vorfeld der Entstehung
die Zweitaufgabenbearbeitung reduzierten. Teilnehmer ohne Informationen zu auftretenden
Systemproblemen wurden sich solcher Situationen erst nach dem ersten Auftreten bewusst und
reduzierten in entsprechenden Szenarien der Folgefahrten die Zweitaufgabenbearbeitung. Allerdings
sanken Vertrauen und Akzeptanz des Systems aufgrund der unerwarteten Probleme. Erwartete, aber
nicht auftretende Systemprobleme tendierten dazu, im mentalen Modell des Systems zu verblassen
und resultierten in vermindertem Situationsbewusstsein bereits in der zweiten Fahrt.
Im Versuch unter Realbedingungen wurden der Lernprozesses sowie die Entwicklung des mentalen
Modells, Vertrauen und Akzeptanz von ACC im Realverkehr erforscht. Ziele waren die
statistisch/mathematische Modellierung des Lernprozesses, die Bestimmung von Zeitpunkten der
Stabilisierung dieser Prozesse und wie sich reale Systemerfahrung auf das mentale Modell von ACC

X Zusammenfassung
auswirkt. 15 Versuchsteilnehmer ohne ACC-Erfahrung fuhren ein Serienfahrzeug mit ACC insgesamt
10-mal auf der gleichen Strecke in einem Zeitraum von 2 Monaten. Im Unterschied zur
Fahrsimulatorstudie waren alle Teilnehmer korrekt über die ACC-Funktionen und Funktionsgrenzen
informiert durch Lesen der entsprechenden Abschnitte im Fahrzeughandbuch am Beginn der Studie.
Die Ergebnisse zeigten, dass der Lernprozess sowie die Entwicklung von Akzeptanz und Vertrauen
einer klassischen Lernkurve folgen – unter der Bedingung umfassender vorheriger Information zu
Systemgrenzen. Der größte Lernfortschritt ist am Beginn der Interaktion mit dem System sichtbar
und daher sollten Hilfen (z.B. durch intelligente Tutorsysteme) in erster Linie zu diesem Zeitpunkt
gegeben werden. Eine Stabilisierung aller Prozesse zeigte sich nach der fünften Fahrt, was einer
Fahrstrecke von rund 185 km oder 3,5 Stunden Fahrzeit entspricht. Es zeigten sich keine Einbrüche in
Akzeptanz, Vertrauen bzw. dem Lernprozess durch die gemachten Erfahrungen im Straßenverkehr.
Allerdings zeigte sich – analog zur Fahrsimulatorstudie – auch in der Realfahrstudie ein Verblassen
von nicht erfahrenen Systemgrenzen im mentalen Modell, wenn diese nicht durch Erfahrungen
aktiviert wurden.
Im Hinblick auf die Validierung der neu entwickelten Methoden zur Erfassung von mentalen
Modellen und Situationsbewusstsein sind die Resultate vielversprechend. Die Studien zeigen, dass
mit dem entwickelten Fragebogenansatz zur Quantifizierung des mentalen Modells Einblicke in
Aufbau und Entwicklung mentaler Modelle gegeben werden können. Der implizite Echtzeit-
Messansatz für Situationsbewusstsein im Fahrsimulator zeigt sich ebenfalls sensitiv in der Erfassung
des Bewusstseins von Fahrern für potentiell kritische Situationen. Inhaltlich zeigen die Studien die
nachhaltige Relevanz des initialen mentalen Modells für den Lernprozess sowie die Entwicklung von
Situationsbewusstsein, Akzeptanz, Vertrauen und die weitere Ausformung eines realistischen
mentalen Modells der Möglichkeiten und Grenzen automatisierter Systeme. Aufgrund dieser
Relevanz wird die Einbindung und Kontrolle des initialen mentalen Modells in Studien zu
automatisierten Systemen unbedingt empfohlen. Die Ergebnisse zeigen zwar, dass sich auch
unvollständige bzw. falsche mentale Modelle durch Erfahrungslernen hin zu einer realistischen
Einschätzung der Systemmöglichkeiten und -grenzen verändern, allerdings um den Preis sinkenden
Vertrauens und abnehmender Akzeptanz. Idealisierte Systembeschreibungen ohne Hinweise auf
mögliche Systemprobleme bringen nur anfänglich etwas höheres Vertrauen und Akzeptanz. Das
Erleben unerwarteter Probleme führt zu einem stetigen Abfall dieser motivationalen Faktoren über
die Zeit.
Ein alleiniges Versuchs-Irrtums-Lernen für den Umgang mit automatisierter Assistenz im Fahrzeug
ohne zusätzliche Information wird daher als nicht ausreichend für die Entwicklung stabilen
Vertrauens und stabiler Akzeptanz betrachtet. Wenn das initiale mentale Modell den Erfahrungen
entspricht, entwickeln sich Akzeptanz und Vertrauen gemäß einer klassischen Lernkurve – trotz
XI Zusammenfassung
erlebter Systemgrenzen. Sind diese potentiellen Probleme vorher bekannt, führen sie nicht zwingend
zu einer Reduktion von Vertrauen und Akzeptanz. Auch zusätzliche überkritische Information
vermindert Vertrauen und Akzeptanz nur am Beginn, aber nicht langfristig. Daher sollen potentielle
Probleme in automatisierten Systemen nicht in idealisierten Beschreibungen verschwiegen werden –
je präzisere Information gegeben wird, desto besser im langfristigen Verlauf. Allerdings tendieren
nicht erfahrene Systemgrenzen zum Verblassen im mentalen Modell. Daher wird empfohlen, Nutzer
regelmäßig an diese Systemgrenzen zu erinnern um die entsprechenden Facetten des mentalen
Modells zu reaktivieren. In automatisierten Systemen integrierte intelligente Tutorsysteme könnten
dafür eine Lösung bieten. Im Fahrzeugbereich könnten solche periodischen Erinnerungen an
Systemgrenzen in Multifunktionsdisplays angezeigt werden, die mittlerweile in vielen modernen
Fahrzeugen integriert sind. Diese Tutorsysteme können darüber hinaus auch auf die Präsenz
eingebauter automatisierter Systeme hinweisen und deren Vorteile aufzeigen.
12 Introduction
1 Introduction
In-vehicle automation has become increasingly ubiquitous in modern vehicles. Advanced driver
assistance systems (ADAS) aim to increase comfort and safety through automation of driving tasks.
Depending on system and manoeuvre types, estimates of potential ADAS safety benefits in terms of
avoidable accidents involving personal injury range from 2% to 45% for cars, 2% to 12% for trucks
and 1% to 15% for buses (Hummel, Kühn, Bende, & Lang, 2011). However, to fully harness this safety
potential, it is necessary that drivers use ADAS adequately for the intended purpose, calibrate trust,
accept the systems and use them on a regular basis. The expected safety benefit of ADAS can be
undermined by changes in drivers’ behaviour, following the introduction of changes to the road-
vehicle-user. These behavioural changes may create an increase or decrease in safety and are
defined as behavioural adaptation (OECD, 1990).
Present work was conducted in the Marie Curie Initial Training Network ADAPTATION. The main aim
of ADAPTATION was the investigation of drivers’ behavioural adaptation and its underlying processes
over time in response to the use of ADAS. A total of ten PhD projects and two postdoctoral projects
focussed on a broader view of adaptation processes, including not only observable behaviour but as
well changes in energetic, motivational and higher cognitive processes. Energetic processes include
attention, mental workload and effort management, motivational processes comprise intentions,
perceived risk and attitudes such as trust and acceptance, whereas higher cognitive processes
include SA, mental models and information processing (Krems, Brusque, & Stevens, 2014).
This PhD project focuses on motivational as well as higher cognitive processes when interacting with
in-vehicle automation. A driving simulator as well as an on-road study has been conducted. Both of
the studies used a repeated-measures design and investigated the development of trust, acceptance
and the mental model of novice users when interacting with ACC as an example for in-vehicle
automation. In addition, real-time SA was assessed in the driving simulator study and the learning
process was modelled in the on-road study, based on the power law of learning. The driving
simulator study mainly investigated how different initial mental models of ACC affect system trust
and acceptance over time as well as how a user’s mental model evolves with experience. The on-
road study was a continuation of the driving simulator study, focussing on the learning process as
well as the development of trust, acceptance and the mental model under realistic conditions and
over a longer period of time.
The section on the theoretical background in chapter 2 introduces the conceptual framework for the
studies. Chapter 2.1 defines and explains behavioural adaptation and presents an integrative model
of influencing factors. These factors were either controlled or experimentally manipulated in the
studies. Chapter 2.2 introduces the concept of automation, discussing levels of automation as well as
13 Introduction
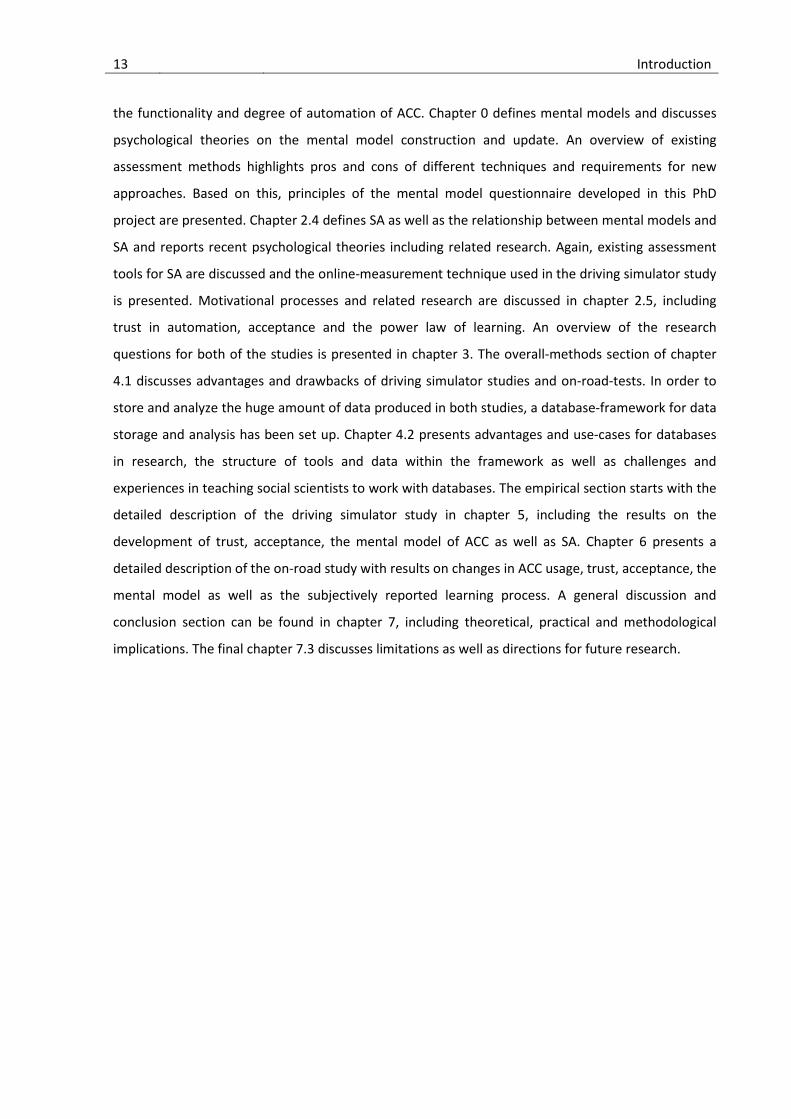
the functionality and degree of automation of ACC. Chapter 0 defines mental models and discusses
psychological theories on the mental model construction and update. An overview of existing
assessment methods highlights pros and cons of different techniques and requirements for new
approaches. Based on this, principles of the mental model questionnaire developed in this PhD
project are presented. Chapter 2.4 defines SA as well as the relationship between mental models and
SA and reports recent psychological theories including related research. Again, existing assessment
tools for SA are discussed and the online-measurement technique used in the driving simulator study
is presented. Motivational processes and related research are discussed in chapter 2.5, including
trust in automation, acceptance and the power law of learning. An overview of the research
questions for both of the studies is presented in chapter 3. The overall-methods section of chapter
4.1 discusses advantages and drawbacks of driving simulator studies and on-road-tests. In order to
store and analyze the huge amount of data produced in both studies, a database-framework for data
storage and analysis has been set up. Chapter 4.2 presents advantages and use-cases for databases
in research, the structure of tools and data within the framework as well as challenges and
experiences in teaching social scientists to work with databases. The empirical section starts with the
detailed description of the driving simulator study in chapter 5, including the results on the
development of trust, acceptance, the mental model of ACC as well as SA. Chapter 6 presents a
detailed description of the on-road study with results on changes in ACC usage, trust, acceptance, the
mental model as well as the subjectively reported learning process. A general discussion and
conclusion section can be found in chapter 7, including theoretical, practical and methodological
implications. The final chapter 7.3 discusses limitations as well as directions for future research.

14 Theoretical background
2 Theoretical background
2.1 Behavioural adaptation and higher cognitive processes
ADAS aim to support drivers by automating driving subtasks such that comfort and safety are
enhanced. However, the positive effects of these systems may be diminished or even inverted by
unintentional changes in user behaviour. Behavioural adaptation, which is induced by the use of
ADAS, is a well-known phenomenon and defined by the Organisation for Economic Co-operation and
Development (OECD; 1990) as “those behaviours which may occur following the introduction of
changes to the road-vehicle-user system and which were not intended by the initiator of the change”
(p. 23). However, results are heterogeneous regarding conditions, influencing factors and direction of
changes. Therefore, further research is required to understand the factors underlying these
phenomena (Cacciabue & Saad, 2008).
Within the ADAPTATION project, higher cognitive processes mainly include information processing,
mental models (i.e., synonymous to mental representation) and SA. These processes are thought to
influence behavioural adaptation (e.g. Kazi, Stanton, Walker, & Young, 2007; Rudin-Brown & Parker,
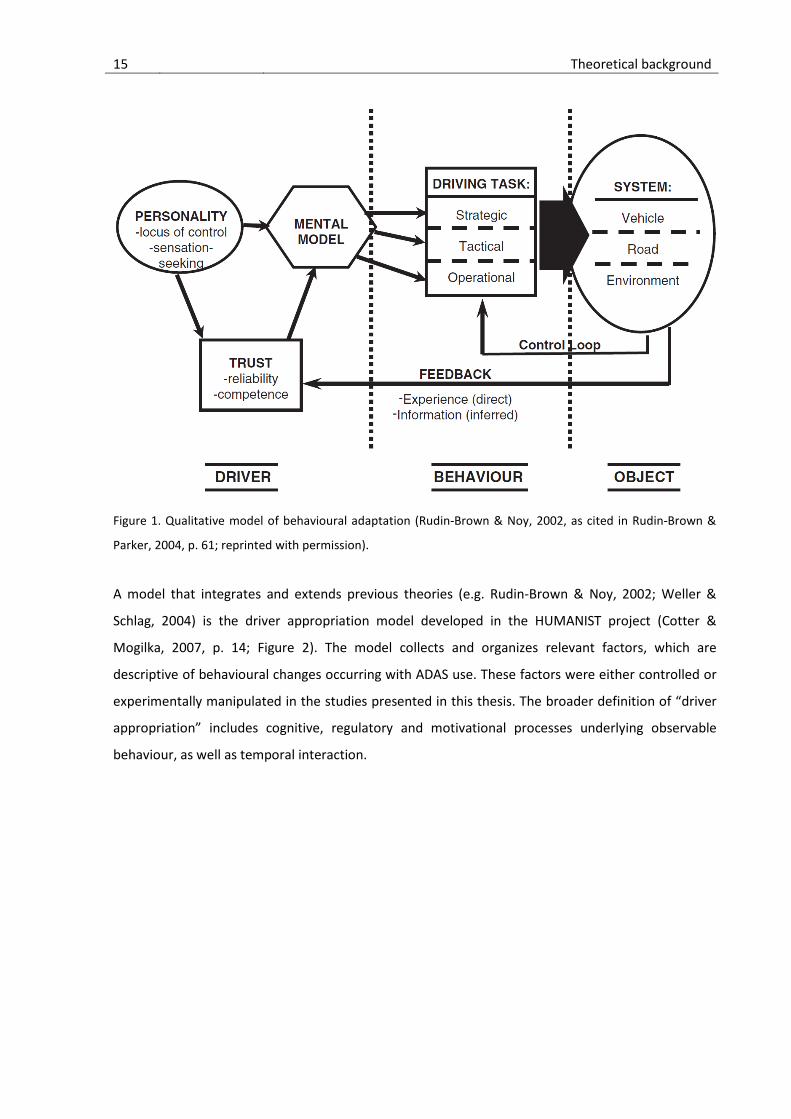
2004; Saad, 2007; Stanton & Young, 2005). A dynamic qualitative model for behavioural adaptation
was presented by Rudin-Brown and Noy (2002, as cited in Rudin-Brown & Parker, 2004, p. 61; Figure
1). The model takes into account the iterative process introducing a feedback loop from the object-
level to the driver and the behaviour-level. The personality factors locus of control and sensation
seeking are considered to contribute to behavioural adaptation. Driver with an internal locus of
control rely more on their own skills and are supposed to maintain a more direct involvement with
the driving task than driver with external locus of control. High sensation seekers may show
behavioural adaptation because of their preference for a higher level of risk. These personality
factors influence the mental model of ADAS and this process is considered to be mediated by trust in
the system. The mental model influences driving behaviour on strategic, tactical and operational
level. The behaviour changes the vehicle-road-environment system on the object level, which feeds
back to the behaviour as well to the driver level.
15 Theoretical background
Figure 1. Qualitative model of behavioural adaptation (Rudin-Brown & Noy, 2002, as cited in Rudin-Brown &
Parker, 2004, p. 61; reprinted with permission).
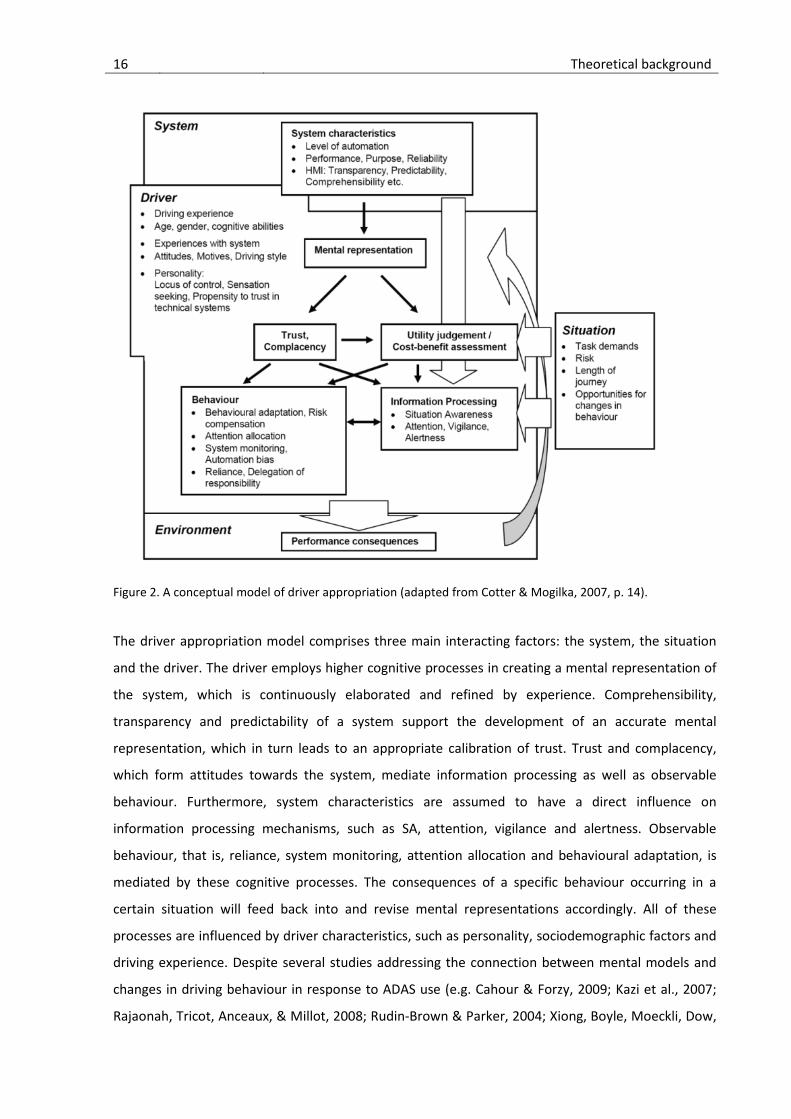
A model that integrates and extends previous theories (e.g. Rudin-Brown & Noy, 2002; Weller &
Schlag, 2004) is the driver appropriation model developed in the HUMANIST project (Cotter &
Mogilka, 2007, p. 14; Figure 2). The model collects and organizes relevant factors, which are
descriptive of behavioural changes occurring with ADAS use. These factors were either controlled or
experimentally manipulated in the studies presented in this thesis. The broader definition of “driver
appropriation” includes cognitive, regulatory and motivational processes underlying observable
behaviour, as well as temporal interaction.
16 Theoretical background
Figure 2. A conceptual model of driver appropriation (adapted from Cotter & Mogilka, 2007, p. 14).
The driver appropriation model comprises three main interacting factors: the system, the situation
and the driver. The driver employs higher cognitive processes in creating a mental representation of
the system, which is continuously elaborated and refined by experience. Comprehensibility,
transparency and predictability of a system support the development of an accurate mental
representation, which in turn leads to an appropriate calibration of trust. Trust and complacency,
which form attitudes towards the system, mediate information processing as well as observable
behaviour. Furthermore, system characteristics are assumed to have a direct influence on
information processing mechanisms, such as SA, attention, vigilance and alertness. Observable
behaviour, that is, reliance, system monitoring, attention allocation and behavioural adaptation, is
mediated by these cognitive processes. The consequences of a specific behaviour occurring in a
certain situation will feed back into and revise mental representations accordingly. All of these
processes are influenced by driver characteristics, such as personality, sociodemographic factors and
driving experience. Despite several studies addressing the connection between mental models and
changes in driving behaviour in response to ADAS use (e.g. Cahour & Forzy, 2009; Kazi et al., 2007;
Rajaonah, Tricot, Anceaux, & Millot, 2008; Rudin-Brown & Parker, 2004; Xiong, Boyle, Moeckli, Dow,

17 Theoretical background
& Brown, 2012), knowledge of the relation between the appropriateness of mental models, system
trust and behavioural changes over time is lacking (Saad, 2007). Therefore, this PhD project aimed at
the elaboration and validation of innovative methods for assessing higher cognitive processes, with
an emphasis on SA and mental models. The development principles of a mental model questionnaire
are described in chapter 2.3.4 and the approach for assessing SA in real time is presented in chapter
2.4.5. Both methods were applied in the studies – results can be found in chapters 5 and 6.
2.2 Vehicle automation and Adaptive Cruise Control
Many functions that at one time could only be performed by humans can nowadays be carried out by
machines, especially computers. This development impacts many areas of life including work, home,
communication and mobility. Automation can be defined as “the full or partial replacement of a
function previously carried out by the human operator” (Parasuraman, Sheridan, & Wickens, 2000, p.
287). Full or partial replacement implies that automation can vary between different levels and
should not be considered as all or none. Therefore several models were developed for describing
levels of automation. Parasuraman et al. (2000) proposed a 10-stage model based on the work of
Sheridan and Verplank (1978), starting from manual control at level one until full automation at level
ten (Table 1).
Table 1. Levels of Automation (Parasuraman et al., 2000; based on Sheridan & Verplank, 1978).
HIGH 10. The computer decides everything, acts autonomously, ignoring the human
9. informs the human only if it, the computer, decides to
8. informs the human only if asked, or
7. executes automatically, then necessarily informs the human, and
6. allows the human a restricted time to veto before automatic execution, or
5. executes that suggestion if the human approves, or
4. suggests one alternative
3. narrows the selection down to a few, or
2. The computer offers a complete set of decision/action alternatives, or
LOW 1. The computer offers no assistance: human must take all decisions and actions
The distinction between assistance and automation in this continuum of automation levels is fuzzy.
Hauß and Timpe (2000) proposed to talk about assistance if the level of automation is below or equal
than 5, whereas automation ranges from 6 to 10. In terms of concept, assistance means that the
driver remains the central element in the control loop and is supported by the systems, whereas
automation partly or completely bypasses the driver in the control loop by automating driving tasks

18 Theoretical background
(Kompass, Huber, & Helmer, 2012). A specific model for describing assistance and degrees of vehicle
automation was proposed by the BASt-Expert-Group (Gasser et al., 2012):
5) Full automation: The system takes over longitudinal and lateral control completely and
permanently. In case of a takeover request that is not followed, the system will return to the
minimal risk condition by itself.
4) High automation: The system takes over longitudinal and lateral control; the driver is no longer
required to permanently monitor the system. In case of a take-over request, the driver must
take-over control with a certain time buffer.
3) Partial automation: The system takes over longitudinal and lateral control, the driver shall
permanently monitor the system and shall be prepared to take over control at any time.
2) Driver Assistance: The driver permanently controls either longitudinal or lateral control. The
other task can be automated to a certain extent by the assistance system.
1) Driver Only: Human driver executes manual driving task
Vehicle automation is considered to provide solutions for environmental, economic, safety and
societal challenges such as reduction of emissions through optimization of traffic flow and fuel
consumption, adaption to demographic change by enhancing mobility of elderly and reducing driving
stress by supporting unconfident drivers, economic competitiveness through technical innovations
and higher product attractiveness as well as road safety enhancement by avoidance of human errors
(Meyer & Deix, 2014). However, automation changes the driving task and especially the human-
machine interaction. The role of the driver changes from active operator towards a supervisor of
automation (Vollrath & Krems, 2011). These changes evoke new problems due to automation, which
have been observed in other domains such as aviation or manufacturing and become relevant as well
in transportation. Bainbridge (1983) described such “ironies of automation” including the loss of
skills, reduced vigilance because of monotony, mistrust or overreliance, reduced SA and misuse of
automation. These psychological issues with respect to vehicle automation are still less investigated
(Vollrath & Krems, 2011) and the present work aims at these research gaps. Human-machine
interaction issues are considered the most important future research topic in the area of vehicle
automation (Gasser, 2012).
ACC is one example for an advanced driver assistance system, which is located at the border
between assistance and automation. In combination with lane departure warning, ACC is considered
the most relevant functionality for highly automated driving (Meyer & Deix, 2014). ISO 15622 (2002)
defines ACC as “an enhancement to conventional cruise control systems, which allows the subject
vehicle to follow a forward vehicle at an appropriate distance by controlling the engine and/or power

19 Theoretical background
train and potentially the brake.” ACC adjusts automatically vehicle’s velocity in order to provide a
specified distance to the preceding vehicle. In absence of a preceding vehicle, ACC maintains a user
set velocity such as conventional cruise control.
Recent ACC Stop and go systems operate on the full speed range, can decelerate to a complete
standstill and follow automatically if the vehicle in front restarts (Winner, Danner, & Steinle, 2012).
Longitudinal vehicle control can thereby completely be taken over by ACC. However, the driver turns
the system on and off, sets the desired speed and distance and has to monitor the systems
operation. Hence, ACC can either be seen as automation, located on level seven according to the
classification of Parasuraman et al. (2000), whereas according to the definition of Gasser (2012) it is
classified as driver assistance. Continuous monitoring is still required as ACC is not yet operative in
every situation due to sensor limitations. Problems in detecting objects ahead can, for instance,
occur at narrow bends, in adverse weather conditions, as well as with stationary or small vehicles.
Therefore, drivers need to acquire a realistic mental model of these limitations in order to use the
system in a safe and adequate manner (Rajaonah, Anceaux, & Vienne, 2006; Seppelt & Lee, 2007). A
comprehensive and systematic review on the development of ACC as well as research achievements
can be found in Xiao and Gao (2010).

20 Theoretical background
2.3 Mental models
2.3.1 Definition
Mental models have been studied to understand how humans make decisions, perceive, know, and
construct behaviour in a variety of environments. In the Human-machine-interaction domain, mental
models can be conceptualized as ...a rich and elaborate structure, reflecting the user's understanding
of what the system contains, how it works, and why it works that way” (Carroll & Olson, 1987, p. 12).
Durso and Gronlund (1999) define a mental model more precisely as a long-term memory knowledge
structure, that is, “... a representation of the typical causal interconnections involving actions and
environmental events that influence the functioning of the system” (pp. 297–298). The latter authors
point out that mental models, in the context of complex dynamic systems, differ from mental models
of static objects or abstract syllogism. In transportation research, mental models are considered
fruitful for explaining relevant cognitive processes (e.g. Bellet, Bailly-Asuni, Banet, & Mayenobe,
2009), and a correct mental model of ADAS functionality is considered fundamental to adequate use
of these systems (Kazi et al., 2007; Itoh, 2012; Rajaonah et al., 2006). Empirical evidence shows that
many ACC users are not aware of system limitations: Jenness, Lerner, Mazor, Osberg, and Tefft
(2008) reported in a survey study of 370 ACC owners that 72% were not aware of manufacturers’
warnings about system limitations. Therefore, they overestimated the ACC’s helpfulness in scenarios
where system technology has not been proven completely effective: approximately 25% of users
reported that ACC works fairly well or perfectly, when following a vehicle on a curvy road or in stop-
and-go traffic, and 43% when encountering a stopped vehicle in the lane ahead. The most frequent
methods for learning how to use ACC were the vehicle owner’s manual (67%) and on-road
experience (54%), where 15% reported on-road experience as sole learning method. Mehlenbacher,
Wogalter, and Laughery (2002) reported similar tendencies on reading the owner’s manual for
automotive vehicles: Approximately four of ten users did not read the manual at all and the rest read
about half of the manual. Larsson (2012) found that ACC users have difficulties understanding system
limitations, especially at the beginning. Hence, it cannot be assumed that all ACC users acquire a
comprehensive mental model of ACC before initial use.
2.3.2 Mental model construction and update
Estimating effects of incomplete or incorrect mental models requires a theoretical concept of how
mental models are constructed and updated. Durso, Rawson, and Girotto (2007) distinguish between
mental models and situation models. While the former is considered a general long-term memory
knowledge structure, the latter is formed in a particular situation and is built by environmental input
(bottom up) in connection with top-down knowledge structures. One mental model can therefore

21 Theoretical background
give rise to several situation models associated with particular situational characteristics. When using
an ADAS, a correct mental model of the system functionality is considered crucial for the
construction of an adequate situation model in real road situations (Cotter & Mogilka, 2007; Seppelt
& Lee, 2007). On the one hand, incorrect mental models can lead to the misinterpretation of
environmental input, and on the other hand, experience updates and corrects the mental model.
Theories from text comprehension research elaborate on the cognitive processes underlying the
interpretation and comprehension of a given situation (Baumann & Krems, 2007; Durso et al., 2007;
Krems & Baumann, 2009). The Construction–Integration Theory (Kintsch, 1998) assumes two stages
in the comprehension process: In the first construction-related phase, environmental input activates
knowledge stored in long-term memory (nodes) that is linked to the perceived information.
Activation in this first stage is considered rather diffuse and general. In the second integration phase,
bottom-up information is used to specifically select corresponding knowledge structures: compatible
elements within the activated knowledge network are activated, while incompatible nodes are
suppressed. Highly interconnected nodes accumulate activation while less activated nodes lose
activation. As a result, less-well-connected nodes may disappear from the knowledge network over
time (Durso et al., 2007). Through these inhibitory and excitatory processes, a coherent situation
model is formed. After the integration phase, the remaining network is restored in long-term
memory and retrieved in future processing cycles. However, updating the mental model requires
cognitive effort. The processing-load hypothesis (Zwaan, Radvansky, Hilliard, & Curiel, 1998) assumes
that the fewer aspects that are shared between an event and its mental model, the more difficult it is
to incorporate the event in the knowledge structure. Research in text and film comprehension (Durso
& Sethumadhavan, 2008) shows empirical evidence for this hypothesis. Thus, a more comprehensive
reorganisation of the mental model of ACC is expected to augment processing load, and influence
trust and acceptance negatively due to the mismatch between mental model and experience (Lee &
See, 2004).
2.3.3 Discussion of existing measures
Different tools and measures have been established to assess users’ mental models of ADAS. The
summary listed below describes pros and cons of selected techniques used in transportation
research and is mainly based on research performed in the AIDE project (Cherri, Nodari, & Toffetti,
2004):
• Focus groups are moderated group discussions that proceed according to a specific topic and
goal. Users can, for instance, discuss problems and experience with ADAS. The resulting
statements are usually recorded and a qualitative analysis is carried out. This method is a

22 Theoretical background
cheap and fast way to assess users’ understanding of a system. However, finding a
representative user group and ensuring good moderation are needed to ensure efficiency.
• In-depth interviewing, which is another qualitative method, invites users to talk freely about
important topics from their own point of view. A pre-defined topic-structure is used to guide
user–interviewer communication, but a natural conversation is sought for analysis. This
method helps researchers understand users’ mental models, thoughts, needs, desires,
doubts, motivations and issues related to resistance in a very free and individualized manner.
Skilled interviewers are required and data analysis can be expensive and challenging due to
the high amount of unstructured data.
• Self-reported diaries require users to regularly report in writing about their experience
during a certain period of time. Behavioural data related to system–user interaction is
typically recorded with the purpose of assessing the impact in everyday life. Diaries permit
the acquisition of data with high external validity over a long period of time. However, this
data is highly subjective and should be complemented by logger data or video recordings.
• Questionnaires are the most frequently used tool to assess the mental model of ADAS.
Because of the generality of application, they can be applied in every phase of system
development and evaluation. Answer formats may be free, single/multiple choice or rating
scales. Standardized questionnaires can be used across different systems, conditions or
experimental groups and can be easily administered to a high number of subjects. However,
topics and items must be designed and tested carefully beforehand to ensure that they are
self-explanatory.
• Task analysis involves the identification of system tasks that a user is willing to perform and
how efficiency can be optimized. The aim of this analysis is to identify cognitive and action
processes needed to achieve a task. Whole-system analysis can be performed, for example,
by mission/scenario analysis, function-flow diagrams or function allocation. User’s activities
can be assessed by operational sequence diagrams, timeline analysis, hierarchical task
analysis or GOMS models (Goals, Operators, Methods and Selection rules). Error analysis
techniques include event trees, fault trees and effect analysis.
• Decision trees facilitate the decision-making process by displaying a decision problem in the
form of a tree with several branches and endpoints. This format helps system designers
ensure that all possible decisions can be made correctly, and permits adequate user
interaction.
• Card sorting is used to identify how users potentially group and name items to arrange them
in an optimal way (e.g., icon positioning, menu structure). Card sorting is easy to conduct,
identifies potentially misleading terminology and optimum structure from a user’s point of

23 Theoretical background
view. Major drawbacks are that it does not depend upon a user’s task and it can become
difficult to administer and analyse when the item number increases.
• The “potato head” technique invites user’s to build their own instrumentation, for example,
select shape, dimension, colour, labelling and position of elements. It can be used, for
example, to design vehicular instrumentation.
Task analysis, decision trees, card sorting and potato head techniques primarily focus on the optimal
user-centred design of concrete systems. These techniques identify the most favourable design
configurations for optimizing user–system interaction, avoiding misleading terminology and analyzing
decision processes while performing tasks. Therefore, they work best in the design and evaluation
process of ADAS. However, it is difficult to apply these methods in a more general research
environment due to the very specific configurations of particular systems. Furthermore, most of
these techniques are costly, complex and time-consuming in terms of development, setup and
analysis.
Focus groups, in-depth interviews and diaries are primarily qualitative methods. They allow for a
detailed, flexible and individualized assessment of mental models. On the one hand, these
techniques are useful in exploring mental models, particularly in describing and explaining individual
experience and relationships. On the other hand, data analysis is mostly complex and time
consuming. Direct comparisons between or within subjects as well as statistical calculations are
difficult due to lack of standardization.
2.3.4 Development of the mental model questionnaire
A key objective of this PhD project is the development of new tools for assessing mental models in
the context of behavioural adaptation. Because behavioural adaptation is considered as a process,
the assessment tool should be able to track changes of the mental model over time. Moreover, it
should be possible to quantify how the mental model has changed, for example, due to interaction
with a system. In addition to within-subjects measurement, a comparison should also be possible
between subjects. This allows for statistical tests between groups with different characteristics, for
example, experimental groups. Furthermore, the tool should be based on a theoretical concept and
be amenable to adaptation to different ADAS. In sum, the development, administration and analysis
procedures should be as simple as possible.
To fulfil these requirements, a standardized questionnaire approach was chosen, based on the
mental model definitions stated in chapter 2.3.1: A user’s understanding of a system is intended as
the representation of causal interconnections between situational characteristics and system
functioning. Accordingly, questionnaire items were developed, focusing on concrete system
functionality in specific situations. A mental model questionnaire for ACC was developed and tested

24 Theoretical background
at Chemnitz University of Technology. The first version of the questionnaire included 37 items, all
focusing on ACC functions in specific situations. Subjects answered questions using a 6-point Likert
scale ranging from 1 (totally disagree) to 6 (totally agree), for example: “The system maintains a
predetermined speed in an empty lane”, “The system reacts to pedestrians in the traffic lane” or
“The system works during night time”. A pretest was done with 12 students at Chemnitz University of
Technology. They received a one-page description of ACC with different versions of information
about the system. Three distinct system descriptions contained either correct, incomplete or
incorrect information (see Chapter 5.2.5 for details). After reading the description, all participants
answered the mental model questionnaire and gave feedback regarding the item’s
comprehensibility. Pretest results showed that the questionnaire was able to distinguish between
the three groups. Two items were removed due to ambiguity.
The final mental model questionnaire consisted of 35 items. Five items focused on differences
between the incomplete information group and both of the other groups, for example, “The system
works with motorbikes”. The differences between the incorrect group and other two groups were
assessed by another four items, for example, “The system reacts to lead vehicles in the same lane
that are white”. The remaining 26 questions acted as distractor items focusing on common ACC
functionality, for example, “The system is overruled by depressing the brake pedal”. Further to
functioning as distractors, the latter items were also used to make sure that all participants fully
understood the general information about ACC. The complete questionnaire can be found in
Appendix 9.1 and results of the driving simulator study, where the questionnaire was administered,
are reported in chapter 5.3.1. The application of the questionnaire in a real driving context is
presented in chapter 6. This study assessed how users interpret statements given in the car
manufacturer’s manual concerning ACC, and how the interpretation changed over time due to
experience. Therefore, the mental model questionnaire used in the driving simulator study was
slightly adapted to the statements in the user’s manual. The full questionnaire used in the on-road
study can be found in Appendix 9.4.
2.4 Situation Awareness
2.4.1 Definition
The concept of SA originated in aviation research in the 1980s and became widespread among
several disciplines and work environments, such as power plant operations, anaesthesiology, military
activity, and automobile driving (Durso & Sethumadhavan, 2008). Increasing automation of the
driving task shows similarities with previous developments in other domains, such as aviation or air
traffic control, thus rendering the SA concept fruitful in connection with research of the effects of

25 Theoretical background
automation in driving (Popken & Krems, 2011). Although the concept of SA is considered well
established in the study of human factors in complex environments (Rousseau, Tremblay, & Breton,
2004), the literature shows a broad variety of definitions (see e.g., Breton & Rousseau (2001) for a
systematic classification of 26 SA definitions). The most common and widely used definition is from
Endsley (1988): “Situation awareness is the perception of the elements in the environment within a
volume of time and space, the comprehension of their meaning, and the projection of their status in
the near future” (p. 792). Based on this definition she developed a model with three levels of SA
(Figure 3, Endsley, 1995, p. 35).
Figure 3. Situation Awareness model (Endsley, 1995, p. 35; reprinted with permission).
• Level 1. Perception: The perception of status, attributes and dynamics of relevant elements
in the environment is fundamental to acquiring a correct picture of a situation. For example,
a car driver has to perceive the status and dynamics of other vehicles, his/her own vehicle
and surroundings obstacles.
• Level 2. Comprehension: Perceived elements on Level 1 need to be integrated into a holistic
picture of a situation. That is, an awareness of elements must be complemented by an
understanding of their significance in, and relationship to, a specific context. A driver, for
example, needs to understand that red lights displayed by a leading vehicle signal that the
car is braking.

26 Theoretical background
• Level 3. Projection: Perception and comprehension form the basis of projecting future
actions of elements in the environment. The highest level of SA allows for anticipating future
events and timely decision making. If a driver, for example, perceives and understands the
blinking light of a leading car, he can predict a turning manoeuvre.
SA influences decision making, and subsequent actions change the state of the environment, which
in turn begins a new cycle of perception starting with Level 1. The whole process is influenced by
task/system characteristics as well as individual factors.
2.4.2 Relationship between mental models and Situation Awareness
The relationship between SA and mental models is conceptualized by Endsley (2000, p. 62) as
depicted in Figure 4. In her definition, “Mental models embody stored long-term knowledge about
these systems that can be called upon to direct problem solving and interaction with the relevant
system when needed” (p. 61). Mental models represent rather static knowledge about system
functionality, which however grow and evolve with experience. In contrast, a situation model is
considered “... very dynamic, representing the human’s knowledge and understanding of the present
state of the system” (Endsley, 2000, p. 62). As described in Chapter 4.1, Durso et al. (2007) make the
same distinction between mental model and situation model. Endsley (2000) uses situation models
and SA synonymously as the levels of perception, comprehension and projection of future states.
Situation models are considered largely influenced by a person’s mental models, which guide
attention to specific aspects of a situation, influence how this information is interpreted and
therefore affect projections about future states.
Figure 4 Relationship between mental model and Situation Awareness (Endsley, 2000, p. 62; reprinted with
permission).

27 Theoretical background
2.4.3 Situation Awareness as comprehension process
Recent approaches define SA as a comprehension process, analogous to theories of reading
comprehension (Baumann & Krems, 2007; Durso et al., 2007; Krems & Baumann, 2009). In these
examples, further to Endsley’s model, cognitive mechanisms underlying the construction of SA are
specified in detail. In particular, the perception of new elements in a situation (bottom-up processes)
activates associated knowledge structures in long-term memory (top-down processes), according to
the two-stage Construction–Integration Theory by Kintsch (1998). This process forms the actual
“mental situation model”, which triggers the activation of coherent actions, which in turn effects
change in the situation, and subsequently demands updating the situation model. As the amount of
available information exceeds the capacity of working memory, an additional mechanism is
postulated: long-term working memory stores the excess information, but provides it immediately
when it becomes relevant. The schemata stored in long-term memory encodes experience of
different driving situations and therefore also knowledge about the functions of assistance systems.
Analogous to findings in reading comprehension research (Zwaan, Magliano & Graesser, 1995), an
inappropriate mental model hinders and delays the comprehension process. Moreover, experience
that demand reorganisation of the mental model due to the addition of new information should
result in higher cognitive load (processing-load hypothesis, Zwaan et al., 1998).
2.4.4 Discussion of existing measures
SA measurement techniques have mainly been developed and applied in aviation research. There are
several proposed classifications of SA assessment methods, including Durso and Gronlund (1999),
who propose three general approaches: subjective measures, query methods and implicit
performance measures.
1) Subjective measures: Subjective measures are based on self-reports from system operators.
One of the most often used techniques is the Situation Awareness Rating Technique (SART;
Taylor, 1990). Operators indicate their demand on the dimensions attentional resources,
attentional supply and understanding. A comprehensive SA score can be calculated from the
three dimensions. Several studies have been carried out to investigate the validity and
sensitivity of the SART scale (for an overview see Jones, 2000). Other subjective measures
are, for example, the Situation Awareness-Subjective Workload Dominance (SA-SWORD;
Vidulich & Hughes, 1991) technique, and the Situation Awareness Rating Scales (SARS; Waag
& Houck, 1994) technique.
2) Query methods: The most prominent query method is the Situation Awareness Global
Assessment Technique (SAGAT, Endsley, 1990). This technique only works in simulation: At
random points the simulation is stopped, all information is removed and operators are asked

28 Theoretical background
questions about the situation. In aviation, these questions focus, for example, on the
location, speed, altitude, etc. of other planes whereas in driving the questions focus, for
example, on the position and behaviour of other vehicles or traffic rules in the driving
context. A driving version of SAGAT was developed by Gugerty (1997).
3) Implicit performance measures: Using performance-based measures, researchers make
inferences on SA based on actions of the operator. SA performance measures in driving
include, for example, lane keeping and responsiveness to critical events (Ward, 2000).
However, this procedure requires specifically designed situations, where optimal and poor SA
can be distinguished (Pritchett & Hansman, 2000). Event-based SA measures require subject
reactions in the face of predefined events (Gugerty, 2011). Speed and accuracy of the
responses indicate the evaluative quality of the SA. The Situation Present Awareness Method
(SPAM; Durso, Bleckley, & Dattel, 2006) uses a procedure similar to the SAGAT method,
where a simulation freezes at unpredictable times. In contrast to the SAGAT, however, the
scenario remains visible. Operators respond to one or two questions and response time is an
implicit performance measure of SA.
The main criticism of subjective measures is that operators cannot possibly be aware of their own SA
(Jones, 2000). Operators report what they perceive and know, and this may differ from a real-life
situation. Furthermore, subjective SA ratings are highly influenced by self-assessment of
performance. Finally, errors and systematic bias in human judgement and memory undermine self-
reported results. However, subjective measures provide insights into underlying cognitive processes
involved in SA ratings and provide an indication of an operator’s confidence level regarding his SA.
The latter is considered an important aspect of an operator’s job satisfaction and performance
(Durso & Gronlund, 1999).
Query methods remove the problem of collecting SA data after task completion as they are applied
in the situation itself. Furthermore, tools such as SAGAT are subject to numerous validation studies
and directly assess SA using objective and unbiased data. However, query methods require
simulators and therefore, cannot be applied in the field or in real time. Further, freezing a simulation
is artificial and intrudes on the primary task; that is, questions posed could affect what aspects of the
situation that operators look for. Finally, query methods, as well as subjective methods, focus on
conscious and explicit knowledge, whereas implicit aspects cannot be assessed. This is critical in the
driving domain, as many processes are skill-based and therefore automated and unconscious.
The major drawback of implicit performance measures is the indirect measurement approach. In
particular, this approach may not reflect actual SA level, as poor performance can result from factors
other than low SA and vice versa. The main advantage of performance measures is that they can be
collected objectively and non-intrusively. Moreover, implicit knowledge of a situation is brought into
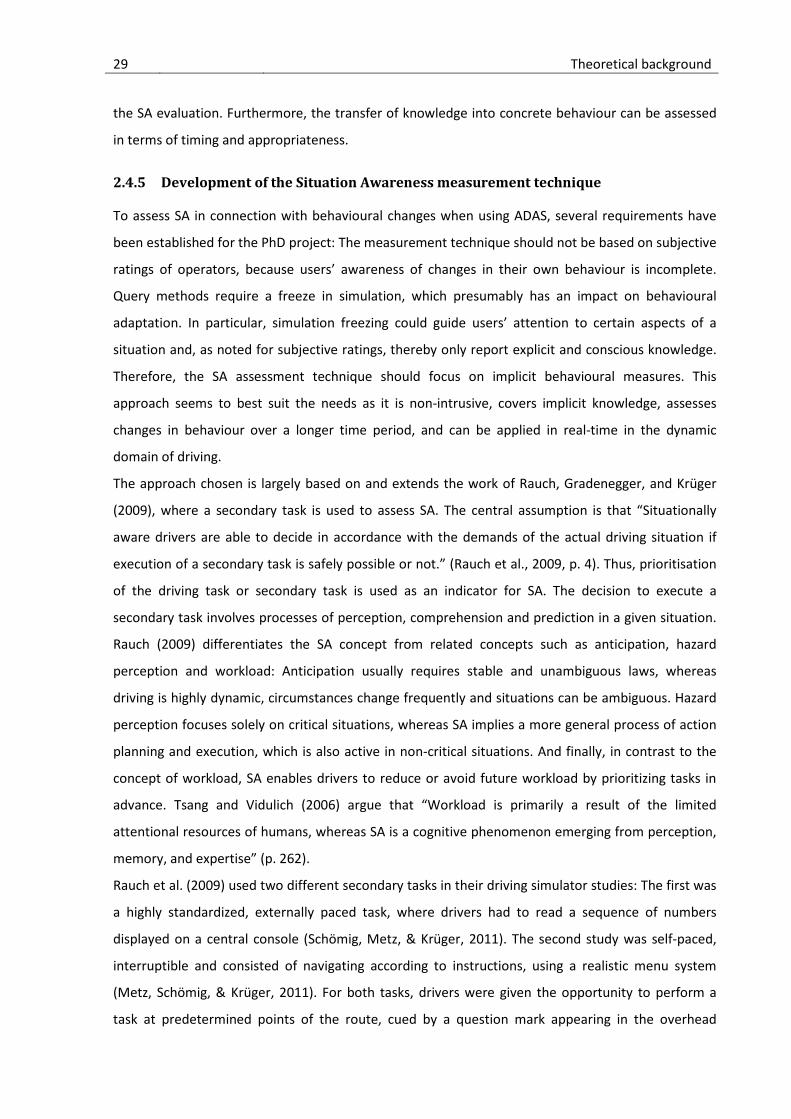
29 Theoretical background
the SA evaluation. Furthermore, the transfer of knowledge into concrete behaviour can be assessed
in terms of timing and appropriateness.
2.4.5 Development of the Situation Awareness measurement technique
To assess SA in connection with behavioural changes when using ADAS, several requirements have
been established for the PhD project: The measurement technique should not be based on subjective
ratings of operators, because users’ awareness of changes in their own behaviour is incomplete.
Query methods require a freeze in simulation, which presumably has an impact on behavioural
adaptation. In particular, simulation freezing could guide users’ attention to certain aspects of a
situation and, as noted for subjective ratings, thereby only report explicit and conscious knowledge.
Therefore, the SA assessment technique should focus on implicit behavioural measures. This
approach seems to best suit the needs as it is non-intrusive, covers implicit knowledge, assesses
changes in behaviour over a longer time period, and can be applied in real-time in the dynamic
domain of driving.
The approach chosen is largely based on and extends the work of Rauch, Gradenegger, and Krüger
(2009), where a secondary task is used to assess SA. The central assumption is that “Situationally
aware drivers are able to decide in accordance with the demands of the actual driving situation if
execution of a secondary task is safely possible or not.” (Rauch et al., 2009, p. 4). Thus, prioritisation
of the driving task or secondary task is used as an indicator for SA. The decision to execute a
secondary task involves processes of perception, comprehension and prediction in a given situation.
Rauch (2009) differentiates the SA concept from related concepts such as anticipation, hazard
perception and workload: Anticipation usually requires stable and unambiguous laws, whereas
driving is highly dynamic, circumstances change frequently and situations can be ambiguous. Hazard
perception focuses solely on critical situations, whereas SA implies a more general process of action
planning and execution, which is also active in non-critical situations. And finally, in contrast to the
concept of workload, SA enables drivers to reduce or avoid future workload by prioritizing tasks in
advance. Tsang and Vidulich (2006) argue that “Workload is primarily a result of the limited
attentional resources of humans, whereas SA is a cognitive phenomenon emerging from perception,
memory, and expertise” (p. 262).
Rauch et al. (2009) used two different secondary tasks in their driving simulator studies: The first was
a highly standardized, externally paced task, where drivers had to read a sequence of numbers
displayed on a central console (Schömig, Metz, & Krüger, 2011). The second study was self-paced,
interruptible and consisted of navigating according to instructions, using a realistic menu system
(Metz, Schömig, & Krüger, 2011). For both tasks, drivers were given the opportunity to perform a
task at predetermined points of the route, cued by a question mark appearing in the overhead

30 Theoretical background
display. Within a given amount of time, drivers decided whether or not to accept the offer by
pushing a button on the steering wheel. Results show that drivers adapted their interaction with
secondary tasks depending on the predicted demands of the situation; this was used as indicator for
SA (Rauch et al., 2009).
The measurement approach used in the present PhD project is based on the same principles, but
differs in the type of secondary task used. The secondary task is continuously present and
participants are instructed to solve as many of these tasks as possible, while driving safely. The
opportunity to complete a secondary task is always present, and thus allows continuous and
sensitive measurements for the duration of a simulator trial by calculating the frequency of solved
tasks within a certain time period. To obtain a sufficient number of responses, a relatively easy task
must be chosen that can be processed continuously and quickly. The Surrogate Reference Task
(SURT, Mattes, & Hallén, 2009) meets these requirements. Details about the setup can be found in
chapter 5.2.3. Based on the definition of SA given in the beginning of this chapter, the frequency of
secondary tasks solved should decrease with an increase in the demands of a situation.
2.5 Learning, acceptance and trust in automation
2.5.1 Power law of learning
ACC cannot handle every situation due to sensor limitations and the driver is required to take over
manual control. In order to use ACC in a safe manner, drivers need to know these limitations and
learn how to handle these situations (Seppelt & Lee, 2007; Rajaonah et al., 2006). A psychological
theory for describing learning phenomena as a quantitative relation between the amount of practice
and task performance is the “power law of practice”, also referred to as the “power law of learning”,
developed by Newell and Rosenbloom (1981). Task performance is not conceptualized as a linear
function of the number of learning trials, but as an asymptotic power curve where performance
steeply increases in the beginning and subsequently levels out into a performance plateau. The
general equation of the power law is given by
P(N|a, b, c) = a + bN-c
The predicted performance, P, at session, N, is a function of the three free parameters, a, b and c.
The parameter “a” represents the asymptote (stabilized performance at the end of the learning
process), “b” is the amplitude at the beginning of the training (difference between initial
performance and asymptote), and “c” is the curvature which corresponds to the learning rate
(Lacroix & Cousineau, 2006). The power law of learning has been applied to numerous learning

31 Theoretical background
phenomena such as perceptual-motor skills, memory, perception, decision, motor behaviour and
problem solving (see overview in Lacroix & Cousineau, 2006). In the driving context, the power law
has been applied to model the learning process when using regenerative breaking in electric vehicles
(Cocron et al., 2013). Jahn, Krems, and Gelau (2009) fitted the power law to describe skill acquisition
in operating in-vehicle information systems. In the current on-road study, the power law of learning
is applied to model the learning process, as well as the development of acceptance and trust in ACC.
2.5.2 Acceptance
Acceptance is considered a precondition for ADAS to achieve the benefits they claim (Martens &
Jenssen, 2012; Najm, Stearns, Howarth, Koopmann, & Hitz, 2006). Recent acceptance models such as
e.g. the Automation Acceptance Model (Ghazizadeh, Lee, & Boyle, 2012) highlight the mutual
relation between attitudes towards automated systems and actual use. Despite numerous studies on
acceptance of driver assistance systems, neither a common definition nor a standardized
measurement procedure is available. Definitions of acceptance range from attitude approaches to
observable behaviour in terms of actual use (Adell, 2010). In this PhD project, acceptance is defined
as an individual’s direct attitude towards the system, following the approach of Van der Laan, Heino,
and De Waard (1997). A common ground in acceptance research is the fact that human behaviour is
not primarily determined by objective factors, but by subjective perceptions (Ghazizadeh et al.,
2012). Hence, acceptance is based on individual attitudes, expectations and experience as well as the
subjective evaluation of expected benefits (Schade & Baum, 2007). As a result, personal importance
is considered to have a greater effect on acceptance than the degree of technological innovation
(Ausserer & Risser, 2005). The user-centered design approach represents a product design
philosophy where human factors are of central concern within the design process. This means that
user acceptance, requirements, goals, and user tasks are incorporated as early as possible into the
design of a system, when the design is still relatively flexible and changes can be made at least cost
(Czaja & Nair, 2012). Assessing user acceptance at different stages of the product development
process is considered a precondition for creating successful products. As long as customers’ opinions
are not integrated in the development process, maximum market success can hardly be reached
(Adell, 2010).
2.5.3 Trust in automation
Trust is considered a key variable for reliance on, and misuse/disuse of automated systems (Lee &
See, 2004; Kazi et al., 2005). Whereas reliance means concrete observable behaviour, trust is defined
here as “...the attitude that an agent will help achieve an individual’s goals in a situation
characterized by uncertainty and vulnerability” (Lee & See, 2004, p. 51). Studies by Muir (1994) and

32 Theoretical background
Muir and Moray (1996) concluded that experience and practice improve trust in automated systems
and trust varies as a function of systems reliability. Accordingly, substantial empirical evidence shows
that a decline in trust is caused by faults in automation (Lee & See, 2004). The effect of such faults
depends mainly on its predictability than on its magnitude. Therefore, a discrepancy between the
operator’s expectations and the behaviour of the automated system can undermine trust even when
the system performs well (Lee & See, 2004). However, the results regarding trust development and
ACC reliability are inconsistent: In a driving simulator study, Rajaonah et al. (2008) did not find any
relationship between ACC use and different kinds of trust. Similarly, Stanton and Young (2005)
concluded that trust was unaffected by ACC use. Kazi et al. (2005) reported no significant differences
between the reliability of driving trials and trust in ACC. Furthermore, reliability of automation did
not influence drivers’ developing a correct mental model of ACC, and therefore, the authors
recommend driver training and education. In a subsequent 10-day longitudinal driving simulator
study (Kazi et. al, 2007) with three ACC reliability conditions (100%, 50%, 0%), results showed an
influence of automation reliability on trust. Trust increased over time for the reliable group, but the
other groups showed inappropriate trust in relation to reliability level. Additionally, drivers
developed inaccurate mental models of ACC that were consolidated in a short time. Similar findings
were reported in the test-track study of Rudin-Brown and Parker (2004), where drivers’ trust in ACC
increased after using the system, despite a simulated system failure. The present PhD project
proposes that drivers’ initial mental model of ACC may be a possible explanatory variable for the
diversity of results.
2.5.4 Related research on learning, acceptance and trust in ACC
Weinberger, Winner, and Bubb (2001) carried out a field test with ACC over four weeks to assess the
learning process. Participants reported that they were familiar with ACC controls and displays after
about two weeks or 2,800 km of driving. After one to two weeks or 2,000 km of driving, participants
felt confident in handling take-over situations. In general, the greatest learning progress was
observed in the first two weeks, stabilizing afterwards. However, the ACC usage rate has not been
controlled and the assessment rate of the learning parameters was rather low (once per week).
Moreover, the study sample of 15 participants consisted of only male persons between the ages of
30 and 62 driving luxury class cars with a relatively high driving mileage of 1,400 km per week. One
aim of the present on-road study is to validate these results with a sample of younger drivers,
balanced in gender and with less mileage. Simon (2005) carried out a similar field test to assess ACC
learning and acceptance. Five participants with no ACC-experience drove a test vehicle outfitted with
ACC and recording equipment for an average period of 16 days (mean driving distance = 2,800 km,
mean ACC usage/km = 60%). Retrospective data on the learning process collected after the
33 Theoretical background
conclusion of the experiment revealed that users were familiar with ACC functionality after a period
of two days and reported a “seamless collaboration with ACC” after approximately four days of use.
However, the strength of these results is limited due to the low number of participants and potential
bias in retrospective data after long time periods. Similar results on the learning process are reported
by Ojeda and Nathan (2004). A sample of eight participants drove a test vehicle equipped with ACC
on a predefined itinerary once a week during a total period of four weeks. After a steady growth in
drivers’ self-reported knowledge and understanding of ACC in the beginning, parameters stabilized
after approximately 360 km of driving. Comfort and ease-of-use ratings show an increasing trend
across all four trips. The findings of this study are limited due to the rather small sample size and the
limited number of trials. A theoretical “satisfaction index” during the period of ACC-usage is
proposed by Winner, Barthenheier, Fecher, and Luh (2003). Users with no prior ACC-experience
would try the system with a certain amount of scepticism in the beginning. When discovering the
functionality and benefits in the first minutes of use, a peak of satisfaction is reached. However, after
about half an hour of use, a sharp decline of satisfaction below the initial level is expected due to the
experience that the system cannot handle all situations. Afterwards, satisfaction is expected to
increase steadily over hours of usage until reaching a plateau. However, empirical data in support of
this theoretical index is lacking.

34 Overall research questions
3 Overall research questions
Based on the identified knowledge gaps in current research, both the driving simulator study and the
on-road study carried out in this PhD project focussed on the development of trust, acceptance and
the mental model of novice users when interacting with ACC. In addition, real-time SA was assessed
in the driving simulator study and the learning process was modelled in the on-road study, based on
the power law of learning.
The driving simulator study answers the following research questions: What is the effect of different
initial mental models of ACC when experiencing the same situations? How are trust and acceptance
affected by either a correct, incomplete and incorrect ACC description? How do trust, acceptance
and the mental model evolve over time in these groups? What is the price of acquiring a realistic
mental model of ACC by trial and error? How is SA affected by the initial mental model in situations
where automation failures occur due to ACC limitations? How does SA evolve given this experience?
The on-road study is a continuation of the driving simulator study under realistic conditions,
answering these research questions: How do trust and acceptance develop under real conditions
when having full information from the owner’s manual? Do trust and acceptance increase
continuously or do they decline after an initial peak? Does trust and acceptance eventually stabilize
and at what point does this occur? How can the learning process be described? Does the learning
process correspond to the power law of learning that has been observed in other domains? When
does learning end in terms of stabilization? How appropriate is the mental model of ACC functionality
that is created as a result of reading the owner’s manual? Which aspects of the mental model change
due to experience? How does objective ACC usage evolve?
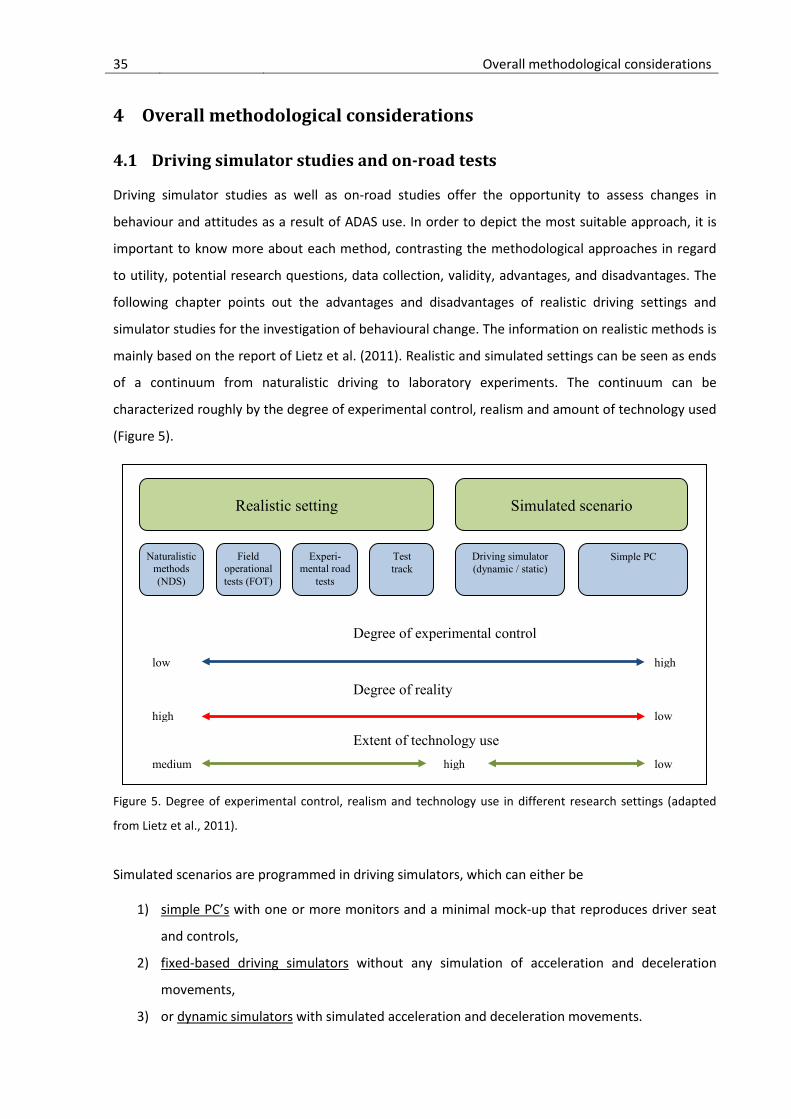
35 Overall methodological considerations
4 Overall methodological considerations
4.1 Driving simulator studies and on-road tests
Driving simulator studies as well as on-road studies offer the opportunity to assess changes in
behaviour and attitudes as a result of ADAS use. In order to depict the most suitable approach, it is
important to know more about each method, contrasting the methodological approaches in regard
to utility, potential research questions, data collection, validity, advantages, and disadvantages. The
following chapter points out the advantages and disadvantages of realistic driving settings and
simulator studies for the investigation of behavioural change. The information on realistic methods is
mainly based on the report of Lietz et al. (2011). Realistic and simulated settings can be seen as ends
of a continuum from naturalistic driving to laboratory experiments. The continuum can be
characterized roughly by the degree of experimental control, realism and amount of technology used
(Figure 5).
Figure 5. Degree of experimental control, realism and technology use in different research settings (adapted
from Lietz et al., 2011).
Simulated scenarios are programmed in driving simulators, which can either be
1) simple PC’s with one or more monitors and a minimal mock-up that reproduces driver seat
and controls,
2) fixed-based driving simulators without any simulation of acceleration and deceleration
movements,
3) or dynamic simulators with simulated acceleration and deceleration movements.
Realistic setting Simulated scenario
Naturalistic methods (NDS)
Field operational tests (FOT)
Test track
Driving simulator (dynamic / static)
Simple PC Experi-mental road
tests
Degree of experimental control
low high
Degree of reality
high low
Extent of technology use high low medium

36 Overall methodological considerations
In contrast to simulated scenarios, realistic settings require participants to drive a real car. Realistic
settings can be divided into four types:
1) Naturalistic driving studies (NDS): Participants usually drive an instrumented car for a certain
period of time on their usual routes without any limiting instructions. Data is recorded
continuously.
2) Field operational tests (FOT): In contrast to an NDS, an FOT aims to investigate the effect of
one or more independent variables (e.g., assistant systems, different groups, different
conditions, etc.) on driving behaviour. Natural driving behaviour is recorded continuously
such as in the NDS. The experimental design of an FOT allows for limited hypothesis testing
and manipulation of conditions.
3) Experimental road tests: These tests concern experimentations carried out with
instrumented cars in real traffic conditions on a predefined test route. In order to cover
different experimental conditions, participants often have to drive the same test route
several times.
4) Test tracks: In contrast to the three former tests, participants of test track studies drive the
car on specifically designed and usually not public roads. This allows for higher control over
the route and testing of for example infrastructure measures. Although the conditions are
more artificial than in an NDS or FOT, the real road setting provides greater external validity
than simulator studies.
One major advantage of driving simulator studies over realistic settings is the high controllability,
reproducibility and standardisation. This allows for specific experimental manipulation of conditions,
including the possibility of simulating critical situations. Data acquisition is cheaper and easier than
data collection under realistic conditions. Driving simulator studies also admit a broader range of
measurements with good data quality. Possible disadvantages are low fidelity, simulator sickness and
lacking validity. On the other hand, realistic settings are characterized by a naturalistic and realistic
driving experience ensuring high external validity and allowing for the assessment of naturalistic
driving behaviour. Especially for assessing long term behavioural changes, naturalistic methods offers
advantages as several participants can unobtrusively drive instrumented vehicles in parallel for a
longer period of time, that is, months or even years. Continuous recording of different behavioural
data allows for detailed analysis of gradual changes over a longer period of time. However, one
challenge of naturalistic methods is to handle and especially filter the huge amount of data in order
to extract meaningful indicators. This issue is connected to one of the major drawbacks of naturalistic
methods, i.e. missing experimental control. Under naturalistic driving conditions, many factors such
as road type, weather conditions, traffic density, etc. may influence driver behaviour and can neither

37 Overall methodological considerations
be controlled nor completely assessed. Therefore conclusions drawn from post-hoc analysis are
rather limited to a mainly explorative character in contrast to hypotheses-driven experimental
studies.
One methods’ inherited inconvenience is the other methods advantage, making both methods
complimentary, an aspect to keep in mind when assessing behavioural changes effectively and
efficiently on different levels. Understanding the benefits and drawbacks of each method will ensure
experimental designs that go beyond the capabilities provided by each method individually and
provide useful insights into behavioural changes.
4.2 Database-framework for data storage and analysis
In order to store and analyze the huge amount of data resulting from the simulator and on-road
study performed in this PhD project, a storage and analysis framework has been set up (Figure 6).
The core component is the relational open-source database management system (DBMS) PostgreSQL
9.1. All tools for data pre-processing as well as the analysis tools access the DBMS using the
Structured Query Language (SQL). SQL is standardized by the ISO 9075, which allows for a common
access procedure using various software products.
In comparison to classical analysis tools in social science such as SPSS, Excel, R or STATA, relational
databases offer some advantages (Mahrt, 2006):
• Minimal data redundancy due to separate tables and relations between tables
• Improved data consistency due to the guarantied database-principle of reliable
“transactions”, founded on the ACID-properties (Atomicity, Consistency, Isolation, Durability)
• Improved data accessibility due to the client-server-principle, permitting parallel access by
multiple users and sophisticated rights management
• Program-data independence, allowing access using various software products
• Amount of data only limited by hardware resources
• Only one server needs extended hardware resources for executing queries; clients send
requests and receive the results
• All data is stored in one place, which simplifies backup and avoids confusion regarding most
recent data
These database features are especially useful when dealing with large, heterogeneous and related
datasets, such as sensor data with different frequency, questionnaires, video and interview data
collected in one study.

38 Overall methodological considerations
Figure 6. Database-framework for data storage and analysis.
The decision to use PostgreSQL as DBMS is based on a previous work at Chemnitz University of
Technology (Lietz et al., 2008), where PostgreSQL 8.2 was tested and compared to Microsoft SQL
Server 2005, Oracle 10 and MySQL 5.0 for the use-case of naturalistic driving studies. PostgreSQL
resulted as the most stable and fastest DBMS in executing queries on large datasets, it is free and
easy to install on various operating systems, documentation is comprehensive and the included
geospatial database extension PostGIS offers excellent opportunities for analyzing geographical data
such as GPS data. In addition to these test results, recent PostgreSQL versions starting from 9.0
include as well extended OLAP-functionalities such as common table expressions and window
functions (it-novum GmbH., 2011). These functionalities provide powerful tools for structuring and
aggregating data and were used for analyzing secondary task engagement in the simulator study,
ACC usage patterns in the on-road test and in general for identifying, extracting and analyzing
sequences of behaviour (e.g. glance sequences before lane changes, see Beggiato & Krems, 2013c).
In line with previous experience from UMTRI (LeBlanc et al., 2006) and VTTI (Dingus et al., 2006)
regarding the optimal data structure, media files such as video, pictures or audio are not stored
entirely inside the database. These files are located on a separate fileserver and the database tables
only contain a reference, e.g. the filename and frame number for each video. This structure allows
for keeping the database size smaller and therefore faster, whereas the link to the media files is
always present.
Analysis
Storage
Raw data
Prepro-cessing
Database (PostgreSQL)Core component – connects
everything
Sensor / Logdata(different
frequency, textfiles)
Internet calendar
Server for mediafiles(Video, audio, pictures,
documents) Referenced in DB
Videoannotation (ELAN)
Visualization (DIADEM)
Statistical analysis
(SPSS, EXCEL, R, STATA)
Graphical SQL client (Navicat, SQL-Manager…)DB-Management, queries,
import/export, OLAP…
Video (different formats / framerate)
VirtualDUB, AVIsynth
Texteditor, Excel, Parser, R, DB-Script
Analysis interviews (MAXQDA)
Audio (mp3) Interviews
F4 (transcription)
Questionnaires (online / paper)
Reference
FrameworkNT / Carai

39 Overall methodological considerations
Despite of all advantages listed above, databases do not replace classical analysis tools but extend
them. In the data analysis process, databases cover the storage and retrieval parts (Figure 7),
whereas statistical analysis is still performed by common tools. The main operations inside the
database concern structuring and aggregating data, which indeed is the main analysis step for large
and heterogeneous datasets. The use of a database is especially indicated when dealing with large
datasets (i.e. more than 1 million records), with relational data, when data sharing or parallel access
is required, for persistent storage and when complex retrieval procedures are needed.
Figure 7. Use cases and positioning of databases in the research process.
Alongside the benefits of a database, new challenges arise for social scientists. Firstly, the complexity
of the data structure increases due to several related tables. However, this fact is mainly related to
the inherent complexity of the studies, e.g. when using different assessment methods such as video,
interviews and multiple sensors. Databases help to deal with data complexity and do not create it.
Secondly, installation and management of the DBMS is required. Due to the client-server principle,
the DBMS runs on one server and it is not installed on every researcher’s computer. Installation and
management including rights management, backup strategy, failsafe hardware configuration... etc.
should preferably be carried out by one specialized person, i.e. a computer scientist. However, as a
third challenge, researchers need to acquire knowledge about the database, especially about
querying the database using SQL. This task should preferably not be sourced out to computer
scientists, because
Data acquisition• Questionnaires• Text• Video• Audio• Sensor data
(car, eye tracking, physiological data…)
• ...
Storage Retrieval Analysis
Database
Excel
SPSS
Use cases Database• Big datasets (>1 Mio)• Relational data• Data sharing• Persistent storage• Complex retrieval
R, Matlab, Stata...

40 Overall methodological considerations
1) researchers should have direct and immediate access to the data,
2) knowing the extended analysis potential of databases (e.g. OLAP-functions) offers new
opportunities for data analysis,
3) researchers know their data best and should be able to explore, check and “play” with the
data without restrictions and
4) due to the constant and irreversible growth of measurement data in research (e.g.
physiological data, eye-tracking data, video, GPS, web-logfiles... etc.), social scientists should
acquire analysis competence for this type of data to be ready for future research challenges.
To face this challenge of enabling social scientists to use databases, a database for storage and
analysis of behavioural data has been setup and tested within the ADAPTATION Project (Pereira, Lietz
& Beggiato, 2014). The aim was to develop and implement an easy access to a specifically designed
database to facilitate the storage, joint access, analysis and integration of different data types
collected in the various studies. For this purpose, a PostgreSQL database has been implemented in
combination with an easy-to-use graphical web-interface providing the most important SQL-
functionalities such as data selection, create/modify, filter and search functions along with
upload/download features. Several user tests took place showing that the researchers were generally
favourable about the concept and were able to deal with the database. However, it required
additional time to transform data in order to fit into the database structure and the web interface
allowed for only limited data upload/download and restricted SQL-functionalities.
This experience led to a change in the strategy. Instead of developing tailor-made, use-case specific
and therefore necessarily restricted tools for interacting with the DBMS, a new and more general
approach has been adopted. Researchers should be enabled to use existing tools for directly
accessing the DBMS including an easy access to the full range of SQL-features. This strategy allows
for using all database functionalities without restrictions, starting from the creation of appropriate
data structures, data import and immediate access to the creation of analysis queries. There are
several open-source as well as commercial SQL-management tools available for PostgreSQL,
providing a graphical user interface (overview at https://wiki.postgresql.org/wiki/
Community_Guide_to_PostgreSQL_GUI_Tools). After testing various tools, the commercial Software
NAVICAT premium (www.navicat.com, see Figure 8) performed best for several reasons: It provides
an easy and well-designed graphical interface, several assistants for importing and exporting data, a
graphical SQL-builder and the possibility to simultaneously connect to MySQL, MariaDB, SQL Server,
Oracle, PostgreSQL, and SQLite databases from a single application. The latter feature offers a future-
proof way for interacting with different DBMS and has already been used in a project with the
German Aerospace Center (DLR) in Braunschweig for accessing their Oracle database.

41 Overall methodological considerations
Figure 8. Graphical SQL-management tool NAVICAT premium.
However, this new approach needs more effort in learning how to use the SQL-management tool. To
systematically train social scientists, a 4-day-seminar has been developed and carried out twice at
the Professorship of Cognitive and Engineering Psychology (a detailed description of the seminar
contents can be found in Appendix 9.5). The seminar includes all necessary steps from deciding if a
database is needed to the installation procedure, structure design, data import, simple to complex
queries and exporting/accessing aggregated data from other analysis tools. All tasks are immediately
trained by working with the real database of the driving simulator experiment presented in chapter
5. This seminar formed the basis for other researchers and students to perform secondary data
analysis of already collected data with new research questions. Data from the driving simulator study
and the field test presented in this thesis has been reused for additional multidisciplinary
publications with a different focus (Schmidt, Beggiato, Hoffmann, & Krems, 2014) as well as for
several master’s and bachelor’s theses (Göbel, 2012; Grieger, 2013; Klamroth & Winkler, 2013;
Metzner, 2012; Schmidt, 2012; Schwarzwäller, 2013). Currently, data of seven studies is stored in the
database framework with a total of more than 200 million records.

42 Driving simulator study
5 Driving simulator study
5.1 Aims and research questions
The driving simulator study systematically investigates the effect of divergent initial mental models
of ACC (i.e., varying in correctness), using the same system in identical situations. The main research
questions focus on how different initial mental models of ACC affect system trust and acceptance
over time and how a user’s mental model evolves with experience. Possible confounding effects
related to driver characteristics are controlled for using a matched sample approach. Preliminary
information is used to induce a distinct initial mental model by stating a different number of
potential system limitations. All participants drive the same simulator track using the same ACC
system three times, within a 6-week period; however, initial information differs in each of the three
scenarios. Regarding the development of a mental model it is hypothesized that:
• The provision of distinct preliminary information induces a correspondingly different mental
model about system functionality, prior to using an ACC system for the first time.
• With experience, a user’s mental model converges towards a realistic view of system
capabilities. According to construction–integration theory (chapter 2.3.2), expected but not
experienced limitations become less activated in the mental model network, and therefore,
tend to be forgotten over time. Conversely, unexpected but experienced limitations have the
greatest impact due to the need for restructuring the existing mental model.
For trust and acceptance it is assumed that:
• The more initial information given about potential system problems, the lower initial trust
and acceptance of the system after reading the description.
• For the group presented with the correct system description, trust and acceptance increase
steadily due to the correspondence of mental model and experience. The same trend is
assumed when drivers are presented with information about potential problems that do not
actually occur during driving. Due to the expected weaker impact of expected but not-
experienced problems, trust and acceptance should reach almost the same level over time as
in the correct group; however, starting from the lowest initial level (see previous hypothesis).
• When omitting preliminary information about potential problems that later actually occur
during driving, trust and acceptance are expected to decrease steadily over time. The trial-
and-error strategy alone, without accompanying explanation of system limitations, is
insufficient for the recovery of trust and acceptance.

43 Driving simulator study
5.2 Method and material
5.2.1 Sampling and participants
To control for relevant confounding factors, the study was designed using a matched sample
approach, based on the model of Cotter and Mogilka (2007, chapter 2.1). All participants drove on
the same simulator track using the same ACC system; therefore, the model factors “situation” and
“system” were controlled. To match relevant driver characteristics, a two-step sampling procedure
was applied. In a first phase, participants younger than 30 years possessing a valid driver’s license
could apply for the study by completing an online questionnaire about ADAS knowledge and
experience, driving experience and demographic information. In a second step, 51 out of 396
applicants were selected by excluding participants with ACC experience or extensive system
knowledge, and balancing gender, age and driving experience to obtain a homogeneous sample. A
second online questionnaire was sent to the 51 candidates, assessing sensation seeking (BSSS, Hoyle
et al. 2002), locus of control (driving internality–externality scale, Montag & Comrey, 1987), driving
style (Popken, 2009) and a short 10-item version of the Big Five Inventory (BFI-10, Rammstedt &
John, 2007). Upon arrival at the driving simulator, a paper-and-pencil perceptual speed test (ZVT
“Zahlenverbindungstest”; Oswald & Roth, 1986) was conducted. Finally three experimental groups
were created with 17 participants each, balanced in all confounding variables. The final sample
consisted of 25 male and 26 female students showing no statistical differences between the three
groups (Table 2, p ranging from .454 to .951).
Table 2. Sample characteristics and results of the matching process.
Variable Mean SD Between-group comparison
Statistical significance (p)
Gender χ2 (2, 51)=.157 .925 Age (years) 24 2.37 F(2,48) = .145 .865 Total km driven 52,255 47,329 F(2,48) = .076 .927 IQ perceptual speed (ZVT) 119 13.41 F(2,48) = .278 .759 Sensation seeking 2.99 .63 F(2,48) = .392 .678 Driving style 1 “carefulness” 3.95 .80 F(2,48) = .662 .520 Driving style 2 “routine” 2.65 .86 F(2,48) = .802 .454 Internal locus of control 3.06 .55 F(2,48) = .139 .871 External locus of control 3.07 .52 F(2,48) = .257 .774 BFI-10 Extraversion 3.28 .96 F(2,48) = .096 .908 BFI-10 Agreeableness 3.25 .81 F(2,48) = .050 .951 BFI-10 Conscientiousness 3.30 .71 F(2,48) = .460 .634 BFI-10 Neuroticism 2.87 .82 F(2,48) = .372 .691 BFI-10 Openness 3.66 .92 F(2,48) = .138 .871

44 Driving simulator study
5.2.2 Research design and procedure
The study was planned as a two-way (3×3) repeated measures mixed design. Three distinct system
descriptions formed the between-subjects factor (correct, incomplete, incorrect) and three
consecutive trials formed the within-subject factor (Figure 9). Participants were paid, and as cover
story were told that the study aimed to test a new driver assistance system called “DriveFree”. The
terms “ACC” or “Adaptive Cruise Control” were never used to prevent information search.
Upon arrival at the driving simulator, subjects signed the consent form and read a one-page written
description of the ACC system (Appendix 9.2). To ensure that the description was well understood,
participants were required to answer seven questions about the system’s functionality, orally.
Subsequently, participants completed a questionnaire related to mental model, trust and
acceptance. To become accustomed to the driving simulator, the ACC system and the secondary task,
all subjects drove a 5-km city route, accompanied by a researcher. Thereafter, the trial on a 56-km
two-lane highway started. Participants were instructed to use the ACC in such a way that they could
complete as many secondary tasks as safely possible. After each trial, a semi-structured interview
was conducted and subjects filled in the same questionnaire about mental model, acceptance and
trust as given at the beginning of the trial. The same questionnaires were used after subjects
completed Trials 2 and 3; additionally the mental model questionnaire was applied before these
trials to check for interim changes. The system description was only shown before Trial 1. Within the
6-week study, the average time interval between the trials was 13 days, ranging from 7 to 24 days.
Figure 9. Design and procedure of the matched-sample driving simulator study.
Group 1: correct system description n=17Online recruitment & assessment of confounding variables:
− gender− age− driving
experience− ADAS
experience− personality− locus of control− sensation
seeking− driving style− cognitive
abilities
Group 2: incomplete system description n=17
Written ACC description
Group 3: incorrect system description n=17
Trip 3
Written ACC description
Written ACC description
Mat
ched
sam
ple
6 weeks
Inte
rview
&
Que
stion
naire
s
Que
stion
naire
s
Trip 1
Inte
rview
&
Que
stion
naire
s
Prac
tice
Trip 2
Inte
rview
&
Que
stion
naire
s
Trip 3
Inte
rview
&
Que
stion
naire
s
Que
stion
naire
s
Trip 1
Inte
rview
&
Que
stion
naire
s
Prac
tice
Trip 2
Inte
rview
&
Que
stion
naire
s
Trip 3
Inte
rview
&
Que
stion
naire
s
Que
stion
naire
s
Trip1
Inte
rview
&
Que
stion
naire
s
Prac
tice
Trip2
Inte
rview
&
Que
stion
naire
s
Questionnaires: mental model, acceptance and trust1 2 3 4
Men
tal m
odel
ques
tionn
aire
Men
tal m
odel
ques
tionn
aire
Men
tal m
odel
ques
tionn
aire
Men
tal m
odel
ques
tionn
aire
Men
tal m
odel
ques
tionn
aire
Men
tal m
odel
ques
tionn
aire

45 Driving simulator study
5.2.3 Facilities and driving simulator track
Driving simulator and ACC: A fixed-base driving simulator (STISIMDrive 100w) at Chemnitz University
of Technology was used for the study. It provided a 135° horizontal field of view and was composed
of a BMW 350i driving cab with automatic transmission (Figure 10). The ACC was integrated in the
simulation software and allowed specific manipulation of functionality in defined driving situations.
In general, the ACC worked at every driving speed, and included stop-and-go functionality. During the
entire simulation, ACC headway time was set to 2 s and speed to 100 km/h. To maintain constant
conditions, participants were not allowed to change these settings during driving or turn off the
system. Depressing the accelerator or brake pedal temporarily disabled the ACC; when the pedals
were released, ACC functions were immediately reactivated. No ACC alarms were implemented to
simulate critical situations without prior warning. The system was programmed to recognise all
leading vehicles except motorbikes. In three defined situations (i.e., two narrow bends and one
episode of heavy fog), recognition of the lead vehicle was disabled temporarily to simulate system
failure.
Simulator track: The simulator track was comprised a 56-km long two-lane highway with an average
driving time of 35 min and 32 s. With the exception of a 100-km/h speed limit in construction zones,
simulator speed limit was set to 120 km/h. The route consisted of five consecutive base modules of
11 km each and 1 km of straight road at the end (see Appendix 9.3 for a detailed overview). Every
base module included:
• two left bends and one right bend
• a cut-in situation from the left after 4.7 km: A vehicle overtakes on the left side, cuts-in
directly in front of the own vehicle and slows down to 80 km/h
• a construction zone from 8.5 to 11 km, where only the right lane could be used and a lead car
with a constant speed of 80 km/h set the driving pace
• an approach situation involving queuing at the beginning of the construction zone
However, the five base modules differed as follows:
• weather conditions (good weather / light fog / heavy fog)
• cut-in vehicle (normal car / motorbike / white car)
• last car in the queue (normal car / white truck)
• lead car in the construction zone (normal car / white truck)
• tracking lost (heavy fog / narrow bends)
The first base module represented a baseline for good weather conditions and no system failure. The
second module was identical but included light fog conditions. During the third module, a motorbike

46 Driving simulator study
was used for the cut-in situation, resulting in failure of the ACC to react and requiring the driver to
intervene. Moreover, the last car in the queue was a white truck. During the fourth module a white
car was used for the cut-in situation and tracking was lost in the final narrow left bend. In the fifth
module, heavy fog conditions resulted in lost tracking on two occasions, one again in a narrow bend.
5.2.4 Secondary task SURT
As a secondary task, participants had to continuously solve the SURT (Mattes & Hallén, 2009). The
software was kindly provided by the German Aerospace Center (DLR) in Braunschweig. The visual
search task consisted of 50 randomly arranged circles presented on a 10-inch touch screen on the
central console (see Figure 10). Test subjects had to select one circle with an approximately one-
third-greater radius and touch it with their right hand. Therefore, the SURT requires visual perception
combined with a manual response. Immediately after touching the screen, a green light appeared if
the participant selected the right half of the screen and a red light, if the wrong half of the screen
was chosen. After a delay of 0.5 s, a new task with randomly arranged circles was presented. The 49
small circles had a diameter of 0.8 cm, and the bigger circle 1.05 cm.
Figure 10. Driving simulator setup and SURT.
5.2.5 System description
A one-page system description was designed to induce different initial mental models of ACC in the
three experimental groups (see Appendix 9.2 for the original documents). First, for all three groups,
the description dealt with general system functionality including an explanation of longitudinal
control automation, speed and time headway settings, temporary deactivation via brake or
accelerator pedal, and information regarding reactivity of the system (i.e., non-reactive to oncoming
traffic, pedestrians, traffic signs and traffic lights). In subsequent parts of the description, there were

47 Driving simulator study
differences between the three groups (Table 3). The correct group was informed about system
problems that would actually occur at narrow bends, in adverse weather conditions, and involving
small vehicles. The incomplete group, on the other hand, did not receive this information, and
therefore received idealised information. The incorrect group was provided with the same
information as the correct group, but were over-informed about potential system problems with
large vehicles and white/silver cars. The latter problems, however, never occurred during driving.
Table 3. Initial ACC information in the three experimental groups.
Initial information about the ACC Group 1
correct
infor-
mation
Group 2
incomplete
infor-
mation
Group 3
incorrect
information
Events
occurred
during
driving
General information on system functions X X X
No reaction for traffic signs, pedestrians, oncoming traffic and traffic lights
X X X
Potential problems at narrow bends X X Yes
Potential problems in adverse weather conditions X X Yes
Potential problems with small vehicles, such as motorbikes
X X Yes
Potential problems with big vehicles, such as buses or trucks
X No
Potential problems with white or silver cars due to reflection
X No
5.2.6 Dependent variables trust, acceptance and mental model
Trust was assessed by a 12-item unidimensional scale for trust in automated systems (Jian, Bisantz, &
Drury, 2000; see Appendix 9.1). Subjects answered questions such as “I can trust the system” or “I
am confident in the system” using a seven point Likert scale ranging from 1 (fully disagree) to 7 (fully
agree). Reliability analysis showed good-to-excellent Cronbach’s alpha values between .854 and .911
for all times of measurement. The mean of the twelve single items was used as overall trust score.
The 5-point rating scale developed by Van der Laan et al. (1997) was used as acceptance indicator
(Appendix 9.1). A total of nine items resulted in the two acceptance dimensions usefulness and
satisfaction. Both dimensions showed acceptable-to-good reliability scores: Cronbach’s alpha for
usefulness ranged from .728 to .865 and for satisfaction from .741 to .896.

48 Driving simulator study
Users’ mental model of ACC was assessed by a self-developed and pretested standardized
questionnaire consisting of 35 items (Appendix 9.1). Although there are well-known methods to
investigate mental models such as card sorting, task analysis, focus groups or in-depth-interviews
(Cherri et al., 2004), these mainly qualitative approaches have certain drawbacks. While they allow
for a detailed, individualized and flexible assessment of mental models, statistical calculations and
direct comparisons are difficult due to the lack of standardization. However, a major focus of this
study was to develop an assessment method for mental models that is able to transform the
subjective interpretation of real-world statements (e.g. from user manuals) such as “problems at
narrow bends can occur” into numbers. This allows for comparisons between the experimental
groups as well as the quantification of changes in the mental model over time, both of which made
qualitative approaches appear impractical. Based on the mental model definition in chapter 1.1, all
35 questionnaire items focused on knowledge about ACC functions in specific situations. Subjects
answered questions using a Likert scale ranging from 1 (totally disagree) to 6 (totally agree). Five
items focused on differences between the incomplete group and both of the other groups, e.g., “The
system works with motorbikes”. The differences between the incorrect group and other two groups
were measured by another four items, e.g., “The system reacts to white cars driving ahead in the
same lane”. The remaining 26 questions acted as distractor items focusing on common ACC
functionality, e.g., “The system is overruled by pressing the brake pedal”.
5.2.7 Contrast analysis
Contrast analysis was used to statistically test the hypotheses regarding trust and acceptance. A
standard analysis of variance (ANOVA) reflects all possible differences between group means
(omnibus test). Contrast analysis, on the other hand, permits focused questions to the data by
testing specific data patterns. Statistical power is therefore higher compared to standard ANOVA and
effect sizes can be directly computed (Rosenthal, Rosnow, & Rubin, 2000). Contrast analysis is
especially useful when comparing specific patterns of means in three or more groups. Hypotheses
are translated in contrast coefficients which reflect the predictions. The correlation between the
contrast coefficients and observed group means indicates the similarity between predictions and
empirical data (Abdi & Williams, 2010). Due to the correlation procedure, only the relation between
the contrast weights is important, not the absolute values.
According to the hypotheses for trust and acceptance, a steady increase is predicted for the correct
group. Therefore, the contrast weights 0, 1, 2, 3 are assigned for the four times of measurement
(after reading the system description, and after Trials 1–3). For the incomplete group a steady
decrease is predicted, starting from the highest level. The contrast weights 1, 0, –1, –2 are therefore
assigned. The incorrect/over-informed group is expected to show the lowest trust and acceptance

49 Driving simulator study
level in the beginning and almost reach the level of the correct group by the end. Therefore, the
contrast weights 4, –2, 0, 2 are assigned.
5.3 Results
5.3.1 Mental model
To assess the changes in mental models of ACC, the questionnaire was presented immediately after
reading the description and after each of the three trials. Figure 11 shows the profiles for the three
groups and the nine questionnaire items that distinguish the groups.
Immediately after reading the description, Items 1–5 highlight the differences between incomplete
and both of the other groups, whereas Items 6–9 distinguish between the incorrect group and the
other two groups. According to the different initial ACC description, the incomplete group reported
almost no problems in all of the nine question items. The incorrect as well as the correct group were
aware of potential problems at curvy roads, with motorbikes, and in rain and fog. In addition, the
incorrect group suspected potential problems with trucks, buses, white cars and silver tank lorries. As
a manipulation check it can therefore be concluded that the different preliminary ACC information
led to the desired distinctive mental model within the three groups.
Figure 11. Development of ACC mental model (1 = totally disagree, 6 = totally agree).
correct information incomplete information incorrect information
1 2 3 4 5 6
1) ACC works in curvy roads2) ACC works with motorbikes
3) ACC works in the rain4) ACC works in the fog
5) ACC recognises all lead vehicles6) ACC recognises trucks7) ACC recognises buses
8) ACC recognises white cars9) ACC recognises silver tank lorries
After reading description
1 2 3 4 5 6
1) ACC works in curvy roads2) ACC works with motorbikes
3) ACC works in the rain4) ACC works in the fog
5) ACC recognises all lead vehicles6) ACC recognises trucks7) ACC recognises buses
8) ACC recognises white cars9) ACC recognises silver tank lorries
After Trip 21 2 3 4 5 6
After Trip 1
1 2 3 4 5 6
After Trip 3

50 Driving simulator study
After completing the first trial in the driving simulator, mental model profiles shifted towards the
correct profile. To estimate the profile distance, the sum of absolute differences between the means
of the correct group and both of the other groups was calculated (city-block-metric: distance =
│correct – incomplete│ + │correct – incorrect│). Table 4 shows the distances for every item and trial, and
as well the average distance of all nine questions. Over all items, mean profile distance from the
correct group decreased from 2.56 after reading the description to 1.71 after Trial 1. The incomplete
group, in particular, became aware of problems with motorbikes (Item 2), curvy roads (Item 1), and
problems due to ACC’s failure to recognize all leading vehicles (Item 5).
With further practice, mental model profiles converged towards the correct group: Mean distance
decreased from 1.71 after Trial 1 to 1.35 after Trial 2, and finally to 1.00 after Trial 3. For the
expected, but non-occurring failures questioned in Items 6–9, a continuous shift towards the correct
group was observed for the incorrect group. This effect is reflected in the steady decrease of profile
distance for these four items from 2.65 after reading the description to 1.15 after Trial 3 (average of
Items 6–9). Negative interaction in terms of unexpected but experienced failures (i.e., with
motorbikes, curvy roads, fog) led to a faster and stronger shift in the mental model than the
experience of expected, but non-occurring failures (i.e., with trucks, buses, white cars).
Table 4. Mental model profile distance between correct and incomplete/incorrect groups.
Absolute distance between correct and other two groups
distance = │correct – incomplete│ + │correct – incorrect│
After reading
description
After Trial 1 After Trial 2 After Trial 3
1) ACC works in curvy roads 2.35 1.41 0.76 0.65
2) ACC works with motorbikes 2.59 0.71 0.71 0.56
3) ACC works in the rain 2.59 1.82 1.18 1.56
4) ACC works in the fog 2.71 3.06 1.82 1.11
5) ACC recognises all lead vehicles 2.18 1.00 1.35 0.50
6) ACC recognises trucks 2.41 1.65 1.06 0.69
7) ACC recognises buses 2.35 1.71 1.76 0.93
8) ACC recognises white cars 2.71 1.82 1.65 1.19
9) ACC recognises silver tank lorries 3.12 2.24 1.82 1.78
Mean distance of all 9 items 2.56 1.71 1.35 1.00
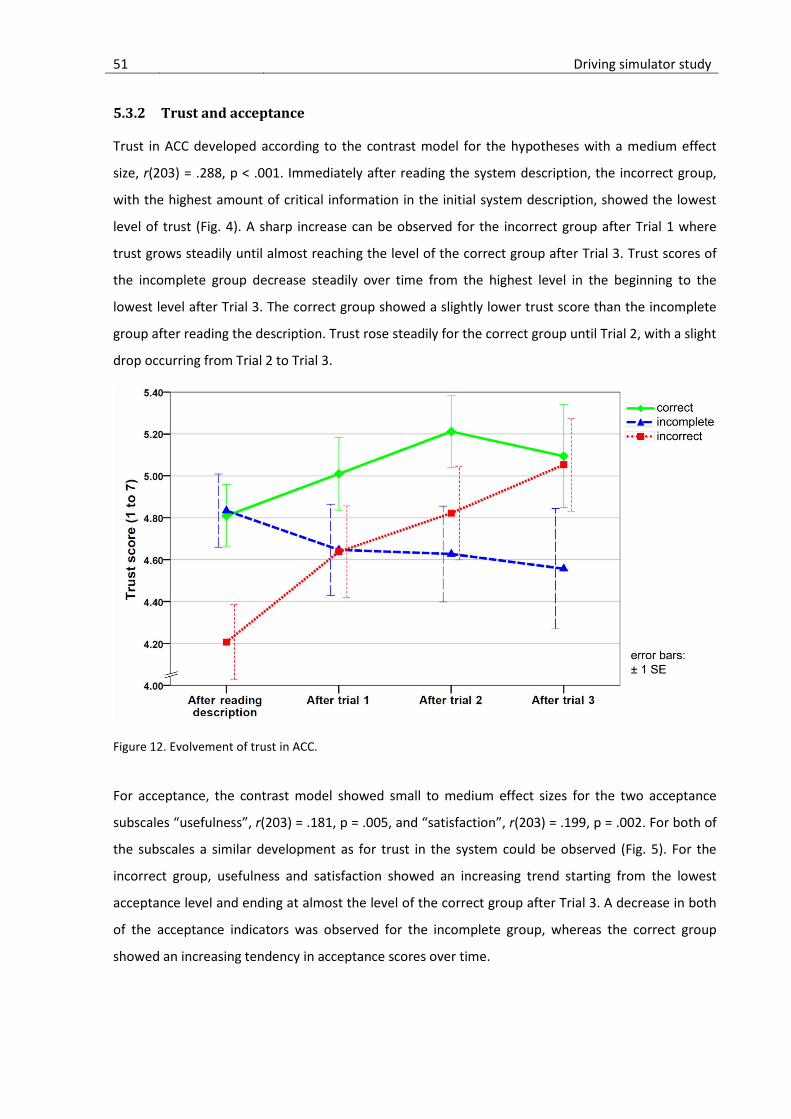
51 Driving simulator study
5.3.2 Trust and acceptance
Trust in ACC developed according to the contrast model for the hypotheses with a medium effect
size, r(203) = .288, p < .001. Immediately after reading the system description, the incorrect group,
with the highest amount of critical information in the initial system description, showed the lowest
level of trust (Fig. 4). A sharp increase can be observed for the incorrect group after Trial 1 where
trust grows steadily until almost reaching the level of the correct group after Trial 3. Trust scores of
the incomplete group decrease steadily over time from the highest level in the beginning to the
lowest level after Trial 3. The correct group showed a slightly lower trust score than the incomplete
group after reading the description. Trust rose steadily for the correct group until Trial 2, with a slight
drop occurring from Trial 2 to Trial 3.
Figure 12. Evolvement of trust in ACC.
For acceptance, the contrast model showed small to medium effect sizes for the two acceptance
subscales “usefulness”, r(203) = .181, p = .005, and “satisfaction”, r(203) = .199, p = .002. For both of
the subscales a similar development as for trust in the system could be observed (Fig. 5). For the
incorrect group, usefulness and satisfaction showed an increasing trend starting from the lowest
acceptance level and ending at almost the level of the correct group after Trial 3. A decrease in both
of the acceptance indicators was observed for the incomplete group, whereas the correct group
showed an increasing tendency in acceptance scores over time.

52 Driving simulator study
Figure 13. Evolvement of acceptance scores.
5.3.3 Situation Awareness
The frequency of the continuously presented secondary task (SURT) was used as an indicator for SA.
On average, participants solved 543 SURT tasks per trip (range: 115–1,082, SD = 219.14),
corresponding to an average frequency of 0.252 Hz (range: 0.003–1.753 Hz, SD = 0.214). As the task
can be completed quickly (i.e., theoretical maximum 2 tasks per s), SURT completions can be
displayed as frequency over time. This allows for exploratory analysis in combination with the
synchronized video file. Figure 14 shows exemplarily the queue situation with the white truck
leading. The left picture shows the first trip of one driver. Red spikes display SURT reactions and blue
lines show frequency of SURT reactions in Hz. The x-axis shows elapsed time in s and the gray vertical
line marks the current position. In this exploratory view it can be seen that the driver stops his
engagement in the secondary task as the white object becomes visible. The right picture shows the
same situation during the first trip with averaged SURT frequency data for the three experimental
groups. It is clearly visible that the incorrect group (red line) reduce the secondary task engagement
when approaching and following the white truck, whereas the correct (green line) and incomplete
group (blue line) restart SURT-completion immediately. Analysis software, such as DIADEM from
National Instruments (www.ni.com/diadem/), can display synchronized driving data and video in
real-time and permits easy data exploration. This exploratory analysis is a powerful tool for
identifying and visualizing situations associated with drops in SURT frequency.
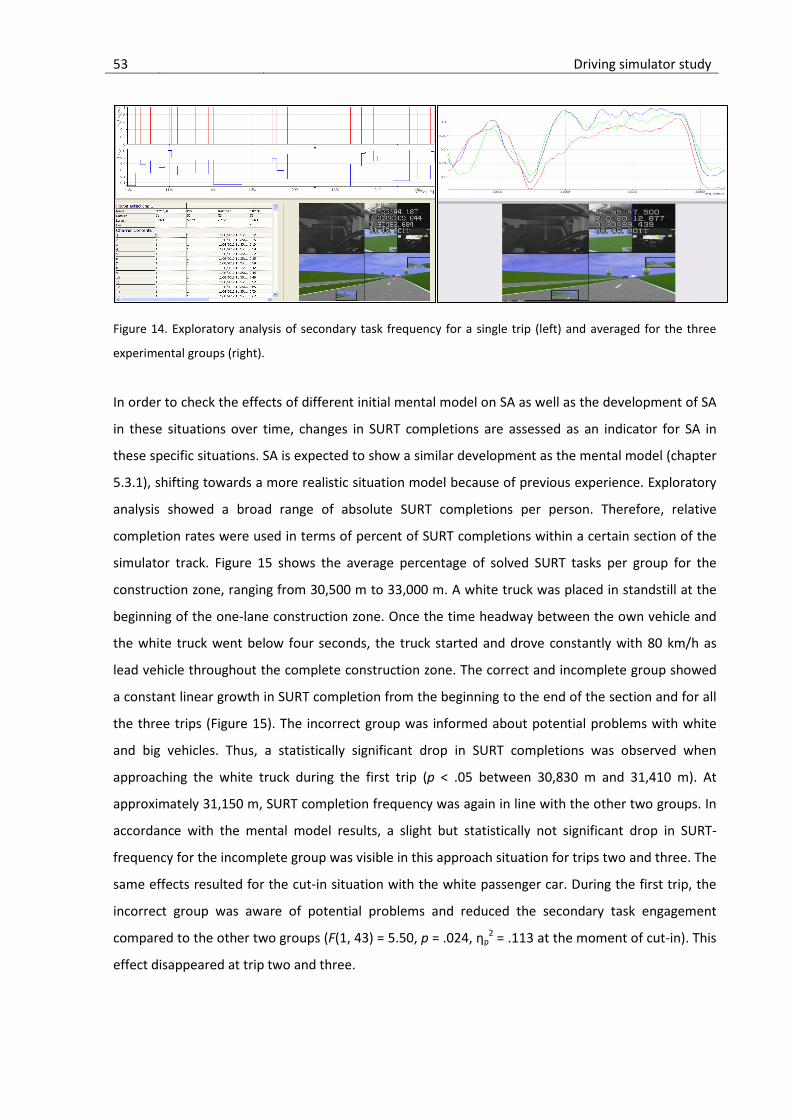
53 Driving simulator study
Figure 14. Exploratory analysis of secondary task frequency for a single trip (left) and averaged for the three
experimental groups (right).
In order to check the effects of different initial mental model on SA as well as the development of SA
in these situations over time, changes in SURT completions are assessed as an indicator for SA in
these specific situations. SA is expected to show a similar development as the mental model (chapter
5.3.1), shifting towards a more realistic situation model because of previous experience. Exploratory
analysis showed a broad range of absolute SURT completions per person. Therefore, relative
completion rates were used in terms of percent of SURT completions within a certain section of the
simulator track. Figure 15 shows the average percentage of solved SURT tasks per group for the
construction zone, ranging from 30,500 m to 33,000 m. A white truck was placed in standstill at the
beginning of the one-lane construction zone. Once the time headway between the own vehicle and
the white truck went below four seconds, the truck started and drove constantly with 80 km/h as
lead vehicle throughout the complete construction zone. The correct and incomplete group showed
a constant linear growth in SURT completion from the beginning to the end of the section and for all
the three trips (Figure 15). The incorrect group was informed about potential problems with white
and big vehicles. Thus, a statistically significant drop in SURT completions was observed when
approaching the white truck during the first trip (p < .05 between 30,830 m and 31,410 m). At
approximately 31,150 m, SURT completion frequency was again in line with the other two groups. In
accordance with the mental model results, a slight but statistically not significant drop in SURT-
frequency for the incomplete group was visible in this approach situation for trips two and three. The
same effects resulted for the cut-in situation with the white passenger car. During the first trip, the
incorrect group was aware of potential problems and reduced the secondary task engagement
compared to the other two groups (F(1, 43) = 5.50, p = .024, ηp2 = .113 at the moment of cut-in). This
effect disappeared at trip two and three.

54 Driving simulator study
Figure 15. Percentage of SURT-tasks solved during the construction zone with the white truck leading.
SURT completion showed a similar trend in the cut-in situation with the motorbike (Figure 16), in line
with the mental model development. The x-axis shows the meter driven before and after the
moment at 0 m, when the motorbike passed the centre line from the left to right lane. On first
encounter during trip one, both the correct and incorrect group reduced the secondary task
engagement already before the cut-in at 0 m, visible through the flattening of the curves. Both of the
groups were aware of a potential danger, whereas the incomplete group continued the secondary
task engagement. Only approximately 40 m after the cut-in, the incomplete group slowly reduced
SURT completion. In line with the mental model results, SURT completion rates became similar over
the three experimental groups during trips two and three. All groups reduced the secondary task
engagement already before the motorbike passed the centre lane.
0
10
20
30
40
50
60
70
80
90
100
3050
030
700
3090
031
100
3130
031
500
3170
031
900
3210
032
300
3250
032
700
3290
0
cum
ulat
ive
perc
ent S
URT
distance driven (m)
trial 3
0
10
20
30
40
50
60
70
80
90
100
3050
030
700
3090
031
100
3130
031
500
3170
031
900
3210
032
300
3250
032
700
3290
0
cum
ulat
ive
perc
ent S
URT
distance driven (m)
trial 2
0
10
20
30
40
50
60
70
80
90
100
3050
030
700
3090
031
100
3130
031
500
3170
031
900
3210
032
300
3250
032
700
3290
0
Cum
ulat
ive S
URT
(%)
distance driven (m)
trial 1
correctincompleteincorrect

55 Driving simulator study
Figure 16. Percentage of SURT-tasks solved during the cut-in situation with the motorbike.
During the situations in narrow curves where ACC lost tracking of the car ahead, no differences in
secondary task engagement were observed between the three groups. An explanation may be that
the sudden acceleration of the own car due to the lost tracking was so apparently that all groups
stopped SURT completion immediately. However, driving parameters showed a difference between
the groups in handling this situation, which can be explained by the different initial mental model.
The first brake reaction during the first trip after the onset of tracking failure at 53,420 m occurred
significantly later in the incomplete group which had no information about this potential problem
than in both of the other groups (Figure 17, delay of 80 m, X2 (1, N = 50) = 7.815, p = .005). These
differences in brake reaction disappeared during trips two and three. The same pattern for the first
brake reaction appeared as well for the first situation with ACC tracking lost at 42,420 m, where the
first brake reaction of the incomplete group occurred 68 m later compared to both of the other
groups (X2 (1, N = 48) = 4.607, p = .032).
0
20
40
60
80
100
-200 -180 -160 -140 -120 -100 -80 -60 -40 -20 0 20 40 60 80 100 120 140 160 180 200cum
ulat
ive
perc
ent S
URT
meter before/after cut-in
trial 3
0
20
40
60
80
100
-200 -180 -160 -140 -120 -100 -80 -60 -40 -20 0 20 40 60 80 100 120 140 160 180 200cum
ulat
ive
perc
ent S
URT
trial 2
0
20
40
60
80
100
-200 -180 -160 -140 -120 -100 -80 -60 -40 -20 0 20 40 60 80 100 120 140 160 180 200cum
ulat
ive
perc
ent S
URT
trial 1
correctincompleteincorrect
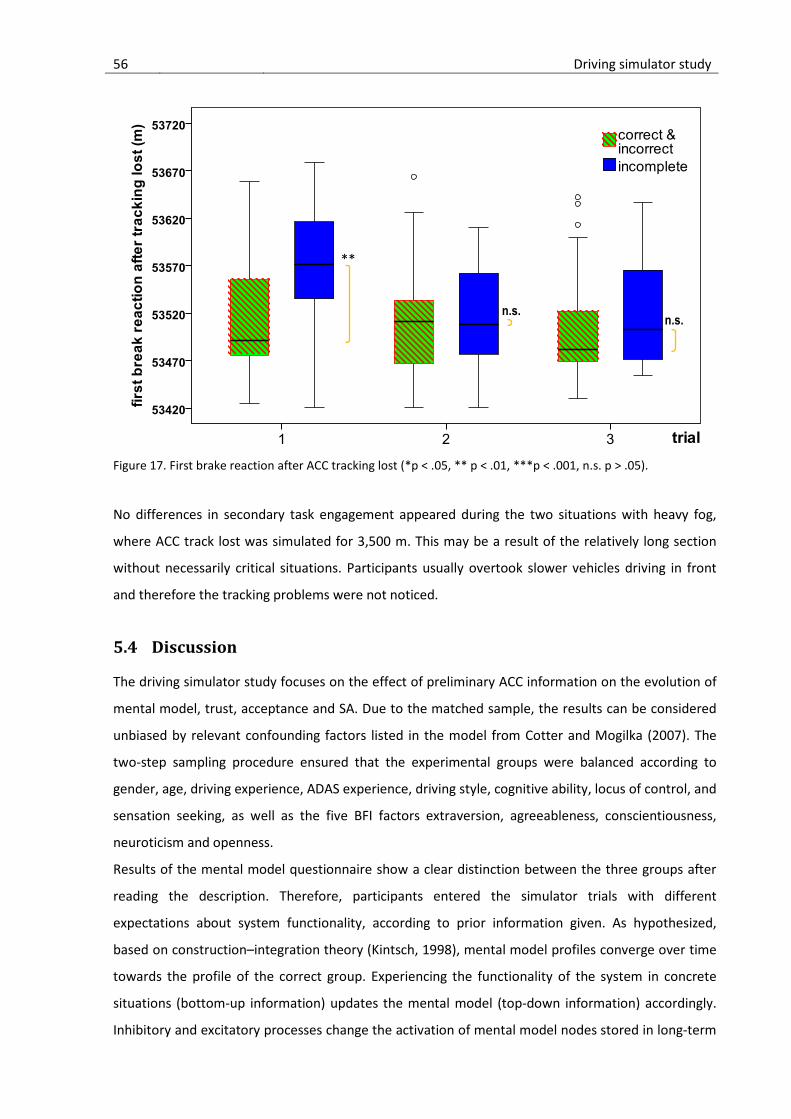
56 Driving simulator study
Figure 17. First brake reaction after ACC tracking lost (*p < .05, ** p < .01, ***p < .001, n.s. p > .05).
No differences in secondary task engagement appeared during the two situations with heavy fog,
where ACC track lost was simulated for 3,500 m. This may be a result of the relatively long section
without necessarily critical situations. Participants usually overtook slower vehicles driving in front
and therefore the tracking problems were not noticed.
5.4 Discussion
The driving simulator study focuses on the effect of preliminary ACC information on the evolution of
mental model, trust, acceptance and SA. Due to the matched sample, the results can be considered
unbiased by relevant confounding factors listed in the model from Cotter and Mogilka (2007). The
two-step sampling procedure ensured that the experimental groups were balanced according to
gender, age, driving experience, ADAS experience, driving style, cognitive ability, locus of control, and
sensation seeking, as well as the five BFI factors extraversion, agreeableness, conscientiousness,
neuroticism and openness.
Results of the mental model questionnaire show a clear distinction between the three groups after
reading the description. Therefore, participants entered the simulator trials with different
expectations about system functionality, according to prior information given. As hypothesized,
based on construction–integration theory (Kintsch, 1998), mental model profiles converge over time
towards the profile of the correct group. Experiencing the functionality of the system in concrete
situations (bottom-up information) updates the mental model (top-down information) accordingly.
Inhibitory and excitatory processes change the activation of mental model nodes stored in long-term
**
n.s. n.s.

57 Driving simulator study
memory and make the updated knowledge network available for further processing cycles (Durso et
al., 2007). Results show both a faster and greater impact of unexpected critical situations (e.g.,
failures in detecting the motorbike) on the mental model in comparison to expected, but non-
experienced failures (i.e., trucks, buses, white cars). Expected, but non-experienced failures
comprised less activated nodes. The loss of activation is depicted by a shift in mental model profile
towards the “non-problem” values. This trend suggests that these nodes may drop out the network
over time if they are not activated by experience. Potential problems could be forgotten over time in
the absence of periodic re-activation of these knowledge nodes. As the tendency to drop out the
network is already visible in the relatively short period of this study, more dangerous consequences
can be expected over longer time. The results of Jenness et al. (2008), showing that 7 of 10 ACC users
are not aware of manufacturers’ warnings about system limitations, could be interpreted from this
point of view. It might explain why “Surprisingly, at higher levels of experience respondents are more
likely to say that their system works ‘fairly well’ or ‘perfectly’ to help them avoid a collision in these
situations [...] where ACC is not likely to work well and they are usually included as warnings in the
vehicle owner’s manual” (Jenness et al., 2008, p. 23). Results of the online SA assessment using the
SURT completion frequency are substantially congruent with the results on the mental model
development. Not previously known system limitations are learnt relatively fast and change the
behaviour in consequent similar situations towards better SA. Drivers with correct initial information
on system limitations recognize potentially critical situations already before they actually arise. This
awareness of the situation is measurable by the reduction in secondary task engagement at the
onset of such scenarios. As a result, more attentional resources are allocated to monitor the system
and faster reaction can occur in case an intervention is required.
Results concerning trust and acceptance of the system show an effect of initial information: The
more potentially critical situations presented in preliminary information, the less the initial trust and
acceptance of the system is, after reading the description. Accordingly, while the over-informed
incorrect group shows the lowest scores for trust and acceptance in the beginning, the incomplete
group tends to trust and accept the ACC the most, initially. According to the processing load
hypothesis (Zwaan et al., 1998), updating the mental model is expected to create the most cognitive
effort for the incomplete group, less for the incorrect group and the least effort for the correct
group. Higher cognitive effort to adjust the mental model in turn lowers trust and acceptance of the
system over time, due to a mismatch of expectations and experience. The results support this
hypothesis, showing an increasing trend in trust and acceptance for the correct group having the
highest correspondence of mental model and experience. Actually occurring system failures do not
affect trust and acceptance in a negative way if they are known beforehand. These results are in line
with the findings of Lee and See (2004), where the predictability, not the magnitude, of faults is

58 Driving simulator study
considered the major impact factor on trust. Trust and acceptance decline steadily in the incomplete
group with the greatest demands of reorganizing the mental model resulting from non-expected
failures. Even though the mental model of the incomplete group becomes more realistic, trust and
acceptance do not recover within three trials. These results partly diverge from the findings of Kazi et
al. (2007) and Rudin-Brown and Parker (2004), where trust did not decline as much as predicted in
the unreliable/failure condition. An explanation for the constantly decreasing trust in this study could
be the higher amount of cognitive effort required to restructure the mental model of ACC. The
incomplete group experienced several unexpected problems, which could have had a stronger
impact than single or less frequent failures. However, further research is needed to investigate how
the development of mental model, trust and acceptance evolve, after more than three trials. As
hypothesized, the expected but non-occurring failures in the incorrect group do not affect trust and
acceptance in a negative way over time. These nodes become less activated and require less
cognitive effort to reorganize the mental model. As a result, trust and acceptance increase steadily
until almost reaching the level of the correct group. Providing over-information about potential
problems lowers trust and acceptance in the beginning only without causing long-lasting negative
effects.

59 On-road study
6 On-road study
6.1 Aims and research questions
The on-road study investigates the development of trust, acceptance, learning and the mental model
of novice users when interacting with the automated in-vehicle system ACC. An exploratory
repeated-measures study design with ten consecutive on-road trips allows for assessment of the
learning and integration process until the point of stabilization. The primary research questions focus
on modelling this process in mathematical/statistical terms and the identification of the point at
which trust, acceptance, learning and the mental model of the system stabilize. Hence, the study
design is exploratory and aims to answer the following research questions: How do trust and
acceptance develop under real conditions when having full information from the owner’s manual?
Do trust and acceptance increase continuously or do they decline after an initial peak? Does trust
and acceptance eventually stabilize and at what point does this occur? How can the learning process
be described? Does the learning process correspond to the power law of learning that has been
observed in other domains? When does learning end in terms of stabilization? How appropriate is
the mental model of ACC functionality that is created as a result of reading the owner’s manual?
Which aspects of the mental model change due to experience? How does objective ACC usage
evolve?
6.2 Method and material
6.2.1 Research design and procedure
To assess the development and stabilization process, an on-road field test with a repeated
measurement design was utilized. Fifteen drivers without ACC experience drove a BMW525d vehicle
with ACC ten consecutive times on the same route within a 2-month period (November and
December). Participants were required to complete the ten sessions on different days, and it was not
possible to complete more than two sessions per week. The first session lasted approximately 90
minutes and the other nine not more than 60 minutes. During the first session, participants drove
without using the ACC to familiarize themselves with the car, the route, and the navigation
instructions. A researcher accompanied the drivers during the first session in case help was needed.
In subsequent sessions, participants performed the trial alone and were instructed to use the ACC
system whenever possible. The decision to use the system was entirely up to participants, that is,
when they felt sufficiently safe and comfortable using it. Drivers were paid for their participation.
During the first session, participants received training on ethics and safety procedures. After
familiarization with the car, they received a copy of the ACC section of the BMW owner’s manual and

60 On-road study
were instructed to read it before the next trial. By the second session, researchers confirmed that
everyone had read the manual. Participants completed the questionnaires on mental model, trust,
acceptance and learning before driving with ACC (subsequently labelled as session 1) and after
driving with ACC (subsequently labelled as session 2). The mental model questionnaire was
administered again after sessions 3, 5 and 10 and all other questionnaires were administered after
each consecutive session.
6.2.2 Sampling and participants
Participants were selected in a two-step procedure. In an initial online questionnaire, interested
candidates were given the opportunity to apply for the study. The questionnaire covered
demographic information and driving experience, as well as knowledge and experience with
assistance systems. Specific requirements were established for participant selection: Drivers must
have a valid driver license, a minimum of 50,000 km of total driving experience, as well as no
experience with or detailed knowledge of ACC. Due to contractual obligations regarding the car
insurance, participants had to be at least 25 years old and employees of the University. Fifteen
novice ACC users were selected to take part in the study. The age of the 8 males and 7 females
ranged from 25 to 32 years with a mean age of 28 years (SD = 1.82). On average, participants
reported driving 14,666 km (SD=8,094) in the last 12 months prior to the experiment.
6.2.3 Facilities and apparatus
Test vehicle and ACC: The test vehicle was a standard BMW525d with automatic transmission and
ACC with stop-and-go function. The ACC system is able to automatically maintain a set cruising
speed, and reduce it when approaching a slower vehicle that travels on the same lane, while always
maintaining a driver-specified distance from the vehicle immediately ahead. When following a
vehicle that reduces its speed to a complete stop, the stop-and-go function allows the driver’s car to
do the same, reducing its speed until a standstill. Once active, the system is able to be deactivated or
switched to standby mode by pressing the brake or accelerator pedals respectively. Visual feedback
of system status is shown in the vehicle’s control panel, located behind the steering wheel. Due to
sensor limitations, ACC cannot handle every situation and the driver is required to assume manual
control. Participants acquired an initial mental model of the ACC functionality by reading the ACC-
section of the owner’s manual. The following system limitations were described in the manual:
• Detection problems may occur with small vehicles, such as motorbikes or bicycles.
• Automatic braking may not function in short-distance cut-in situations or when deceleration
of the leading vehicle occurs too rapidly.

61 On-road study
• The system does not react to stationary objects in front (e.g. stationary vehicles at traffic
lights).
• In situations involving swerving vehicles, the other car can only be detected at the moment
of entering the lane ahead.
• Detection can be delayed or even fail in sharp bends, due to limited sensor range. Moreover,
vehicles in adjacent lanes may be detected.
• Obstructions on the sensor, such as dirt, snow, ice or heavy rain, can restrict the detection of
vehicles.
All changes have a corresponding visual tell-tale sign and in specific cases of system failure, an
auditory tone is sounded.
Route: The 37 km route was the same in every trial to ensure valid comparisons between sessions
and participants. Located in the vicinity of Chemnitz, the route was composed of three connected
road types ranging from urban to arterial to motorway (Figure 18). The approximately 2.5 km stretch
of urban roadway had a speed limit of 50 km/h. This was followed by the arterial road, approximately
5 km in length and with a speed limit of 70 km/h. The motorway road stretch was approximately 11
km long and had no legally imposed speed limit. To complete the entire route, participants drove
back on the same roads to return to the starting point: motorway (11 km), arterial road (5 km), and
urban road (2.5 km). In order to ensure that all participants completed the exact same route, the
course was saved in the car’s built-in navigation system. Mean driving time per trip was 38 min and
48 seconds, ranging from 26:40 to 1:04:05.
Figure 18. Route driven during every session (OpenStreetMap contributors, 2014).

62 On-road study
Data acquisition system: The car was equipped with a video data acquisition system, capable of
recording the interior of the car and the road ahead (Figure 19). This system was composed of four
cameras connected to a central computer, which recorded images at a frequency of 50 Hz. The
following images were captured: 1) face of the driver; 2) pedals; 3) ACC display on the control panel;
4) road ahead. In addition, another camera (Smarty BX 1000 Plus from D-TEG; camera: 1/4” CMOS
Digital Sensor 310K pixels), with a 170° view angle (H: 131°; V: 96°) was used, incorporating a GPS
and G sensor. This camera was placed on top of the front passenger seat to record events inside the
vehicle cockpit. Images were recorded at a frequency of 15 Hz, and the GPS and G-sensor signals
were collected at 1 Hz.
Figure 19. Experiment vehicle with video cameras and data acquisition system.
6.2.4 Dependent variables mental model, trust, acceptance, learning and ACC usage
The mental model questionnaire included 32 questions on ACC functionality in specific situations
with a 6-point Likert scale ranging from “totally agree” to “totally disagree”. The full questionnaire
can be found in Appendix 9.4; the development principles are described in chapter 2.3.4. Questions
covered general ACC functionality (e.g. “ACC maintains a predetermined speed in an empty lane”) as
well as system limitations described in the owner’s manual (e.g. “ACC detects motorcycles”). Trust
was assessed using a 12-item unidimensional scale for trust in automated systems (Jian et al., 2000).
Participants answered questions such as “I can trust the system” or “The system is reliable” using a 7-
point Likert scale ranging from 1 (“fully disagree”) to 7 (“fully agree”). Internal consistency reliability
was good, Cronbach’s alpha values ranged between .722 and .831 for all sessions. The 5-point bipolar
rating scale developed by Van der Laan et al. (1997) was used for assessing acceptance. A total of
nine items were factor-analyzed and found to load onto one acceptance dimension. The resulting
acceptance scale ranges from -2 to 2 where higher values correspond to greater acceptance.

63 On-road study
Reliability is good, with Cronbach’s alpha values ranging from .732 to .917. Self-reported learning
progress was assessed using five items focusing on different aspects of the users’ interaction with the
ACC (see chapter 6.3.3 for details). Ratings were given on a percentage scale. Objective ACC usage
has been coded manually using the video on ACC display on the control panel. Due to technical
problems, only 128 out of 150 trials could be used for coding the ACC usage rate, whereas all 150
trips are included in the analysis of trust, acceptance, mental model and learning.
6.3 Results
6.3.1 ACC usage
This variable indicates the percentage of kilometres driven while ACC. As it can be seen in Figure 20,
on the motorway the number of km driven with ACC was always higher along all trials (motorway:
M= 78.3%; urban road: M= 50.0%).
Figure 20. ACC usage rate in percentage of kilometres with standard error bars.
Repeated-measures ANOVA indicated no main effect of experience (F(3.26, 45.7) = 2.23, p = .093, ηp2
= .14). However, when taking into account exclusively the urban environment, an effect of
experience is verified (F(8, 112) = 3.05, p = .004, ηp2 = .18). Contrasts showed a significant difference
between the first and the second trial (F(1, 14) = 13.34, p = .003, ηp2 = .44), and between the first and
the fifth and following trials (respectively, fifth trial F(1, 14) = 7.38, p = .017, ηp2 = .35; sixth trial F(1,
14) = 10.59, p = .006, ηp2 = .43; seventh trial F(1, 14) = 17.85, p = .001, ηp
2 = .56; eighth trial F(1, 14) =
18.94, p = .001, ηp2 = .57; ninth trial F(1, 14) = 10.12, p = .007, ηp
2 = .42). A main effect of road
0
20
40
60
80
100
2 3 4 5 6 7 8 9 10
% k
m d
riven
with
ACC
act
ive
sessions
motorway
urban
error bars: ± 1 SE

64 On-road study
environment was also registered (F(1, 14) = 24.0, p < .001, ηp2 = .63). This means that participants
used the ACC system to a larger proportion when driving on the motorway. An increase in ACC
percentage of use was observed only for the urban road. Thus, the effect of experience was shown to
be dependent on the road environment.
6.3.2 Trust and acceptance
To assess the development of trust and acceptance over time, both questionnaires were presented
after reading the ACC description (session 1) and after each drive (session 2 through 10). Figure 21
shows mean trust scores and the fitted power law curve. Trust evolved according to a power
function, growing steeply in the first sessions and levelling off after approximately the fifth session.
The score stabilized at a relatively high level of M = 5.84, (SD = 0.39, mean values from session 5 to
10), which corresponds to 81% of the trust scale range. The fitted power function explained 44% of
the variance in the data (R2 = .443, see Table 5).
Figure 21. Development of trust in ACC and fitted power law.
Acceptance climbed dramatically after the first drive with ACC and remained rather stable for the
remaining sessions (Figure 22). Stabilization occurred at a relatively high level (M = 1.16, SD = 0.45
between session two and ten), corresponding to 79% of the acceptance scale range. However,
greater error bars indicate more variance in the acceptance scores, which led to a lower fit of the
power function (14% of explained variance, see R2 in Table 5).
4
4.5
5
5.5
6
1 2 3 4 5 6 7 8 9 10
trust
sco
re (1
to 7
)
sessions
mean trust score
fitted power law: y = 6.27 - 1,78x-0.7
error bars: ± 1 SE

65 On-road study
Figure 22. Development of ACC acceptance and fitted power law.
6.3.3 Learning
Learning progress was assessed using five items covering ACC operations (learning1), the meaning of
displayed ACC messages (learning2), manual override situations (learning3), overall ACC functionality
(learning4) and confidence in using the ACC (learning5). During every session, participants estimated
their learning level by answering the statement on a percentage scale. Figure 23 shows mean
percentage values for each session as well as the fitted power laws. Except for learning4 (overall ACC
functionality), all items showed a rapid rise at the beginning followed by a period of deceleration and
stabilization. Accordingly, power functions for learning1, 2, 3, and 5 showed a good fit with an
explained variance between 42% and 73% (R2 in Table 5). For learning4 on the overall ACC
functionality, participants indicated a rather high knowledge level (80%) after reading the owner’s
manual. Therefore, the learning progress was not as steep as for the other items and the power law
showed a relatively poor fit of 13% variance explained (R2 in Table 5). A general tendency of
stabilization for all learning curves could be observed approximately after the fifth session with an
overall mean level of 96% between sessions 5 and 10.

66 On-road study
Figure 23. Development of self-reported learning and fitted power law.
Table 5 shows the fitted power functions and goodness-of-fit statistics for all dependent variables.
Calculations were performed using the non-linear-regression-function (NLR) of IBM SPSS version 21.
The goodness-of-fit statistics indicate how close the observed data points are to the model’s
predicted values. R-squared ranges from 0 to 1 and denotes the improvement in prediction from the
regression model, relative to the mean model. The value can be interpreted as the proportion of
total variance that is explained by the model. Higher R-squared values indicate better fit. The root
mean squared error (RMSE) is the square root of the variance of the residuals and has the same units
as the response variable. It indicates the absolute fit of the model to the data, whereas R-squared is a
relative measure. Lower RMSE values indicate better fit.
Table 5. Power functions and goodness-of-fit.
Goodness-of-fit
Variable Power function
P(N|a, b, c) = a + bN-c
R-squared
(R2)
Root mean square error
(RMSE)
Trust P = 6.27 – 1,78x-0.7 .443 0.474
Acceptance P = 1.19 – 0.68x-2.55 .145 0.491
Learning1 P = 99.41 – 51.07x-1.37 .621 11.272
Learning2 P = 97.99 – 50,83x-2.06 .731 9.046
Learning3 P = 102.82 – 39.26x-0.85 .420 11.716
Learning4 P = 98.17 – 18.2x-0.89 .133 11.988
Learning5 P = 98.47 – 62.55x-1.48 .659 12.818
30
40
50
60
70
80
90
100
1 2 3 4 5 6 7 8 9 10
lear
ning
(0%
to 1
00%
)
error bars: ± 1 SE
learning1: I know how to operate the ACClearning2: I know what the displayed ACC-messages meanlearning3: I know when I have to be observant and may intervenelearning4: I know the overall functionality of the ACClearning5: I feel confident in using the ACC
sessions
X
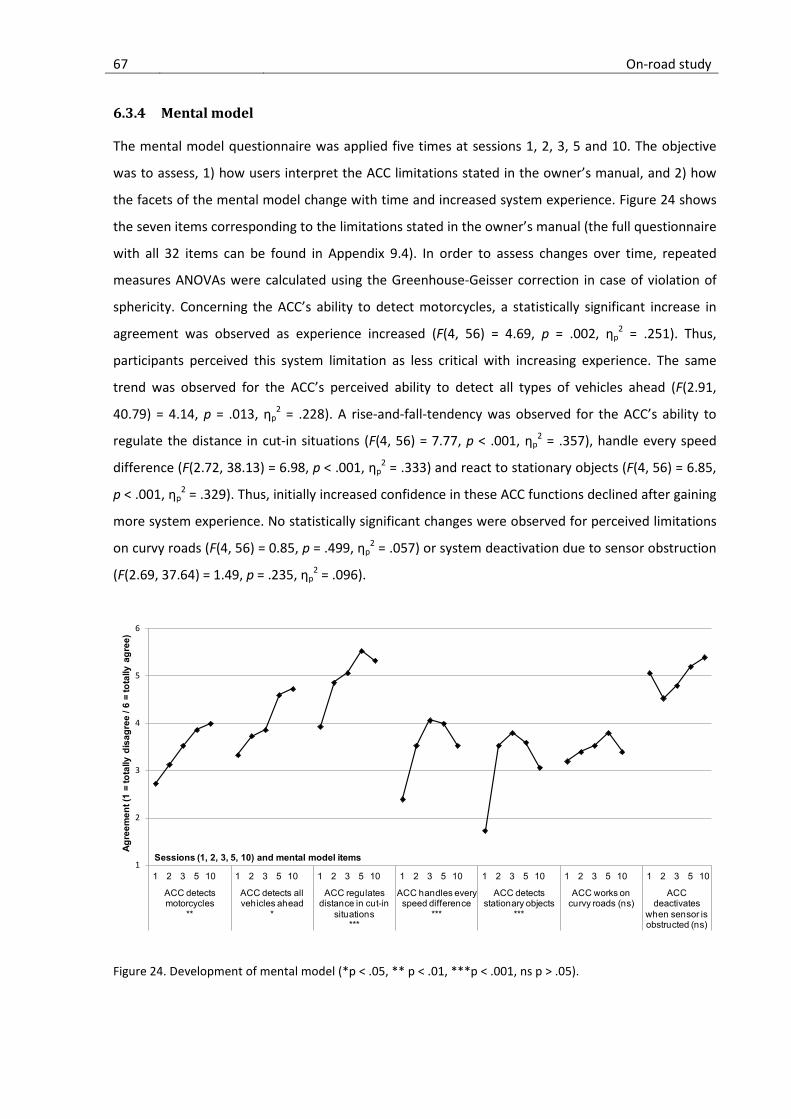
67 On-road study
6.3.4 Mental model
The mental model questionnaire was applied five times at sessions 1, 2, 3, 5 and 10. The objective
was to assess, 1) how users interpret the ACC limitations stated in the owner’s manual, and 2) how
the facets of the mental model change with time and increased system experience. Figure 24 shows
the seven items corresponding to the limitations stated in the owner’s manual (the full questionnaire
with all 32 items can be found in Appendix 9.4). In order to assess changes over time, repeated
measures ANOVAs were calculated using the Greenhouse-Geisser correction in case of violation of
sphericity. Concerning the ACC’s ability to detect motorcycles, a statistically significant increase in
agreement was observed as experience increased (F(4, 56) = 4.69, p = .002, ηp2 = .251). Thus,
participants perceived this system limitation as less critical with increasing experience. The same
trend was observed for the ACC’s perceived ability to detect all types of vehicles ahead (F(2.91,
40.79) = 4.14, p = .013, ηp2 = .228). A rise-and-fall-tendency was observed for the ACC’s ability to
regulate the distance in cut-in situations (F(4, 56) = 7.77, p < .001, ηp2 = .357), handle every speed
difference (F(2.72, 38.13) = 6.98, p < .001, ηp2 = .333) and react to stationary objects (F(4, 56) = 6.85,
p < .001, ηp2 = .329). Thus, initially increased confidence in these ACC functions declined after gaining
more system experience. No statistically significant changes were observed for perceived limitations
on curvy roads (F(4, 56) = 0.85, p = .499, ηp2 = .057) or system deactivation due to sensor obstruction
(F(2.69, 37.64) = 1.49, p = .235, ηp2 = .096).
Figure 24. Development of mental model (*p < .05, ** p < .01, ***p < .001, ns p > .05).
1
2
3
4
5
6
1 2 3 5 10 1 2 3 5 10 1 2 3 5 10 1 2 3 5 10 1 2 3 5 10 1 2 3 5 10 1 2 3 5 10
ACC detects motorcycles
**
ACC detects all vehicles ahead
*
ACC regulates distance in cut-in
situations ***
ACC handles every speed difference
***
ACC detects stationary objects
***
ACC works on curvy roads (ns)
ACC deactivates
when sensor is obstructed (ns)
Agre
emen
t (1
= to
tally
dis
agre
e / 6
= to
tally
agr
ee)
Sessions (1, 2, 3, 5, 10) and mental model items

68 On-road study
6.4 Discussion
Overall, results on the development of trust, acceptance and learning show a non-linear trend over
time. For all parameters, a steep growth was observed in the first sessions with a subsequent
stabilization and no substantial declines. The curve observed here resembles typical learning curves,
and consequently, when fitting the curve to the power law of learning, there is mostly a high
goodness-of-fit. Thus, the overall development of trust, acceptance and learning appears to be
similar to the process that occurs in other domains, such as perceptual-motor skills, memory,
perception, decision, motor behaviour and problem solving (overview in Lacroix and Cousineau,
2006).
Specifically, acceptance of ACC climbs rapidly after the first session and remains stable at a rather
high level after the first ACC experience. Trust stabilizes approximately after the fifth session, which
corresponds to 185 km or 3.5 hours of driving. A similar pattern of stabilization was observed for
aspects of self-reported learning. After the fifth session, participants reported high (96%) and stable
learning values for overall ACC functionality, confidence in the system, meaning of display messages,
operating the system, and handling manual override situations. Objective data on ACC usage showed
a constantly high usage on motorways with some fluctuation in the first four trials and a subsequent
stabilization. For the urban environment, the usage rate showed significant differences over time.
Participants adopted a different behaviour in the beginning and end of the study. The lower ACC
usage rate might indicate a more cautious behaviour in the first trials. In line with the subjective
data, the fifth trial seemed to be the one where the behaviour changed in a significant and steadier
way.
These results are consistent with previous findings from Simon (2005) as well as Ojeda and Nathan
(2004), which also indicated a rather fast and steep learning curve. Self-reported knowledge and
understanding of ACC functionality has been found to stabilize after two to three trips or 360 km of
driving (Ojeda & Nathan, 2004) and users report familiarity with system functionality after two days
of practice (Simon, 2005). The results of the present study are contrary to results found in
Weinberger et al. (2001), where familiarity with ACC controls was reported after two weeks of
driving or 2,800 km. However, these differences could result from the lower assessment rate (once
per week), lack of controlled instructions for using the ACC, or less technologically advanced ACC
systems available at the time. In contrast to the theoretical “satisfaction index” proposed by Winner
et al. (2003), trust and acceptance data does not show an initial peak followed by subsequent decline
due to experiencing an ACC that cannot automatically handle every situation. This discrepancy may
result from differences in the initial information presented to participants about the system and the
resulting initial mental model. Although participants in the present study were fully informed about
ACC limitations before using the system, it is possible that users who are not aware of potential

69 On-road study
limitations will initially exhibit over-confidence in the abilities of the system, followed by subsequent
disappointment as a result of experiencing unexpected problems. The critical impact of prior
information on trust and acceptance has been shown in the driving simulator study by Beggiato and
Krems (2013a). Trust and acceptance decrease dramatically in users who are not informed about
potential limitations; whereas, informed users show a steady growth curve – despite experiencing
the same system problems. Thus, it can be concluded that the power law of learning is applicable to
trust, learning and acceptance if users have an appropriate initial mental model of the system, i.e.
full information about the system’s functionality and limitations prior to first use.
Results from the mental model questionnaire provide insight into how information from the ACC
manual is understood and interpreted by users and how this interpretation changes due to
experience with the system. Participants’ rating of the ACC’s ability to detect different vehicle types
increased positively with experience. Thus, the system performed better in these situations than
participants expected from reading the manual. The rise-and-fall effect observed in the evaluation of
the system’s ability to regulate distance in cut-in situations, handle speed differences, and react to
stationary objects might have resulted from more extensive usage over time. With ongoing practice,
users tried more ACC functions and realized system limitations in these functional areas. The rather
optimistic evaluation after the first sessions decreased to a more realistic view by the last trips. The
system’s ability to function properly in bends was evaluated in the middle of the scale, showing no
statistically significant changes over time. The mental model created by reading the owner’s manual
appears to be largely congruent with on-road experience. The same conclusion can be drawn for ACC
deactivation due to sensor obstruction in adverse weather conditions, as no significant changes
occurred over time. Regarding the detection of motorcycles by the ACC, participants were uncertain
and sceptical in the beginning. Over time, this potential limitation was evaluated significantly less
critically. However, the inspection of video data from the forward camera showed that none of the
participants had ever encountered a motorbike. These results are consistent with findings from the
driving simulator study (chapter 5.4). If a potential limitation is not experienced, it tends to drop
from user’s mental model. According to the explanation of the cognitive processes involved in
constructing and updating a mental model (Durso et al., 2007; Krems & Baumann, 2009; Kintsch,
1998), bottom-up information which corresponds to the top-down memory structures accumulate
activation on associated knowledge nodes whereas non-activated nodes may disappear from long-
term memory.

70 General discussion and conclusions
7 General discussion and conclusions
7.1 Theoretical and practical considerations
The results of the studies show the enduring relevance of the initial mental model about ADAS for
the learning process, SA, the development of trust, acceptance and the subsequent formation of a
realistic mental model about automation possibilities and limitations. Preliminary information forms
an initial mental model of the system, which is updated by real experience. Drivers with correct initial
information on system limitations recognize such potentially critical situations already before they
actually arise. The awareness is measurable by the reduction in secondary task engagement at the
onset of such situations. Results show that also incorrect and incomplete initial mental models
converge towards a realistic appreciation of system functionality and users adapt their behaviour in
subsequent similar situations in terms of better SA. However, the more cognitive effort needed to
update an incorrect or incomplete mental model, the lower trust and acceptance. This is in line with
previous findings of Lee and See (2004), showing that effect of automation faults on trust depends
mainly on its predictability than on its magnitude. Therefore, a discrepancy between the operator’s
expectations and the behaviour of the automated system can undermine trust even when the system
performs well (Lee & See, 2004). Providing an idealised description, which omits potential problems,
only leads to temporarily higher trust and acceptance in the beginning. The experience of
unexpected failures results in a steady decrease in trust and acceptance over time. A trial-and-error
strategy for ACC use, without accompanying information, is therefore considered insufficient for
developing stable trust and acceptance. If mental model matches experience, trust and acceptance
grow steadily – regardless of the experience of system failures. Provided that such events are known
in advance, they will not cause a decrease in trust and acceptance over time. Even over-information
about potential problems lowers trust and acceptance only in the beginning, and not in the long run.
Potential problems should not be concealed in over-idealised system descriptions; the more
information given, the better, in the long run. Given the importance of the initial mental model it is
recommended that studies on system trust and acceptance should include, and attempt to control,
users’ initial mental model of system functionality.
The on-road study shows that learning, as well as the development of acceptance and trust in in-
vehicle automation can be modelled as a non-linear power function, given the presence of an
appropriate initial mental model of the system’s functionality and limitations. With these
preconditions, the power law of learning is applicable. Thus, the major part of the learning process
occurs during the first interaction with the system and support in explaining the systems abilities
(e.g. by tutoring systems) should primarily be given during this first stage. Stabilization occurs rather
fast (after approximately five trips) and no decline is observable with ongoing system experience. The

71 General discussion and conclusions
initial mental model formed by reading the owner’s manual becomes a more realistic evaluation of
system capabilities and limitations, as it is updated with ongoing practice.
However, results on the mental model development in both studies suggest that expected, but non-
experienced system limitations over time may drop out the mental model if they are not activated by
experience. Potential problems could be forgotten in the absence of periodic re-activation. The
results of Jenness et al. (2008), showing that 7 of 10 ACC users are not aware of manufacturers’
warnings about system limitations, could be interpreted from this point of view. It might explain why
“Surprisingly, at higher levels of experience respondents are more likely to say that their system
works ‘fairly well’ or ‘perfectly’ to help them avoid a collision in these situations [...] where ACC is not
likely to work well and they are usually included as warnings in the vehicle owner’s manual” (Jenness
et al., 2008, p. 23). This phenomenon touches on the “ironies of automation” (Bainbridge, 1983), as
an operator will not monitor automated processes efficiently if they have been working acceptably
for a long period. Since efficient retrieval of knowledge from memory depends on the frequency of
use, one potential solution suggested by Bainbridge (1983) is to periodically practice these critical
situations using simulators. This may be an adequate measure in domains such as aviation, but it is
obviously not feasible in road transportation. In the driving context, intelligent tutoring systems
incorporated in ADAS (Simon, 2005) could provide a solution. As most modern cars are equipped
with multifunction displays, periodic reminders about ACC limitations could be shown via this
interface. In addition, tutoring systems could also be used to remind the driver of the presence of
specific ADAS and reveal their benefits.
7.2 Methodological considerations
Mental model questionnaire: The developed and applied questionnaire is based on the definition of
mental models as long-term knowledge structures, which represents a user’s understanding of
situation-specific system functioning (Durso & Gronlund, 1999). The standardized questionnaire
approach offers some advantages: The assessment of profiles permits a quantification of mental
model facets. This allows for statistical tests between different groups and as well within subjects
over time. The latter is considered fruitful in the context of understanding processes of behavioural
adaptation, as it provides relevant insights by tracking changes of the mental model. Due to the
defined construction principle, the questionnaire can flexibly be adapted to various (technical)
systems outside of the transportation domain, as well. The mental model questionnaire allows the
transformation of statements as numbers, thereby making it useful for different purposes. That is, it
allows for checking: how users perceive and interpret information about a system; how their mental
model changes over time (e.g., due to experience); how mental models differ between groups (or
persons) and descriptions provided by different manufacturers; which information is unclear; and so
72 General discussion and conclusions
on. Due to standardization, statistics can be calculated, such as profile distances (see chapter 5.3.1)
or differences in single items (see Chapter 6.3.4). The questionnaire can be easily administered and
the analysis is straightforward.
The studies presented in this thesis show that the mental model questionnaire provides insights into
the construction of a mental model and its development over time. However, there are some
limitations of this approach. Designed as a standardized questionnaire, relevant items must be
selected in the development phase. In contrast to qualitative methods, such as focus groups or in-
depth interviews, users do not include their own topics but only rate existing statements. Moreover,
items need to be pretested to make certain that all questions are correctly understood. Another
limitation concerns unconscious/implicit aspects of mental models (Bellet et al., 2009). The
questionnaire technique only captures conscious aspects stored in long-term memory. Automatic
processes or implicit knowledge cannot be assessed. In sum, the mental model questionnaire is a
useful tool for quantifying conscious aspects of participants’ mental models, in a standardized and
comparable way.
Online SA assessment: The measurement of SA developed in the PhD project is designed as an
implicit performance-based approach, based on participants’ continuous completion of a secondary
task (SURT). It follows the principle of Rauch et al. (2009) that situationally aware drivers decide –
according to the demands of a present or imminent situation – if the execution of a secondary task is
possible without compromising driver safety. In contrast to prior studies, the secondary task is not
only implemented in specific situations but is continuously present, whereby users are asked to solve
as many secondary tasks as possible without neglecting the primary task of driving. A major
advantage of this implicit measurement approach is the possibility to assess SA online without the
need to interrupt a given situation. Artificial and intrusive freezing of a simulation is therefore not
necessary. Moreover, the measure is not biased by human judgement or memory errors in
retrospective SA evaluation. As task completion is a behavioural indicator, implicit knowledge also
enters into the SA evaluation, and not only conscious and explicit facts mentioned by users.
Therefore, the technique is applicable in the dynamic domain of driving, as many processes are
automated, unconscious and integrated in a holistic assessment. Further, it is considered especially
useful for assessing SA in connection with behavioural adaptation to ADAS, as it does not strongly
interfere in the dynamic interaction of driver, system and environment.
Results of the driving simulator study show that the measure is sensitive to user’s awareness of
potentially critical situations. However, there are some limitations of the SA measurement technique.
Firstly, it can only be applied in the context of a driving simulator and not on the road, as the
continuous engagement in secondary task completion under real traffic conditions poses safety and
ethical problems. Secondly, the total number of completed secondary tasks depends not only on SA,

73 General discussion and conclusions
but on other factors, such as motivation to engage in a task, as well. This is shown by the rather wide
range of completed tasks (from 115 to 1,082 per trip) in the driving simulator study. Differences in
total number of solved secondary tasks will be subject to further research of, for example,
personality factors. However, when trip duration is not too long it can be assumed that participants
maintain a consistent level of motivation. To solve the problem of differences in SURT completions,
the absolute rate can be transformed into relative values, such as percentages (see chapter 5.3.3),
rendering the evolvement of completion rates comparable. Another limitation of the technique is the
duration of a situation: While the technique is useful and appropriate for long-lasting situations, such
as car following or approaching, it is not suitable for situations where unexpected events require an
immediate reaction, for example, in the case of emergency braking. For these situations, other
measures, such as brake reaction time, are better indicators.
Database analysis framework: The amount of data created by every one of us is constantly growing
due to the increased use of technology in all parts of our lives. This process of “datafication” (Cukier
& Mayer-Schoenberger, 2013) takes almost all aspects of life and turns them into data. This concerns
for instance online and offline purchases, web browsing history, phone call data, position data from
navigation devices or smartphones, financial transactions, biometric data as well as video and audio
data. All this data represents human behaviour and is therefore an important objective source in
psychological science. However, classical data analysis tools in social science such as SPSS or Excel are
primarily centred on the statistical analysis of questionnaires. Data collected with a higher frequency
from sensors, logfiles, video or audio is difficult to process. This topic touches the “Big Data”-
discussion, as one elementary definition of Big Data includes all data that cannot be processed
anymore with classical software tools and technologies (Heuer, 2013). Especially in human factors
research there is a specific demand for combining objective sensor data from technical equipment
and subjective evaluations. Relational databases are one way of dealing with this emerging data
problem. Databases are designed for large, heterogeneous and related datasets, such as for instance
sensor data with different frequency, questionnaires, video and interview data from a study. The use
of a database is especially indicated when dealing with large datasets (i.e. more than 1 million
records), with relational data, when data sharing or parallel access is required, for persistent storage
and when complex retrieval procedures are needed. However, databases do not replace classical
analysis tools but extend them. In the data analysis process, databases cover the storage and
retrieval parts, whereas statistical analysis is still performed by common tools. The main operations
inside the database concern structuring and aggregating data, which indeed is the main analysis step
for large and heterogeneous datasets.
Alongside the benefits of using a database, new challenges arise for social scientists. Firstly, the
complexity of the data structure increases due to several related data types. However, this fact is

74 General discussion and conclusions
mainly related to the inherent complexity of the studies itself, e.g. when using different assessment
methods such as video, interviews and multiple sensors. Databases help to deal with data complexity
and do not create it. Secondly, researchers need to learn how to work with a database, i.e. using SQL
for querying the database. Despite SQL is a new data-processing language for most of the social
scientists, similarities to data analysis with standard tools are present, e.g. pivot-tables in Excel.
Therefore trainings can build on existing knowledge. The experience with the database seminar
carried out twice at the Professorship of Cognitive and Engineering Psychology at TU Chemnitz gives
convincing evidence that the use of databases can be a feasible way for tackling Big Data issues in
social science.
7.3 Limitations and directions for future research
A limitation of both studies is the fact that the participants were obviously interested in testing the
system and therefore maybe more motivated than a usual user would be. However, some degree of
interest in such a system must be present as well for real customer; otherwise the ADAS would
probably not be bought. In addition, the sampling process ensured that potential confounding
variables are equally distributed over the experimental groups, reducing selection bias as best as
possible. Another concern is the limited number of trials. The driving simulator study was limited to
three trials in a simulator environment, which provides a high level of experimental control but
limited external validity. Due to the repeated measures design, familiarization effects regarding the
simulator track and the measures of trust, acceptance and mental models cannot be ruled out
completely. However, the rather long time intervals between the test sessions (13 days on average)
should minimize familiarization, and potential effects can be considered equal for all experimental
groups. Furthermore, the continuous engagement in the secondary task as well as the randomization
of simulator track elements (position of trees, type and colour of the surrounding traffic) are
supposed to minimize learning effects. The on-road study extended the number of trials up to ten,
however, only for the condition of complete information about the ADAS. It would be very
interesting to know how trust, acceptance and the mental model evolve over longer time in case of
incomplete or incorrect preliminary information. Due to safety and ethical reasons it is hardly
possible to experimentally test this development in real conditions. However, further research using
data from naturalistic driving studies could explore this phenomenon.
The development of mental models, trust and acceptance will become an even more important issue
in more complex combinations of vehicle automation. Identifying and linking cognitive processes to
the vehicle is considered as a key factor on the roadmap from assisted driving towards autonomous
driving (Heide & Henning, 2006). Human-machine interaction issues are considered the most
important future research topic in the area of vehicle automation (Gasser, 2012). In the near future

75 General discussion and conclusions
drivers might experience some of the same challenges that are described for pilots on the flight deck,
such as e.g. mode awareness (Sarter & Woods, 1995). In the study of Larsson (2012) one third of ACC
users already reported mode errors in terms of having forgotten if the system was active or inactive.
Mental models are considered as an important factor for avoiding conflicts in complex combinations
of automation. As Flemisch et al. (2012) put it: “A sufficient consistency of the mental models of
human and machines, not only in the system use but also in the design and evaluation, can be a key
enabler for a successful dynamic balance between humans and machines” (p. 3).

76 References
8 References
Abdi, H., & Williams, L. J. (2010). Contrast analysis. In N. J. Salkind (Ed.), Encyclopedia of Research
Design (pp. 243–251). Thousand Oaks, CA, USA: Sage.
Adell, E. (2010). Acceptance of driver support systems. In J. Krems, T. Petzoldt, & M. Henning (Eds.),
Proceedings of the European conference on human centred design for intelligent transport
systems (pp. 475–486). Berlin, Germany: Humanist VCE.
Ausserer, K., & Risser, R. (2005). Intelligent Transport systems and services - chances and risks.
Proceedings of the 18th ICTCT-workshop. Helsinki, Finland.
Bainbridge, L. (1983). Ironies of automation. Automatica, 19(6), 775–779.
Baumann, M., & Krems, J. F. (2007). Situation awareness and driving. In P. C. Cacciabue (Ed.),
Modelling driver behaviour in automotive environments: Critical issues in driver interactions
with intelligent transport systems (pp. 253–265). London: Springer.
Beggiato, M., & Krems, J. F. (2012). The effects of preliminary information about adaptive cruise
control on trust and the mental model of the system: a matched-sample longitudinal driving
simulator study. In de Waard, D., Merat, N., Jamson, H., Barnard, Y., and Carsten, O.M.J. (Eds.),
Human Factors of Systems and Technology (pp. 63-74). Maastricht, the Netherlands: Shaker
Publishing.
Beggiato, M., & Krems, J. F. (2013a). The evolution of mental model, trust and acceptance of adaptive
cruise control in relation to initial information. Transportation Research Part F, 18, 47-57.
dx.doi.org/10.1016/j.trf.2012.12.006.
Beggiato, M., & Krems, J. F. (2013b). Auswirkungen erwarteter und unerwarteter Systemgrenzen von
Adaptive Cruise Control auf das Situationsbewusstsein im Zeitverlauf. In VDI (Eds.). Der Fahrer
im 21. Jahrhundert. VDI-Berichte 2205 (pp.119-132). Düsseldorf: VDI-Verlag.
Beggiato, M., & Krems, J. F. (2013c). Sequence analysis of glance patterns to predict lane changes on
urban arterial roads. Paper presented at 6. Tagung Fahrerassistenz - Der Weg zum
automatischen Fahren, Munich, 28.-29.11.2013. Retrieved from
http://mediatum.ub.tum.de/node?id=1187197.
77 References
Beggiato, M. (2014). Effect of ADAS use on drivers' information processing and Situation Awareness.
In A. Stevens, C. Brusque & J. Krems (Eds.) Driver adaptation to information and assistance
systems (pp. 57-80). London: The Institution of Engineering and Technology (IET).
Bellet, T., Bailly-Asuni, B., Banet, A., & Mayenobe, P. (2009). A theoretical and methodological
framework for studying and modelling drivers’ mental representations. Safety Science, 47(9),
1205–1221.
Breton, R., & Rousseau, R. (2001). Situational Awareness. A review of the concept and its
measurement (Technical Report No. 2001–220). Valcartier: Defense Research and
Development Canada.
Cacciabue, P. C., & Saad, F. (2008). Behavioural adaptations to driver support systems: a modelling
and road safety perspective. Cognition, Technology & Work, 10(1), 31–39.
Cahour, B., & Forzy, J. F. (2009). Does projection into use improve trust and exploration? An example
with a cruise control system. Safety Science, 47, 1260–1270.
Carroll, J. M., & Olson, J. R. (1987). Mental models in human-computer interaction: Research issues
about what the user of software knows. Committee on Human Factors, Commission on
Behavioral and Social Sciences and Education, National Research Council. Washington, D.C.:
National Academy Press.
Cherri, C., Nodari, E., & Toffetti, A. (2004). Review of existing tools and methods (Del. 2.1.1 of AIDE
IST-1-507674-IP). Retrieved November 28, 2012, from http://www.aide-
eu.org/pdf/sp2_deliv_new/aide_d2_1_1.pdf.
Cocron, P., Bühler, F., Franke, T., Neumann, I., Dielmann, B., & Krems, J. F. (2013). Energy recapture
through deceleration – regenerative braking in electric vehicles from a user perspective.
Ergonomics, 1–13. doi:10.1080/00140139.2013.803160.
Cotter, S., & Mogilka, A. (2007). Methodologies for the assessment of ITS in terms of driver
appropriation processes over time. HUMANIST Project Deliverable 6 of Task Force E. Retrieved
November 28, 2012, from http://www.noehumanist.org/documents/Deliverables/TFE/E-6-
HUMANIST_TRL_deliverable_VA1.pdf.
Cukier, K., & Mayer-Schönberger, V. (2013). The rise of big data: How it's changing the way we think
about the world. Foreign Affairs, May/June.

78 References
Czaja, S. J., & Nair, S. N. (2012). Human Factors Engineering and Systems Design. In G. Salvendy (Ed.),
Handbook of human factors and ergonomics (4th ed., pp. 38–56). Hoboken: John Wiley & Sons.
Dingus, T. A., Knipling, R. R., Jermeland, J., Doerzaph, Z. R., Bucher, C., Gupta, S., … (2006). The 100-
car naturalistic driving study. Phase II, results of the 100-car field experiment. DOT HS 810 593.
National Highway Traffic Safety Administration. Retrieved from
http://www.nhtsa.gov/DOT/NHTSA/NRD/Multimedia/PDFs/Crash%20Avoidance/2006/100Car
Main.pdf.
Dotzauer, M., Berthon-Donk, V., Beggiato, M., Haupt, J., & Piccinini, G. (2014). Methods to assess
behavioural adaptation over time as a result of ADAS use. In A. Stevens, C. Brusque & J. Krems
(Eds). Driver adaptation to information and assistance systems (pp. 35-55). London: The
Institution of Engineering and Technology (IET).
Durso, F. T., Bleckley, M. K., & Dattel, A. R. (2006). Does SA add to the predictive validity of cognitive
tests? Human Factors, 48, 721–733.
Durso, F. T., & Gronlund, S. D. (1999). Situation awareness. In F.T. Durso, R. Nickerson, R.
Schvaneveldt, S. Dumais, S. Lindsay, & M. Chi (Eds.), Handbook of applied cognition (pp. 284–
314). New York, USA: John Wiley & Sons, Ltd.
Durso, F. T., Rawson, K. A., & Girotto, S. (2007). Comprehension and situation awareness. In F. T.
Durso, R. S. Nickerson, S. T. Dumais, S. Lewandowsky, and T. J. Perfect (Eds.), Handbook of
applied cognition (2nd ed., pp. 163–193). Chichester, UK: John Wiley & Sons, Ltd.
Durso, F. T., & Sethumadhavan, A. (2008). Situation awareness: Understanding dynamic
environments. Human Factors, 50(3), 442–448.
Endsley, M. R. (1988). Situation Awareness Global Assessment Technique (SAGAT). Proceedings of the
National Aerospace and Electronics Conference (NAECON) (pp. 789-795). New York: IEEE.
Endsley, M. R. (1990). Predictive utility of an objective measure of situation awareness. Proceedings
of the Human Factors Society 34th Annual Meeting, (pp. 41-45). Santa Monica, CA: Human
Factors & Ergonomics Society.
Endsley, M. R. (1995). Toward a theory of situation awareness in dynamic systems. Human Factors,
37(1), 32–64.

79 References
Endsley, M. R. (2000). Situation models: An avenue to the modeling of mental models. Proceedings of
the Human Factors and Ergonomics Society 44th Annual Meeting, (pp. 61–64).
doi:10.1177/154193120004400117.
it-novum GmbH. (2011). Open Source Datenbanken für analytische Systeme. Retrieved from www.it-
novum.com/download.
Flemisch, F., Heesen, M., Hesse, T., Kelsch, J., Schieben, A., & Beller, J. (2012). Towards a dynamic
balance between humans and automation: authority, ability, responsibility and control in
shared and cooperative control situations. Cognition, Technology & Work, 14(1), 3–18.
Gasser, T. M., Arzt, C., Ayoubi, M., Bartels, A., Eier, J., Flemisch, F., … (2012). Rechtsfolgen
zunehmender Fahrzeugautomatisierung. Berichte der Bundesanstalt für Strassenwesen -
Fahrzeugtechnik (F): Vol. 83. Bremerhaven: Wirtschaftsverl. NW Verl. für neue Wissenschaft.
Gasser, T. M. (2012). Ergebnisse der Projektgruppe Automatisierung: Rechtsfolgen zunehmender
Fahrzeugautomatisierung.: 5. Tagung Fahrerassistenz. 15.-16. Mai 2012 in München. Retrieved
from http://www.ftm.mw.tum.de/uploads/media/05_Gasser.pdf.
Ghazizadeh, M., Lee, J. D., & Boyle, L. N. (2012). Extending the Technology Acceptance Model to
assess automation. Cognition, Technology & Work, 14(1), 39–49.
Göbel, P. (2012). Der Einfluss von locus of control und sensation seeking auf das Fahrverhalten und
die Nutzung des ACC. (Bachelor's thesis). TU Chemnitz.
Grieger, S. (2013). Akzeptanz eines ACC im Zeitverlauf. Eine Fahrsimulatorstudie mit parallelisierter
Stichprobe. (Bachelor's thesis). TU Chemnitz.
Gugerty, L. (1997). Situation awareness during driving: Explicit and implicit knowledge in dynamic
spatial memory. Journal of Experimental Psychology: Applied, 3, 42–66.
Gugerty, L. (2011). Situation awareness in driving. In Fisher, D. L., Rizzo, M., Caird, J. K., & Lee, J. D.
(Eds). Handbook of driving simulation for engineering, medicine, and psychology (pp. 265–272).
Boca Raton, FL: CRC Press.
Hauß, Y., & Timpe, K.-P. (2000). Automatisierung und Unterstützung im Mensch-Maschine-System. In
K.-P. Timpe, T. Jürgensohn, & H. Kolrep (Eds.), Mensch-Maschine-Systemtechnik. Konzepte,
Modellierung, Gestaltung, Evaluation (pp. 41–60). Düsseldorf: Symposion.

80 References
Heide, A., & Henning, K. (2006). The ‘‘cognitive car’’: A roadmap for research issues in the automotive
sector. Annual Reviews in Control, 30(2), 197–203.
Heuer, S. (2013). Kleine Daten, große Wirkung. Big Data einfach auf den Punkt gebracht.
Digitalkompakt, Nr. 6, Landesanstalt für Medien (LFM). Retrieved from www.lfm-nrw.de.
Hoyle, R. H., Stephenson, M. T., Palmgreen, P., Lorch, E. P., & Donohew, R. L. (2002). Reliability and
validity of a brief measure of sensation seeking. Personality and Individual Differences, 32(3),
401–414.
Hummel, T., Kühn, M., Bende, J., & Lang, A. (2011). Advanced Driver Assistance Systems: An
investigation of their potential safety benefits based on an analysis of insurance claims in
Germany. Research report FS 03. Berlin: German Insurance Association - Insurers Accident
Research.
ISO 15622 (2002). Transport information and control systems – Adaptive Cruise Control systems –
Performance requirements and test procedures.
Itoh, M. (2012). Toward overtrust-free advanced driver assistance systems. Cognition, Technology &
Work, 14(1), 51–60. doi:10.1007/s10111-011-0195-2.
Jahn, G., Krems, J. F., & Gelau, C. (2009). Skill Acquisition While Operating In-Vehicle Information
Systems: Interface Design Determines the Level of Safety-Relevant Distractions. Human
Factors: The Journal of the Human Factors and Ergonomics Society, 51(2), 136–151.
doi:10.1177/0018720809336542.
Jenness, J. W., Lerner N. D., Mazor, S., Osberg J. S., & Tefft, B. C. (2008). Use of Advanced In-vehicle
Technology by Young and Older Early Adopters. Survey Results on Adaptive Cruise Control
Systems. Report No. DOT HS 810 917. Washington, D.C.: U.S. Department of Transportation,
National Highway Traffic Safety Administration.
Jian, J. Y., Bisantz, A. M., & Drury, C. G. (2000). Foundations for an empirically determined scale of
trust in automated systems. International Journal of Cognitive Ergonomics, 4(1), 53–71.
Jones, D. G. (2000). Subjective measures of situation awareness. In M. R. Endsley, & D. J. Garland
(Eds.), Situation awareness analysis and measurement (pp. 101–114). Mahwah, NJ: Lawrence
Erlbaum Associates.

81 References
Kazi T. A., Stanton N. A., Walker G. H., & Young M. S. (2007). Designer driving: drivers' conceptual
models and level of trust in adaptive cruise control. International Journal of Vehicle Design,
45(3), 339–360.
Kazi, T. A., Stanton, N. A., Young, M. S., & Harrison, D. A. (2005). Assessing drivers’ level of trust in
Adaptive-Cruise-Control and their conceptual models of the system: Implications for system
design. In L. Dorn (Ed.), Driver Behaviour and Training - Volume 2 (pp. 132–142). Aldershot, UK:
Ashgate.
Kintsch, W. (1998). Comprehension: A paradigm for cognition. New York, USA: Cambridge University
Press.
Klamroth, A., & Winkler, J. (2013). Einfluss von Fahrermerkmalen auf die Nutzung eines ACC und das
Fahrverhalten im Fahrsimulator. (Bachelor's thesis). TU Chemnitz.
Kompass, K., Huber, W., & Helmer, T. (2012). Safety and Comfort Systems: Introduction and
Overview. In A. Eskandarian (Ed.), Handbook of intelligent vehicles (pp. 605–612). New York:
Springer.
Krems, J. F., & Baumann, M. (2009). Driving and Situation Awareness: A Cognitive Model of Memory-
Update Processes. In M. W. Greenlee (Ed.), New Issues in Experimental and Applied Psychology
(pp. 56–75). Lengerich, Germany: Pabst.
Krems, J., Brusque, C., & Stevens, A. (2014). The ADAPTATION Project. In A. Stevens, C. Brusque, & J.
Krems (Eds.), Driver adaptation to information and assistance systems (pp. 1–11). London:
Institution of Engineering and Technology.
Lacroix, G. L., & Cousineau, D. (2006). The introduction to the special issue on "RT(N) = a + b N-c: The
power law of learning 25 years later. Tutorials in Quantitative Methods for Psychology, 2(2),
38–42.
Larsson, A. F. L. (2012). Driver usage and understanding of adaptive cruise control. Applied
Ergonomics, 43(3), 501–506.
LeBlanc, D., Gordon, T., Goodsell, R., Bareket, Z., Hagan, M., Mefford, M., … (2006). Road departure
crash warning system field operational test: methodology and results. Volume 1: technical
report. UMTRI-2006-9-1. National Highway Traffic Safety Administration. Retrieved from

82 References
http://www.nhtsa.gov/DOT/NHTSA/NRD/Multimedia/PDFs/Crash%20Avoidance/2006/RDCW-
Final-Report-Vol-1_JUNE.pdf.
Lee, J. D., & See, K. A. (2004). Trust in automation: Designing for appropriate reliance. Human
Factors, 46(1), 50–80.
Lietz, H., Petzoldt, T., Henning, M., Haupt, J., Wanielik, G., Krems, J., ... (2010). Methodische und
technische Aspekte einer Naturalistic Driving Study. BASt FE 82.0351/2008. FAT-Schriftenreihe:
Vol. 229. Berlin: VDA.
Mahrt, M. (2006). OpenOffice.org 2.0 Base. Köln: O'Reilly.
Martens, M. H., & Jenssen, G. D. (2012). Behavioural adaptation and acceptance. In A. Eskandarian
(Ed.), Springer Reference. Handbook of intelligent vehicles (pp. 117–138). New York: Springer.
Mattes, S., & Hallén, A. (2009). Surrogate distraction measurement techniques: The Lane Change
Test. In M. Regan, J. D. Lee, & K. L. Young (Eds.), Driver distraction: Theory, effects and
mitigation (pp. 107–122). Boca Raton: CRC Press.
Mehlenbacher, B., Wogalter, M. S., & Laughery, K. R. (2002). On the reading of product owner’s
manuals: Perceptions and product complexity. Proceedings of the Human Factors and
Ergonomics Society 46th Annual Meeting (pp. 730–734), Santa Monica, CA: Human Factors and
Ergonomics Society.
Metz, B., Schömig, N., & Krüger, H.-P. (2011). Attention during visual secondary tasks in driving:
Adaptation to the demands of the driving task. Transportation Research Part F: Traffic
Psychology and Behaviour, 14(5), 369–380.
Metzner, M. (2012). Einfluss von Vorinformationen über ACC auf Situation Awareness. (Master's
thesis). TU Chemnitz.
Meyer, G., & Deix, S. (2014). Research and innovation for automated driving in Germany and Europe.
In G. Meyer & S. Beiker (Eds.), Lecture Notes in Mobility. Road Vehicle Automation (pp. 71–84).
Cham, s.l: Springer International Publishing.
Montag, I., & Comrey, A. L. (1987). Internality and externality as correlates of involvement in fatal
driving accidents. Journal of Applied Psychology, 72(3), 339–343.

83 References
Muir, B. M. (1994). Trust in automation: part 1. Theoretical issues in the study of trust and human
intervention in automated systems. Ergonomics, 37(11), 1905–1922.
Muir B. M., & Moray, N. (1996). Trust in automation: II. Experimental studies of trust and human
intervention in a process control simulation. Ergonomics, 39(3), 429–460.
Najm, W. G., Stearns, M. D., Howarth, H., Koopmann, J., & Hitz, J. (2006). Evaluation of an
automotive rear-end collision avoidance system. Report no. DOT HS-810-569. Washington,
D.C.: U.S. Department of Transportation, National Highway Traffic Safety Administration.
Newell, A., & Rosenbloom, P. S. (1981). Mechanisms of Skill Acquisition and the Law of Practice. In J.
R. Anderson (Ed.), Cognitive Skills and their Acquisition (pp. 1–55). Hillsdale, NJ: Erlbaum.
OECD. (1990). Behavioural adaptations to changes in the road transport system. Paris: Organization
for Economic Co-operation and Development.
Ojeda, L., & Nathan, F. (2006). Studying learning phases of an ACC through verbal reports. In R.F.T.
Brouwer & D.M. Hoedemaeker (Eds.), Driver support and information systems: Experiments on
learning, appropriation and effects of adaptiveness. Del. 1.2.3 of AIDE IST-1-507674-IP (pp. 47–
73). Retrieved from http://www.aide-eu.org/pdf/sp1_deliv_new/aide_d1_2_3.pdf.
Oswald, W. D., & Roth, E. (1986). Der Zahlen-Verbindungs-Test. Göttingen, Bern, Toronto, Seattle:
Hogrefe Verlag für Psychologie.
Parasuraman, R., Sheridan, T., & Wickens, C. D. (2000). A model for types and levels of human
interaction with automation. Systems, Man and Cybernetics, Part A: Systems and Humans, IEEE
Transactions on, 30(3), 286–297. doi:10.1109/3468.844354.
Pereira, M., Lietz, H., & Beggiato, M. (2014). Development of a database for storage and analysis of
behavioural data. In A. Stevens, C. Brusque, & J. Krems (Eds.), Driver adaptation to information
and assistance systems (pp. 301–317). London: Institution of Engineering and Technology.
Popken, A. (2009). Drivers’ reliance on lane keeping assistance systems as a function of the level of
assistance. (Doctoral dissertation). Retrieved November 28, 2012, from http://archiv.tu-
chemnitz.de/pub/2010/0048/index.html.
Popken, A., & Krems, J. F. (2011). Automation and situation awareness. In G. Boy (Ed.). The handbook
of human-machine interaction. A human-centered design approach (pp. 75–90). Farnham:
Ashgate.

84 References
Pritchett, A. R., & Hansman, R. J. (2000). Use of testable responses for performance-based
measurement of situation awareness. In M. R. Endsley, & D. J. Garland (Eds.), Situation
awareness analysis and measurement (pp. 170–189). Mahwah, NJ: Lawrence Erlbaum
Associates.
Rajaonah, B., Anceaux, F., & Vienne, F. (2006). Trust and the use of adaptive cruise control: A study of
a cut-in situation. Cognition, Technology and Work, 8(2), 146–155. doi:10.1007/s10111-006-
0030-3.
Rajaonah, B., Tricot, N., Anceaux, F., & Millot, P. (2008). The role of intervening variables in driver–
ACC cooperation. International Journal of Human-Computer Studies, 66(3), 185–197.
Rammstedt, B., & John, O. P. (2007). Measuring personality in one minute or less: A 10-item short
version of the Big Five Inventory in English and German. Journal of Research in Personality,
41(1), 203–212.
Rauch, N. (2009). Ein verhaltensbasiertes Messmodell zur Erfassung von Situationsbewusstsein im
Fahrkontext. (Doctoral dissertation). Retrieved from http://opus.bibliothek.uni-
wuerzburg.de/volltexte/2009/3722/.
Rauch, N., Gradenegger, B., & Krüger, H.-P. (2009). Darf ich oder darf ich nicht?:
Situationsbewusstsein im Umgang mit Nebenaufgaben während der Fahrt. Zeitschrift für
Arbeitswissenschaft, 63(1), 3–15.
Rosenthal, R., Rosnow, R. L., & Rubin, D. B. (2000). Contrasts and effect sizes in behavioral research: A
correlational approach. Cambridge, UK, Cambridge University Press.
Rousseau, R., Tremblay, S., & Breton, R. (2004). Defining and modeling situation awareness: A critical
review. In S. Banbury, & S. Tremblay (Eds.), A cognitive approach to situation awareness:
Theory, measurement and application (pp. 3–21). Aldershot, UK: Ashgate & Town.
Rudin-Brown, C. M., & Noy, Y. I. (2002). Investigation of behavioral adaptation to lane departure
warnings. Transportation Research Record, no. 1803, 30–37.
Rudin-Brown, C. M., & Parker, H. A. (2004). Behavioural adaptation to adaptive cruise control (ACC):
implications for preventive strategies, Transportation Research Part F: Traffic Psychology and
Behaviour, 7(2), 59–76.

85 References
Saad, F. (2007). Dealing with Behavioural Adaptations to Advanced Driver Support Systems. In P.C.
Cacciabue (Ed.), Modelling driver behaviour in automotive environments (pp. 147–162).
London: Springer.
Sarter, N. B., & Woods, D. D. (1995). How in the world did we ever get in that mode? Mode error and
awareness in supervisory control. Human Factors, 37(1), 5–19.
Schade, J., & Baum, M. (2007). Reactance or acceptance? Reactions towards the introduction of road
pricing. Transportation Research Part A, 41(1), S. 41-48.
Schmidt, K. (2012). Analyse mehrdimensionaler Zeitreihen eines Fahrsimulators. (Master's thesis). TU
Chemnitz.
Schmidt, K., Beggiato, M., Hoffmann, K. H., & Krems, J. F. (2014). A mathematical model for
predicting lane changes using the steering wheel angle. Journal of Safety Research, 49, 85–90.
doi:10.1016/j.jsr.2014.02.014.
Schömig, N., Metz, B., & Krüger, H.-P. (2011). Anticipatory and control processes in the interaction
with secondary tasks while driving. Transportation Research Part F: Traffic Psychology and
Behaviour, 14(6), 525–538.
Schwarzwäller, M. (2013). Transformationsprozesse des mentalen Modells eines ACC durch
Erfahrung. Ein mixed methods Ansatz. (Bachelor's thesis). TU Chemnitz.
Seppelt, B. D., & Lee, J. D. (2007). Making adaptive cruise control (ACC) limits visible. International
Journal of Human Computer Studies, 65(3), 192–205. doi:10.1016/j.ijhcs.2006.10.001
Sheridan, T. B., & Verplank, W. L. (1978). Human and computer control of undersea teleoperators.
Cambridge: Massachusetts Institute of Technology, Man-Machine Systems Laboratory.
Simon, J. (2005). Learning to drive with Advanced Driver Assistance Systems. Empirical studies of an
online tutor and a personalised warning display on the effects of learnability and the
acquisition of skill. (Doctoral dissertation). Retrieved from http://archiv.tu-
chemnitz.de/pub/2006/0071/data/Dissertation_Simon.pdf.
Stanton, N., & Young, M. S. (2005). Driver behaviour with adaptive cruise control. Ergonomics,
48(10), 1294−1313.

86 References
Taylor, R. M. (1990). Situation awareness rating technique (SART): The development of a tool for
aircrew systems design. Situational awareness in aerospace operations (AGARD-CP-478; pp.
3/1-3/17). Neuilly sur Seine, France: NATO Advisory Group for Aerospace Research and
Development.
Tsang, P., & Vidulich, M. A. (2006). Mental workload and situation awareness. In G. Salvendy (Ed.),
Handbook of human factors & ergonomics (pp. 243–268). Hoboken, NJ: Wiley.
Van der Laan, J. D., Heino, A., & De Waard, D. (1997). A simple procedure for the assessment of
acceptance of advanced transport telematics. Transportation Research Part C: Emerging
Technologies, 5(1), 1–10. doi:10.1016/S0968-090X(96)00025-3.
Vidulich, M. A., & Hughes, E. R. (1991). Testing a subjective metric of situation awareness.
Proceedings of the Human Factors & Ergonomics Society 35th Annual Meeting, (pp.
1307−1311). Santa Monica, CA: Human Factors & Ergonomics Society.
Vollrath, M., & Krems, J. (2011). Verkehrspsychologie: Ein Lehrbuch für Psychologen, Ingenieure und
Informatiker. Stuttgart: Kohlhammer.
Waag, W. L., & Houck, M. R. (1994). Tools for assessing situational awareness in an operational
fighter environment. Aviation, Space, and Environmental Medicine, 65(5, Suppl.), 13–19.
Ward, N. (2000). Automation of task processes: An example of intelligent transportation systems.
Human Factors and Ergonomics in Manufacturing, 10(4), 395–408.
Weinberger, M., Winner, H., & Bubb, H. (2001). Adaptive cruise control field operational test—the
learning phase. JSAE review, 22(4), 487–494. doi:10.1016/S0389-4304(01)00142-4.
Weller, G., & Schlag, B. (2004). Verhaltensadaptation nach Einführung von Fahrerassistenzsystemen.
In B. Schlag (Ed.), Verkehrspsychologie. Mobilität – Verkehrssicherheit – Fahrerassistenz (pp.
351−370). Lengerich: Pabst Science Publishers.
Winner, H., Barthenheier, T., Fecher, N., & Luh, S. (2003). Fahrversuche mit Probanden zur
Funktionsbewertung von aktuellen und zukünftigen Fahrerassistenzsystemen. In K. Landau
(Ed.), Fortschritt-Berichte VDI Reihe 12, Verkehrstechnik/Fahrzeugtechnik: Vol. 557.
Fahrversuche mit Probanden - Nutzwert und Risiko. Düsseldorf: VDI-Verlag.

87 References
Winner, H., Danner, B., & Steinle, J. (2012). Adaptive Cruise control. In H. Winner, S. Hakuli, & G. Wolf
(Eds.), Handbuch Fahrerassistenzsysteme (2nd ed., pp. 478–521). Wiesbaden: Vieweg +
Teubner.
Xiao, L., & Gao, F. (2010). A comprehensive review of the development of adaptive cruise control
systems. Vehicle System Dynamics, 48(10), 1167–1192. doi:10.1080/00423110903365910.
Xiong, H., Boyle, L., Moeckli, J., Dow, B., & Brown, T. (2012). Use patterns among early adopters of
adaptive cruise control (ACC). Human Factors, 54(5), 722–733.
Zwaan, R.A., Magliano, J.P., & Graesser, A.C. (1995). Dimensions of situation model construction in
narrative comprehension. Journal of Experimental Psychology: Learning, Memory, and
Cognition, 21, 386–397.
Zwaan, R. A., Radvansky, G. A., Hilliard, A. E., & Curiel, J. M. (1998). Constructing multidimensional
situation models during reading. Scientific Studies of Reading, 2(3), 199–220.

88 Appendix - Questionnaires used in the driving simulator study
9 Appendix
9.1 Questionnaires used in the driving simulator study
9.1.1 Original German version

89 Appendix - Questionnaires used in the driving simulator study

90 Appendix - Questionnaires used in the driving simulator study

91 Appendix - Questionnaires used in the driving simulator study
9.1.2 English translation

92 Appendix - Questionnaires used in the driving simulator study

93 Appendix - Questionnaires used in the driving simulator study

94 Appendix - ACC descriptions used in the driving simulator study
9.2 ACC descriptions used in the driving simulator study
9.2.1 Correct description

95 Appendix - ACC descriptions used in the driving simulator study
9.2.2 Incomplete description

96 Appendix - ACC descriptions used in the driving simulator study
9.2.3 Incorrect description

97 Appendix - Schematic overview of the driving simulator track
9.3 Schematic overview of the driving simulator track

98 Appendix - Schematic overview of the driving simulator track

99 Appendix - Questionnaires used in the on-road study
9.4 Questionnaires used in the on-road study
9.4.1 Original German version
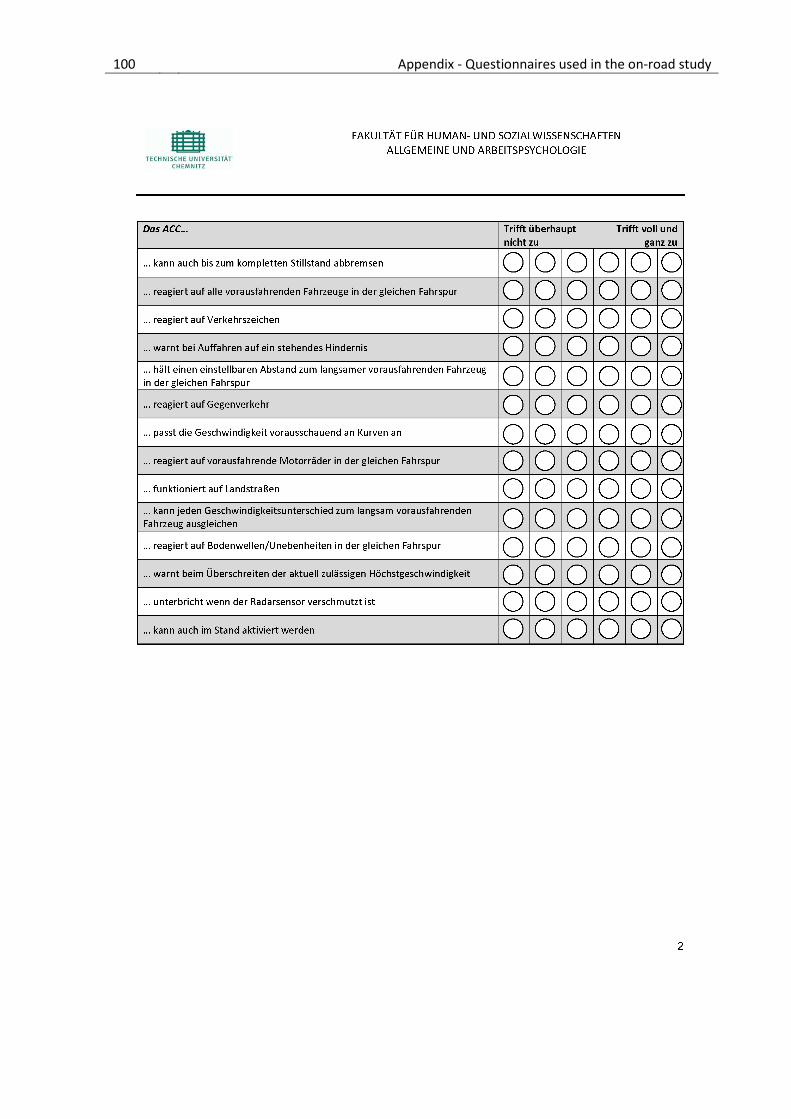
100 Appendix - Questionnaires used in the on-road study

101 Appendix - Questionnaires used in the on-road study
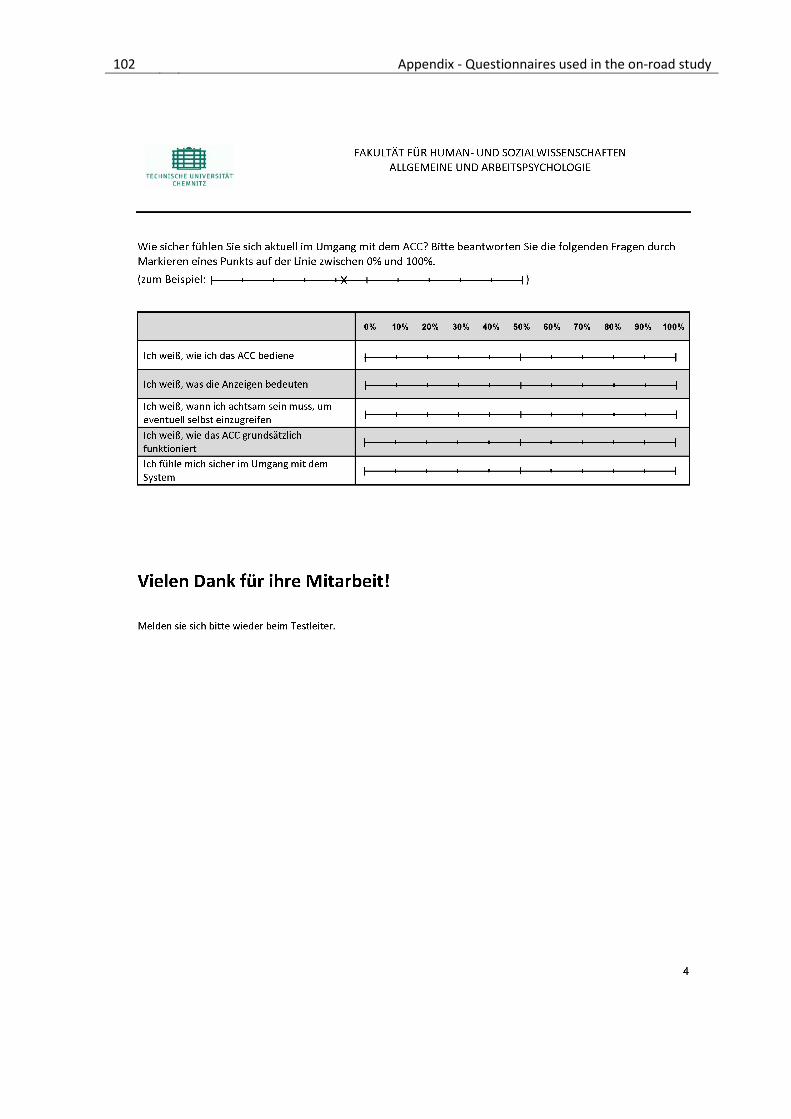
102 Appendix - Questionnaires used in the on-road study

103 Appendix - Questionnaires used in the on-road study
9.4.2 English translation

104 Appendix - Questionnaires used in the on-road study

105 Appendix - Questionnaires used in the on-road study

106 Appendix - Questionnaires used in the on-road study
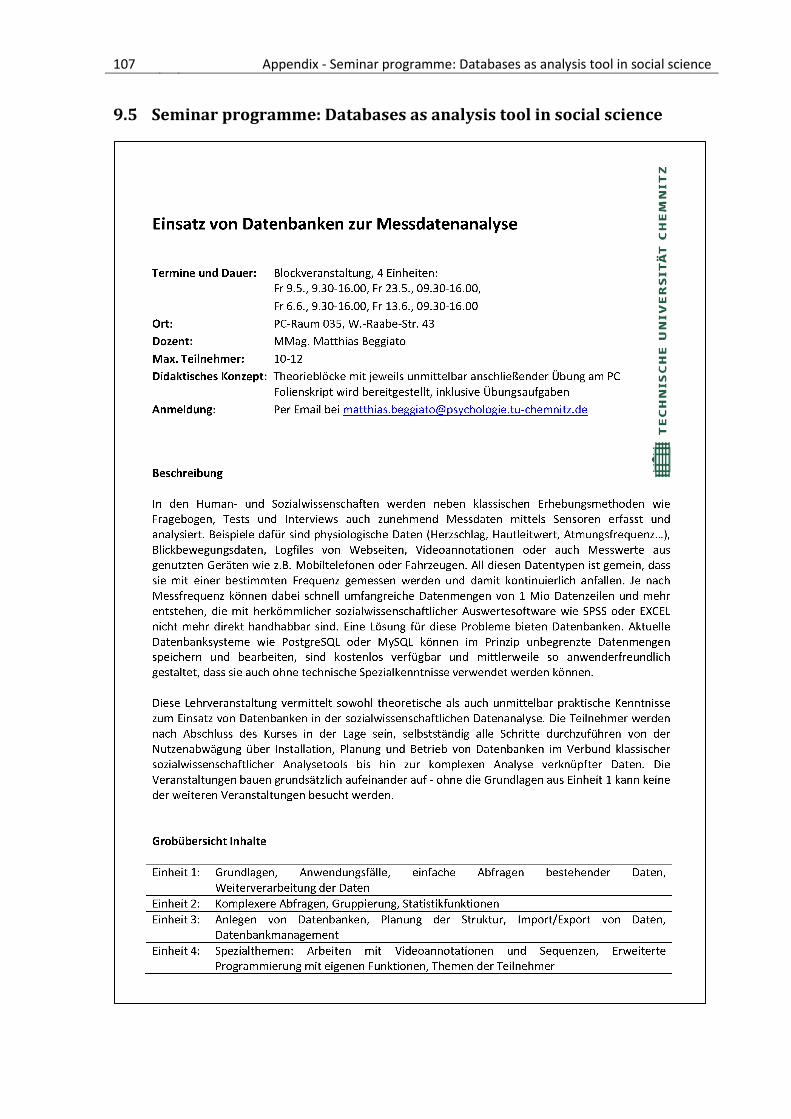
107 Appendix - Seminar programme: Databases as analysis tool in social science
9.5 Seminar programme: Databases as analysis tool in social science

108 Appendix - Seminar programme: Databases as analysis tool in social science

109 Appendix - Curriculum vitae and publications
9.6 Curriculum vitae and publications
Chemnitz University of Technology Department of Psychology – Cognitive and Engineering Psychology
Phone: +49 371 531-38654 Email: [email protected]
MMag. BEGGIATO MATTHIAS born on 11.03.1976 in Bruneck (South Tyrol, Italy), citizenship: Italian
EDUCATION
1982-1990 Primary school in Sand in Taufers
1990-1995 „Gewerbeoberschule Max Valier“ secondary school for computer science, Bozen
1995 - 1996 EU vocational training course „technician for system-integration“
September 1998 Bilingualism exam for German and Italian, category „A“
October 1998 - November 2004
Master’s degree in Psychology at the University of Vienna
March 2000 - March 2005
Master’s degree in educational science at the University of Vienna
2005 – 2006 Postgraduate education as clinical and health psychologist
March 2006 ECDL-Advanced-Expert exam (expert knowledge in MS Office) PROFESSIONAL EXPERIENCE
1990-1996 Different summer jobs as sales assistant, construction worker, forestry worker, postal clerk and programmer
October 1996 - December 1997
Freelancer (interviewer) at the market-research institute "Info Research International" in Vienna
January 1998 - October 1998
Civilian service at the organization for disabled people „Lebenshilfe“ in Bozen
Summer 1999 + Summer 2000
Attendant at a social project for teenagers from difficult social conditions in Bruneck
2001-2002 Summer jobs in the hotel and restaurant industry (South Tyrol)
Summer 2003 Six-week traineeship in the Psychological Service of Bruneck
October 2003 - December 2004
Junior researcher at the Institute of Psychology, University of Vienna (Prof. DDr. Christian Klicpera, BeLiS-Study)
April 2005 – September 2006
Traineeships at Fonds Soziales Wien (dep. for disabled persons), WUK Domino (vocational guidance) and FACTUM/INFAR (traffic psychology)
May 2006 – April 2007
Conducting the study JOBFIT concerning the career history of young people with special needs
September 2006 – December 2009
Junior researcher and traffic psychologist at FACTUM OHG Vienna (traffic and Social analysis)
Since March 2007
Consulting activities concerning socio-scientific methods for various institutions in South Tyrol
Since February 2010
Junior researcher at TU Chemnitz, Cognitive and Engineering Psychology
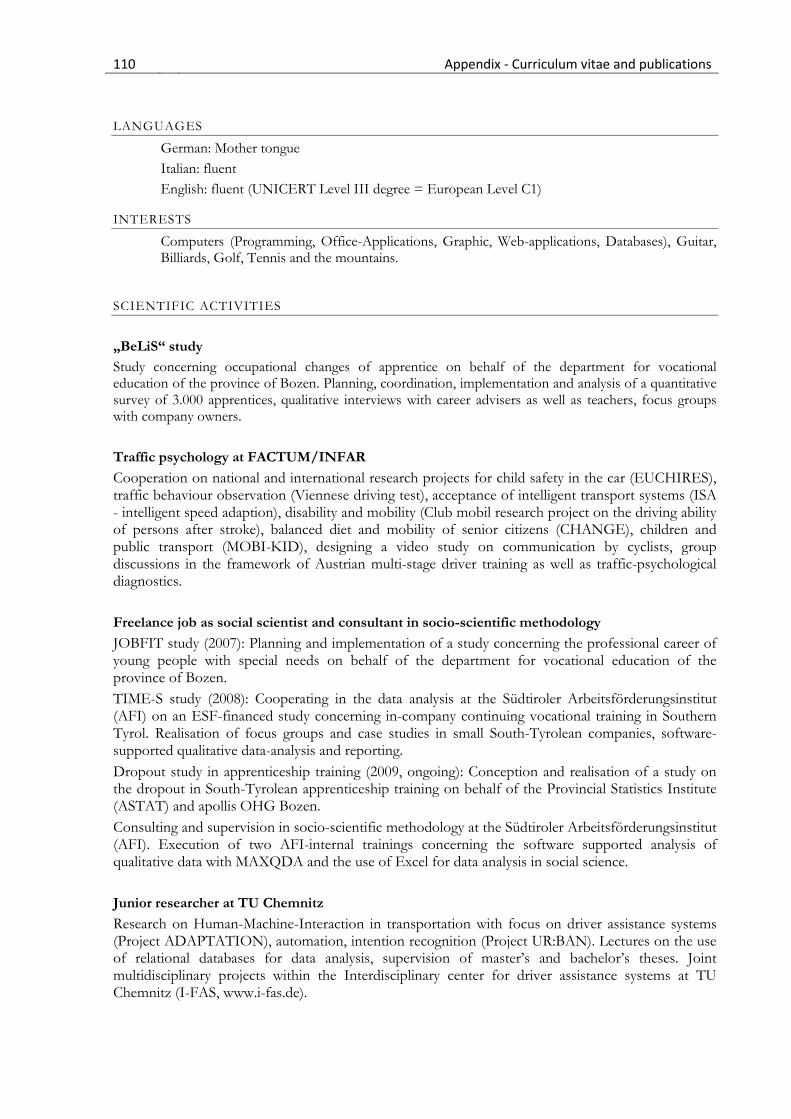
110 Appendix - Curriculum vitae and publications
LANGUAGES
German: Mother tongue Italian: fluent English: fluent (UNICERT Level III degree = European Level C1)
INTERESTS
Computers (Programming, Office-Applications, Graphic, Web-applications, Databases), Guitar, Billiards, Golf, Tennis and the mountains.
SCIENTIFIC ACTIVITIES „BeLiS“ study Study concerning occupational changes of apprentice on behalf of the department for vocational education of the province of Bozen. Planning, coordination, implementation and analysis of a quantitative survey of 3.000 apprentices, qualitative interviews with career advisers as well as teachers, focus groups with company owners. Traffic psychology at FACTUM/INFAR Cooperation on national and international research projects for child safety in the car (EUCHIRES), traffic behaviour observation (Viennese driving test), acceptance of intelligent transport systems (ISA - intelligent speed adaption), disability and mobility (Club mobil research project on the driving ability of persons after stroke), balanced diet and mobility of senior citizens (CHANGE), children and public transport (MOBI-KID), designing a video study on communication by cyclists, group discussions in the framework of Austrian multi-stage driver training as well as traffic-psychological diagnostics. Freelance job as social scientist and consultant in socio-scientific methodology JOBFIT study (2007): Planning and implementation of a study concerning the professional career of young people with special needs on behalf of the department for vocational education of the province of Bozen. TIME-S study (2008): Cooperating in the data analysis at the Südtiroler Arbeitsförderungsinstitut (AFI) on an ESF-financed study concerning in-company continuing vocational training in Southern Tyrol. Realisation of focus groups and case studies in small South-Tyrolean companies, software-supported qualitative data-analysis and reporting. Dropout study in apprenticeship training (2009, ongoing): Conception and realisation of a study on the dropout in South-Tyrolean apprenticeship training on behalf of the Provincial Statistics Institute (ASTAT) and apollis OHG Bozen. Consulting and supervision in socio-scientific methodology at the Südtiroler Arbeitsförderungsinstitut (AFI). Execution of two AFI-internal trainings concerning the software supported analysis of qualitative data with MAXQDA and the use of Excel for data analysis in social science. Junior researcher at TU Chemnitz Research on Human-Machine-Interaction in transportation with focus on driver assistance systems (Project ADAPTATION), automation, intention recognition (Project UR:BAN). Lectures on the use of relational databases for data analysis, supervision of master’s and bachelor’s theses. Joint multidisciplinary projects within the Interdisciplinary center for driver assistance systems at TU Chemnitz (I-FAS, www.i-fas.de).
111 Appendix - Curriculum vitae and publications
PUBLICATIONS (CHRONOLOGICAL) Beggiato, M. (2014). Effect of ADAS use on drivers' information processing and Situation Awareness. In
A. Stevens, C. Brusque & J. Krems (Eds.) Driver adaptation to information and assistance systems (pp. 57-80). London: The Institution of Engineering and Technology (IET).
Pereira, M., Lietz, H., & Beggiato, M. (2014). Development of a database for storage and analysis of behavioural data. In A. Stevens, C. Brusque, & J. Krems (Eds.), Driver adaptation to information and assistance systems (pp. 301–317). London: Institution of Engineering and Technology.
Dotzauer, M., Berthon-Donk, V., Beggiato, M., Haupt, J., & Piccinini, G. (2014). Methods to assess behavioural adaptation over time as a result of ADAS use. In A. Stevens, C. Brusque & J. Krems (Eds). Driver adaptation to information and assistance systems (pp. 35-55). London: The Institution of Engineering and Technology (IET).
Schmidt, K., Beggiato, M., Hoffmann, K. H., & Krems, J. F. (2014). A mathematical model for predicting lane changes using the steering wheel angle. Journal of Safety Research, 49, 85–90. doi:10.1016/j.jsr.2014.02.014.
Beggiato, M., & Krems, J. F. (2013). The evolution of mental model, trust and acceptance of adaptive cruise control in relation to initial information. Transportation Research Part F, 18, 47-57. dx.doi.org/10.1016/j.trf.2012.12.006.
Beggiato, M., & Krems, J. F. (2013). Auswirkungen erwarteter und unerwarteter Systemgrenzen von Adaptive Cruise Control auf das Situationsbewusstsein im Zeitverlauf. In VDI (Eds.). Der Fahrer im 21. Jahrhundert. VDI-Berichte 2205 (pp.119-132). Düsseldorf: VDI-Verlag.
Beggiato, M., & Krems, J. F. (2013). Sequence analysis of glance patterns to predict lane changes on urban arterial roads. Paper presented at 6. Tagung Fahrerassistenz - Der Weg zum automatischen Fahren, Munich, 28.-29.11.2013. Retrieved from http://mediatum.ub.tum.de/node?id=1187197.
Beggiato, M., & Krems, J. F. (2012). The effects of preliminary information about adaptive cruise control on trust and the mental model of the system: a matched-sample longitudinal driving simulator study. In de Waard, D., Merat, N., Jamson, H., Barnard, Y., and Carsten, O.M.J. (Eds.), Human Factors of Systems and Technology (pp. 63-74). Maastricht, the Netherlands: Shaker Publishing.
Grünseis-Pacher, E., Beggiato, M., Reiter, D., Risser, R., Chroust, S., Häusler, J., & Sommer, M. (2009). Sicher mobil mit Handicap. Vertrauliche Fahreignungsprüfung im Vorfeld der Behörde. Schriftenreihe Forschungsarbeiten aus dem Verkehrswesen, Band 193, BMVIT: Wien.
Beggiato, M., & Risser, R. (Eds.) (2009). State of the Art. Public Report of Workpackage 2 of the EU-Project CHANGE: Care of Health Advertising New Goals for Elderly people, GRUNDTVIG Multilateral Projekt 2008-2010. (Online at http://www.changeonline.eu)
Beggiato, M., & Pramstrahler, W. (2008). Gründe, Barrieren und Effekte von Weiterbildung in Südtiroler Kleinbetrieben. In AFI-IPL (Ed.), TimeS – Training in MicroEnterprises South Tyrol. Die berufliche Weiterbildung in Südtirol. Ein Beitrag zur Entwicklung des Systems (S. 54-92). Bozen: Arbeitsförderungsinstitut. (Online at http://www.afi-ipl.org/ Arbeitsmarkt_und_berufliche_Weiterbildung_TimeS_deu.html)
Beggiato, M., Steinmair, J., & Gasser, G. (2007). JOBFIT - Studie zum Ausbildungs- und Berufsverlauf von Jugendlichen mit besonderen Bedürfnissen im Südtiroler Berufsbildungssystem. Bozen: Autonome Provinz Bozen – Südtirol, deutsche und ladinische Berufsbildung. (Online at http://www.provinz.bz.it/berufsbildung/publ/publikationen_d.asp)
Beggiato, M. (2004). Berufswahl und Berufsverlauf Südtiroler LehrabsolventInnen. Diplomarbeit, Institut für Psychologie Wien. (Online at http://www.diplomarbeiten24.de/vorschau/54450.html)
Klicpera, C., Gasteiger-Klicpera, B., & Beggiato, M. (2004): BeLiS - Berufswechsel von LehrabsolventInnen in Südtirol. Bozen: Autonome Provinz Bozen - Südtirol. (Online at http://www.provincia.bz.it/berufsbildung/belis/default_d.htm)

112 Appendix - Curriculum vitae and publications
PRESENTATIONS AND POSTERS (CHRONOLOGICAL) Beggiato, M., & Krems, J. F. (2014). Dynamische Aufmerksamkeitsverteilung im Straßenverkehr: Analyse
von Blickmustern vor Fahrstreifenwechseln. In O. Güntürkün (Ed.). 49. Kongress der Deutschen Gesellschaft für Psychologie, 21.-25. September 2014 (p. 526). Lengerich: Pabst Science Publishers.
Beggiato, M., Pereira, M., & Krems, J. F. (2014). Lernprozesse, Vertrauens- und Akzeptanzentwicklung im Umgang mit Automatisierung im Fahrzeug. In O. Güntürkün (Ed.). 49. Kongress der Deutschen Gesellschaft für Psychologie, 21.-25. September 2014 (p. 603). Lengerich: Pabst Science Publishers.
Beggiato, M., Pech, T., & Krems, J. F. (2014). The predictive potential of driver characteristics for lane changes on urban arterial roads. Poster presented at the 5th conference on Applied Human Factors and Ergonomics (AHFE), 19.-23 July 2014, Krakow, Poland.
Beggiato, M., & Krems, J. F. (2014). Vermeidung von Unfällen durch elektronische Steuerungs- und Beeinflussungssysteme im Verkehrsraum und im Kraftfahrzeug; Möglichkeiten der Stärkung der Aufmerksamkeit der Verkehrsteilnehmer durch das Zusammenspiel Mensch/Maschine. Presentation at the Seminar der Vereinigung der Straßenbau- und Verkehrsingenieure in Niedersachsen, 3 April 2014, Osnabrück, Germany.
Beggiato, M., & Krems, J. F. (2013). Situation Awareness in relation to the initial information about adaptive cruise control. A matched sample longitudinal driving simulator study. In U. Ansorge, E. Kirchler, C. Lamm, & H. Leder (Eds.), TeaP 2013 - Abstracts of the 55th Conference of Experimental Psychology (p.28). Lengerich: Pabst Science Publishers.
Beggiato, M. (2012). Databases as analysis tool for big and heterogeneous data in transportation research. Presentation at the ADAPTATION final event, 21-22 November 2012, Vienna, Austria.
Beggiato, M. (2012). The effect of preliminary information about ACC: a matched sample driving simulator study. Presentation at the 5th International Conference on Traffic and Transport Psychology (ICTTP), 29-31 August 2012, Groningen, The Netherlands.
Beggiato, M. (2012). Sharing methodological knowledge in qualitative data analysis. Poster presented at the Marie-Curie-Workshop, ESOF conference, 1-2 July 2012, Torino, Italy.
Beggiato, M. (2012). Can computer based trainings improve driver education?. Presentation at the CIECA Congress, 13-16 June 2012, Istanbul, Turkey.
Beggiato, M. (2011). Der Einfluss des initialen mentalen Modells eines ACC auf Fahrverhalten, Situation Awareness, Systemvertrauen und Akzeptanz. In K. Bittrich, S. Blankenberger & J. Lukas (Hrsg.), Beiträge zur 53. Tagung experimentell arbeitender Psychologen (p. 16). Lengerich: Pabst Science Publishers.
Beggiato, M. (2010). Kurz- und langfristige Veränderungen höherer kognitiver Prozesse beim Fahren mit Fahrerassistenzsystemen. Presentation at the Doktorandenworkshop der Fachgruppe Verkehrspsychologie, 16-17 September 2010, Würzburg, Germany.
SUPERVISION OF MASTER’S, BACHELOR’S AND DIPLOMA THESES (CHRONOLOGICAL)
Mennig, I. M. (2014). Eignung eines Fahrsimulators mit Bewegungsplattform für die Erlebbarkeit von Fahrdynamik. (Master's thesis). TU Chemnitz.
Springer, S. (2014). Akzeptanzbedingungen des Fahrerassistenzsystems Economic Cruise Control. (Bachelor's thesis). TU Chemnitz.
Zschoche, E. (2014). Der Einfluss von Fahrercharakteristika auf Fahrstreifenwechsel. (Bachelor's thesis). TU Chemnitz.
Endler, C. (2013). Untersuchung eines Fahrerassistenzsystems zur Darstellung einer Umgebungsansicht. (Bachelor's thesis). TU Chemnitz.

113 Appendix - Curriculum vitae and publications
Grieger, S. (2013). Akzeptanz eines ACC im Zeitverlauf. Eine Fahrsimulatorstudie mit parallelisierter Stichprobe. (Bachelor's thesis). TU Chemnitz.
Klamroth, A., & Winkler, J. (2013). Einfluss von Fahrermerkmalen auf die Nutzung eines ACC und das Fahrverhalten im Fahrsimulator. (Bachelor's thesis). TU Chemnitz.
Schwarzwäller, M. (2013). Transformationsprozesse des mentalen Modells eines ACC durch Erfahrung. Ein mixed methods Ansatz. (Bachelor's thesis). TU Chemnitz.
Thon, I. (2013). Evaluierung räumlicher Darstellungsarten von Rasterkraftmikroskopie – Volumendaten hinsichtlich der Vermittlung fachrelevanter Inhalte. (Bachelor's thesis). TU Chemnitz.
Göbel, P. (2012). Der Einfluss von locus of control und sensation seeking auf das Fahrverhalten und die Nutzung des ACC. (Bachelor's thesis). TU Chemnitz.
Metzner, M. (2012). Einfluss von Vorinformationen über ACC auf Situation Awareness. (Master's thesis). TU Chemnitz.
Schmidt, K. (2012). Analyse mehrdimensionaler Zeitreihen eines Fahrsimulators. (Master's thesis). TU Chemnitz.
Steinmair, J. M. (2008). Berufliche Entwicklung und Arbeitszufriedenheit von Jugendlichen mit besonderen Bedürfnissen in Südtirol. (Diploma thesis). University of Vienna.

Eidesstattliche Erklärung
Hiermit erkläre ich, dass ich die vorliegende Arbeit selbstständig verfasst habe und keine anderen als
die angegebenen Hilfsmittel verwendet habe.
Chemnitz, 27.10.2014
_____________________________
Matthias Beggiato