changes in sars-cov-2 antibody responses impact the ...jul 14, 2020 · tested only if they came in...
TRANSCRIPT

Changes in SARS-CoV-2 Antibody Responses Impact the Estimates of Infections in Population-Based 1
Seroprevalence Studies 2
Craig Fenwick‡1, Antony Croxatto‡2, Alix T. Coste‡2, Florence Pojer‡5, Cyril André1, Céline Pellaton1, Alex 3 Farina1, Jérémy Campos1, David Hacker5, Kelvin Lau5, Berend-Jan Bosch4, Semira Gonseth Nussle7, 4 Murielle Bochud7, Valerie D’Acremont7, Didier Trono6*, Gilbert Greub2,3*, Giuseppe Pantaleo1,8* 5
1- Service of Immunology and Allergy, Department of Medicine, Lausanne University 6 Hospital and University of Lausanne, Lausanne, Switzerland 7
2- Institute of Microbiology, Lausanne University Hospital and University of Lausanne, 8 Lausanne, Switzerland 9
3- Service of Infectious Diseases, Lausanne University Hospital, Switzerland 10 4- Virology Section, Infectious Diseases and Immunology Division, Department of 11
Biomolecular Health Sciences, Faculty of Veterinary Medicine, Utrecht University, 12 Utrecht, the Netherlands. 13
5- Protein Production and Structure Core Facility, School of Life Sciences, École 14 Polytechnique Fédérale de Lausanne (EPFL), Lausanne, Switzerland. 15
6- School of Life Sciences, Ecole Polytechnique Fédérale de Lausanne, Lausanne, 16 Switzerland. 17
7- Centre for Primary Care and Public Health, University of Lausanne, Lausanne, 18 Switzerland. 19
8- Swiss Vaccine Research Institute, Lausanne University Hospital and University of 20 Lausanne, Switzerland. 21
22
Key words: SARS-CoV-2, serology, S protein trimer 23
24
Running title: Anti-S and anti-N protein antibody responses 25
26
27 ‡Authors contributing equally 28
29
*Corresponding authors: Prof. Giuseppe Pantaleo 30
Service of Immunology and Allergy 31
Lausanne University Hospital 32
1011 Lausanne, Switzerland 33
35
36
Prof. Gilbert Greub 37
Service of Microbiology 38
Lausanne University Hospital 39
1011 Lausanne, Switzerland 40
42
43
Prof. Didier Trono 44
School of Life Sciences 45
Ecole Polytechnique Fédérale de Lausanne 46
Lausanne, Switzerland 47
. CC-BY-NC-ND 4.0 International licenseIt is made available under a is the author/funder, who has granted medRxiv a license to display the preprint in perpetuity. (which was not certified by peer review)
The copyright holder for this preprint this version posted July 18, 2020. ; https://doi.org/10.1101/2020.07.14.20153536doi: medRxiv preprint
NOTE: This preprint reports new research that has not been certified by peer review and should not be used to guide clinical practice.

Abstract 49
50
We have determined SARS-CoV-2-specific antibody responses in a cohort of 96 individuals 51
with acute infection and in 578 individuals enrolled in a seroprevalence population study in 52
Switzerland including three groups, i.e. subjects with previous RT-PCR confirmed SARS-CoV-2 53
infections (n=90), ‘positive patient contacts’ (n=177) and ‘random selected subjects’ (n=311). 54
SARS-CoV-2 antibody responses specific to the Spike (S), in the monomeric and native trimeric 55
forms, and/or the nucleocapsid (N) proteins were equally sensitive in the acute infection 56
phase. Interestingly, as compared to anti-S antibody responses, those against the N protein 57
appear to wane in the post-infection and substantially underestimated the proportion of 58
SARS-CoV-2 infections in the groups of ‘patient positive contacts’, i.e. 10.9 to 32.2% reduction 59
and in the ‘random selected’ general population, i.e. up to 45% reduction. The overall 60
reduction in seroprevalence targeting only anti-N IgG antibodies for the total cohort ranged 61
from 9.4 to 31%. Of note, the use of the S protein in its native trimer form was more sensitive 62
as compared to monomeric S proteins. 63
These results indicate that the assessment of anti-S IgG antibody responses against the 64
native trimeric S protein should be implemented to estimate SARS-CoV-2 infections in 65
population-based seroprevalence studies. 66
67
68
69
70
71
72
73
74
75
76
77
78
79
80
81
82
. CC-BY-NC-ND 4.0 International licenseIt is made available under a is the author/funder, who has granted medRxiv a license to display the preprint in perpetuity. (which was not certified by peer review)
The copyright holder for this preprint this version posted July 18, 2020. ; https://doi.org/10.1101/2020.07.14.20153536doi: medRxiv preprint

Introduction 83
84
The SARS-CoV-2 is currently causing a devastating pandemic with more than 12.7 million 85
documented infections and more than 566’000 deaths, according to the latest WHO situation 86
report from July 13th, 2020.1 However, the true incidence of the infection is largely 87
underestimated, since in most countries asymptomatic and paucisymptomatic people are 88
tested only if they came in direct contact with sick patients or belong to at-risk subgroups. 89
Therefore, it is a public health urgency to perform large-scale population-based studies in 90
order to determine rates of seroprevalence during the first wave of the SARS-CoV-2 pandemic 91
and to implement continued surveillance with the combined use of viral detection tests such 92
as RT-PCR and serological testing. Seroprevalence studies are also instrumental to determine 93
the proportion of individuals with potential protective immunity.2-4 94
95
SARS-CoV-2 antibody responses are characterized through the detection of IgG, IgA, and/or 96
IgM. Detecting both IgA and IgG may increase sensitivity, particularly for people experiencing 97
paucisymptomatic or asymptomatic infection. However, IgM does not seem to be of great 98
benefit to overall sensitivity, since IgM appearance coincides with IgG antibodies during the 99
early phase of infection, i.e. less than 15 days after the onset of symptoms and may increase 100
the likelihood of false positive results due to cross-reactivity.5,6 101
102
SARS-CoV-2-specific antibody responses target two proteins: the nucleocapsid protein (N) and 103
the Spike protein (S). It has been suggested that IgG antibodies targeting the S protein are 104
more specific while those targeting at N may be more sensitive, particularly in the early phase 105
of infection.7 106
107
However, the increased sensitivity of anti-N antibody response might be at the expense of 108
specificity, given the relatively high protein sequence similarity of the N protein of SARS-CoV-109
2 with nucleocapsid proteins of other Coronaviridae and other viruses. Moreover, during the 110
SARS outbreak (2002-2004), Chia et al observed that anti-N antibodies waned earlier than anti-111
. CC-BY-NC-ND 4.0 International licenseIt is made available under a is the author/funder, who has granted medRxiv a license to display the preprint in perpetuity. (which was not certified by peer review)
The copyright holder for this preprint this version posted July 18, 2020. ; https://doi.org/10.1101/2020.07.14.20153536doi: medRxiv preprint

S antibodies.8 Thus, anti-S antibody response might be more specific and circumvent a 112
possible decrease of antibodies, previously observed with N protein of the SARS virus. 113
Furthermore, it is still unknown the durability of SARS-CoV-2 antibody response. Previous 114
studies have shown early disappearance of antibodies to SARS-associated coronavirus after 115
recovery9 while other studies have shown longer durability of the antibody response.10-13 116
117
In the present study we have investigated SARS-CoV-2 antibody responses, both IgA and IgG 118
in a cohort of 96 patients with moderate to severe symptoms during the first 33 days of the 119
acute phase of infection and in a cohort of 578 subjects mostly paucisymptomatic and/or 120
asymptomatic enrolled in a population-based seroprevalence study of the Vaud Canton in 121
Switzerland. Antibody responses targeting either the N and/or the S proteins were 122
investigated. Anti-S antibody responses were determined against monomeric moieties of the 123
S1 protein and/or the native S trimeric form. Antibody responses against the S and N proteins 124
were equally sensitive during the acute phase of infection while anti-N antibody responses 125
waned in the post-infection phase. Importantly, the use of the trimeric as compared to the 126
monomeric form of the S protein is associated with greater sensitivity in the detection of SARS-127
CoV-2 IgG antibody response in both the acute and post-infection phases. 128
129
Taken together, these results indicate that antibody responses against the native trimeric S 130
protein should be used as a reference in population-based seroprevalence studies to provide 131
more accurate estimates of SARS-CoV-2 infections in the general population. 132
133
134
135
136
137
138
139
. CC-BY-NC-ND 4.0 International licenseIt is made available under a is the author/funder, who has granted medRxiv a license to display the preprint in perpetuity. (which was not certified by peer review)
The copyright holder for this preprint this version posted July 18, 2020. ; https://doi.org/10.1101/2020.07.14.20153536doi: medRxiv preprint

Results 140
Antibody responses against the native trimeric versus the monomeric S protein 141
A stabilized trimer of the full-length S protein, encompassing both its S1 and S2 moieties, was 142
coupled to beads for capturing antibodies in a new Luminex assay. We hypothesized that 143
conformational epitopes would be preserved in the trimeric S protein, providing a greater 144
sensitivity to detect IgG antibodies (Supplementary Figure 1A and B).14 First, the specificity 145
for IgG antibody binding was established with sera from 256 pre-COVID-19 pandemic healthy 146
adults from 18 to 81 years of age and an additional set of 108 patients (Figure 1A), which 147
included: pregnant women, individuals infected with alphacoronaviruses (NL63 and 229E), 148
betacoronaviruses (OC43 and HKU1), HIV, Rubella, HSV1, HSV2, RSV, CMV, EBV, influenza or 149
varicella, as well as patients suffering from autoimmune diseases such as Lupus. The signal 150
distribution for all SARS-CoV-2 negative sera was similar for the 256 pre-COVID-19 healthy 151
adults and for the diverse panel of 108 subjects. A cut-off for positivity was set at 4-fold above 152
a negative control standard, which is slightly more than four standard deviation above the 153
mean of all negative control samples (mean MFI ratio 0.84 + 4×0.75 SD). Using this threshold, 154
only one sera of the 256 pre-COVID-19 people and two patients with acute HIV or CMV viral 155
infections gave a positive signal (Figure 1 A). As such, the Luminex assay using the stable 156
trimeric S protein gave a high overall specificity of 99.2% and no cross-reactive antibodies 157
were detected in sera from people infected with pre-pandemic coronaviruses or from patients 158
with autoimmune diseases that can produce polyreactive antibodies. 159
160
The sensitivity of the assay was next evaluated using sera from 96 acutely infected SARS-CoV-161
2 PCR-positive patients with blood sampling at 0-5 days, 6-10 days, 11-15 days and 16-33 days 162
post-onset of symptoms (POS). As anticipated, sera collected during the early stage of the 163
infection (0-5 days POS) had low or undetectable levels of anti-S protein IgG antibodies, with 164
a rate of positivity of 12.5% (1 in 8 subjects; Figure 1B). Seropositivity increased to 42.1% 165
(8/19) at 6-10 days POS and to 91.7% (33/36) at 11-15 days POS. Almost all patients with 166
symptoms for 16-33 days (28/29; 96.6%) displayed high antibody titers for the S protein 167
trimer. Interestingly, the only subject that was negative in the S protein trimer assay at day 25 168
post-onset of symptoms became seropositive when re-tested seven days later. 169
. CC-BY-NC-ND 4.0 International licenseIt is made available under a is the author/funder, who has granted medRxiv a license to display the preprint in perpetuity. (which was not certified by peer review)
The copyright holder for this preprint this version posted July 18, 2020. ; https://doi.org/10.1101/2020.07.14.20153536doi: medRxiv preprint

We then performed head-to-head comparisons of S trimeric versus S1 or RBD monomeric 170
proteins for IgG antibody responses within the Luminex assay. The responses observed with 171
the S monomeric proteins were similar in sensitivity to those described in previous studies 15,16 172
using monomeric proteins but inferior to those obtained with the trimeric S protein 173
(Supplemental Figure 2A and B). 174
175
Anti- IgA antibody response against the S protein trimer 176
We next evaluated the S protein trimer for the detection of anti-SARS-CoV-2 IgA antibodies. 177
We established assay specificity and a cut-off threshold for positivity by screening sera from 178
pre-COVID-19 healthy adults. Using four standard deviations above the standard negative 179
control, this assay provided a 98.5% specificity in the 256 sera tested. The sensitivity was 180
estimated on 81 out of 96 acute infected SARS-CoV-2 patients’ sera with positive detections 181
ranging from 33.3% of patients at 0-5 days POS with seropositivity increasing to 68.8% in 182
patients from the 6-10 days group. At 11-15 and 16-33 days POS, IgAs were detected in 94.4% 183
and 90% of the cases, respectively (Figure 2). 184
185
Anti-S versus anti-N antibody responses during the acute phase of infection 186
Anti-S and anti-N antibody responses were determined using four different technologies, i.e 187
Luminex, ELISA, CLIA and ECLIA. The different assays used were detecting the N protein alone, 188
the N plus a monomeric antigen of the S protein, the monomeric S protein alone and the 189
native trimeric S protein. More details about the five commercial assays used are contained 190
in the Methods. We performed the comparison on the same set of 96 sera from patients with 191
acute infection and stratified based on time between symptoms onset and sera collection as 192
shown in Figures 1B. Small differences in the number of sera tested across assays is due to 193
insufficient volume of some samples. The specificity was evaluated on a common panel of 65 194
pre-COVID-19 pandemic sera sampled before November 2019. 195
Increased sensitivity in the detection of both anti-N and anti-S IgG antibody responses was 196
observed consistently over time post-symptoms regardless of the test used (Figure 3 A-B, 197
Table 1). The use of the native trimeric S protein was associated with the higher sensitivity, 198
. CC-BY-NC-ND 4.0 International licenseIt is made available under a is the author/funder, who has granted medRxiv a license to display the preprint in perpetuity. (which was not certified by peer review)
The copyright holder for this preprint this version posted July 18, 2020. ; https://doi.org/10.1101/2020.07.14.20153536doi: medRxiv preprint

i.e. detection of anti-S IgG antibodies in 97% of individuals tested > Day 15 POS, as compared 199
to the use monomeric S and/or N proteins with a sensitivity ranging between 83 to 93% 200
(Figure 3 B-C, Table 1). The specificity was equal or above 97% (Figure 3 C) regardless of the 201
test and antigen used and none displayed cross-reactivity with sera from patients positive for 202
229E, OC43, HKU1, NL63 coronaviruses (Figure 1A). 203
204
Taken together, these results indicate that antibody responses targeting the S and/or the N 205
proteins have similar sensitivity during the acute phase of infection. 206
207
Comparison of anti-S and anti-N IgG antibody responses during the post-infection phase 208
We next evaluated anti-S and anti-N IgG antibody responses on 578 sera as part of a 209
population-based seroprevalence study of the Vaud Canton in Switzerland, while being blind 210
to the seropositivity status. These comparisons included 90 sera sampled from mildly to 211
paucisymptomatic patients tested positive by RT-PCR, 177 sera sampled from ‘positive patient 212
contacts’ of RT-PCR positive subjects, and 311 sera sampled from undefined, ‘random 213
selected’ people from the general population aged 6 months and over. Results of the 214
comparisons are shown in Figure 4, and Table 2. As expected, a good correlation in the 215
proportion of seropositive individuals was observed between tests detecting antibody 216
responses against the trimeric and/or monomeric S proteins while a poorer correlation was 217
observed with those detecting anti-N antibody responses (Figure 4). 218
219
With regard to the ‘RT-PCR positive’ group (n=90 individuals) (Figure 4, blue dots), the best 220
sensitivity (96.7%) was found with the use of the trimeric S protein as compared to that of 221
monomeric S and N proteins (Table 2). 222
223
Regarding ‘positive patient contact’ group (Figure 4, red dots), the highest positivity rate 224
(36.2%) was observed with the trimeric S protein while positivity rates ranged between 32.2 225
and 24.3% with the other antigenic proteins (Figure 4 and Table 2). 226
. CC-BY-NC-ND 4.0 International licenseIt is made available under a is the author/funder, who has granted medRxiv a license to display the preprint in perpetuity. (which was not certified by peer review)
The copyright holder for this preprint this version posted July 18, 2020. ; https://doi.org/10.1101/2020.07.14.20153536doi: medRxiv preprint

227
With regard to the ‘random selected’ group, (Figure 4, green dots; Table 2), we observed that 228
anti-S antibody responses identified greater percentages of SARS-CoV-2 positive people 229
(between 6.4 to 4.2%), than anti-N antibody responses (4.5 to 3.5%). Importantly, the pan-Ig 230
test (#6 in Table 2) using the N protein antigen was the second most sensitive assay in the 231
acute infected cohort and in the ‘RT-PCR positive’ and ‘positive patient contacts’ groups, but 232
conversely, was one of the least sensitive test (3.9%) in detecting seropositive people 233
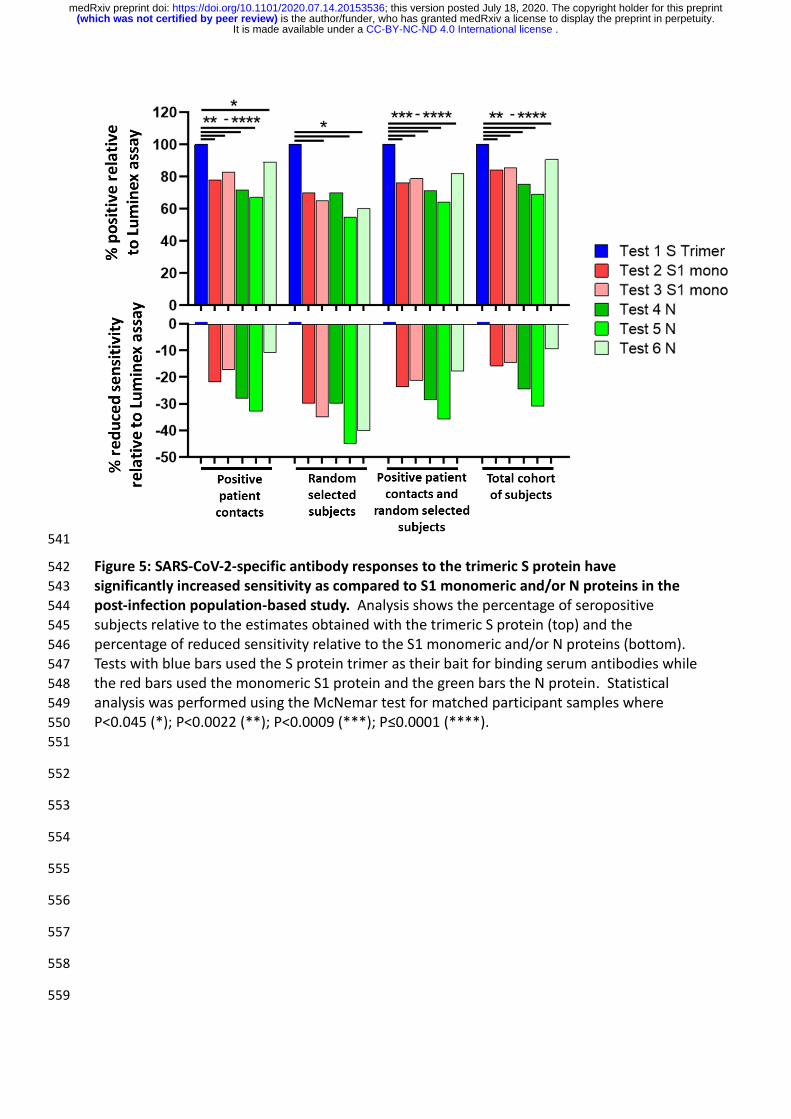
randomly selected from the general population. The significantly higher sensitivity of the 234
trimeric S protein antigen in the post-infection setting is highlighted in Figure 5. Compared to 235
the N and or monomeric S antigens, the trimeric S protein identified 10.9% to 32.8% more 236
positive subjects in the ‘positive patient contacts’ group, 30% to 45% more positive subjects 237
in the ‘random selected’ group and 17.9% to 35.7% more positive subjects in a combined 238
analysis of the ‘positive patient contacts’ and ‘random selected’ groups. In the overall post-239
infection cohort of 578 subjects, the trimeric S protein performed significantly better and 240
detected between 9.4% and 31% more seropositive participants than the N and/or the S 241
monomeric proteins (Figure 5). 242
243
Taken together, these results indicate that anti-N antibody responses may substantially (i.e. 244
30% to 45%) underestimate the proportion of SARS-CoV-2 exposed individuals compared to 245
anti-S antibody responses in population-based seroprevalence studies. 246
247
Discussion 248
249
Population-based seroprevalence studies are important to monitor the dynamics of the 250
pandemic, to have a better appreciation of the number of infections and to determine the 251
proportion of the population that has developed specific SARS-CoV-2 immunity. Population-252
based seroprevalence studies performed in Switzerland, Spain and in New York City indicate 253
that a minor percentage of the population, ranging from 10 to 20% of individuals, has been 254
infected with SARS-CoV-2.2-4,17-19 The estimates of SARS-CoV-2 infected individuals from 255
. CC-BY-NC-ND 4.0 International licenseIt is made available under a is the author/funder, who has granted medRxiv a license to display the preprint in perpetuity. (which was not certified by peer review)
The copyright holder for this preprint this version posted July 18, 2020. ; https://doi.org/10.1101/2020.07.14.20153536doi: medRxiv preprint

seroprevalence studies may be substantially influenced by qualitative and quantitative 256
changes in the antibody responses from the transition from the acute to the post-infection 257
phase, the clinical severity of the infection and the antigenic protein used for the detection of 258
the antibody responses. 259
SARS-CoV-2 specific antibodies (predominantly IgG) targeting either the S or the N proteins 260
are generally assessed in both the acute and post-infection phases. The majority of studies 261
and the validation of the tests with regard to the sensitivity and specificity has been mostly 262
performed on cohorts from patients during the acute phase of infection.16,17,20,21 The results 263
from these studies indicate the use of N and S proteins were considered as equally sensitive, 264
with a generally higher sensitivity for the N protein to monitor the development of antibody 265
responses. Based on these observations in the acute phase of infection, it has been assumed 266
that determination of antibody responses against the N or S proteins would be equally suitable 267
in the post-infection phase for population-based seroprevalence studies. However, limited 268
information is yet available on the evolution of the antibody response during the transition 269
from the acute to the post-infection phase and, in particular, on the antibody responses 270
against the two targets, S and N proteins. Furthermore, the population-based studies 271
comprise diverse populations of individuals including RT-PCR positive individuals with 272
moderate to severe symptomatic infection who required hospitalization, RT-PCR positive 273
individuals with mild symptoms who did not require hospitalization and pauci-/asymptomatic 274
individuals with no previous RT-PCR confirmation of COVID-19 infection. Previous studies have 275
shown that the magnitude of the antibody response may be influenced by the severity of the 276
symptoms with robust antibody response in patients with severe infection while weaker 277
antibody response in patients with mild infection. Therefore, antibody responses can be lower 278
in pauci-/asymptomatic individuals. For these reasons, population-based studies can be very 279
challenging to estimate the proportion of SARS-CoV-2 infections in individuals who have 280
experience pauci-/asymptomatic infection. 281
Our results indicate a substantial drop in the sensitivity of antibody responses specific to the 282
N protein thus strongly suggesting a waning of these responses in the post-infection phase. In 283
this regard, the estimated seroprevalence in the ‘positive patient contacts’ and ‘random 284
selected’ groups is mostly impacted when only anti-N responses are assessed with an 285
. CC-BY-NC-ND 4.0 International licenseIt is made available under a is the author/funder, who has granted medRxiv a license to display the preprint in perpetuity. (which was not certified by peer review)
The copyright holder for this preprint this version posted July 18, 2020. ; https://doi.org/10.1101/2020.07.14.20153536doi: medRxiv preprint

underestimation ranging from 11 to 33% for the former and 30 to 45% for the latter group as 286
compared to anti-S trimeric responses within the same groups. 287
Of note, the underestimation of SARS-CoV-2 seropositive individuals was also observed for 288
antibody responses against monomeric S1 or RBD and was in the range of 18-22% in the 289
‘positive patient contacts’ and 30-35% in the ‘random selected’ groups samples. The greater 290
sensitivity of antibody responses found against the trimeric S protein likely results from 291
antibodies binding to the S2 subunit and the conservation of conformational epitopes within 292
the higher order structure. This increased sensitivity was not obtained at the expense of cross-293
reactivity, since the specificity observed using the trimeric S protein was >99%. Overall, the 294
underestimation of SARS-CoV-2 seropositive individuals was less important in the ‘Positive RT-295
PCR patients’ group ranging from 1 to 26%. 296
A recent study22 has shown that 40% of asymptomatic individuals became seronegative over 297
time. However, anti-N antibody responses were determined in this study. Based on our 298
results, it is likely that the loss of antibody response observed is due to the selective waning 299
of the anti-N rather antibody responses rather than to a global reduction of the SARS-CoV-2 300
antibody response. 301
Furthermore, the present findings are also important for the development appropriate 302
monitoring strategies for the evaluation and development of vaccines against SARS-CoV-2. 303
In conclusion, these results provide new insights in the evolution of the SARS-CoV-2 antibody 304
response from the acute to the post-infection phase and indicate that the detection of 305
antibody responses against the native trimeric S protein should be implemented to avoid large 306
underestimation of SARS-CoV-2 infections in population-based seroprevalence studies. 307
308
309
310
311
312
313
314
. CC-BY-NC-ND 4.0 International licenseIt is made available under a is the author/funder, who has granted medRxiv a license to display the preprint in perpetuity. (which was not certified by peer review)
The copyright holder for this preprint this version posted July 18, 2020. ; https://doi.org/10.1101/2020.07.14.20153536doi: medRxiv preprint

Material and Methods 315
316
Study populations 317
318
Patients with acute infections 319
Comparison of tests for acute/sub-acute phase of the infection was performed on 161 sera, 320
including i) 96 sera, expected to be positive, sampled from hospitalized patients with severe 321
to mild symptoms 0 to 45 days post onset of the symptoms and documented with a positive 322
SARS-CoV-2 RT-PCR ; ii) 65 sera, expected to be negative, sampled before November 2020, 323
presented as pre-COVID-19 sera, and including 18 samples from patient documented positive 324
for a Human coronavirus (E229, OC43, HKU1, NL63) RT-PCR. Date of the symptoms onset were 325
extracted from the electronic record of the 96 SARS-CoV-2 RT-PCR positive patients. 326
327
Post-infection cohort 328
A second comparison of tests was performed on sera from the seroprevalence study of the 329
Vaud Canton in Switzerland (SerocoViD) performed by the Centre for Primary Care and Public 330
Health, University of Lausanne (Unisanté). Out of the 1,942 participants who provided a blood 331
sample between May 4 and June 27, 2020, a subset of 578 subjects were included in the 332
present analysis, of which: i) 90 subjects were expected to be positive—sampled from mostly 333
mildly to paucisymptomatic patients (only 21% had been hospitalized) documented with a 334
positive SARS-CoV-2 RT-PCR ; ii) 177 were sampled from contacts of RT-PCR positive subjects, 335
and iii) 311 were randomly selected subjects in the general population. There were 304 336
women (52.6%), and the mean age was 39.2 years (SD 24.2, range: 6 months to 90 years). 337
338
Pre-COVID-19 pandemic donors 339
Negative control serum samples from 256 adult healthy donors with ages ranging for 18 to 81 340
years of age were collected prior to November 2019 as part of the Swiss Immune Setpoint 341
study sponsored by Swiss Vaccine Research Institute. Specificity tests for the Luminex S-342
protein assay with a diverse set of 108 patient sera included the 65 sera collected prior to 343
November 2019 and used in the blinded tested performed with all six assays and an additional 344
43 patient samples. This diverse set of samples consisted of sera from pregnant women 345
(n=14), pre-pandemic coronavirus infected donors (OC43, E229, NL63 and HKU1; n=19), 346
patients with infectious diseases (HIV, Rubella, HSV1, HSV2, CMV, EBV, influenza and varicella; 347
n=57) and patients with autoimmune diseases including Lupus (n=18). Study design and use 348
of subject sera samples were approved by the Institutional Review Board of the Lausanne 349
University Hospital and the ‘Commission d’éthique du Canton de Vaud’ (CER-VD) stated that 350
authorization was not required. 351
352
. CC-BY-NC-ND 4.0 International licenseIt is made available under a is the author/funder, who has granted medRxiv a license to display the preprint in perpetuity. (which was not certified by peer review)
The copyright holder for this preprint this version posted July 18, 2020. ; https://doi.org/10.1101/2020.07.14.20153536doi: medRxiv preprint

Preparation of Luminex beads 353
Luminex beads used for the serological binding assays were prepared by covalent coupling of 354
SARS-CoV-2 proteins with MagPlex beads using the manufacture’s protocol with a Bio-Plex 355
Amine Coupling Kit (Bio-Rad, France). Briefly, 1 ml of MagPlex-C Microspheres (Luminex) were 356
washed with wash buffer and then resuspended in activation buffer containing a freshly 357
prepared solution of 1-ethyl-3-(3-dimethylaminopropyl) carbodiimide (EDC) and N-358
hydroxysulfosuccinimide (S-NHS), (ThermoFischer, USA). Activated beads were washed in PBS 359
followed by the addition of 50 μg of protein antigen. The coupling reaction was performed at 360
4 °C overnight with bead agitation using a Hula-Mixer (ThermoFischer). Beads were then 361
washed with PBS, resuspended in blocking buffer then incubated for 30 minutes with agitation 362
at room temperature. Following a final PBS washing step, beads were resuspended in 1.5 ml 363
of storage buffer and kept protected from light in an opaque tube at 4 °C. Each of the SARS-364
CoV-2 proteins was coupled with different colored MagPlex beads so that tests could be 365
performed with a single protein bead per well or in a multiplexed Luminex serological binding 366
assay. 367
368
SARS-CoV-2 proteins evaluated in Luminex assay 369
The S protein trimer was designed to mimic the native trimeric conformation of the protein in 370
vivo and the expression vector was kindly provided by Prof. Jason McLellan, University of 371
Texas, Austin; 25. It encoded the prefusion ectodomain of the SARS-CoV-2 Spike with a C-372
terminal T4 foldon fusion domain to stabilize the trimer complex along with C-terminal 8x His 373
and 2x Strep tags for affinity purification. The trimeric Spike protein was transiently expressed 374
in suspension-adapted ExpiCHO cells (Thermo Fisher) in ProCHO5 medium (Lonza) at 5 x10⁶ 375
cells/mL using PEI MAX (Polysciences) for DNA delivery. At 1 h post-transfection, dimethyl 376
sulfoxide (DMSO; AppliChem) was added to 2% (v/v). Following a 7-day incubation with 377
agitation at 31 °C and 4.5% CO2, the cell culture medium was harvested and clarified using a 378
0.22 µm filter. The conditioned medium was loaded onto Streptactin (IBA) and StrepTrap HP 379
(Cytiva) columns in tandem, washed with PBS, and eluted with 10 mM desthiobiotin in PBS. 380
The purity of S protein trimer was determined to be > 99% pure by SDS-PAGE analysis. 381
382
Receptor binding domain (RBD) and S1 SARS-CoV-2 proteins were prepared as previously 383
described.23 In initial characterization of the assays, serum dilutions of 1/50 down to 1/ 2’700 384
were evaluated for SARS-CoV-2 PCR-positive subjects and healthy donors. A 1/300 dilution of 385
serum was selected for screening patient samples since it showed a high MFI signal for all 386
donors and a low background staining with serum samples from pre-COVID-19 pandemic 387
healthy donors. In addition to the high positive signal and low background, <1 µl of serum was 388
needed to evaluate anti-SARS-CoV-2 antibody binding in the Luminex assay binding assays. 389
390
391
. CC-BY-NC-ND 4.0 International licenseIt is made available under a is the author/funder, who has granted medRxiv a license to display the preprint in perpetuity. (which was not certified by peer review)
The copyright holder for this preprint this version posted July 18, 2020. ; https://doi.org/10.1101/2020.07.14.20153536doi: medRxiv preprint

Luminex anti-SARS-CoV-2 antibody binding assay 392
Luminex beads coupled with the Spike, RBD or S1 proteins were diluted 1/100 in PBS with 50 393
µl added to each well of a Bio-Plex Pro 96-well Flat Bottom Plates (Bio-Rad). Following bead 394
washing with PBS on a magnetic plate washer (MAG2x program), 50 µl of individual serum 395
samples diluted at 1/300 in PBS, were added to the plate wells. Along with samples, three 396
replicates of a 1/300 negative control pool of pre-COVID-19 pandemic healthy human sera 397
(BioWest human serum AB males; VWR) were evaluated on each 96-well plate. Plates were 398
sealed with adhesive film, protected from light with a dark cover and agitated at 500 rpm for 399
60 minutes on a plate shaker. Beads were then washed on the magnetic plate washer and 400
anti-human IgG-PE secondary antibody (OneLambda ThermoFisher) was added at a 1/100 401
dilution with 50µl per well. Plates were agitated for 45 minutes, and then washed on the 402
magnetic plate washer. Beads resuspended in 80 µl of reading buffer were agitated 5 minutes 403
at 700 rpm on the plate shaker then read directly on a Luminex FLEXMAP 3D plate reader 404
(ThermoFisher). MFI signal for each test serum samples was divided by the mean signal for 405
the negative control samples to yield an MFI ratio that normalized values between plates and 406
between different Luminex instruments tested. Considering that two of the three false 407
positives from the 364 SARS-CoV-2 negative donors had MFI signals less than 6 (Figure 1A), an 408
additional criteria for positivity was established for large general population screens, including 409
the post-infection cohort. Here, sera with signal intensities between 4 and 6 were defined as 410
being at the limit of positivity, which increases the assay sensitivity to 99.7% with only one 411
acute HIV infected subject having a 6.8 MFI signal. 412
413
Immunoassays 414
The new Luminex S protein trimer IgG assay was compared with five commercially available 415
SARS-CoV-2 immunoassays: i) two ELISAs from EuroImmun (Test 3 S1 mono) and Epitope 416
Diagnostics (Test 4 N protein) detecting IgG against the S1 and N proteins, respectively, ii) two 417
CLIA from Diasorin (Test 1 S1 mono) and Snibe (Test 5 N protein) detecting IgG against S1 418
protein and N protein + S antigen peptide, respectively, and iii) a pan-Ig ECLIA from Roche 419
(Test 6 N protein) targeting the N protein. The Snibe assay was grouped with the N protein 420
assays in our analysis since it contained only a portion of the S1 protein. 421
ELISA and CLIA were performed according to the manufacturers’ instructions. EuroImmun and 422
Epitope Diagnostic IgG ELISA were done manually as per protocol with the exception of 423
washing steps performed with a microplate washer (PW40, Bio-Rad, France). Optical densities 424
(OD) was measured with a microplate reader (800 TSI, BioTek, USA). Each sample was 425
measured in duplicates. The LIAISON® SARS-CoV-2 IgG kit was performed on a Liaison® XL 426
(Diasorin, Italy), and the MAGLUMI™ 2019-nCoV IgG and IgM kits were performed on a 427
MAGLUMI™ 800 (Snibe, China). The Elecsys anti-SARS-CoV-2 was performed on a COBAS 6000 428
(Roche, Switzerland). 429
430
431
. CC-BY-NC-ND 4.0 International licenseIt is made available under a is the author/funder, who has granted medRxiv a license to display the preprint in perpetuity. (which was not certified by peer review)
The copyright holder for this preprint this version posted July 18, 2020. ; https://doi.org/10.1101/2020.07.14.20153536doi: medRxiv preprint

Statistical analyses 432
433
The sensitivity of the different tests was calculated according to day post-symptoms on 434
expected positive sera taken from patients with a positive RT-PCR. The RT-PCR was previously 435
performed according to Corman et al.24 on our automated molecular diagnostic platform.25 436
437
Sensitivity and specificity of the tests with 95% CI (Wilson/Brown method of GraphPad Prism 438
8.3.0) were calculated with Excel and GraphPad prism. For comparisons between the Luminex 439
assay and the five other serological assays, R2 values were calculated using the Pearson test 440
and the McNemar's test was used to determine the P-value significant differences for 441
sensitivities in detecting seropositive subjects in the patient subsets within the post-infection 442
cohort. All statistics were done with GraphPad prism. 443
444
445
446
447
448
449
450
451
452
453
454
455
456
457
458
459
460
461
462
463
. CC-BY-NC-ND 4.0 International licenseIt is made available under a is the author/funder, who has granted medRxiv a license to display the preprint in perpetuity. (which was not certified by peer review)
The copyright holder for this preprint this version posted July 18, 2020. ; https://doi.org/10.1101/2020.07.14.20153536doi: medRxiv preprint

Figures and Figure legends 464
465
466
Figure 1: SARS-CoV-2-specific IgG binding antibody responses against the native trimeric S 467
protein in a Luminex binding assay. Luminex beads covalently coupled with SARS-CoV-2 S 468
protein trimer were used to monitor IgG binding antibody responses in pre-COVID-19 469
pandemic negative control sera and sera from SARS-CoV-2 PCR positive donors. MFI signals 470
for serum antibody binding was expressed as a ratio compared to a negative control pool of 471
pre-COVID-19 pandemic human serum tested in parallel. A) Assay specificity was evaluated 472
using the sera from pre-COVID-19 pandemic healthy adults (n=256; ages ranging between 18 473
to 81 years of age), pregnant woman, pre-pandemic coronavirus infected donors (OC43, E229, 474
NL63 and HKU1), patients with infectious diseases (HIV, Rubella, HSV1, CMV, EBV, influenza 475
and varicella) and patients with autoimmune diseases including Lupus. B) The sensitivity of 476
the S protein trimer was evaluated with sera from acute infected SARS-CoV-2 PCR-positive 477
donors at 0-5 days, 6-10 days, 11-15 days and 16-33 days post-onset of symptoms. The red 478
dashed line in A and B corresponds to the 4.0 cut-off for positivity in the IgG Luminex assay 479
that was established by using mean value + 4×SD of all 364 pre-COVID-19 pandemic serum 480
samples shown in A. 481
482
483
484
. CC-BY-NC-ND 4.0 International licenseIt is made available under a is the author/funder, who has granted medRxiv a license to display the preprint in perpetuity. (which was not certified by peer review)
The copyright holder for this preprint this version posted July 18, 2020. ; https://doi.org/10.1101/2020.07.14.20153536doi: medRxiv preprint

485
486
Figure 2: SARS-CoV-2-specific IgA binding antibody responses against the native trimeric S 487
protein in a Luminex binding assay. The native trimeric S protein was used to monitor IgA 488
binding antibodies in sera from pre-COVID-19 pandemic negative control donors and sera 489
from acute SARS-CoV-2 PCR positive donors. The Luminex assay exhibited high specificity of 490
98.5% against a cohort of negative control donors and was effective at detecting IgA 491
antibodies specific for S protein in most subjects in both the early stage (0 to 10 days) and 492
later stage (11 to 33 days) after onset of symptoms in acute PCR-positive patients. The red 493
dashed line corresponds to 6.5-fold MFI signal over the internal negative control and was 494
established by using the mean value + 4×SD of the 256 pre-COVID-19 pandemic adult serum 495
samples. 496
497
498
499
500
501
502
. CC-BY-NC-ND 4.0 International licenseIt is made available under a is the author/funder, who has granted medRxiv a license to display the preprint in perpetuity. (which was not certified by peer review)
The copyright holder for this preprint this version posted July 18, 2020. ; https://doi.org/10.1101/2020.07.14.20153536doi: medRxiv preprint

503
504
505
. CC-BY-NC-ND 4.0 International licenseIt is made available under a is the author/funder, who has granted medRxiv a license to display the preprint in perpetuity. (which was not certified by peer review)
The copyright holder for this preprint this version posted July 18, 2020. ; https://doi.org/10.1101/2020.07.14.20153536doi: medRxiv preprint

506
Figure 3: Comparative analysis of SARS-CoC-2-specific IgG binding antibody responses 507
against S and N proteins in sera from patients with acute infection using six different 508
serological tests. Sensitivity in detecting anti-SARS-CoV-2-specific IgG antibodies was assessed 509
using the Luminex assay and five other commercial assay as described in the Methods. A-B) 510
Serum samples were grouped by the number of days after initial onset of symptoms with 511
sensitivity increasing over time. C) Comparison in sensitivity between the different tests in 512
samples collected from day 16 to 33 post-symptoms. S Tri: trimeric S protein; S1: monomeric 513
protein; N: nucleocapside protein. 514
515
516
517
518
519
520
521
522
523
524
525
526
527
528
. CC-BY-NC-ND 4.0 International licenseIt is made available under a is the author/funder, who has granted medRxiv a license to display the preprint in perpetuity. (which was not certified by peer review)
The copyright holder for this preprint this version posted July 18, 2020. ; https://doi.org/10.1101/2020.07.14.20153536doi: medRxiv preprint

529
Figure 4: Comparative analysis of IgG antibody responses against the trimeric S protein 530
versus monomeric S and/or N proteins. Signal intensities for the different subject sera in the 531
post-infection cohort were compared between the Luminex and the five other serological 532
assays. Collected sera were from patients with a documented positive SARS-CoV-2 RT-PCR (90 533
sera; blue dots), positive patient contacts with a SARS-CoV-2 RT-PCR positive patient (177 sera; 534
red dots) and randomly selected individuals from the general population (311 sera; green 535
dots). Pearson correlation R2 values are given for all 578 participants (black text) or for 183 536
Luminex positive sera (blue text). 537
538
539
540
. CC-BY-NC-ND 4.0 International licenseIt is made available under a is the author/funder, who has granted medRxiv a license to display the preprint in perpetuity. (which was not certified by peer review)
The copyright holder for this preprint this version posted July 18, 2020. ; https://doi.org/10.1101/2020.07.14.20153536doi: medRxiv preprint
541
Figure 5: SARS-CoV-2-specific antibody responses to the trimeric S protein have 542
significantly increased sensitivity as compared to S1 monomeric and/or N proteins in the 543
post-infection population-based study. Analysis shows the percentage of seropositive 544
subjects relative to the estimates obtained with the trimeric S protein (top) and the 545
percentage of reduced sensitivity relative to the S1 monomeric and/or N proteins (bottom). 546
Tests with blue bars used the S protein trimer as their bait for binding serum antibodies while 547
the red bars used the monomeric S1 protein and the green bars the N protein. Statistical 548
analysis was performed using the McNemar test for matched participant samples where 549
P<0.045 (*); P<0.0022 (**); P<0.0009 (***); P≤0.0001 (****). 550
551
552
553
554
555
556
557
558
559
. CC-BY-NC-ND 4.0 International licenseIt is made available under a is the author/funder, who has granted medRxiv a license to display the preprint in perpetuity. (which was not certified by peer review)
The copyright holder for this preprint this version posted July 18, 2020. ; https://doi.org/10.1101/2020.07.14.20153536doi: medRxiv preprint

Table 1. Cumulative data of SARS-CoV-2-specific IgG antibody responses on sera collected 560
during the acute infection from hospitalized patients with moderate to severe symptoms 561
562
563
564
565
566
567
568
569
570
571
572
573
574
575
576
. CC-BY-NC-ND 4.0 International licenseIt is made available under a is the author/funder, who has granted medRxiv a license to display the preprint in perpetuity. (which was not certified by peer review)
The copyright holder for this preprint this version posted July 18, 2020. ; https://doi.org/10.1101/2020.07.14.20153536doi: medRxiv preprint

Table 2: Estimates of SARS-CoV-2 infections in the based population study. 577
578
579
580
581
582
583
584
585
586
587
588
589
590
591
592
593
594
595
. CC-BY-NC-ND 4.0 International licenseIt is made available under a is the author/funder, who has granted medRxiv a license to display the preprint in perpetuity. (which was not certified by peer review)
The copyright holder for this preprint this version posted July 18, 2020. ; https://doi.org/10.1101/2020.07.14.20153536doi: medRxiv preprint

Supplemental Figures 596
597
Supplementary Figure 1: Structural representation of the SARS-CoV-2 S protein Trimer. A) 598
Space filled representation of the S protein with trimer subunits shown in blue, red and green 599
(PDB 6VSB). The labeled S2, S1 and RBD portions of each subunit are in light, mid and dark 600
colors, respectively. Compared to the monomeric S1 protein, this image demonstrates that 601
the native S protein trimer, consisting of S1 and S1 proteins, that has significantly greater 602
conformational epitopes for antibody binding that are only present in the higher order 603
structure. B) S protein trimer with the blue subunit represented as a ribbon structural. 604
605
606
607
608
609
. CC-BY-NC-ND 4.0 International licenseIt is made available under a is the author/funder, who has granted medRxiv a license to display the preprint in perpetuity. (which was not certified by peer review)
The copyright holder for this preprint this version posted July 18, 2020. ; https://doi.org/10.1101/2020.07.14.20153536doi: medRxiv preprint

610
Supplementary Figure 2: SARS-CoV-2-specific IgG binding antibody responses against the 611
monomeric S1 and RBD domains in a Luminex binding assay. A) Specificity was assessed using 612
the cohort of negative control sera described in Figure 1A. B) Sensitivity was determined with 613
the 94 acute infected serum samples described in Figure 1B. The cut-off for positivity used in 614
the RBD and S1 Luminex IgG assays are 3.2- and 2.8-fold over the negative control, respectively 615
and were established by using mean value + 4×SD of each for the 364 pre-COVID-19 pandemic 616
serum samples in A. 617
618
619
References 620
1. WHO. Coronavirus disease (COVID-2019) situation reports -175. Vol. July 12th, 2020 (2020). 621 2. Norheim, O.F. Protecting the population with immune individuals. Nat Med 26, 823-824 622
(2020). 623 3. Phelan, A.L. COVID-19 immunity passports and vaccination certificates: scientific, equitable, 624
and legal challenges. Lancet 395, 1595-1598 (2020). 625 4. Weitz, J.S., et al. Modeling shield immunity to reduce COVID-19 epidemic spread. Nat Med 26, 626
849-854 (2020). 627 5. Li, G., Chen, X. & Xu, A. Profile of specific antibodies to the SARS-associated coronavirus. N Engl 628
J Med 349, 508-509 (2003). 629 6. Zhao, J., et al. Antibody responses to SARS-CoV-2 in patients of novel coronavirus disease 2019. 630
Clin Infect Dis (2020). 631 7. Meyer, B., Drosten, C. & Muller, M.A. Serological assays for emerging coronaviruses: 632
challenges and pitfalls. Virus Res 194, 175-183 (2014). 633 8. Chia, W.N., et al. Serological differentiation between COVID-19 and SARS infections. Emerg 634
Microbes Infect 9, 1497-1505 (2020). 635 9. Cao, W.C., Liu, W., Zhang, P.H., Zhang, F. & Richardus, J.H. Disappearance of antibodies to 636
SARS-associated coronavirus after recovery. N Engl J Med 357, 1162-1163 (2007). 637 10. Choe, P.G., et al. MERS-CoV Antibody Responses 1 Year after Symptom Onset, South Korea, 638
2015. Emerg Infect Dis 23, 1079-1084 (2017). 639 11. Wu, L.P., et al. Duration of antibody responses after severe acute respiratory syndrome. Emerg 640
Infect Dis 13, 1562-1564 (2007). 641 12. Payne, D.C., et al. Persistence of Antibodies against Middle East Respiratory Syndrome 642
Coronavirus. Emerg Infect Dis 22, 1824-1826 (2016). 643 13. Xiaoqin Guo, X., et al. Long-Term Persistence of IgG Antibodies in SARS-CoV Infected 644
Healthcare Workers. medRxiv (2020). 645
. CC-BY-NC-ND 4.0 International licenseIt is made available under a is the author/funder, who has granted medRxiv a license to display the preprint in perpetuity. (which was not certified by peer review)
The copyright holder for this preprint this version posted July 18, 2020. ; https://doi.org/10.1101/2020.07.14.20153536doi: medRxiv preprint

14. Wrapp, D., et al. Cryo-EM Structure of the 2019-nCoV Spike in the Prefusion Conformation. 646 bioRxiv (2020). 647
15. Coste, A.T., Jaton, K., Papadimitriou-Olivgeris, M., Greub, G. & Croxatto, A. Comparison of 648 SARS-CoV-1 2 serological tests with different antigen targets. medRxiv (2020). 649
16. Kohmer, N., Westhaus, S., Ruhl, C., Ciesek, S. & Rabenau, H.F. Brief clinical evaluation of six 650 high-throughput SARS-CoV-2 IgG antibody assays. J Clin Virol 129, 104480 (2020). 651
17. Stringhini, S., et al. Seroprevalence of anti-SARS-CoV-2 IgG antibodies in Geneva, Switzerland 652 (SEROCoV-POP): a population-based study. Lancet (2020). 653
18. Saplakoglu, Y. 1 in 5 people tested in New York City had antibodies for the coronavirus. . 654 LiveScience (2020). 655
19. Gobierno de España, Ministerio de Sanidad. Estudio ENE-COVID19: primera ronda. Estudio 656 nacional de sero-epidemiología de la infección por SARS-CoV-2 en España. 657
20. Coste, A.T., Jaton, K., Papadimitriou-Olivgeris, M., Croxatto, A. & Greub, G. Indication for SARS-658 CoV-2 serology: first month follow-up. medRxiv (2020). 659
21. Montesinos, I., et al. Evaluation of two automated and three rapid lateral flow immunoassays 660 for the detection of anti-SARS-CoV-2 antibodies. J Clin Virol 128, 104413 (2020). 661
22. Long, Q.X., et al. Clinical and immunological assessment of asymptomatic SARS-CoV-2 662 infections. Nat Med (2020). 663
23. Okba, N.M.A., et al. Severe Acute Respiratory Syndrome Coronavirus 2-Specific Antibody 664 Responses in Coronavirus Disease Patients. Emerg Infect Dis 26, 1478-1488 (2020). 665
24. Corman, V.M., et al. Detection of 2019 novel coronavirus (2019-nCoV) by real-time RT-PCR. 666 Euro Surveill 25(2020). 667
25. Greub, G., Sahli, R., Brouillet, R. & Jaton, K. Ten years of R&D and full automation in molecular 668 diagnosis. Future Microbiol 11, 403-425 (2016). 669
670
. CC-BY-NC-ND 4.0 International licenseIt is made available under a is the author/funder, who has granted medRxiv a license to display the preprint in perpetuity. (which was not certified by peer review)
The copyright holder for this preprint this version posted July 18, 2020. ; https://doi.org/10.1101/2020.07.14.20153536doi: medRxiv preprint