changes in the morphology of hypoglossal motor neurons in
TRANSCRIPT

Loma Linda UniversityTheScholarsRepository@LLU: Digital Archive of Research,Scholarship & Creative Works
Loma Linda University Electronic Theses, Dissertations & Projects
6-2018
Changes in the Morphology of Hypoglossal MotorNeurons in the Brainstem of Developing RatsPaul Allen Williams
Follow this and additional works at: http://scholarsrepository.llu.edu/etd
Part of the Medical Physiology Commons
This Dissertation is brought to you for free and open access by TheScholarsRepository@LLU: Digital Archive of Research, Scholarship & CreativeWorks. It has been accepted for inclusion in Loma Linda University Electronic Theses, Dissertations & Projects by an authorized administrator ofTheScholarsRepository@LLU: Digital Archive of Research, Scholarship & Creative Works. For more information, please [email protected].
Recommended CitationWilliams, Paul Allen, "Changes in the Morphology of Hypoglossal Motor Neurons in the Brainstem of Developing Rats" (2018). LomaLinda University Electronic Theses, Dissertations & Projects. 521.http://scholarsrepository.llu.edu/etd/521

LOMA LINDA UNIVERSITY
School of Medicine
in conjunction with the
Faculty of Graduate Studies
____________________
Changes in the Morphology of Hypoglossal Motor Neurons in the
Brainstem of Developing Rats
by
Paul Allen Williams
____________________
A Dissertation submitted in partial satisfaction of
the requirements for the degree
Doctor of Philosophy in Physiology
____________________
June 2018

© 2018
Paul Allen Williams
All Rights Reserved

iii
Each person whose signature appears below certifies that this dissertation in his/her opinion
is adequate, in scope and quality, as a dissertation for the degree Doctor of Philosophy.
, Chairperson
Christopher G. Wilson, Associate Professor, Basic Sciences
Denise L. Bellinger, Associate Research Professor, Pathology and Human Anatomy
John Buchholz, Professor, Basic Sciences
Kerby C. Oberg, Professor, Pathology and Human Anatomy
Sean M. Wilson, Associate Professor, Basic Sciences

iv
ACKNOWLEDGEMENTS
There are always many individuals who could be acknowledged, but there are
those few who have made a notable contribution in that I would not be where I am
without their time and efforts. Therefore, I would like to thank Mr. Joe Rondeau, my high
school electronics shop teacher who encouraged me in science and technology leading to
my interest in engineering. Thanks also to Dr. Roy Schubert, Dr. James Spaulding, Dr.
Edward N. Roots, and Dr. Thomas Williams who taught, mentored, and befriended me
during my undergraduate and graduate work at Louisiana Tech University. To Dr.
Subrata Saha who accepted me into his laboratory and provided me with opportunities to
expand my knowledge and skill set in my early years of Orthopaedic research. Finally, to
Dr. Ian C. Clarke who guided, taught, and mentored me during my later years in
Orthopaedic research.
I would also like to thank my committee members for their advice and direction.
To Dr. Christopher G. Wilson, my PI, whose guidance, support, and feedback were
crucial to my progress and development. Special thanks to Dr. Denise Bellinger who has
been a source of incredible encouragement, assistance, and support as I have worked on
the projects described in this dissertation.
To my family and friends, your love and support through this long endeavor has
been invaluable. Thanks to my father and grandfathers for all the encouragement and
mentorship they gave, each in their own way. And finally, I would like to thank God for
providing me the undeserved opportunity to study His creation and marvel in its
complexity and sophistication.

v
CONTENT
Approval Page .................................................................................................................... iii
Acknowledgements ............................................................................................................ iv
List of Figures .................................................................................................................. viii
List of Tables .......................................................................................................................x
List of Abbreviations ......................................................................................................... xi
Abstract ............................................................................................................................ xiv
Chapter
1. Background ..............................................................................................................1
Golgi, Cajal, and Neuron Morphology ..............................................................2
Respiration .........................................................................................................3
Respiratory Control ............................................................................................4
Hypoglossal Motoneurons .................................................................................6
Morphology..................................................................................................6
Electrophysiology ........................................................................................7
Data Analysis .....................................................................................................8
Traditional ....................................................................................................8
Conventional ................................................................................................9
Distribution Analysis .................................................................................10
Present Study ...................................................................................................14
2. Changes in the morphology of hypoglossal motor neurons in the brainstem
of developing rats ...................................................................................................17
Abstract ............................................................................................................18
Introduction ......................................................................................................19
Materials and Methods .....................................................................................22
Animals ......................................................................................................22
Golgi-Cox Staining ....................................................................................23
Imaging ......................................................................................................25
Morphological Measurements ...................................................................25
vi
Location and Selection of Neurons ............................................................30
Mapping of neuron locations ...............................................................30
Selection of motoneurons ....................................................................31
Data Analysis .............................................................................................31
General analysis and comparisons .......................................................31
Distribution analysis ............................................................................32
Results ..............................................................................................................33
Soma Size, but Not Shape Changes with Age ...........................................34
Soma Morphology is Unimodal, but not Necessarily Normally
Distributed..................................................................................................40
Extent and Complexity of the Dendritic Tree Increases with Age ............42
Dendrite Morphology: Normality and Unimodality ..................................55
Discussion ........................................................................................................64
Postnatal Changes in Soma Morphology with Age ...................................66
Postnatal Changes in Dendrite Morphology ..............................................68
Hypoglossal Motoneuron Morphology: Normality, Unimodality,
and Distribution .........................................................................................69
Comparison with Previous Studies ............................................................72
Impact of XII Morphology on Respiratory Function .................................74
Limitations and Future Directions .............................................................75
Summary and Conclusions ........................................................................76
Acknowledgements ..........................................................................................77
Literature Cited ................................................................................................78
3. Modeling Hypoglossal Motoneurons in the Developing Rat ................................84
Abstract ............................................................................................................85
Introduction ......................................................................................................86
Materials and Methods .....................................................................................88
Animals ......................................................................................................88
Golgi-Cox Staining ....................................................................................89
Imaging ......................................................................................................90
Mapping of Neuron Locations ...................................................................91
Selection of Motoneurons ..........................................................................92
3D Reconstructions ....................................................................................92
Simulations ................................................................................................93
Data Analysis .............................................................................................95

vii
Results ..............................................................................................................96
3D Morphometrics and Electrophysiology ................................................96
Electrophysiology as a Function of Morphology.......................................97
Discussion ......................................................................................................103
Electrophysiology ....................................................................................104
Electrophysiology as a Function of Morphology.....................................105
Comparison with Previous Studies ..........................................................106
Limitations of Model ...............................................................................106
Future Directions .....................................................................................108
Conclusions ..............................................................................................109
Acknowledgements ........................................................................................109
Literature Cited ..............................................................................................110
4. Discussion ............................................................................................................114
Developmental Morphology of Hypoglossal Motoneurons ..........................114
Developmental Electrophysiology of Hypoglossal Motoneurons .................116
Limitations .....................................................................................................117
Future Studies ................................................................................................118
References ........................................................................................................................122
viii
FIGURES
Figures Page
1. Graphs illustrating examples of different finite mixture models ...........................13
2. Flowchart of the project showing morphology, electrophysiology, and
overview of the work .............................................................................................16
3. Morphology of hypoglossal motoneurons .............................................................28
4. Mean and standard deviation of animal body weight ............................................35
5. Maps of location of measured neurons ..................................................................36
6. Photomicrographs of XII MNs ..............................................................................37
7. Representative threshold images of various XII MN ............................................38
8. Cumulative distributions of the soma morphology ................................................39
9. Box plots of the neuron soma 2D morphometrics at each postnatal age ...............44
10. Pooled distributions for the ECD showing the finite mixture distribution
models ....................................................................................................................50
11. Sholl profiles for the nine postnatal ages ...............................................................51
12. Representative threshold images of isolated XII MNs from P3, P10, and
P21 with their respective Sholl profile and values .................................................52
13. Cumulative distributions ........................................................................................53
14. Box plots of the 2D Sholl analysis morphometrics measured at each of the
nine postnatal ages .................................................................................................57
15. Distributions showing normal unimodal, non-normal unimodal, and non-
normal non-unimodal data .....................................................................................60
16. Pooled distributions for the maximum intersection radius showing the finite
mixture distribution models ...................................................................................62
17. Threshold images of P1, P10, and P12 sections which have two isolated
hypoglossal neurons with different morphologies .................................................63
18. Morphology of hypoglossal motoneurons at P3, P10, and P17. The 3D
reconstructions and their associated Sholl profiles are shown ...............................98

ix
19. The I-V curves from P3, P10, and P17 XII MNs.................................................100
20. Action potentials and mAHP from P3, P10, and P17 XII MNs ..........................101
21. Regression analysis of passive and active biophysical properties of XII
MNs as a function of morphology .......................................................................102

x
TABLES
Tables
Page
1. Number of animals available for measurement per litter for the nine
postnatal ages .........................................................................................................27
2. Number of XII MN’s analyzed (per litter) for the nine postnatal ages ..................29
3. Shapiro-Wilk normality test results for soma morphology....................................45
4. Soma morphology summary statistics (mean ± std) for the three age groups .......46
5. Results of fitting two normal distributions to various parameters for P1-P5
(P1, P3, & P5) ........................................................................................................47
6. Results of fitting two normal distributions to various parameters for P7-P12
(P7, P10, & P12) ....................................................................................................48
7. Results of fitting two normal distributions to various parameters for P13-P21
(P13, P17, & P21) ..................................................................................................49
8. Shapiro-Wilk normality test results for dendrite morphology ...............................58
9. Results from Hartigans' dip test for unimodality/multimodality for dendrite
morphology ............................................................................................................59
10. Dendrite morphology summary statistics (mean ± std) for the three age
groups .....................................................................................................................61
11. Summary statistics of morphological and biophysical properties from XII
MNs........................................................................................................................99

xi
ABBREVIATIONS
CNS Central nervous system
XII Hypoglossal nucleus
MN Motoneuron or motor neuron
XII MN Hypoglossal motoneuron
P Postnatal day
2D Two dimensional
3D Three dimensional
SIDS Sudden infant death syndrom
nTS Nucleus tractus solitari
pBC Pre-Bötzinger complex
GABA Gamma-aminobutyric acid
Q-Q plots Quantile-Quantile plots
ANOVA Analysis of variance
E Embryonic day
ECD Equivalent circular diameter
AR Aspect Ratio
FF Form Factor
PDF Probability density function
CDF Cumulative distribution function
N/A Not applicable
N Number
Avg Average or mean value

xii
Std Standard deviation
CV Coefficient of variation
m Micrometer
MajDia Major diameter
V Membrane potential
t Time
Cm Membrane capacitance
Ix Ionic current for any ion x
ḡx maximum conductance for any ion x
yx Product of activation or inactivation gating variables
Ex Equilibrium potential for any ion x
INa Fast sodium channel current
INaP Persistent sodium channel current
Ik Potassium channel current
IA Fast-transient potassium current
Ileak Leakage current
Ipas Passive ionic current
Ih Hyperpolarization-activated current
gNa Fast sodium conductance
gK Potassium conductance
gleak Leakage conductance
gpas Passive conductance
gNaP Persistent sodium conductance

xiii
gA Fast-transient potassium conductance
gh Hyperpolarization-activated conductance
ENa Fast sodium membrane potential
EK Potassium membrane potential
Eleak Leakage membrane potential
Epas Passive membrane potential
Eh Hyperpolarization-activated membrane potential
mV Millivolts
nA Nanoamperes
ms Milliseconds
Rpeak Peak resistance
mAHP Medium Afterhyperpolarizaton
SK Small-conductance calcium-activated potassium channel
Nav Voltage-gated sodium channel

xiv
ABSTRACT OF THE DISSERTATION OR THESIS
Changes in the Morphology of Hypoglossal Motor Neurons in the
Brainstem of Developing Rats
by
Paul Allen Williams
Doctor of Philosophy, Graduate Program in Physiology
Loma Linda University, June 2018
Christopher G. Wilson, Chairperson
The autonomic brainstem generates and modifies breathing rhythm by integrating
inputs from chemo- and mechanosensors in the viscera while coordinating descending
outputs from higher CNS structures. Hypoglossal motoneurons (XII MNs) receive inputs
from respiratory premotor neurons in the medulla. Previous studies in rodents have
demonstrated significant changes in breathing control during the first three weeks of life,
with a sensitive period at 10 to 13 days post-birth (P10–P13) characterized by
pronounced changes in neurotransmitters, receptors, excitation-inhibition balance, and
breathing. However, age-dependent morphological changes of XII MNs during the first
three weeks post-birth and especially during this sensitive period, have not been
thoroughly studied. In this study, we comprehensively characterized and quantified the
postnatal morphological changes in rat XII MNs. We hypothesized that morphological
changes occur in XII MN morphology and arbor complexity corresponding to the
functionally-defined sensitive period observed at P10–P13. To test this hypothesis, we
used innovative statistical approaches to quantify and compare developmental changes in
Golgi-Cox stained XII MNs at nine postnatal ages between P1–P21. Additionally, we
performed 3D reconstructions of the neurons importing these geometries into the

xv
modeling environment NEURON to simulate the biophysical properties of XII MNs.
Soma size increased ~40% from P1 to P21, with no significant change in shape.
However, dendritic arborization increased in extent and complexity with branching of
neurons significantly increasing from P1 through P13, with the greatest increase at P10–
P13 based on the Sholl method. Three age groups 1) P1–P5, 2) P7–P12, and 3) P13–P21
were found as possible windows of development. We also found that at specific ages
certain parameters such as soma size and dendritic complexity were non-normally
distributed. I found support for differences in the density of selected voltage-gated ion
channels with age and correlations between passive electrophysiological properties and
morphology. Although a direct relationship was not found between morphology and the
active properties, I did find support for an indirect relationship. Our detailed
characterization of XII MN morphological development establishes a foundation for the
study and elucidation of morphological changes caused by maternal and perinatal
conditions using a rigorous approach.

1
CHAPTER ONE
BACKGROUND
At birth, autonomic regions in the brainstem, which generate and control
respiratory rhythm, which is critical throughout life, are not fully developed (Feldman et
al., 2013; Feldman and Del Negro, 2006; Feldman and Smith, 1995). Normal control of
breathing develops in the first few weeks after birth with motoneurons (MNs) of the
hypoglossal nucleus (XII) and other brainstem nuclei providing the drive to the tongue
and upper airways and are used in in vitro models to provide an index of fictive
inspiratory effort (Feldman et al., 2013; Feldman and Del Negro, 2006). The coordination
of the tongue and upper airway between speech and breathing is also an important aspect
that motivates the study of XII MN development. Because 80% or more of the neurons in
the XII are MNs that are readily distinguishable from the interneurons and play an active
role in inspiration during development, they are a convenient and accessible population
of neurons for morphological and electrophysiological study (Cooper, 1981; McClung
and Goldberg, 1999). Although the effects of various factors such as nicotine and
inflammation on respiratory development have been studied (Fregosi and Pilarski, 2008;
Powell et al., 2016; Rourke et al., 2016), very little is known about these conditions on
morphological development. One possible reason for this is that changes in the normal
maturation of breathing patterns has been studied (Liu et al., 2009, 2006), but little is
known about the normal maturation of XII MN morphology.
Therefore, in this work my objective was to comprehensively characterize and
quantify the normal maturation of somatic and dendritic tree morphology as has been
done for breathing pattern. In addition, I simulated the electrophysiological behavior of

2
XII MNs based on measured 3D geometries comparing these results to results from
electrophysiological experiments. I employed Golgi-Cox staining, 2D Sholl analysis, 3D
reconstructions, and the NEURON simulation environment to measure morphology and
simulate electrophysiology.
Golgi, Cajal and Neuron Morphology
In the late 1800’s into the early 1900’s two main theories of the nervous system
were debated. On the one hand some such as Golgi believed that the nervous was
comprised of a diffused network formed by anastomosis of axonal processes (reticular
doctrine). Others such as Cajal believed that the nervous system was composed of
individual nerve cells that were connected (neuron doctrine) (De Carlos and Borrell,
2007). Although Cajal and Golgi defended different concepts of the nervous system
organization, Cajal’s work was based on the utilization of modified versions of Golgi’s
histological techniques for staining neurons first published in 1873 (De Carlos and
Borrell, 2007). Since then the Golgi staining technique has been utilized, improved,
adapted to other application, and still in some respects the Gold Standard in studying
neuron morphology (Koyama, 2013). The original Golgi stain and the variety of modified
techniques such as Golgi-Cox and Rapid Golgi has been used in bright-field microscopy,
electron microscopy, and to differentially stain glia cells (Koyama, 2013; Koyama et al.,
2013; Levine et al., 2013; Martinez-Tellez et al., 2005; Ranjan and Mallick, 2012). Some
of the advantages of Golgi staining is the resolution obtained while dendrites along with
dendritic spines are identified with good detail. Despite the advantageous of modern
histological and staining methods, the utility and benefits that the variety of Golgi stains

3
have allows it to still be a commonly employed technique in the study of neuron
morphology.
Respiration
Respiration is a fundamental autonomic function that involves the coordination of
the diaphragm, lung volume, airway tone, and control of the tongue to be maintained
continuously over the duration of an organism’s life. Even though the control of
breathing is fundamental to all mammals, our knowledge of the underlying neural
circuitry that generates breathing rhythm is still nascent (Feldman et al., 2013; Feldman
and Del Negro, 2006). Whether an individual breaths through the nose or mouth and its
impact on health has been the subject of study (Fujimoto et al., 2009; Leal et al., 2016;
Macari et al., 2012; Padzys et al., 2011). However, developmental changes in the
breathing mode (nasal versus mouth) has received very little, if any study (Hall, 2005;
Mortola and Fisher, 1981). Although breathing mode is clinically important, details on
shifts between obligate mouth to nasal breathing during postnatal development are
lacking. The neural network that generates and transmits breathing motor pattern is
located in the brainstem and must be functional prior to birth (approximately embryonic
day 15 in rats and mice (Thoby-Brisson and Ramirez, 2001, 2000) and continues to
develop and remodel in the first weeks of life (Harper and Kinney, 2010; Kinney, 2009;
Wong-Riley and Liu, 2005). If the breathing neural network fails or is unable to generate
a physiologically appropriate rhythm, pathological breathing patterns can result, and
these can impair the animal’ s well-being. During early life, breathing disorders such as
apnea of prematurity, periodic breathing, and Sudden Infant Death Syndrome (SIDS)

4
(Erickson et al., 2007; Kinney, 2009; Martin and Wilson, 2009). Historical work in
breathing control has provided an understanding of how metabolic rate affects breathing
across the stages of development—from birth to adulthood (Liu et al., 2006; Mortola,
1984), but we do not yet understand how breathing regulation and control are correlated
with anatomical structure and synaptic remodeling of neurons embedded within the
breathing circuit (Feldman et al., 2013; Feldman and Del Negro, 2006; Wong-Riley et al.,
2013). Understanding how the breathing neural network is remodeled during early life is
key to a deeper understanding of the role that morphology plays in reliable transmission
of breathing rhythm in the perinatal period.
Respiratory Control
Regions of the brainstem such as the nucleus tractus solitarii (nTS), PreBötzinger
Complex (pBC), and hypoglossal nucleus (XII) are key to the generation and
transmission of the breathing pattern (Lindsey et al., 2012; Wong-Riley and Liu, 2005),
however we understand very little about the structural changes across the early
developmental window of autonomic circuitry. While it has been known for some time
that neural network behavior is influenced by the morphology of neurons and
connectivity is altered due to changes in neurotransmitter release and receptor up- and
down-regulation (Ascoli et al., 2009; Donohue and Ascoli, 2008; Krichmar et al., 2002).
Yet, even fundamental knowledge about these changes in the brainstem are limited
(Fregosi, 2011; R. Kanjhan et al., 2016). The motoneurons of the hypoglossal nucleus
(XII) provide the drive to the tongue and upper airways and are used in in vitro models to
provide an index of fictive inspiratory effort (Koizumi et al., 2008; Smith et al., 1991). It

5
has previously shown that there are age-dependent changes in hypoglossal motoneuron
output drive (Fietkiewicz et al., 2011).
Detailed studies of the development of respiration and respiratory control have
been conducted in only the past couple of decades. During the first three weeks post-birth
(P0–P21) cytochrome oxidase generally increases in the pBC, nTS, XII, and other nuclei
of the brain stem (Liu and Wong-Riley, 2003, 2001). However, at P3 and P4 there is
plateau in the level of cytochrome oxidase that occurs at P3 and P4 in the pBC, while
there is a prominent decrease at P12. These changes at P3, P4, and P12 in the pBC also
exhibit increases of inhibitory drive mediated by GABA and glycine and decreased in
excitatory drive mediated by glutamate activity (Liu et al., 2006; Wong-Riley and Liu,
2005). In brainstem nuclei such as the XII, nTS, and pBC there is mostly a steady
increase in cytochrome oxidase up to P7 (Liu and Wong-Riley, 2003). During the second
week of postnatal life (P8–P14), there are shifts in excitation-inhibition balance (both
neurotransmitters and receptors) and cytochrome oxidase levels, especially on days 10,
11, 12, and 13 in most brainstem nuclei (Liu et al., 2006; Liu and Wong-Riley, 2003).
Ventilatory changes are also seen from P0 to P21 with an increase in breathing
frequency during the hypoxic ventilatory response at P0–P6 (Liu et al., 2009, 2006). At
P10–P21 there is a decrease in breathing frequency, but an increase in tidal volume while
there is a decrease in minute volume at P10–P13 with an increase at P14–P21 (Liu et al.,
2009, 2006). Postnatal days P10–P13 have been referred to as a “sensitive period” in
which respiratory development exhibits pronounced changes in frequency and variability
of breathing pattern. This “sensitive period” is a window of transitional change from the
early more variable breathing (P0–P7) to later less variable breathing pattern during P15–

6
P21. Finally, the third week represents changes leading to adolescence and respiratory
control similar to that of an adult. Although there are changes in cytochrome oxidase,
respiratory control, neurotransmitters, and neural function, the most notable changes are
usually seen during the P10–P13 period and this period seems to be when chemoreflexes
have matured and have a more pronounced effect on breathing pattern (Wong-Riley et
al., 2013). However, very little information is available concerning the potential role that
morphological changes may have on these developmental windows.
Hypoglossal Motoneurons
Morphology
It has been estimated that the hypoglossal nucleus (XII) contains approximately
3500 motoneurons (Lewis et al., 1971). Of the neurons in the XII at least 80% are
motoneurons with a small population of interneurons (Boone and Aldes, 1984; Cooper,
1981; Takasu and Hashimoto, 1988). It has been suggested that the size, shape, and
dendritic orientation differentiate motoneurons in different regions of the XII (Aldes,
1995; Boone and Aldes, 1984; Cooper, 1981; Kitamura et al., 1983; McClung and
Goldberg, 1999; Odutola, 1976). In the dorsal region MNs appear fusiform, orientated
along the mediolateral axis and range from 18–40 m in diameter. Those XII MNs in the
dorsal region, which innervate intrinsic muscles are reported as significantly smaller
(mean = 26 m) compared to the MNs innervating extrinsic muscles (mean = 30 m)
(McClung and Goldberg, 1999). In the central portion of the ventral subdivision MNs
that innervate intrinsic muscles are on average smaller (mean = 23 m) and more
globular in shape than the larger more lateral multipolar MNs in the ventral division

7
(mean = 28.7 m) (Kitamura et al., 1983). Therefore, as with other nuclei the hypoglossal
nucleus has separate pools of motoneurons which innervate specific muscles and the
morphological differences may relate to the function of the specific muscle innervated
(McClung and Goldberg, 1999). For adults XII MNs are further classified based on
dendritic morphology. Dendrites of MNs in the dorsal region can be either be confined to
the XII region (internal) or extend beyond the borders of the XII (external) (Odutola,
1976).
Although there have been in vitro studies investigating postnatal development of
XII motoneuron morphology demonstrating anatomical changes with age, detailed
information on the age-related development is lacking. A small number of studies have
studied developmental changes in XII MN morphology, but these have not focused on the
functional sensitive window (Carrascal et al., 2005; Refik Kanjhan et al., 2016).
Morphological differences have been shown between neonatal and adults as well as
corresponding electrophysiological changes (Cameron et al., 1991; Fulton and Walton,
1986; Nunez-Abades et al., 1994, 1993; Nunez-Abades and Cameron, 1995).
Electrophysiology
The electrophysiology of neurons from certain regions of the brain is well known
in adults and to a lesser extent in neonatal animals. Much study has also been given to
XII MNs in examining the hyperpolarization-activated current as well as different types
sodium and potassium voltage-gated channels (Berger et al., 1996; Cameron and Nunez-
Abades, 2000; Ekberg and Adams, 2006; Yoshimoto et al., 2015; Yu and Catterall,
2003). However, there is little work on the electrophysiology of hypoglossal

8
motoneurons (XII MNs) during the neonatal period (P1–P21) with one or two studies
(Carrascal et al., 2005; Nguyen et al., 2004; Nunez-Abades et al., 1993). Essentially
nothing known about the possible relationship between the electrophysiology and
morphology for any age except between biophysical properties for four age groups. The
sensitive period does not seem to have been studied, but it would be interesting to know
if there are electrophysiological changes relating to this developmental window.
There are a few studies which modeled the electrophysiological behavior of
motoneurons using a single compartment model (soma) for the neuron (Engel et al.,
1999; Fietkiewicz et al., 2011; Purvis and Butera, 2005). However, there are no studies in
which the entire morphology of actual XII MNs were modeled. There is a wealth of data
on the expression of various voltage-gated channels and the hyperpolarization-activated
current and some work on differences in the expression of specific ion channels such as
sodium channels with age from P1–P21 (Beckh et al., 1989; González-Castillo et al.,
2017).
Data Analysis
Traditional
A variety of morphologic measures such as volume, surface area, diameter,
length, branch order, and number of dendrites have been reported in the literature
(Fukunishi et al., 1999; Refik Kanjhan et al., 2016; Nunez-Abades et al., 1994; Nunez-
Abades and Cameron, 1995). In the past, most morphological studies simply applied
parametric statistics producing graphs showing means and standard deviations sometimes
including the data points for each individual neurons (Refik Kanjhan et al., 2016; Nunez-
9
Abades et al., 1994; Nunez-Abades and Cameron, 1995). A few studies have employed
nonparametric statistics for comparing different groups (Refik Kanjhan et al., 2016).
Previous studies have also grouped data from a range of ages such as P1–P3, P5–P9, or
P15–P30 without any statistical testing or quantitative rationale (Refik Kanjhan et al.,
2016; Nunez-Abades et al., 1994; Nunez-Abades and Cameron, 1995). However, these
studies used as few as five to ten neurons for the entire group, a mere one or two animals
at each age and a couple of neurons per animal. Therefore, previous studies of XII MN
morphology utilized relatively small numbers of neurons across age ranges with very
little, if any support for the grouping.
Conventional
For any parametric statistical test one of the key assumptions is of course, that the
data is normally distributed for every group being tested. Another assumption for almost
any statistical test is that the data is represented by a unimodal distribution. Although,
there are readily available statistical tests and analyses (graphical and numerical) for
examining whether a set of data is normally distributed or not as well as identifying what
type of distribution represents the data (Ghasemi and Zahediasl, 2012; Le Boedec, 2016),
their use in neuron morphology studies have not been reported. Graphical methods such
as Q-Q plots, Cullen-Frey (skewness versus kurtosis) plots, and cumulative distributions
can allow for visual evaluation of whether the data set is normally distributed
(Delignette-Muller and Dutang, 2015). Statistical tests such as the Kolmogorov-Smirnov
(K-S), Shapiro-Wilk test, Anderson-Darling test, Cramer-von Mises test, and the Jarque-
Bera test can determine the statistical significance of a data set being normally distributed
10
(Ghasemi and Zahediasl, 2012; Le Boedec, 2016). There is also one test for determining
whether a data set is unimodally distributed or not. The Hartigan dip-test provides a
numerical evaluation of how well the data distribution fits a unimodal distribution
(Hartigan and Hartigan, 1985). There are in addition several methods for non-parametric
ANOVA and multiple comparison tests (García et al., 2010). The conventional battery of
tests and statistical methods pertaining to non-parametric data (non-normally distributed)
easily allows for thorough testing and evaluation of data regardless of the nature of the
distribution and assumptions that the data satisfies. Although sample size is still
important the variety of non-parametric tests allows for selection of the appropriate test in
respect to the data. One other advancement in statistical analysis is the ability to examine
and test for different distributions assessing what type of distribution (normal, log-
normal, gamma, Weibull, etc…) best fits the data (Delignette-Muller and Dutang, 2015).
Distribution Analysis
In addition to comparative tests and validating their assumptions, the type of
distribution which best represents the data for each group in an experiment can be
valuable in understanding and interpreting the results. There are number of graphical
techniques as mentioned above to evaluate the data relative to a number of different
distributions (Delignette-Muller and Dutang, 2015). There are also programs such as Fit-
Dist which can be used to fit a data set to a specific distribution providing a measure of
the “goodness-of-fit” for that distribution. These programs usually also provide both
graphical and numerical results comparing the data set to a specific single unimodal
distribution. Knowing that two sets of data have different distributions (such as log-
11
normal versus gamma) can have a profound influence on the type of comparative
statistical tests (such as using the Kolmogorov-Smirnov test) to be employed as well as
indicating that the two sets of data may represent different stochastic processes.
Data which may be represented by more than one overlapping distributions is also
important in that it suggest that the data is more complex than is represented by a single
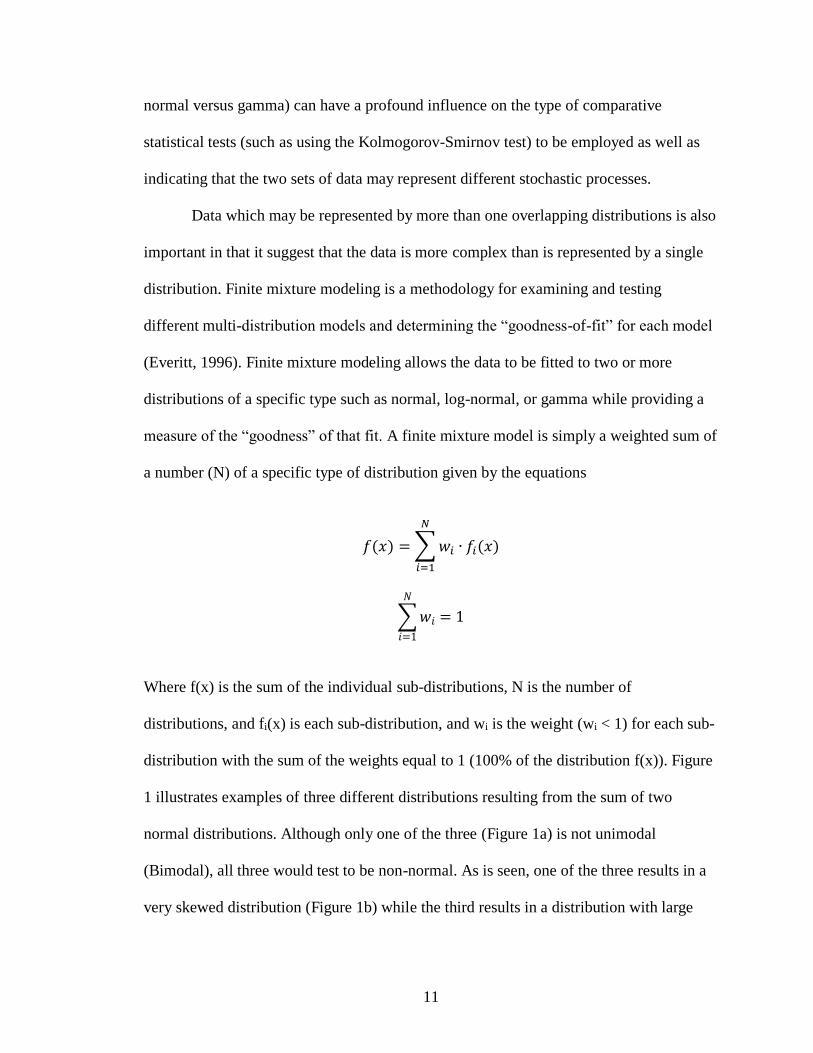
distribution. Finite mixture modeling is a methodology for examining and testing
different multi-distribution models and determining the “goodness-of-fit” for each model
(Everitt, 1996). Finite mixture modeling allows the data to be fitted to two or more
distributions of a specific type such as normal, log-normal, or gamma while providing a
measure of the “goodness” of that fit. A finite mixture model is simply a weighted sum of
a number (N) of a specific type of distribution given by the equations
𝑓(𝑥) =∑𝑤𝑖
𝑁
𝑖=1
∙ 𝑓𝑖(𝑥)
∑𝑤𝑖
𝑁
𝑖=1
= 1
Where f(x) is the sum of the individual sub-distributions, N is the number of
distributions, and fi(x) is each sub-distribution, and wi is the weight (wi < 1) for each sub-
distribution with the sum of the weights equal to 1 (100% of the distribution f(x)). Figure
1 illustrates examples of three different distributions resulting from the sum of two
normal distributions. Although only one of the three (Figure 1a) is not unimodal
(Bimodal), all three would test to be non-normal. As is seen, one of the three results in a
very skewed distribution (Figure 1b) while the third results in a distribution with large

12
than expected tails as compared to a normal, log-normal, or other single skewed
distribution.

13
Figure 1. Graphs illustrating examples of different finite mixture model. The PDF and
CDF for mixture models of two normal distributions showing (A) a bimodal distribution,
(B) a skewed distribution, and (C) an increase in the tails. The blue and magenta lines
represent the two theoretical distributions while the black lines represent the summation
of the two distributions.

14
Present Study
In the previous developmental studies of breathing control during the first three
weeks post-birth measurements were performed on a daily basis (Liu et al., 2006).
However, there are no developmental studies of XII MN morphology with similar
temporal resolution (measurements on a daily or semi daily basis). Also, the sensitive
period as previously described for respiration has not be examined. Therefore, I
performed the present study investigating the morphological changes in XII MNs in a
developing rat model. My specific aims were 1) Quantify developmental changes in the
morphology of hypoglossal motoneurons in the respiratory region of the brainstem with
postnatal age, and 2) Model development changes in the electrophysiological behavior of
hypoglossal neurons in the respiratory region of the brainstem as related to age and
morphology. Our hypothesis was that there is a morphology change corresponding to the
sensitive period that has been shown for neurochemical and respiratory control.
I examine nine separate time points during the first three weeks of development in
a rat model to determine the changes in MN morphology in the hypoglossal nucleus with
age. We utilized the Golgi-Cox technique to stain XII MNs to visualize the neurons for
morphological analysis at each of the nine separate time points (Figure 2). We also
employed conventional statistics and other methodologies to perform detailed analysis of
the morphological data. I used nonparametric statistics to compare the nine ages pooling
data at ages which were not significantly different. In addition, we utilized the simulation
environment NEURON to investigate the potential role of morphology in the
electrophysiology of XII MNs with age (Figure 2). Among the innovations of my study
were the temporal resolution (individual days), comprehensive statistical (testing for
normality and unimodality) and data (finite mixture models) analysis. Another innovation

15
was modeling then electrophysiology using actual XII MN morphologies instead of
simple single compartment models and models with three none branching dendrites as
has been done previously. I simulated previous electrophysiological experiments and
compared my results with those experimentally obtained. The last innovation is exploring
the possible relationship between XII MN morphology and the passive and active
electrophysiological properties.

16
Figure 2. Flowchart of the project showing the morphology, electrophysiology, and
overview of the work.

17
CHAPTER TWO
CHANGES IN THE MORPHOLOGY OF HYPOGLOSSAL MOTOR NEURONS
IN THE BRAINSTEM OF DEVELOPING RATS
Paul Allen Williams1,2, Denise L. Bellinger1,3, Christopher G. Wilson1,2
1Division of Physiology, Basic Science Department
2Lawrence D. Longo, MD Center for Perinatal Biology,
3Department of Pathology and Human Anatomy
Loma Linda University School of Medicine
11234 Anderson St, Loma Linda, California 92350
The Anatomical Record, 2018, In press
(Modified version)

18
Abstract
The autonomic brainstem generates breathing rhythm by integrating inputs from
chemo- and mechanosensors in the viscera and coordinating descending outputs from
higher structures in the central nervous system. Hypoglossal motoneurons (XII MNs)
receive inputs from respiratory premotor neurons, important for maintaining airway
patency. Previous studies in rodents report significant changes in breathing control during
the first three weeks of life, with a sensitive period at 10 to 13 days post-birth (P10–P13)
characterized by pronounced changes in neurotransmitters, excitation-inhibition balance,
and breathing physiology. However, age-dependent morphological changes of XII MNs
during the first three weeks post-birth and especially this sensitive period are under-
studied. Here, we comprehensively characterize and quantify the early morphological
changes in rat XII MNs. We hypothesized that there are morphological changes in the
soma size and dendritic tree complexity of XII MNs corresponding to the functionally-
defined sensitive period observed at postnatal day 10–13 (P10–P13). To test this
hypothesis, we used an innovative contemporary statistical approach to analyze Golgi-
Cox stained XII MNs at nine postnatal ages between P1–P21. Our findings reveal two
sub-populations of XII MNs, which are dependent on age and morphological feature.
Soma size increased ~40% from P1 to P21, without changing shape. However, dendritic
arborization increased in extent/distance and complexity. Dendritic branching of
developing neurons significantly increased from P1 through P13, with the greatest
increase at P10–P13 based on the Sholl method. Our detailed characterization of XII MN
morphological development establishes a foundation for the study and elucidation of
morphological changes caused by maternal and perinatal conditions.

19
Introduction
Respiration is a fundamental autonomic behavior that requires coordination of the
diaphragm, intercostal muscles, upper airway, and tongue to ensure breathing matches
metabolic need. Even though the control of breathing is fundamental to higher organisms,
our knowledge of the underlying neural circuitry that generates breathing rhythm is still
nascent (Feldman et al., 2013; Feldman and Del Negro, 2006). Importantly, we do not yet
understand how breathing regulation and control are influenced by anatomical structure
and synaptic remodeling of neurons within the central respiratory circuitry early in
development (Feldman et al., 2013; Feldman and Del Negro, 2006; Wong-Riley et al.,
2013). The neural network in the brainstem that generates, shapes, and transmits
breathing motor pattern must be functional prior to birth (Thoby-Brisson et al., 2005) and
continues to develop and remodel in the first weeks of life (Harper and Kinney, 2010;
Kinney, 2009; Wong-Riley and Liu, 2005). If the breathing neural network fails to
generate a physiologically appropriate rhythm during early postnatal life, pathological
breathing patterns can occur—such as apnea of prematurity, periodic breathing, and
sudden infant death syndrome (SIDS) with impaired gas exchange that could threaten the
life of the newborn (Erickson et al., 2007; Kinney, 2009; Martin and Wilson, 2009).
Brainstem regions such as the nucleus tractus solitarii (nTS), preBötzinger
Complex (pBC), and hypoglossal motor nucleus (XII) are necessary for the generation
and transmission of breathing rhythm and modification of breathing pattern in response to
sensory input (Lindsey et al., 2012; Wong-Riley and Liu, 2005). Early work by other
investigators has shown that development of the respiratory network plays a key role in
changing breathing pattern (Liu et al., 2006; Mortola, 1984). Understanding how the
breathing neural network is remodeled during early life is key to elucidating the synergy

20
between morphology and the transmission of breathing rhythm in the perinatal period.
Other reports have shown that neural network behavior is influenced by the morphology
of neurons, and that connectivity is altered due to changes in neurotransmitter release and
receptor up- and down-regulation (Ferrante et al., 2013; Komendantov and Ascoli, 2009).
Hypoglossal motoneurons (XII MNs) supplying the tongue and upper airways are used in
in vitro models to provide an index of fictive inspiratory transmission (Koizumi et al.,
2008; Purvis and Butera, 2005; Smith et al., 1991, 2000), and our laboratory has
previously shown age-dependent changes in the distribution of drive latencies in
hypoglossal motoneuron output (Fietkiewicz et al., 2011).
Within the past two decades developmentally-related changes in breathing
physiology have been characterized. During the first weeks after birth, changes in
cytochrome oxidase occur in the pBC, nTS, XII, and other nuclei of the brainstem (Liu
and Wong-Riley, 2001; Wong-Riley and Liu, 2003). Additionally, during postnatal days
10 through 13 there are increases in inhibitory drive, mediated by GABA and glycine,
and decreased glutamatergic excitatory drive (Liu and Wong-Riley, 2002, 2006; Wong-
Riley and Liu, 2005). Ventilatory changes have been described from P0 to P21 with an
increase in the hypoxic ventilatory response at P0–P6 (Liu et al., 2006, 2009). At P10–
P21 there is a decrease in overall breathing frequency, but an increase in tidal volume
(Liu et al., 2006, 2009). Postnatal days 10–P13 have been referred to as a “sensitive
period” in which respiratory development exhibits pronounced changes in frequency and
variability of breathing pattern. This “sensitive period” is an intermediate window of
transition from the early more variable breathing (P0–P7) to later less variable breathing
pattern seen during P15–P21. Finally, the third week represents changes leading to

21
adolescence and respiratory control similar to that of an adult. Although changes in
cytochrome oxidase, respiratory control, neurotransmitters, and neural function, occur
during the P10–P13 period, a major component of the breathing changes are likely due to
the maturation of chemoreflexes (Wong-Riley et al., 2013). However, little information is
available concerning the potential role that morphological changes may have on these
developmental windows.
Morphological and electrophysiological differences have previously been shown
between neonate and adult animals (Cameron et al., 1991; Fulton and Walton, 1986;
Nunez-Abades et al., 1993, 1994; Nunez-Abades and Cameron, 1995). Although in vitro
studies investigating postnatal development of XII motoneuron morphology showed
anatomical changes with age, a detailed description of age-related development is
lacking. The few developmental studies investigating changes in XII MN morphology
(Carrascal et al., 2005; Kanjhan et al., 2016a) did not focus on the functionally sensitive
window, P10–P13. Previous studies have collapsed data across age ranges or windows
based on arbitrary grouping (Kanjhan et al., 2016a), or omitted certain windows or age
ranges, which have been indicated as important in respiratory control, particularly P10–
P13 (Nunez-Abades et al., 1994; Nunez-Abades and Cameron, 1995). The ages we
studied are based on postnatal days when significant respiratory and neurotransmitter
changes have previously been reported in the developing brainstem of rats (Liu et al.,
2006; Wong-Riley and Liu, 2005). Previous studies have suggested that there is little if
any difference in normal development between genders for the ages investigated in this
study (Kanjhan et al., 2016a; Wong-Riley et al., 2013), thus we did not differentiate
between genders.

22
Our aim in these experiments was to study the maturation of XII MNs within the
context of previously reported physiological and neurochemical changes around postnatal
days 10 to 13. Our objective in this study was to comprehensively characterize and
quantify the somatic and dendritic morphological features of XII MNs across the first
three weeks of life. We hypothesized that there are morphological changes in XII MNs
which correspond to the functionally-defined sensitive period observed at P10–P13. We
tested this hypothesis using Golgi-Cox staining to visualize neuronal morphology for
quantitative examination of somata and dendritic arbor of developing XII MNs at nine
separate postnatal ages from P1–P21 in a rat model. We employed two-dimensional (2D)
Sholl analysis to quantify morphological metrics including the maximum number of
intersections, radius at which the maximum number of intersections occur, ramification
index, and enclosing radius for the dendritic tree of XII MNs from P1 to P21. We tested
for both normality and unimodality of the data distribution as well as nonparametric
statistics and contemporary statistical methodology including finite mixture distribution
models to determine how the data was distributed. Previous studies have not
comprehensively reported the use of normality or unimodality testing of their data, so
applying contemporary statistical methods to our data has the potential of revealing a
greater understanding of XII MN development during the first three weeks post-birth.
Materials and Methods
Animals
Pregnant Sprague-Dawley dams (Charles River Laboratories International, Inc.,
Wilmington, MA) obtained approximately 18 days after the start of pregnancy (E18)
were allowed to deliver naturally in the Loma Linda University Animal Care Facility. To

23
determine how many time points to use a minimal litter size of 9 rat pups was assumed,
therefore we selected nine postnatal ages across the first three weeks of development for
this study. To adequately reflect the early period of development when several changes
occur P1, P3, P5, and P7 were chosen (Liu et al., 2006; Liu and Wong-Riley, 2002, 2006,
2001; Wong-Riley and Liu, 2005). For the second week the sensitive developmental
period was the focus, so P10, P12, and P13 were chosen. This only left two time points
for the third week of development, so we chose P17 and P21 as the period of maturation
prior to the adult respiratory pattern. As a result, rat pups at nine postnatal ages (P1, P3,
P5, P7, P10, P12, P13, P17, and P21 days) were used in the study. Typical litter size was
approximately 9–14 pups (Table 1) and no distinction was made between genders. When
two litters were used they were balanced if needed so that the number of pups per litter
were similar if not the same. All procedures and protocols used in this study were
approved by the Institutional Animal Care and Use Committee at Loma Linda University
and followed the guidelines by the National Institutes of Health Guide for the Care and
Use of Laboratory Animals (http://www.ncbi.nlm.nih.gov/books /NBK54050).
Golgi-Cox Staining
On the appropriate developmental day, animals were weighed, euthanized, and
the brain extracted. For postnatal ages P1 through P7 the pups were anesthetized with
isoflurane (Western Medical Supply). When unresponsive to toe pinch, their brains were
rapidly extracted and placed in chilled 0.9% saline. For postnatal ages P10 through P21,
animals were placed in an induction chamber with oxygen (100%) flow at 0.65 L/min
and isoflurane administered at a concentration of 3 to 4% based on the postnatal age.
After the animal was unresponsive to toe pinch it was removed from the induction

24
chamber and placed on a platform with the oxygen and isoflurane continuously
administered via a nose cone. The animal was perfused with 0.9% saline for
approximately two minutes and then the brain was removed. For ages P1 through P7, the
whole brain was maintained intact while for P10 through P21 the brain was sectioned
coronally into two tissue blocks.
After removal, the brains were immediately transferred from 0.9% saline to
impregnation solution from a commercial kit (superGolgi Kit, Bioenno Tech, LLC, Santa
Ana, California). Impregnation solution was changed after two days then the specimens
were left in the solution for five more days according to the supplier’s instructions and
previous reported methods (Das et al., 2013). Sections impregnated at different time
durations showed that the best results were obtained with 7 days of impregnation
changing the solution after the initial two days. After a total of 7 days in impregnation
solution at room temperature, the brains were placed in two changes of post-impregnation
buffer at room temperature (changed each day for two days). We performed coronal
sectioning of tissue at 150 m with a vibratome (Vibratome Series 1000 Classic–Tissue
Sectioning System, Leica, St. Louis) (Gibb and Kolb, 1998). Sections were mounted onto
gelatin-coated slides and allowed to dry slowly in a humidified chamber overnight (Das
et al., 2013). The slides were then allowed to dry at room temperature and humidity for
approximately one hour and then rehydrated in phosphate buffered saline, stained, placed
in post-staining buffer, and then washed, dehydrated, and cleared in xylene as per the
supplier’s instructions and previous reported methods (Das et al., 2013). After staining,
Permount (Fisher Scientific, SP-15) was applied to the slides which were then cover-
slipped and allowed to fully dry.

25
Imaging
All sections were imaged using a 2x objective and compared with atlases
(Khazipov et al., 2015) corresponding to the appropriate postnatal period to identify the
sections containing the XII nucleus from each animal (Figure 3). We used a 40x objective
to acquire image stacks for each XII motor neuron. For the P1–P7 animals single image
stacks with one image every 2 μm in the z-direction were obtained using a microscope
(Ziess Axio Imager, Carl Zeiss Microscopy, LLC One Corporation Way 1 Peabody, MA
USA) with a motorized stage (Applied Scientific Instrumentation, Eugene, OR) and
imaging software (Stereologer, Stereology Resource Center, Tampa FL). For the P10–
P21 animals, we acquired single and multiple stacks with one image every 2 m in the z-
direction. Multiple z-stacks are required for many of the P10–P21 animals in order to
image the entire dendritic morphology of a single neuron at 40x, so we used another
microscope (Keyence, BZ-9000, Itasca, IL) to capture the arborization for these neurons.
The resolution for the Ziess Axio Imager was 0.402 m/pixel while for the Keyence the
resolution was 0.271 m/pixel.
Morphological Measurements
After the images were processed in ImageJ (https://imagej.nih.gov/ij/), the Sholl
analysis plug-in (Ferreira et al., 2014) was used to perform 2D measurements. For the P1
through P7 animals, image stacks were converted to z-projections, thresholding was
applied to the z-projections, and single neurons with minimal or no overlapping dendrites
and minimal artifacts were selected, isolated, and measured. For the P10 through P21
animals, single image stacks were processed the same as in P1 through P7 animals, but
26
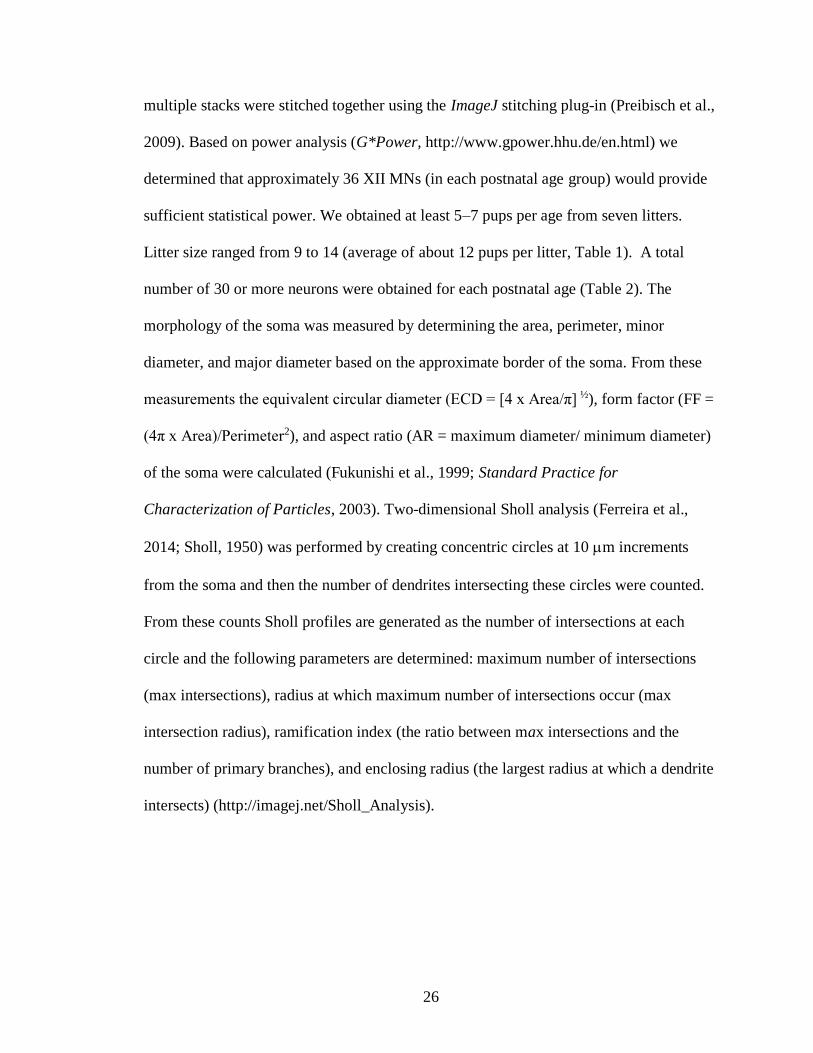
multiple stacks were stitched together using the ImageJ stitching plug-in (Preibisch et al.,
2009). Based on power analysis (G*Power, http://www.gpower.hhu.de/en.html) we
determined that approximately 36 XII MNs (in each postnatal age group) would provide
sufficient statistical power. We obtained at least 5–7 pups per age from seven litters.
Litter size ranged from 9 to 14 (average of about 12 pups per litter, Table 1). A total
number of 30 or more neurons were obtained for each postnatal age (Table 2). The
morphology of the soma was measured by determining the area, perimeter, minor
diameter, and major diameter based on the approximate border of the soma. From these
measurements the equivalent circular diameter (ECD = [4 x Area/π] ½), form factor (FF =
(4π x Area)/Perimeter2), and aspect ratio (AR = maximum diameter/ minimum diameter)
of the soma were calculated (Fukunishi et al., 1999; Standard Practice for
Characterization of Particles, 2003). Two-dimensional Sholl analysis (Ferreira et al.,
2014; Sholl, 1950) was performed by creating concentric circles at 10 m increments
from the soma and then the number of dendrites intersecting these circles were counted.
From these counts Sholl profiles are generated as the number of intersections at each
circle and the following parameters are determined: maximum number of intersections
(max intersections), radius at which maximum number of intersections occur (max
intersection radius), ramification index (the ratio between max intersections and the
number of primary branches), and enclosing radius (the largest radius at which a dendrite
intersects) (http://imagej.net/Sholl_Analysis).

27
Table 1. Number of animals available for measurement per litter for the nine
postnatal ages. The numbers in parentheses are the number of pups born in that litter,
but usually only 9 to 12 pups in a single litter were used. Animals in which the
specimen or sections were lost are designated by N/A.
Age
(days)
Litter Total #
of
Animal
s
1
(N=12)
2
(N=9)
3
(N=12)
4
(N=10)
5
(N=14)
6
(N=14)
7
(N=10)
P1 N/A N/A 2 1 1 N/A 2 6
P3 N/A 1 1 1 1 1 2 7
P5 1 1 N/A 1 2 1 N/A 6
P7 N/A 1 1 1 1 2 N/A 6
P10 1 1 1 1 2 1 N/A 7
P12 1 1 1 1 1 1 1 7
P13 1 1 1 1 1 1 N/A 6
P17 N/A N/A 1 2 1 2 N/A 6
P21 1 1 1 1 N/A N/A 1 5
Total 5 7 9 10 11 8 6 56

28
Figure 3. Morphology of hypoglossal motoneurons for the rat pups at P3, P10, and P21
postnatal ages. Shown are the images of the corresponding atlas (Left) for P3, P10, & P21
[R. Khazipov et al., 2015], as well as the low magnification (2X) micrographs of the
sections (center), and high magnification (40X) images of the Golgi-Cox stained
hypoglossal motoneurons. The high magnification image for the P3 is a single stack while
for the P10 & P21 the high magnification images are six stacks stitched together as
described in the methods.

29
Table 2. Number of XII MN’s analyzed (per litter) for the nine postnatal ages. For
ages and litters in which the specimen or sections were lost are designated by N/A.
Age
(days)
Litters Total # of
Neurons 1 2 3 4 5 6 7
P1 N/A N/A 18 3 8 N/A 19 48
P3 N/A 5 6 8 17 7 15 58
P5 9 4 N/A 6 22 6 N/A 47
P7 N/A 9 10 7 10 25 N/A 61
P10 19 6 9 10 13 5 N/A 62
P12 4 6 5 7 4 24 8 58
P13 3 6 13 13 11 5 N/A 51
P17 N/A N/A 9 21 6 8 N/A 44
P21 5 8 6 6 N/A N/A 6 31
Total 40 44 76 81 91 80 48 460

30
Location and Selection of Neurons
Mapping of Neuron Locations
Figure 3 shows photomicrographs from atlases (Khazipov et al., 2015) of P3, P10,
and P21 (left panel) with low (2x) and high (40x) magnification images of Golgi-stained
XII MNs representative sections (center and right panels, respectively). The estimated
lambda for the low magnification images was used to match the images to the atlas
image. The position of each XII motoneuron was measured with ImageJ to acquire the
length and angle of a line from the apex of the fourth ventricle (rostral) or central canal
(caudal). Then the length and angle were converted to x (horizontal) and y (vertical)
distance with the x representing the medial-lateral and the y representing the dorsal-
ventral direction. These points were projected on a plot relative to this anatomical
reference point and the boundary of XII determined in a similar manner, as previously
described (Kanjhan et al., 2016a; Koizumi et al., 2008). Points from both left and right
hemispheres were mapped to one side of the section for the purpose of determining the
total number and location of neurons in each section. For the rostral-caudal extent of XII,
sections were matched with a representative rat atlas for each postnatal age (Khazipov et
al., 2015) and the lambda coordinate along with the y distance (dorsal-ventral direction)
was used to project the point in a sagittal plane similar to that previously described
(Kanjhan et al., 2016a). Due to size differences between the postnatal ages, lambda was
normalized by the lambda value at the obex. Neurons located in the XII nucleus for both
the coronal and sagittal maps were measured while any neurons outside the XII were
excluded from analysis.

31
Selection of Motoneurons
Although the majority of neurons in the XII nucleus are motoneurons, there are a
few interneurons (Boone and Aldes, 1984; Cooper, 1981; Takasu and Hashimoto, 1988).
Because of this we needed criteria to determine if the measured neuron was a
motoneuron. In the adult rat motoneurons are larger in diameter (19-50 m) than the
interneurons (10–18 m) (Boone and Aldes, 1984; Cooper, 1981; Takasu and Hashimoto,
1988). For mouse XII MNs it has been shown that there was approximately a 25%
decrease in major diameter at P1–P4 as compared with P14–P28 (Kanjhan et al., 2016a).
Adult interneurons have been described as fusiform or oval in shape with few primary
dendrites from both poles and from the center, while motoneurons were multipolar in
shape (Boone and Aldes, 1984; Takasu and Hashimoto, 1988). However, this has not
been as well established for neonatal XII neurons (Kanjhan et al., 2016a; Nunez-Abades
et al., 1994; Nunez-Abades and Cameron, 1995). Therefore, our main criteria for
determining a motoneuron was that from P1 to P7 the size needed to be at least 18 m
and at least 20 m at P10 to P21. The shape (oval, fusiform, multipolar) of the neuron as
previously described was used as a secondary criterion as needed (Boone and Aldes,
1984; Cooper, 1981; Fukunishi et al., 1999; Kanjhan et al., 2016a; Nunez-Abades et al.,
1994; Nunez-Abades and Cameron, 1995; Takasu and Hashimoto, 1988).
Data Analysis
General Analysis and Comparisons
For all neurons at each postnatal age, individual Sholl profile measurements were
averaged and plotted with their standard deviation (Std). Cumulative distributions of

32
selected parameters were plotted to examine the distribution shape of that parameter for
each age of interest. Box plots with median and quartiles were also graphed for ready
comparison. The Shapiro-Wilk test for normality (Ghasemi and Zahediasl, 2012; Le
Boedec, 2016) and Q-Q plots were used to determine if the data were normally
distributed. Hartigan’s dip test (Hartigan and Hartigan, 1985) was used to assess
unimodality of the data (diptest package in R; https://cran.r-project.org/web/packages/
diptest/index). For normality and unimodality, statistically significant differences were
set at the p<0.01 level. Non-parametric one-way analysis using the Kruskal-Wallis test
was performed on morphological measures and non-parametric pairwise post-hoc testing
using Dunn’s test for multiple comparisons (PMCMR package in R; https://cran.r-
project.org/web/packages/PMCMR/) with statistical significance set at the p<0.05 level
(García et al., 2010). For the non-parametric comparison, a difference at p<0.05 level
was considered sufficient, but to conclude that data was not normally or unimodally
distributed (key assumptions for statistics) a p<0.01 level was chosen.
Distribution Analysis
For cases in which the data was not unimodal, finite mixture distribution models
were employed to fit the data to more than a single distribution (Everitt, 1996; Forbes et
al., 2011). For morphometric parameters that were non-normally distributed, distribution
analysis (fitdistrplus package in R; https://cran.r-project.org/web/packages/fitdistrplus
/index.html) was used to determine whether a single distribution provided a good-fit
(Delignette-Muller and Dutang, 2015). Non-normally distributed data was examined
using Q-Q plots for different distributions such as log-normal or gamma as well as

33
Cullen-Frey (skewness/kurtosis) plots which also show data relative to normal, log-
normal, and gamma distributions. Goodness of fit measures for several distributions were
generated for the data to determine quantitatively which type of distribution best fit the
data. For cases in which a single distribution fit was not found, finite mixture distribution
models (mixdist package in R; https://cran.r-project.org/web/packages/mixdist/
index.html) were employed to fit the data to more than a single distribution. The
distribution model was chosen on goodness-of-fit and the consistency of the model to fit
across several parameters and age ranges. All statistical analyses were performed using R
(https://www.r-project.org/).
Results
The mean body weights of animals for each postnatal age are shown in Figure 4.
Rat pup body weight increased relatively linearly with postnatal age. The coefficients of
variation (CV; inset Figure 4) for the different ages were ≤ 17%. We measured 460
neurons in 56 pups (Table 1 and Table 2). Topographical maps of the measured XII
neurons created for P1, P3, and P5 neurons (Figure 5A), P7, P10, and P12 (Figure 5B),
and P13, P17, and P21 (Figures 5C) for both the medial-lateral (coronal) and rostral-
caudal (sagittal) orientations showed that selected XII neurons for each postnatal day
were essentially uniformly distributed in the medial, lateral, dorsal, ventral, rostral, and
caudal extent of the XII nucleus. Photomicrographs of P3, P12, and P21 XII MNs (Figure
6) illustrated dendritic spines (Figure 6A, 6B, and 6C), which were observed at all ages.
Dendrites extending across the midline were also observed at P3 (Figure 6A) and all
other ages. Dendrites extending beyond the border of the XII nucleus were observed at
P21, (Figure 6D) as well as the other ages. Additionally, while some XII MNs exhibited

34
near symmetry in dendritic branching across the primary branches, in general the
dendritic branching for XII MN were asymmetrical across primary branches (Figure 6).
Soma Size, but Not Shape Changes with Age
Figure 7 shows representative examples of neuron somata for the nine postnatal
ages at the same magnification. The images for Figure 7 were selected based on their
quantitative values as compared with the corresponding mean and median values for that
parameter and postnatal age. Qualitative evaluation of XII MNs suggested a progressive
increase in the size of the perikarya, thickness of their proximal dendrites, and an increase
in primary dendrites. We also saw that some neurons appeared globular while others were
multipolar. Figure 8 shows the cumulative distributions of the size and shape for each of
the nine postnatal ages. There was a progressive rightward shift in size distribution of the
somata with increasing postnatal age, based on equivalent circular diameters, ECD
(Figures 6A) and their major diameter (Figure 8B). However, there was not much change
in distribution with shape based on the aspect ratio (Figures 8C) and a small rightward
shift in form factor (Figure 8D). The ECD (Figure 8A) and to a lesser extend the major
diameter (Figure 8B) seemed to show three groups with P1, P3, and P5 as one group, P7,
P10, and P12 as a second, and P13, P7, and P21 as the third group. The aspect ratio
(Figure 8C) showed very little if any change while the form factor showed some change
(Figure 8D). Some cumulative distributions such as the ECD at P21 (Figure 8A)
demonstrated a shape in the distribution that does not appear to represent a normal
distribution.

35
Figure 4. Mean () and standard deviation (in blue) of animal body weight at each postnatal
age with a gray line connecting the mean values. Weight data for each individual animal is
shown as a circle (), but some values do overlap. A complete listing of the number of
animals by age and litter is provided in Table 1. The coefficient of variance and the number
of animals at each postnatal day (age) is provided in the inset.

36
Figure 5. Maps of the location of measured neurons in the dorsal-ventral, medial-lateral,
and rostral-caudal directions for a) P1, P3, & P5; b) P7, P10, & P12; and c) P13, P17, &
P21. The number of data points for each chart is given in Table 2 and the hypoglossal region
is shown as the dashed region. The coronal maps on the left show the medial-lateral and
dorsal-ventral directions while the sagittal maps on the right show the dorsal-ventral and
rostral-caudal directions. For the coronal maps the scale bars apply, but for the sagittal maps
the rostral-caudal direction is a normalized value of lambda given by the horizontal axis
where 1 approximately indicates the obex.

37
Figure 6. Photomicrographs of XII MNs: a) a P3 neuron illustrating dendrites crossing
the midline (vertical dashed line) and dendritic spines (arrows), b) a P12 neuron
demonstrating spines (arrows), c) a P21 neuron exhibiting spines (arrows), and d) a P21
neuron showing dendrites extending beyond the border of the XII nucleus (dashed arc).

38
Figure 7. Representative threshold images of various XII MN soma and their respective
values for ECD, major diameter, aspect ratio, and form factor. The ECD and major
diameter (MajDia) provide information on size while the aspect ratio (AR) and form factor
(FF) provide information on the shape of the soma. Images were chosen based on the
quantitative values (means & medians) for the morphometrics. Legend: P1 – ECD = 18.47
m, MajDia = 21.34 m, AR = 1.336, FF = 0.695; P3 – ECD = 20.28 m, MajDia = 29.40
m, AR = 2.102, FF = 0.502; P5 – ECD = 22.55 m, MajDia = 25.60 m, AR = 1.289, FF
= 0.543; P7 – ECD =28.87 m, MajDia = 33.10 m, AR = 1.315, FF = 0.582; P10 – ECD
= 40.06 m, MajDia = 68.44 m, AR = 2.918, FF = 0.510; P12 – ECD = 48.37 m, MajDia
= 80.82 m, AR = 2.792, FF = 0.524; P13 – ECD =44.96 m, MajDia = 54.12 m, AR =
1.449, FF = 0.358; P17 – ECD = 54.53 m, MajDia = 56.37 m, AR = 1.069, FF = 0.413;
P21 – ECD = 55.56 m, MajDia = 67.14 m, AR = 1.460, FF = 0.494. The 20 m scale
bar for all images is shown at bottom of figure under the P17 XII MN.

39
Figure 8. Cumulative distributions of the soma morphology showing the a) equivalent
circular diameter, b) major diameter, c) aspect ratio, and d) form factor. The y-axis shows
the cumulative fraction such that 0.2 is 20%, 0.6 is 60%, and 1 is 100%. Results from the
Shapiro-Wilks test for normality are in Table 3 and all distributions were found to be
unimodal as determined by Hartigan’s dip test.
40
The mean and median for the soma of the XII MNs increased in size with
increasing age (Figures 9A and 9B) but did not significantly change in shape (Figures 9C
and 9D). The soma size increases linearly, leveling off around P17–P21 (Figures 9A and
9B). The ECD for the P12–P21 ages was significantly larger from those of the P1–P5
neurons by approximately 40% (Figure 9A). There was also a statistically significant
(p<0.05) difference between the ECD of P13–P21 neurons and the P10 neurons with the
P13–P21 neurons having approximately a 15% increase in ECD (Figure 9A). The major
diameter of the neurons from rats at P12–P21 were statistically significantly (p<0.05)
larger than those from rats at P1–P5 by about the same percent as with ECD (Figure 8B).
The aspect ratio (Figure 9C) was not significantly different across any age. However, the
form factor (Figure 9D) was significantly lower at P7 and P10 compared with neurons at
P1 with a decrease of about 16% and P13 was significantly lower (18%) than P1, P3, or
P5.
Soma Morphology is Unimodal, but not Necessarily Normally
Distributed
The Shapiro-Wilk test for normality (Table 3) showed that at specific days (P1,
P5, P12, and P17) the size distribution was significantly (p<0.01) different from a normal
distribution. Although the aspect ratio was significantly different from normal, it is a ratio
of two numbers (quotient of two distributed variates) which may result in a non-normal
distribution (Marsaglia, 2006). Hartigan’s dip test for unimodality suggest that all soma
morphometric parameters were not significantly (p>0.25) different from a unimodal
distribution. Although all the morphometric parameters were found to be unimodal,

41
parameters at one or more postnatal ages were found to be non-normally distributed
(Table 3). Therefore, distribution fitting and finite mixture modeling was used to
characterize the data distribution. To improve the model fit our data was pooled into three
groups 1) P1–P5, 2) P7–P12, and 3) P13–P21 based on no statistically significant
differences within each of the three age groups. Summary statistics (Table 4) for these
three groups demonstrate the increase in soma size (ECD and Major Diameter) while
very little change, if any in shape (Aspect Ratio and Form Factor). There was a 21%
increase in ECD from P1–P5 to P7–P12 and a 19% increase from P7–P12 to P13–P21.
No statistically significant difference was seen for aspect ratio between any of the age
groups. Although the form factor was significantly different between age groups, there
was a 14% increase from P1–P5 to P13–P21. Testing for normality and unimodality the
ECD showed non-normality (Table 3) for two of the three groups, although unimodality
was demonstrated for all three. For all three groups a mixture of two normal distributions
was found to be a good-fit for the data (Tables 5–7, Figure 10). The two distributions
demonstrated changes in mean values and the proportion of each distribution (Figure 10).
Figure 10A shows the grouped cumulative distributions for ECD with their
corresponding normal distributions. Fitting the ECD to the sum of two weighted normal
distributions showed that both normal distributions changed at each stage (Figure 10B–D
and Tables 5–7). The small right-skew at P1–P5 seems to be a result of the second
normal distribution (Figure 10B) with an increasing tail at P7–P12 (Figure 10C) and
P13–P21 (Figure 10D). Since we saw no significant differences in aspect ratio across
these groups, all of the ages were pooled for the mixture model in which two normal
distributions (distribution 1: proportion = 0.844, mean = 1.62, std = 0.524, and

42
distribution 2: proportion = 0.156, mean = 2.70, std = 0.87; Chi-Square (χ2) = 0.391, p =
0.822) were found to fit the data. After subdividing the XII MNs based on their
anatomical location into dorsal-ventral and lateral-medial quadrants for comparison of
topographical differences, we found only the aspect ratio and form factors were
statistically (p < 0.05) different for ages P1–P5. The aspect ratio for the dorsal-lateral
region was approximately 36.5% higher than the dorsal-medial region. Although the form
factor was significantly different, form factor for the dorsal-medial region was 0.6 while
the dorsal-lateral region was 0.5. No statistically significant topographical differences
were found for ECD or major diameter for P1–P5 group or for any parameter in the P7–
P12 or P13–P21 groups. The rostral-caudal extent of XII was divided into thirds (rostral,
middle, or caudal). At P1–P5 the ECD for the caudal region was 16% higher than for the
rostral region and at P13–P21 the aspect ratio for the caudal region was about 17% higher
than for the rostral region. Again, no differences were found for any other parameter
along the rostral-caudal axis for any of the three groups.
Extent and Complexity of the Dendritic Tree Increases with Age
The P3 XII MNs had shorter dendrites with fewer branches than P10 or P12
neurons (Figure 3). The average Sholl profiles (Figure 11) demonstrated changes in
dendrite morphology as changes in shape and size of the profile. At P3, 28.8% of neurons
had dendrites with longer radii of intersection (distance from soma >150 m) while about
10% had dendrites with intersections extending to ≥ 200 m from the soma. In contrast,
at P5 and P7 about 22% of the neurons extended to ≥ 200 m from the soma. At P10 and
P12 the Sholl profiles showed 5% to 10% of neurons having dendrites with intersections

43
300 to 400 m from the soma, while at P13, 23.5% of neurons had intersections out 300
to 500 m from the soma. For P17 and P21, 27.3% and 35.5% of the neurons,
respectively, extended 300 to 500 m from the soma. Figure 12 shows representative
images of dendrite morphology from MNs (upper panels) and their morphometric values
(lower panels) at P3, P10, and P21. The size and complexity of the dendritic tree is
reflected by various morphometric parameters, such as the maximum number of
intersections, the radius at which the maximum number of intersections occur, and the
enclosing radius. Although some XII MNs may seem near symmetrical in the
arrangement of the dendritic trees extending from the soma (Figure 12, P3 and P21), the
total dendritic length and branching of the primary branches extending from the soma
was observed to be asymmetrical for most of the neurons (Figure 12, P10 and P21).
Figure 13 shows the cumulative distributions for the maximum number of
intersections (A), the radius at which the maximum number of intersections occur (B),
ramification index (C), and enclosing radii (D). The maximum number of intersections
(Figure 13A) and the enclosing radius (Figure 13D) demonstrated a separation between
the ages with three stages defined as (1) P1, P3, and P5; (2) P7, P10, and P12; and (3)
P13, P17, and P21. The radius at which the maximum number of intersections occur
(Figure 11B) and the ramification index (Figure 13C) did not show a statistical difference
between the ages. For the maximum number of intersections, radius at which the
maximum number of intersections occurred, ramification index, and enclosing radius
(Figure 13D) there were grouping of age ranges seen in the distributions as was seen for
ECD and major diameter (Figure 8).
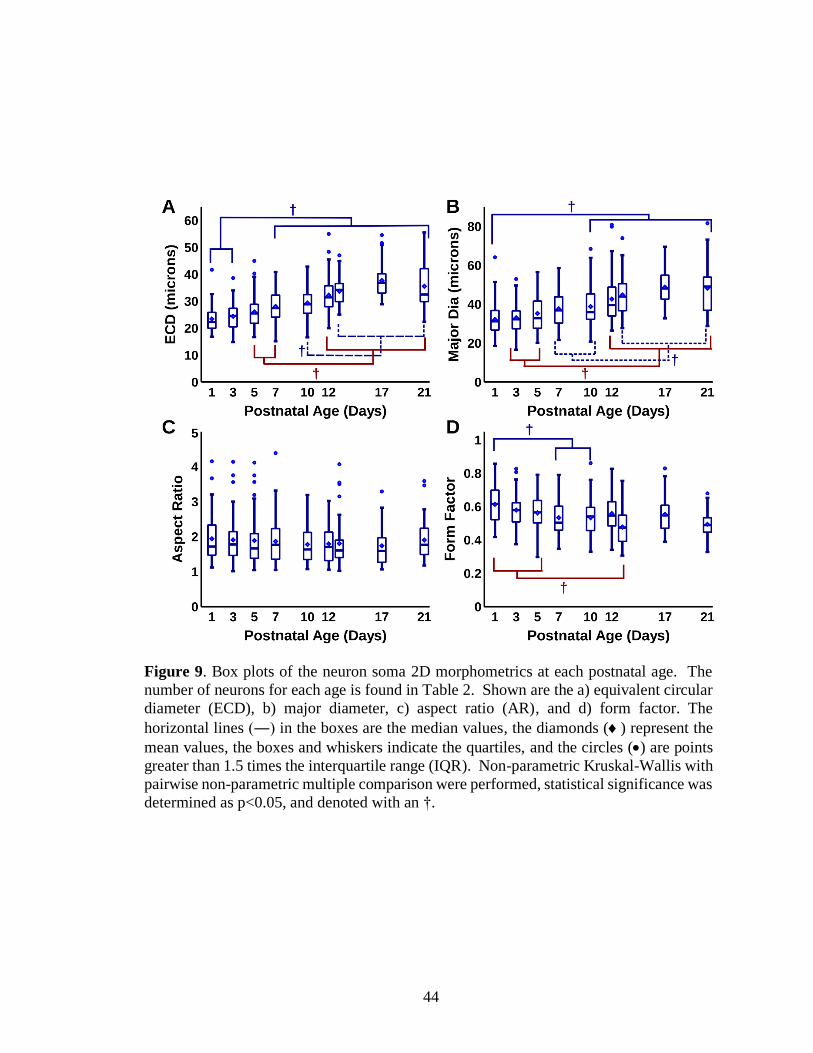
44
Figure 9. Box plots of the neuron soma 2D morphometrics at each postnatal age. The
number of neurons for each age is found in Table 2. Shown are the a) equivalent circular
diameter (ECD), b) major diameter, c) aspect ratio (AR), and d) form factor. The
horizontal lines (―) in the boxes are the median values, the diamonds () represent the
mean values, the boxes and whiskers indicate the quartiles, and the circles (•) are points
greater than 1.5 times the interquartile range (IQR). Non-parametric Kruskal-Wallis with
pairwise non-parametric multiple comparison were performed, statistical significance was
determined as p<0.05, and denoted with an †.

45
Table 3. Shapiro-Wilk normality test results for soma morphology. Shown for each
parameter and age are the W-statistic and the corresponding p-value. The three bottom
rows are for the three groups. Cells in bold are significantly different at the p < 0.01
level.
Age
(days)
ECD (m) Major Dia (m) Aspect Ratio Form Factor
W p-value W p-value W p-value W p-value
P1 0.906 0.001 0.923 0.004 0.892 <0.001 0.964 0.145
P3 0.980 0.455 0.971 0.183 0.883 <0.001 0.980 0.438
P5 0.911 0.002 0.941 0.019 0.859 <0.001 0.991 0.966
P7 0.983 0.554 0.973 0.200 0.909 <0.001 0.943 0.006
P10 0.986 0.686 0.966 0.079 0.916 <0.001 0.974 0.202
P12 0.944 0.010 0.896 <0.001 0.916 <0.001 0.985 0.669
P13 0.980 0.528 0.956 0.055 0.799 <0.001 0.972 0.262
P17 0.926 0.007 0.980 0.647 0.918 0.004 0.948 0.047
P21 0.941 0.089 0.940 0.081 0.899 0.007 0.973 0.593
P1–P5 0.948 <0.001 0.958 <0.001 0.881 <0.001 0.992 0.544
P7–P12 0.980 0.010 0.950 <0.001 0.922 <0.001 0.977 0.007
P13–P21 0.959 0.001 0.969 0.005 0.873 <0.001 0.975 0.019

46
Table 4. Soma morphology summary statistics (mean ± std) for the three age
groups.
Parameter P1–P5 P7–P12 P13–P21
Area (m3) 497 ± 230 729 ± 314 1028 ± 406
Perimeter (m) 102 ± 25 129 ± 30 159 ± 35
Major Diameter (m) 33.5 ± 8.9 39.6 ± 10.4 47.0 ±10.7
Minor Diameter (m) 18.5 ± 4.9 23.0 ± 5.8 27.5 ± 7.0
ECD (m) 24.6 ± 5.3 29.8 ± 6.2 35.6 ± 6.7
Aspect Ratio 1.91 ± 0.69 1.81 ± 0.58 1.80 ± 0.60
Form Factor 0.58 ± 0.11 0.54 ± 0.10 0.51 ± 0.10

47
Table 5. Results of fitting two normal distributions to various parameters for P1–P5 (P1,
P3, & P5). Shown are the proportion (prop) or weight for that distribution, the mean, the
SD, and the p-value for the mixture distribution model.
Parameters Normal Distribution 1 Normal Distribution 2 Chi-
Square
p-value prop mean std prop mean std
ECD (m) 0.971 24.28 4.59 0.029 43.74 8.26 3.77 0.152
Maj Dia (m) 0.705 29.60 5.52 0.295 43.18 8.05 2.05 0.842
FF N/A 0.59 0.11 N/A N/A N/A N/A 0.544
Max Int 0.417 4.17 1.13 0.583 7.49 2.03 2.77 0.837
Max Int R (m) 0.412 20.47 7.23 0.588 43.01 15.19 0.42 0.812
Ram Index 0.768 1.19 0.41 0.232 2.33 0.80 0.72 0.697
Encl Rad (m) 0.822 108.50 32.16 0.178 227.60 67.46 16.31 0.130

48
Table 6. Results of fitting two normal distributions to various parameters for P7–P12 (P7,
P10, & P12). Shown are the proportion (prop) or weight for that distribution, the mean,
the SD, and the p-value for the mixture distribution model.
Parameters Normal Distribution 1 Normal Distribution 2 Chi-
Square p-value prop mean std prop mean std
ECD (m) 0.819 28.40 4.73 0.181 37.27 6.20 0.78 0.855
Maj Dia (m) 0.293 32.94 4.33 0.707 41.33 10.38 3.65 0.456
FF 0.626 0.49 0.07 0.374 0.63 0.09 14.05 0.900
Max Int 0.822 7.64 2.18 0.178 13.08 2.63 1.20 0.752
Max Int R (m) 0.545 35.24 17.68 0.455 66.01 33.12 3.19 0.867
Ram Index 0.754 1.45 0.48 0.246 2.44 0.80 11.44 0.324
Encl Rad (m) 0.899 177.60 51.45 0.101 328.30 95.13 19.93 0.462

49
Table 7. Results of fitting two normal distributions to various parameters for P13–P21
(P13, P17, & P21). Shown are the proportion (prop) or weight for that distribution, the
mean, the SD, and the p-value for the mixture distribution model.
Parameters Normal Distribution 1 Normal Distribution 2 Chi-
Square
p-value prop mean std prop mean std
ECD (m) 0.776 33.27 4.75 0.224 43.97 6.28 1.67 0.643
Maj Dia (m) 0.108 35.17 0.84 0.892 47.87 9.97 14.10 0.723
FF 0.791 0.47 0.09 0.204 0.62 0.11 5.14 0.526
Max Int 0.785 9.59 2.77 0.215 15.15 4.38 19.01 0.165
Max Int R (m) 0.898 63.05 25.95 0.102 128.07 52.70 13.21 0.432
Ram Index 0.723 1.77 0.50 0.277 3.00 0.85 10.80 0.701
Encl Rad (m) 0.363 185.10 35.19 0.637 282.60 103.23 6.97 0.324

50
Figure 10. Pooled distributions for the ECD showing the finite mixture distribution
models. a) Cumulative and corresponding normal distributions for ECD at P1-P5 (P1, P3,
& P5), P7-P12 (P7, P10, & P12), and P13-P21 (P13, P17, & P21). b-d) Histograms for the
ECD and mixture distribution models showing the two normal distributions for b) P1-P5,
c) P7-P12, and d) P13-P21. The parameters for the two normal distributions are given in
Tables 5, 6, and 7.

51
Figure 11. Sholl profiles for the nine postnatal ages. Each data point is the mean value
with the error bars representing the standard error. The number of neurons for each graph
is shown in Table 2, however the number of neurons per data point may decrease with
increasing distance due to some neurons having a shorter enclosing radius as compared to
other neurons. For some profiles (P3, P10, and P12) the variance at the larger distances are
due to only a few neurons having dendrites extending to that distance.
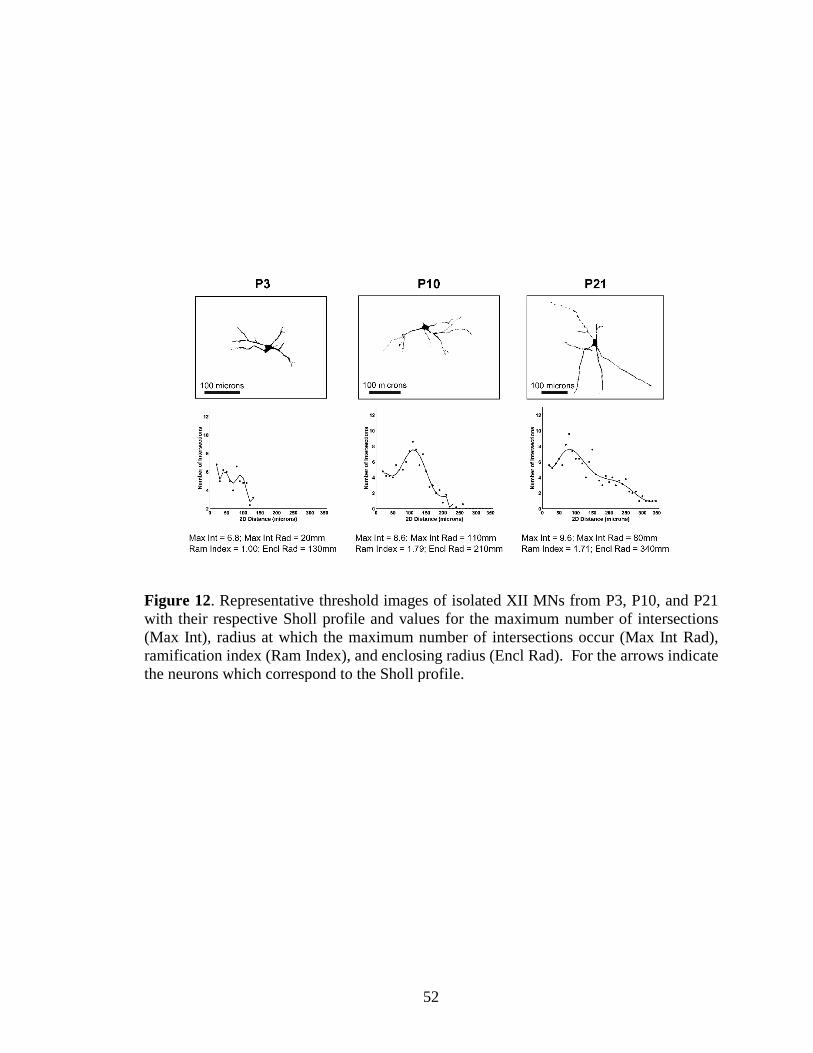
52
Figure 12. Representative threshold images of isolated XII MNs from P3, P10, and P21
with their respective Sholl profile and values for the maximum number of intersections
(Max Int), radius at which the maximum number of intersections occur (Max Int Rad),
ramification index (Ram Index), and enclosing radius (Encl Rad). For the arrows indicate
the neurons which correspond to the Sholl profile.

53
Figure 13. Cumulative distributions for A) maximum number of intersections, B) radius
at which maximum number of intersections occurred, C) ramification index, and D)
enclosing radius at the nine postnatal ages (P1, P3, P5, P7, P10, P12, P13, P17, and P21).
The y-axis shows the cumulative fraction such that 0.2 is 20%, 0.6 is 60%, and 1 is 100%.
Results from the Shapiro-Wilks test for normality are in Table 8 and the results of the
Hartigan’s dip test for unimodality are shown in Table 9.

54
The maximum number of intersections (number of dendrites intersecting a
concentric circle) at P10–P21 were significantly higher than P1–P5 (Figure 14A) by 50%
to 90%. Similarly, the maximum intersection radius (radial distance from soma at which
the maximum number of intersections occur) was age-dependent with a 30% or greater
increase at P10–P21 (Figure 12B). The maximum intersection radius at P13, P17, and
P21 were also significantly higher by about 40% or greater than P7 (Figure 14B). For the
ramification index P13 and P17 were significantly higher by approximately 40% than
P1–P7 (Figure 14C) which again may indicate that the increase in maximum number of
intersections for P7–P12 may be mainly due to the increase in the number of primary
branches, but not at P13 and P17 (Figures 14A and 14C). We did observe an increase in
the number of primary branches from P1 to P21 with a statistically significant 25% to
50% increase for P7–P17 compared with P1. However, the number of primary branches
increased gradually leveling off from P13–P21. For the enclosing radius P7–P21 were
significantly increased by 50% or more from P1 and P3 while P13 through P21 were
significantly increased by 40% compared with P7 and P10 (Figure 14D). The majority of
the parameters showed significant increases starting between P10 and P13 and a few
cases at P7. In the ventral-lateral region the enclosing radius for the P1-P5 group was
found to be significantly (p<0.05) lower from the other three by approximately 29%, but
there were no differences found for the other age groups. The ramification index for the
dorsal-lateral region was significantly higher (approximately 33%) when compared with
the ventral-medial region for the P13–P21 group. In the rostral-caudal direction
ramification index for the P7–P12 group was significantly lower by 21.2% in the caudal

55
region as compared with the rostral region. No other differences were found for any
parameter or age related to topographical location.
Dendrite Morphology: Normality and Unimodality
The Shapiro-Wilk test showed significant (p<0.01) deviation from normality for
the P1, P10, and P12 groups for maximum number of intersections while the radius at
which the maximum number of intersections occurred was significantly different from
the normal distribution at P1 through P13 (Table 8). The ramification index was
significantly different from a normal distribution for all ages (Table 8). For the enclosing
radius at P1, P3, P5, P12, P13 and P17 the data is significantly different from a normal
distribution, but not at P7, P10, or P21. Applying the Hartigan’s dip test for unimodality
to the radius at which the maximum number of intersections occurred revealed a
distribution that was significantly different from a unimodal distribution at P1–P12, but
not at P13, P17, or P21 (Table 9). For all ages, the other three morphometric parameters
were not significantly different from a unimodal distribution (Table 9). In summary,
depending on the specific parameter of interest, XII MN dendrite morphology at some
postnatal ages exhibited a non-normal distribution while at other ages they were normally
distributed.
Figures 15A and 15B show examples of the cumulative distributions for data
which were normally/non-normally distributed (Figure 15A) or were unimodally/non-
unimodally (bimodal or multimodal) distributed (Figure 15B). Curve fitting the data for
the maximum number of intersections for P10 yielded a log-normal distribution (Figure
15C, dashed line) which seems to follow the same form as the data, or a mixture
distribution model of two normal distributions (Figure 15C, solid line) both

56
demonstrating a good fit to the data. For the maximum number of intersections radius for
P10 a mixture distribution of two normal distributions (Figure 15D) was found to fit the
data best. To provide sufficient numbers for fitting finite mixture distribution model the
data was again pooled into three groups (P1–P5, P7–P12, and P13–P21). Summary
statistics (Table 10) for the three groups showed an increase in number of primary
branches from P1–P5 to P7–P12 with no significant change between P7–P12 and P13–
P21. However, the maximum number of intersections significantly increased from P1–P5
to P7–P12 and from P7–P12 to P13–P21. Testing for normality and unimodality for the
dendritic morphology of the pooled data showed that most of the data was non-normally
distributed (Table 8), but most were unimodally distributed except for the radius of the
maximum number of intersections and enclosing radius (Table 11). Figure 14A shows the
cumulative distributions of the maximum intersection radii for the three groups with their
corresponding normal distribution and demonstrates the non-normality of the data. Fitting
the maximum intersection radius to the sum of two weighted normal distributions showed
that at P1–P5 two distributions of comparable weights (Figure 16B and Tables 5–7) with
shifts in both distributions at P7–P12 (Figure 14C) and one dominant distribution at P13–
P21 (Figure 16D). Figure 15 illustrates three sets of images in which two different
neurons in proximity of each other have very different Sholl profiles. In some sections
two neurons can be found which represent near minimum and maximum value (Figure
17). Again, while a few XII MNs might exhibit some symmetry in total dendritic length
and branching of primary branches extending from the soma (Figure 17, P3 left side of
image), most XII MNs demonstrated asymmetrical total dendritic length and branching.
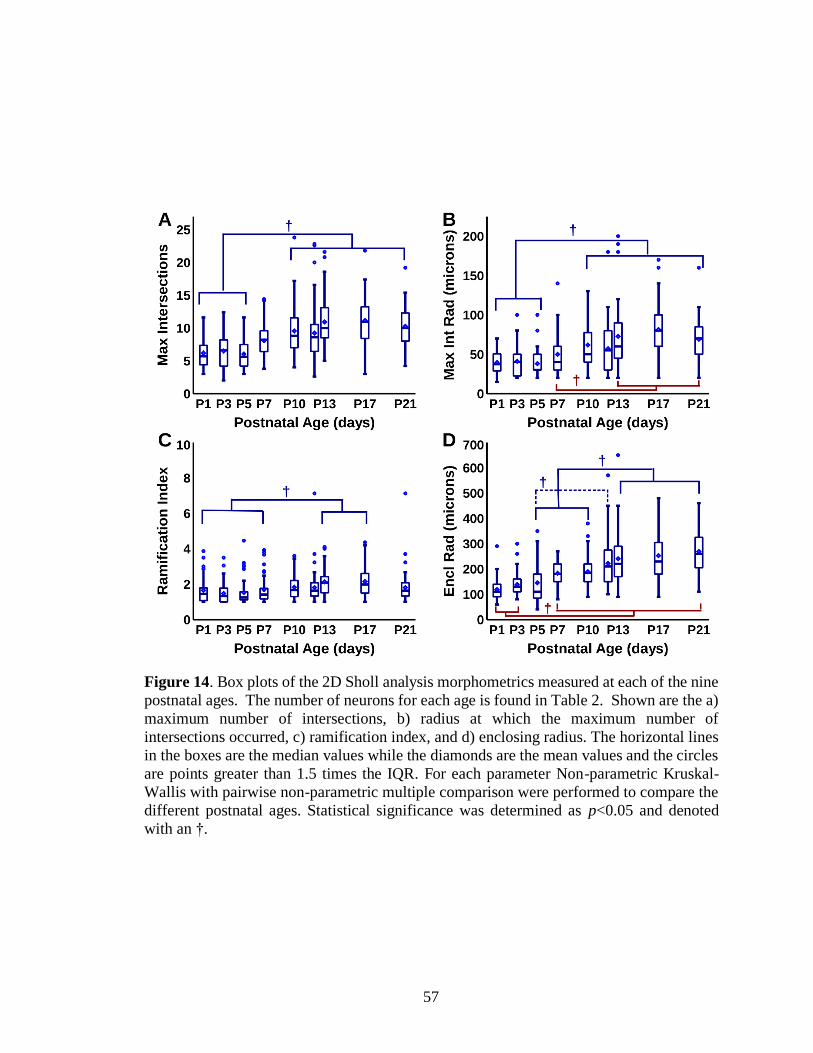
57
Figure 14. Box plots of the 2D Sholl analysis morphometrics measured at each of the nine
postnatal ages. The number of neurons for each age is found in Table 2. Shown are the a)
maximum number of intersections, b) radius at which the maximum number of
intersections occurred, c) ramification index, and d) enclosing radius. The horizontal lines
in the boxes are the median values while the diamonds are the mean values and the circles
are points greater than 1.5 times the IQR. For each parameter Non-parametric Kruskal-
Wallis with pairwise non-parametric multiple comparison were performed to compare the
different postnatal ages. Statistical significance was determined as p<0.05 and denoted
with an †.

58
Table 8. Shapiro-Wilk normality test results for dendrite morphology. Shown for each
parameter and age are the W-statistic and the corresponding p-value. The three bottom
rows are for the three groups. Cells in bold are significantly different at the p < 0.01
level.
Age
(days)
Max
Intersections
Max Intersect
Rad
Ramification
Index
Enclosing
Radius
W p-value W p-value W p-value W p-value
P1 0.928 0.006 0.904 0.001 0.829 <0.001 0.868 <0.001
P3 0.975 0.266 0.890 <0.001 0.829 <0.001 0.908 <0.001
P5 0.952 0.049 0.847 <0.001 0.706 <0.001 0.846 <0.001
P7 0.974 0.219 0.848 <0.001 0.793 <0.001 0.975 0.253
P10 0.924 0.001 0.902 <0.001 0.926 0.001 0.962 0.054
P12 0.892 <0.001 0.896 <0.001 0.669 <0.001 0.901 <0.001
P13 0.943 0.016 0.884 <0.001 0.917 0.002 0.888 <0.001
P17 0.960 0.125 0.954 0.076 0.912 0.003 0.924 0.007
P21 0.976 0.701 0.936 0.065 0.902 0.008 0.965 0.384
P1–P5 0.966 0.001 0.901 <0.001 0.788 <0.001 0.862 <0.001
P7–P12 0.913 <0.001 0.906 <0.001 0.798 <0.001 0.903 <0.001
P13–P21 0.962 0.001 0.922 <0.001 0.925 <0.001 0.936 <0.001
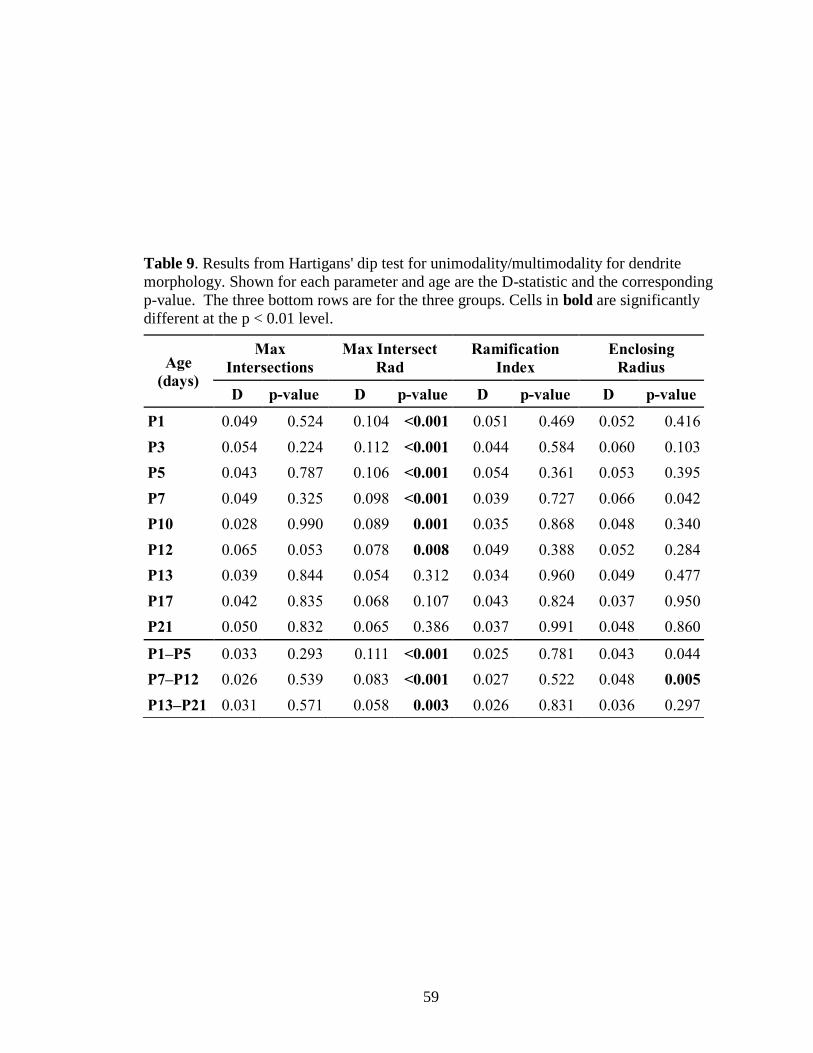
59
Table 9. Results from Hartigans' dip test for unimodality/multimodality for dendrite
morphology. Shown for each parameter and age are the D-statistic and the corresponding
p-value. The three bottom rows are for the three groups. Cells in bold are significantly
different at the p < 0.01 level.
Age
(days)
Max
Intersections
Max Intersect
Rad
Ramification
Index
Enclosing
Radius
D p-value D p-value D p-value D p-value
P1 0.049 0.524 0.104 <0.001 0.051 0.469 0.052 0.416
P3 0.054 0.224 0.112 <0.001 0.044 0.584 0.060 0.103
P5 0.043 0.787 0.106 <0.001 0.054 0.361 0.053 0.395
P7 0.049 0.325 0.098 <0.001 0.039 0.727 0.066 0.042
P10 0.028 0.990 0.089 0.001 0.035 0.868 0.048 0.340
P12 0.065 0.053 0.078 0.008 0.049 0.388 0.052 0.284
P13 0.039 0.844 0.054 0.312 0.034 0.960 0.049 0.477
P17 0.042 0.835 0.068 0.107 0.043 0.824 0.037 0.950
P21 0.050 0.832 0.065 0.386 0.037 0.991 0.048 0.860
P1–P5 0.033 0.293 0.111 <0.001 0.025 0.781 0.043 0.044
P7–P12 0.026 0.539 0.083 <0.001 0.027 0.522 0.048 0.005
P13–P21 0.031 0.571 0.058 0.003 0.026 0.831 0.036 0.297

60
Figure 15. Distributions showing normal unimodal, non-normal unimodal, and non-
normal non-unimodal data. a) Cumulative distributions of the maximum number of
intersections with the P21 data demonstrating a normal unimodal distribution as compared
to the normal line while the P10 data exhibits a unimodal, but not a normal distribution
illustrated by the distance of the points from the normal line. b) Cumulative distributions
of the maximum intersections radius with the P21 data showing a normal and unimodal
distribution as compared to the line while the P10 data demonstrates a bimodal or
multimodal distribution as exhibited by the distance and pattern of the points to the
reference normal line. c) Histogram of the maximum number of intersections with a log-
normal distribution (log-mean=2.19, log-SD=0.37, p-value=0.6783) and finite mixture
model (normal distribution-1: weight=0.806, mean=8.28, SD=2.55; distribution-2:
weight=0.1941, mean=14.26.22, SD=4.40; Chi-sq=17.305, p-value=0.3010). d) Histogram
of the maximum number of intersections radius with the two normal distributions and the
finite mixture distribution model (normal distribution-1: weight=0.697, mean=41.85,
SD=8.47; distribution-2: weight=0.303, mean=97.22, SD=19.69; Chi-sq=0.333, p-
value=0.5636).

61
Table 10. Dendrite morphology summary statistics (mean ± std) for the three age groups.
Parameter P1–P5 P7–P12 P13–P21
Number of Primary Branches 4.38 ± 1.72 5.37 ± 1.88 5.33 ± 1.42
Max Number of Intersections 6.26 ± 2.31 8.94 ± 3.60 10.84 ± 3.78
Radius at Max Intersections (m) 39.7 ± 17.6 56.2 ± 26.4 74.84 ± 34.7
Ramification index 1.54 ± 0.65 1.77 ± 0.77 2.13 ± 0.81
Enclosing Radius (m) 134.6 ± 60.7 197.7 ± 71.8 251.9 ±95.3

62
Figure 16. Pooled distributions for the maximum intersection radius showing the finite
mixture distribution models. a) Cumulative and corresponding normal distributions for
maximum intersection radius at P1–P5 (P1, P3, & P5), P7–P12 (P7, P10, & P12), and P13–
P21 (P13, P17, & P21). b-d) Histograms for the maximum intersection radius and mixture
distribution models showing the two normal distributions for b) P1–P5, c) P7–P12, and d)
P13–P21. The parameters for the two normal distributions are given in Tables 5, 6. and 7.

63
Figure 17. Threshold images of P1, P10, and P12 sections which have two isolated
hypoglossal neurons with different morphologies, yet the centers of any two soma were
with 50 to 200 microns in distance from each other. The micrograph of the XII MNs are
shown with the Sholl profiles for the two neurons and arrows pointing to the respective
neuron for each profile.
64
Discussion
In this study we found that the morphology of developing hypoglossal
motoneurons appears to be more complex than indicated by previous studies and age
dependent. For each of the three time windows the morphology seemed best represented
by a mixture of two normal distributions suggesting that there are at least two
distinguishable phenotypes of XII MNs during the first three weeks post-birth. Our data
also suggests that significant differences in morphometry of XII MNs can begin as early
as P7, but most of the largest changes seem to occur at P10–P13 providing morphometric
support for a “sensitive period.” Statistical analyses of the morphological properties of
460 XII MNs across nine postnatal ages revealed three discrete developmental windows:
1) P1–P5; 2) P7–P12; and 3) P13–P21 and suggest that morphological changes proceeded
significant functional changes (Liu et al., 2006, 2009; Wong-Riley et al., 2013; Wong-
Riley and Liu, 2005). The finding of three discrete development windows supports our
hypothesis in that there is a transition period (P7–P12) between the early (P1–P5) and the
late (P13–P21) developmental periods. However, our results suggest that this transitional
period may start sometime between P7 and P10. Although we did examine P7, we did not
examine morphology at P8 or P9, so it is uncertain exactly when the transition window
begins. These findings uniquely provide morphological evidence supporting
developmental windows that may have functional significance for critical periods of
respiratory development in infants and represent the most comprehensive assessment of
XII MN developmental changes in morphology yet undertaken (Carrascal et al., 2005;
Kanjhan et al., 2016a; Liu et al., 2006; Nunez-Abades and Cameron, 1995; Wong-Riley
et al., 2013).

65
Our findings extend research by other investigators who have studied the
morphology of a small number of XII MNs after intracellular neurobiotin filling
(Kanjhan et al., 2016a; Nunez-Abades et al., 1994; Nunez-Abades and Cameron, 1995).
These previous studies only filled one or two neurons for each 300 m thick specimen, so
sampling per animal was limited and the morphology of neighboring XII MNs was not
measured. Because we sampled more neurons per animal, we have a more representative
neuronal population for detailed morphological description at each postnatal day. Our
statistical approach to XII MN morphology represents the most comprehensive
quantitative assessment of developmental morphology in rat XII MNs yet undertaken.
We report for the first time, age-dependent distributions of our morphometric variables,
that allow us to determine whether the data are normally and unimodally distributed
which are critical assumptions in statistical analyses. Our results suggest that not all
neurons increase in size and complexity at the same time, but that some neurons change
earlier with neighboring neurons changing later possibly indicating a more complex
developmental model.
Biometric data support our findings that analyzed XII MNs came from healthy rat
pups since the mean body weights are comparable to previous reports from healthy
Sprague-Dawley rats (Dotta and Mortola, 1992; Sant’Anna and Mortola, 2002, 2003) at
all development stages. Therefore, litter size was not a confounding factor. Comparing
differences between animals at each postnatal age we did not see any indications for
stratification of any parameters between the sexes. Adult motoneuron soma are large
(>19 m), multipolar and the predominant type in the hypoglossal nucleus (XII), but
there are also smaller interneurons (10–18 m) which are round-to-oval in shape (Boone

66
and Aldes, 1984; Cooper, 1981; McClung and Goldberg, 1999). Another study reported
interneurons in the XII as fusiform or ovoid in shape with a major diameter of 17.3 ± 2.5
m with a few primary dendrites from the center and both poles (Takasu and Hashimoto,
1988). Interneurons have previously been reported as distributed toward the lateral one-
fourth and ventral margin of the XII (Takasu and Hashimoto, 1988). In neonatal mice the
XII MNs are smaller for the first 8 postnatal days, yet since postnatal days 9–13 were
group and averaged we do not know if these smaller XII MNs persist later than 8 days
(Kanjhan et al., 2016). Therefore, a threshold size of 18 m is the main criteria we used
to define XII MNs, while shape and number of primary branches severed as secondary
criteria. We found XII MNs representing two different shapes (Type I and II) as
previously described in adult cats (Fukunishi et al., 1999). It has been suggested that the
Type II XII MN dendrites in the cat are confined to the nucleus while the Type I have
dendrites that are extranuclear (external) suggesting that Type I neurons receive inputs in
addition to those that terminate within the XII suggesting a functional difference
(Fukunishi et al., 1999). Our data suggests that these Type I and Type II XII MNs are
present in rats during the first three weeks post-birth. However, due the enclosing radii
being only 100 to 150 m, our results suggest these two neuronal types are present early,
but the extranuclear extension of the Type I dendrites probably occur later (>P7).
Postnatal Changes in Soma Morphology with Age
The soma size of XII MNs increased progressively over the first three postnatal
weeks, approaching adult size (>19 m) by P21, consistent with recently reported data in
mice (Kanjhan et al., 2016a) with little change in shape as indicated by aspect ratio and

67
form factor. In rats and mice, pups are weaned at P21 and begin sexual maturation
(adolescence in humans) leading to adulthood (Dutta and Sengupta, 2016; Sengupta,
2013). Although previous studies have not tested their data for normality (normal
distribution), we found that normality depends on the age and specific parameter
investigated. Hartigan’s dip test for a unimodal distribution (single mode; not bimodal or
multimodal) revealed that parameters for soma size and shape at each age were unimodal,
but the Shapiro-Wilk test for normality support that specific parameters at specific ages
were not normally distributed (Ghasemi and Zahediasl, 2012; Hartigan and Hartigan,
1985; Le Boedec, 2016). Our findings provided criteria for pooling the somata (by size)
into three groups that represented different stages in soma morphology based on non-
parametric comparisons and visual inspection of cumulative distributions. These groups
were pooled into (1) P1, P3, and P5; (2) P7, P10, and P12; and (3) P13, P17, and P21.
Interestingly, neuron location did not explain the separation of the soma size into two
distributions since there was no significant (p<0.05) difference between the locations for
either ECD or major diameter. The finite mixture distribution models suggest two sub-
groups of neurons with one sub-group representing a smaller percentage of the total
number of neurons yet causing a right skew in the overall distribution. Because the
proportions (percentage of the total data represented by each distribution) of the two
distributions are not constant across the three age groups, the mixed distributions
appeared to best characterize size shift—more neurons with larger soma—with increasing
age. One possible explanation for this second distribution is that these neurons may be
growing faster, earlier and the loss of this sub-group could relate to a delay or reduced

68
rate of development as has been suggested for perinatal nicotine exposure (Powell et al.,
2016).
Postnatal Changes in Dendrite Morphology
Dendrite morphology showed statistically significant age-dependent changes in
both size and complexity. The size and complexity of the dendritic tree arbor relates
functionally to the synaptic connectivity (Ferrante et al., 2013; Nunez-Abades et al.,
1994; Kanjhan et al., 2016). The premotor neuron connections can be either excitatory or
inhibitory while connections by interneurons in the nucleus are excitatory (Kanjhan et al.,
2016). Little is known about the functional significance of the symmetry or asymmetry of
dendritic arbors, but the asymmetry reported in this study has been previously reported
for XII MNs in rats and mice (Nunez-Abades et al., 1994; Kanjhan et al., 2016). We
found that both the enclosing radius and radius at the maximum number of intersections -
increased with age, indicating increasing dendritic tree arborization with increasing age.
The maximum number of intersections rose during P1–P5 and during P7–P12 without
affecting the ramification index (maximum number of intersections/number of primary
branches). Still, at P7–P12, both parameters (maximum number of intersections and
number of primary branches) were higher than observed at P1–P5. At these two
developmental windows, the increase in the maximum number of intersections revealed
by Sholl analysis is best explained by an increase in the number of primary branches. In
contrast, at P13–P21, the increased maximum number of intersections and ramification
index (compared to P1–P5) cannot be explained by increased primary branching. Instead,
our results suggest an increased maximum intersection number at P13–P21 when
compared to P1–P5. This was mainly due to an increase in the number of primary

69
branches, while for P13–P21, the increase in maximum number of intersections was
mainly due to increased branching distal to the primary dendrites. Therefore, our data
show that size and complexity of the dendritic tree increased with age, but the change in
complexity at P7–P12 was due to different processes (increased primary branching) than
observed at P13–P21 (increased distal branching). The enclosing radius in the ventral-
lateral region of the XII was significantly lower (29%) than the three regions in the P1–
P5 group.
Dendritic spines were observed on most XII MNs across all ages as previously
reported for rats (Nunez-Abades et al., 1994) and mice (Kanjhan et al., 2016). Filopodia
appeared more prominent at the earlier ages (P1–P7), decreasing with older neurons
consistent with previous reports (Kanjhan et al., 2016b; Nunez-Abades et al., 1994).
Dendritic spine morphology and density will be evaluated in a follow-up study. For all
ages we also observed XII MNs with dendrites crossing the midline into the contralateral
XII and neurons with dendrites extending outside the XII nucleus as has been previously
reported (Kanjhan et al., 2016a; Koizumi et al., 2008; Nunez-Abades et al., 1994). We
also observed that most of the dendrites of a neuron differed in their length and branching
across the different primary branches as has been previously described by others (Nunez-
Abades et al., 1994).
Hypoglossal Motoneuron Morphology: Normality, Unimodality, and
Distribution
Since the “sensitive period” represents a transitional time, any change in the
distribution of parameters between age groups—such as differences in the mean, the type

70
of distribution, or a characteristic of the distribution (normal, unimodal, skewness,
etc.…)—may be reflected in functional changes. In this study we utilized tests for
normality and unimodality to determine key characteristics relating to the morphology
data we obtained from the XII MNs we analyzed. The Shapiro-Wilk test for normality
(Ghasemi and Zahediasl, 2012; Le Boedec, 2016) showed that some of the parameters at
specific ages or age ranges were not normally distributed. When a data set is non-
normally distributed, it is possible that it is also not unimodal. Despite statistical
significance, changes in the characteristics of the distribution (normality and
unimodality) may indicate differences between groups. Regardless of age or
morphometric parameter, the morphology is unimodally distributed at all ages except for
the maximum intersection radius for ages P1–P12. However, when the age groups were
pooled, the maximum intersection radius was not unimodal for all three age ranges while
for the enclosing radius the P7–P12 was not unimodal. The non-normal distribution of
different parameters justified our use of the Kruskal-Wallis test and the Dunn test (García
et al., 2010). The ratio of two normally distributed variables can result in a non-normal
distribution (Marsaglia, 2006) which provides the simplest explanation for why the aspect
ratio and ramification index are not normally distributed for most ages.
From testing three single distribution models (normal, log-normal, and gamma) as
well as a finite mixture model (two normal distributions) we found that the finite mixture
model was more consistent across the three age groups for most parameters. The only
exception appeared to be the form factor for P1–P5 which tested for normality and a
single normal distribution was the better fit, however for P7–P12 and P13–P21 the finite
mixture model was the better fit. Some parameters such as the maximum number of

71
intersections for P10 neurons fit a log-normal distribution as well (or better) than the
mixed model of two normal distributions. However, other parameters such as the radius
of the maximum number of intersections did not fit a log-normal distribution yet fit the
mixed model. Overall, for the non-normally distributed data, the mixture model of two
normal distributions appeared to be the best and most consistent fit for the data. This may
not represent different types of neurons since the mean, standard deviations, and
proportions are all changing, essentially continuously, with age. Topographical location
could be the explanation, but there were no topological differences found for the
maximum intersection radius. It may be that not all XII MNs are changing at the same
rate with some somata and dendrites growing at earlier while other neurons are changing
later. This was observed for most ages in that a given neuron had larger, more complex
dendritic tree while another nearby neuron could have a smaller, less complex dendritic
tree.
Another implication of these mixture distributions is that the development of XII
MNs may not be a simple uniform change in morphology, but a more complex sequence
of intermediate, punctuated changes. Although little is known or understood about what
influences dendrite growth, previous work has suggested that axonal connectivity and
other factors can affect dendrite length (Cowan et al., 1984; Easter et al., 1985; Fogarty et
al., 2016, 2016; Guadiana et al., 2013; Purves and Lichtman, 1980). Other investigators
have proposed mathematical and computational models for neuron and dendritic growth,
but they have not examined nonuniform or staggered growth in neighboring neurons
(Marks and Burke, 2007a, 2007b; Zubler and Douglas, 2009). Therefore, dendritic
growth during early postnatal development may not be linear as previously suggested by

72
others (Nunez-Abades et al., 1994; Nunez-Abades and Cameron, 1995) or uniform across
neighboring XII MNs.
Comparison with Previous Studies
There are discrepancies in the existing literature regarding the age-related changes
in soma and dendrite growth. Our study found progressive increases in soma size while
dendrites increased in both size and complexity with increasing age, and we identified
three distinct age groups for most morphometric parameters. Kanjhan and colleagues
(2016) found changes in dendrite morphology and dendritic spine distribution in XII
MNs from embryonic age E18 through postnatal age P28 in mice. Although there are
morphological changes in somatic and dendritic morphology across age, most
electrophysiological changes in motoneurons have been attributed to changes or
differences in the type, subfamily, and distribution of ion channels (Carrascal et al.,
2005). Somata size increases during embryonic and early postnatal life in mice (Kanjhan
et al., 2016a), although it has been suggested that soma size reaches typical adult sizes by
birth in cat and rat (Cameron et al., 1991; Nunez-Abades et al., 1994; Nunez-Abades and
Cameron, 1995). However, Kanjhan and colleagues (2016a) measured a 70% increase in
soma volume from E17–P0 to P14–P28 while the studies in cat and rat only measured
soma area by elliptical approximations. Our study agrees with Kanjhan and coworkers
(2016a) in that we found that the equivalent circular diameter of the soma increased 40%
from P1–P5 to P13–P21. One possible reason for the previous studies (Nunez-Abades
and Cameron, 1995) not finding a difference in somata their small sample sizes (typically
N=10 neurons per age group) that limited the power of this study. In contrast, the study
on mice (Kanjhan et al., 2016) had an average of about 20 neurons per age group and our

73
study had an average of approximately 150 neurons for each of the three age groups. For
each of the nine postnatal ages we had 30 to 60 neurons for each age providing sufficient
statistical power.
For mice the total dendrite length increased by approximately 26% from P1–P4 to
P9–P13 (Kanjhan et al., 2016a) and in rats the maximum dendrite length increased by
about 36% from P1–P2 to P19–P30 (Nunez-Abades et al., 1994). Our study found that
the enclosing radius increased about 89% from P1–P5 to P13–P21. The mean dendrite
length in the other two studies was around 300m, but the mean enclosing radius in our
study was approximately 135 m for P1–P5. The other two studies (Kanjhan et al.,
2016a; Nunez-Abades et al., 1994) used ionophoretic injections of neurobiotin while our
study employed Golgi-Cox staining resulting in the measurement of more neurons per
animal as well as allowing multiple neighboring neurons to be measured in the same
sections.
We also found that non-parametric comparisons supported no significant
differences allowing pooling of the data into three age ranges (P1–P5, P7–P12, and P13–
P21). One previous study in mice (Kanjhan et al., 2016a) grouped data into five groups
(E17–P0, P1–P4, P5–P8, P9–P13, and P14–P28) while another study in rats (Nunez-
Abades et al., 1994; Nunez-Abades and Cameron, 1995) used four groups (P1–P2, P5–
P6, P13–P15, and P19–P30). Our data suggests that grouping ages between P1 and P6
and P13–15 is appropriate but grouping P5–P8 or P9–P13 may result in missing
important morphological differences that we have noted in our analysis. Previous studies
(Kanjhan et al., 2016a; Nunez-Abades et al., 1994; Nunez-Abades and Cameron, 1995)

74
have not been focused on the functional impact of changes in XII MN morphology from
the perspective of respiratory physiology.
Impact of XII Morphology on Respiratory Function
In addition to respiration, the tongue and upper airways play critical roles in
speech, an important aspect of motor control that motivates our study of XII MN
development (Kanjhan et al., 2016a; Nunez-Abades et al., 1994; Nunez-Abades and
Cameron, 1995). In spite of the breathing phenotype changes previously reported for days
10 to 13 (Liu et al., 2006, 2009; Wong-Riley et al., 2013; Wong-Riley and Liu, 2005)),
there has been no comprehensive longitudinal investigation into the morphology of
developing XII MNs prior to this study. The developmental pattern in respiratory
regulation and control has been investigated (Liu et al., 2006, 2009) demonstrating the
afore-mentioned sensitive period between P10 and P13 days post-birth where the hypoxic
ventilatory response is altered. Wong-Riley and Liu (2005) have also found a shift in
excitatory and inhibitory neurotransmitter expression during the P10–P13 sensitive
period at P12.
Neurotransmitters such as glutamate, GABA, glycine and catecholamines have
been shown to change during development with pronounced shifts in expression during
the sensitive period (Brust et al., 2014; Wong-Riley and Liu, 2005). Therefore, it is
suggested that the sensitive period represents a transition period between the early
postnatal ages (>P0) and the later ages (>P13) in which the animal is vulnerable to any
event that could interfere with development. A recent study of postnatal exposure to
lipopolysaccharide (LPS) in rats demonstrated that there was a heightened vulnerability
to endotoxin exposure at P10, characterized by a depressed ventilatory response to acute

75
hypoxia when compared with P5 and P20 (Rourke et al., 2016). This study also
demonstrated increased inflammation and mortality in LPS-treated rats at P10 when
compared with P5 and P20. This is one of the first studies to demonstrate that the
sensitive period from P10 through P13 represents not only a window of time in which
abrupt changes occur, but a vulnerable window in which heightened susceptibility to
infection can occur. Another recent study of perinatal nicotine exposure showed
morphological changes in XII MNs for P0–P4 but did not extend to P10–P13 (Powell et
al., 2016). Thus, there are very few, if any studies that have examined respiratory or
related phenomena for perinatal nicotine exposure or maternal inflammation during P10–
P13. In our study dendrite morphologies showed increases in morphometric parameters
from P1–P5 to P13–P21 with the P7–P12 representing a transition period between the
early and later developmental stages. Now that we have established a detailed pattern of
morphological development differences in XII MNs due to perinatal nicotine exposure or
maternal inflammation could be elucidated.
Limitations and Future Directions
In this study we have shown that soma and dendrite morphology changes with
postnatal age; however, changes in 3D morphometric parameters such as dendrite length,
branching, and dendritic spines, were not examined. Therefore, based on the complexity
of changes in the parameters with age seen in this study it may be of benefit to examine
the 3D morphometric parameters and changes in synaptic spines to correlate morphology
and function in the XII. Using a larger number of animals to yield sufficient numbers of
neurons (N > 60) at specific individual ages to test the models would provide more
extensive data regarding the distributions and changes between individual ages for

76
specific morphometric parameters. Three-dimensional reconstruction with modeling of
the biophysical properties based on the 3D geometries in concert with
electrophysiological measurements would provide a foundation for understanding the
relationships between structure and function at the neuron level. An additional limitation
is we are unable to address the targets of the XII MNs, because when cutting brain slices
the cranial rootlets were cut proximal to the brainstem—making it impossible for us to
address the number of motor units targeted by each XII MN. Future experiments
therefore need to be performed in which the innervation of the tongue is retained and the
connection from brainstem to tongue would allow us to assess which motoneurons
innervate a given motor unit in the tongue, however, this is beyond the scope of the
present study. Additionally, understanding the pattern of synaptic inputs to XII MNs
would further our understanding of the role of developmental changes in respiratory
control circuit. Despite these limitations, the detailed overview of developmental changes
in XII MNs that we present in this study provides a foundation for future developmental
morphology work in the XII nucleus.
Summary and Conclusions
We have shown that the soma size of XII MNs increases with postnatal age, but
there is little, if any change in shape of the somata. In contrast, the dendritic arbor of XII
MNs increases in size and complexity as postnatal age increases with increased
branching, a larger maximum radius, and an increase in the radius at which the maximum
number of intersections occurs. Three “stages” of development were identified for the
morphology of XII MNs in this study with P1–P5, P7–P12, and P13–P21 being
morphologically distinct. The functional sensitive period previously described is reflected

77
morphologically in the maturation of XII MNs especially for the maximum number of
intersections and enclosing radius. Finally, our observations suggest that the development
of XII MNs is more complex than previously described and further investigation
correlating structure with function is needed. These findings and the detailed description
of XII MN development in the first stages post-birth provides a better understanding of
crucial windows during the development of respiratory control circuitry.
Acknowledgements
Imaging was performed in the LLUSM Advanced Imaging and Microscopy Core
with support from National Science Foundation grant MRI-DBI 0923559 and Loma
Linda University School of Medicine. The authors thank Johnny Figueroa, PhD for
assistance and use of the Keyence microscope.

78
Literature Cited
Boone, T.B., Aldes, L.D., 1984. The ultrastructure of two distinct neuron populations in
the hypoglossal nucleus of the rat. Exp Brain Res 54, 321–6.
Brust, R.D., Corcoran, A.E., Richerson, G.B., Nattie, E., Dymecki, S.M., 2014.
Functional and developmental identification of a molecular subtype of brain
serotonergic neuron specialized to regulate breathing dynamics. Cell Rep. 9,
2152–2165.
Cameron, W.E., He, F., Kalipatnapu, P., Jodkowski, J.S., Guthrie, R.D., 1991.
Morphometric analysis of phrenic motoneurons in the cat during postnatal
development. J Comp Neurol 314, 763–76.
Carrascal, L., Nieto-Gonzalez, J.L., Cameron, W.E., Torres, B., Nunez-Abades, P.A.,
2005. Changes during the postnatal development in physiological and anatomical
characteristics of rat motoneurons studied in vitro. Brain Res Brain Res Rev 49,
377–87.
Cooper, M.H., 1981. Neurons of the hypoglossal nucleus of the rat. Otolaryngol Head
Neck Surg 89, 10–5.
Cowan, W.M., Fawcett, J.W., O’Leary, D.D., Stanfield, B.B., 1984. Regressive events in
neurogenesis. Science 225, 1258–65.
Das, G., Reuhl, K., Zhou, R., 2013. The Golgi-Cox method. Methods Mol Biol 1018,
313–21.
Delignette-Muller, M.L., Dutang, C., 2015. fitdistrplus: An R Package for Fitting
Distributions. J. Stat. Softw. Vol 1 Issue 4 2015 1.
Dotta, A., Mortola, J.P., 1992. Postnatal development of the denervated lung in normoxia,
hypoxia, or hyperoxia. J Appl Physiol 1985 73, 1461–6.
Dutta, S., Sengupta, P., 2016. Men and mice: Relating their ages. Life Sci 152, 244–8.
Easter, S.S., Jr., Purves, D., Rakic, P., Spitzer, N.C., 1985. The changing view of neural
specificity. Science 230, 507–11.
Erickson, J.T., Shafer, G., Rossetti, M.D., Wilson, C.G., Deneris, E.S., 2007. Arrest of
5HT neuron differentiation delays respiratory maturation and impairs neonatal
homeostatic responses to environmental challenges. Respir. Physiol. Neurobiol.
159, 85–101.
Everitt, B.S., 1996. An introduction to finite mixture distributions. Stat Methods Med Res
5, 107–27.
Feldman, J.L., Del Negro, C.A., 2006. Looking for inspiration: new perspectives on

79
respiratory rhythm. Nat. Rev. Neurosci. 7, 232–242.
Feldman, J.L., Del Negro, C.A., Gray, P.A., 2013. Understanding the rhythm of
breathing: so near, yet so far. Annu. Rev. Physiol. 75, 423–452. Ferrante, M.,
Migliore, M., Ascoli, G.A., 2013. Functional impact of dendritic branch-point
morphology. J Neurosci 33, 2156–65.
Ferrante, M., Migliore, M., & Ascoli, G. A., 2013. Functional impact of dendritic branch-
point morphology. J Neurosci, 33(5), 2156-2165.
doi:10.1523/JNEUROSCI.3495-12.2013
Ferreira, T.A., Blackman, A.V., Oyrer, J., Jayabal, S., Chung, A.J., Watt, A.J., Sjostrom,
P.J., van Meyel, D.J., 2014. Neuronal morphometry directly from bitmap images.
Nat Meth 11, 982–984.
Fietkiewicz, C., Loparo, K.A., Wilson, C.G., 2011. Drive latencies in hypoglossal
motoneurons indicate developmental change in the brainstem respiratory network.
J. Neural Eng. 8.
Fogarty, M.J., Kanjhan, R., Bellingham, M.C., Noakes, P.G., 2016. Glycinergic
Neurotransmission: A Potent Regulator of Embryonic Motor Neuron Dendritic
Morphology and Synaptic Plasticity. J Neurosci 36, 80–7.
Forbes, C., Evans, M., Hastings, N., Peacock, B., 2011. Stochastic Modeling, in:
Statistical Distributions. Hoboken, New Jersey, pp. 32–43.
Fukunishi, Y., Nagase, Y., Yoshida, A., Moritani, M., Honma, S., Hirose, Y., Shigenaga,
Y., 1999. Quantitative analysis of the dendritic architectures of cat hypoglossal
motoneurons stained intracellularly with horseradish peroxidase. J Comp Neurol
405, 345–58.
Fulton, B.P., Walton, K., 1986. Electrophysiological properties of neonatal rat
motoneurones studied in vitro. J Physiol 370, 651–78.
García, S., Fernández, A., Luengo, J., Herrera, F., 2010. Advanced nonparametric tests
for multiple comparisons in the design of experiments in computational
intelligence and data mining: Experimental analysis of power. Inf. Sci. 180, 2044–
2064.
Ghasemi, A., Zahediasl, S., 2012. Normality tests for statistical analysis: a guide for non-
statisticians. Int J Endocrinol Metab 10, 486–9.
Gibb, R., Kolb, B., 1998. A method for vibratome sectioning of Golgi-Cox stained whole
rat brain. J Neurosci Methods 79, 1–4.
Guadiana, S.M., Semple-Rowland, S., Daroszewski, D., Madorsky, I., Breunig, J.J.,
Mykytyn, K., Sarkisian, M.R., 2013. Arborization of dendrites by developing
neocortical neurons is dependent on primary cilia and type 3 adenylyl cyclase. J

80
Neurosci 33, 2626–38.
Harper, R.M., Kinney, H.C., 2010. Potential Mechanisms of Failure in the Sudden Infant
Death Syndrome. Curr. Pediatr. Rev. 6, 39–47.
Hartigan, J.A., Hartigan, P.M., 1985. The Dip Test of Unimodality. Ann. Stat. 13, 70–84.
Kanjhan, R., Fogarty, M.J., Noakes, P.G., Bellingham, M.C., 2016a. Developmental
changes in the morphology of mouse hypoglossal motor neurons. Brain Struct.
Funct. 221, 3755–3786.
Kanjhan, R., Noakes, P.G., Bellingham, M.C., 2016b. Emerging Roles of Filopodia and
Dendritic Spines in Motoneuron Plasticity during Development and Disease.
Neural Plast. Volume 2016, Article ID 3423267, 31 pages.
Khazipov, R., Zaynutdinova, D., Ogievetsky, E., Valeeva, G., Mitrukhina, O., Manent, J.-
B., Represa, A., 2015. Atlas of the Postnatal Rat Brain in Stereotaxic Coordinates.
Front. Neuroanat. 9.
Kinney, H.C., 2009. Brainstem mechanisms underlying the sudden infant death
syndrome: evidence from human pathologic studies. Dev Psychobiol 51, 223–33.
Koizumi, H., Wilson, C.G., Wong, S., Yamanishi, T., Koshiya, N., Smith, J.C., 2008.
Functional Imaging, Spatial Reconstruction, and Biophysical Analysis of a
Respiratory Motor Circuit Isolated In Vitro. J. Neurosci. 28, 2353–2365.
Komendantov, A.O., Ascoli, G.A., 2009. Dendritic excitability and neuronal morphology
as determinants of synaptic efficacy. J Neurophysiol 101, 1847–66.
Le Boedec, K., 2016. Sensitivity and specificity of normality tests and consequences on
reference interval accuracy at small sample size: a computer-simulation study. Vet
Clin Pathol 45, 648–656.
Lindsey, B.G., Rybak, I.A., Smith, J.C., 2012. Computational models and emergent
properties of respiratory neural networks. Compr Physiol 2, 1619–70.
Liu, Q., Fehring, C., Lowry, T.F., Wong-Riley, M.T., 2009. Postnatal development of
metabolic rate during normoxia and acute hypoxia in rats: implication for a
sensitive period. J Appl Physiol 106, 1212–22.
Liu, Q., Lowry, T.F., Wong-Riley, M.T.T., 2006. Postnatal changes in ventilation during
normoxia and acute hypoxia in the rat: implication for a sensitive period. J
Physiol 577, 957–70.
Liu, Q., Wong-Riley, M.T., 2003. Postnatal changes in cytochrome oxidase expressions in
brain stem nuclei of rats: implications for sensitive periods. J Appl Physiol 95,
2285–91.

81
Liu, Q., Wong-Riley, M.T.T., 2006. Developmental changes in the expression of GABAA
receptor subunits alpha1, alpha2, and alpha3 in brain stem nuclei of rats. Brain
Res 1098, 129–38.
Liu, Q., Wong-Riley, M.T.T., 2002. Postnatal expression of neurotransmitters, receptors,
and cytochrome oxidase in the rat pre-Botzinger complex. J. Appl. Physiol. 92,
923–934.
Liu, Y.-Y., Wong-Riley, M.T.T., 2001. Developmental study of cytochrome oxidase
activity in the brain stem respiratory nuclei of postnatal rats. J. Appl. Physiol. 90,
685–694.
Marks, W.B., Burke, R.E., 2007a. Simulation of motoneuron morphology in three
dimensions. I. Building individual dendritic trees. J Comp Neurol 503, 685–700.
Marks, W.B., Burke, R.E., 2007b. Simulation of motoneuron morphology in three
dimensions. II. Building complete neurons. J Comp Neurol 503, 701–16.
Marsaglia, G., 2006. Ratios of Normal Variables. J. Stat. Softw. 16, 10.
Martin, R.J., Wilson, C.G., 2009. What to do about apnea of prematurity? J Appl Physiol
107, 1015–6.
McClung, J.R., Goldberg, S.J., 1999. Organization of motoneurons in the dorsal
hypoglossal nucleus that innervate the retrusor muscles of the tongue in the rat.
Anat Rec 254, 222–30.
Mortola, J.P., 1984. Breathing pattern in newborns. J Appl Physiol Respir Env. Exerc
Physiol 56, 1533–40.
Nunez-Abades, P.A., Cameron, W.E., 1995. Morphology of developing rat genioglossal
motoneurons studied in vitro: relative changes in diameter and surface area of
somata and dendrites. J Comp Neurol 353, 129–42.
Nunez-Abades, P.A., He, F., Barrionuevo, G., Cameron, W.E., 1994. Morphology of
developing rat genioglossal motoneurons studied in vitro: changes in length,
branching pattern, and spatial distribution of dendrites. J Comp Neurol 339, 401–
20.
Nunez-Abades, P.A., Spielmann, J.M., Barrionuevo, G., Cameron, W.E., 1993. In vitro
electrophysiology of developing genioglossal motoneurons in the rat. J
Neurophysiol 70, 1401–11.
Powell, G.L., Gaddy, J., Xu, F., Fregosi, R.F., Levine, R.B., 2016. Developmental
Nicotine Exposure disrupts dendritic arborization patterns of hypoglossal
motoneurons in the neonatal rat. Dev Neurobiol.
Preibisch, S., Saalfeld, S., Tomancak, P., 2009. Globally optimal stitching of tiled 3D

82
microscopic image acquisitions. Bioinformatics 25, 1463–1465.
Purves, D., Lichtman, J., 1980. Elimination of synapses in the developing nervous
system. Science 210, 153–157.
Purvis, L.K., Butera, R.J., 2005. Ionic Current Model of a Hypoglossal Motoneuron. J.
Neurophysiol. 93, 723–733.
Rourke, K.S., Mayer, C.A., MacFarlane, P.M., 2016. A critical postnatal period of
heightened vulnerability to lipopolysaccharide. Respir Physiol Neurobiol 232, 26–
34.
Sant’Anna, G.M., Mortola, J.P., 2003. Thermal and respiratory control in young rats
exposed to cold during postnatal development. Comp Biochem Physiol Mol
Integr Physiol 134, 449–59.
Sant’Anna, G.M., Mortola, J.P., 2002. Thermal and respiratory control in young rats with
altered caloric intake during postnatal development. Respir Physiol Neurobiol
133, 215–27.
Sengupta, P., 2013. The Laboratory Rat: Relating Its Age With Human’s. Int J Prev Med
4, 624–30.
Sholl, D.A., 1950. A discussion on the measurement of growth and form; the theory of
differential growth analysis. Proc R Soc Lond B Biol Sci 137, 470–4.
Smith, J.C., Butera, R.J., Koshiya, N., Negro, C.D., Wilson, C.G., Johnson, S.M., 2000.
Respiratory rhythm generation in neonatal and adult mammals: the hybrid
pacemaker-network model. Respir. Physiol. 122, 131–147.
Smith, J.C., Ellenberger, H.H., Ballanyi, K., Richter, D.W., Feldman, J.L., 1991. Pre-
Bötzinger complex: a brainstem region that may generate respiratory rhythm in
mammals. Science 254, 726–729.
Standard Practice for Characterization of Particles (No. F 1877-98), 2003. ASTM.
Takasu, N., Hashimoto, P.H., 1988. Morphological identification of an interneuron in the
hypoglossal nucleus of the rat: a combined Golgi-electron microscopic study. J
Comp Neurol 271, 461–71.
Thoby-Brisson, M., Trinh, J.-B., Champgagnat, J., Fortin, G., 2005. Emergence of the
pre-Bötzinger respiratory rhythm generator in the mouse embryo. J. Neurosci. 25,
4307–4318.
Wong-Riley, M.T., Liu, Q., 2005. Neurochemical development of brain stem nuclei
involved in the control of respiration. Respir Physiol Neurobiol 149, 83–98.
Wong-Riley, M.T., Liu, Q., Gao, X.P., 2013. Peripheral-central chemoreceptor interaction

83
and the significance of a critical period in the development of respiratory control.
Respir Physiol Neurobiol 185, 156–69.
Zubler, F., Douglas, R., 2009. A Framework for Modeling the Growth and Development
of Neurons and Networks. Front. Comput. Neurosci. 3, 25.

84
CHAPTER THREE
MODELING HYPOGLOSSAL MOTONEURONS IN THE DEVELOPING RAT
Paul Allen Williams1,2, Clarissa Dalton3, Christopher G. Wilson1,2
1Division of Physiology, Basic Science Department
2Lawrence D. Longo, MD Center for Perinatal Biology,
Loma Linda University School of Medicine
11234 Anderson St, Loma Linda, California 92350
3California Polytechnic State University – San Luis Obispo
San Luis Obispo, California
Respiratory Physiology and Neurobiology, 2018, In review
(Modified version)

85
Abstract
At birth, the autonomic brainstem, which generates and controls respiratory
rhythm for normal breathing is not fully developed. Normal control of breathing develops
in the first few weeks after birth. However, little is known about changes in the
morphology and electrophysiological behavior of neurons in the respiratory regions of
the brainstem during this early developmental period. We hypothesize that developmental
changes in the morphology of motoneurons in the hypoglossal motor nucleus (XII) can
lead to changes in biophysical properties that alter motor output. To test this hypothesis,
we used Golgi-Cox staining to stain neurons in the brainstem and we quantified the
morphology of the somata and dendritic tree of developing hypoglossal XII motoneurons
(XII MNs) using Sholl analysis. We then used the computer simulation environment,
NEURON, to model the biophysical properties from the digitally reconstructed neurons.
At nine postnatal ages (P1, 3, 5, 7, 10, 12, 13, 17, and 21), we removed the brain from
Sprague-Dawley rat pups, processed the tissue, sectioned, stained, imaged, and
performed 3D reconstructions to quantify the morphometrics of XII MNs. We then used
these 3D reconstructed geometries to model the biophysical properties of the neurons.
The soma of XII MNs increases in size by approximately 50% from P1 to P21. The
dendritic trees extend further, and branching becomes more complex with most of the
statistically significant changes starting at P10 or P12 when compared to P1, P3, and P5.
Morphology correlated with the passive electrophysiological properties of XII MNs.
Although a direct relationship was not found between morphology and the active
properties, there was evidence of an indirect relationship in that the passive properties
correlated with the active properties.

86
Introduction
Respiration is critical during development and throughout life and occurs
rhythmically through an elaborate system of control. At birth, autonomic regions in the
brainstem, which generates and controls respiratory rhythm are not fully developed
(Feldman et al., 2013; Feldman and Del Negro, 2006; Feldman and Smith, 1995). Normal
control of breathing develops in the first few weeks after birth. The motoneurons (MNs)
of the hypoglossal nucleus (XII) and other brainstem nuclei provide the drive to the
tongue and upper airways and are used in in vitro models to provide an index of fictive
inspiratory effort (Feldman et al., 2013; Feldman and Del Negro, 2006). The critical role
that the tongue and upper airway control plays in speech is also an important aspect that
motivates the study of XII MN development. We have previously shown that there are
age-dependent changes in XII MN output drive, but the contribution of developmental
changes in neural morphology remains essentially unknown (Fietkiewicz et al., 2011).
Because the XII MNs are easy to identify and play an active role in inspiration during
development, they are a convenient and accessible population of neurons for
electrophysiological study. Also, since 80% or more of the neurons in the XII are
motoneurons that are readily distinguishable from the interneurons, the XII MNs are
convenient for morphological studies (Cooper, 1981; McClung and Goldberg, 1999).
Work by others have shown that development of the respiratory network plays a
key role in the changing of breathing pattern (Liu et al., 2006; Mortola, 1984).
Understanding the remodeling of the breathing neural network during early life is key to
elucidating the synergy between changes in morphology and breathing rhythm in the
perinatal period. It has been shown that neural network behavior is influenced by the
morphology of neurons, and that connectivity is altered due to changes in

87
neurotransmitter release as well as receptor up- and down-regulation (Ferrante et al.,
2013; Komendantov and Ascoli, 2009). Hypoglossal motoneurons (XII MNs) which
drive the tongue and upper airway musculature are used in in vitro models to provide an
index of fictive inspiratory function (Koizumi et al., 2008; Purvis and Butera, 2005;
Smith et al., 1991, 2000). Additionally, our laboratory has previously shown age-
dependent changes in the distribution of drive latencies in hypoglossal motoneuron
output (Fietkiewicz et al., 2011). There is a body of work on the morphology and
electrophysiology of motoneurons with some work on hypoglossal motoneurons and a
few studies on morphological changes during postnatal development (Carrascal et al.,
2005; Kanjhan et al., 2016; Lindsey et al., 2012; Nunez-Abades and Cameron, 1995).
Morphological differences in XII MNs have been shown between neonatal and adults as
well as corresponding electrophysiological changes (Berger et al., 1996; Carrascal et al.,
2005). It has also been demonstrated that the morphology and electrophysiology of
motoneurons differ for various regions in the central nervous system (Carrascal et al.,
2005). Although most electrophysiological changes in MNs have been attributed to
changes or differences in the type, subtype, and distributions of ion channels (Carrascal et
al., 2005), other studies have shown a relationship between morphology and membrane
properties that can influence electrophysiology (Nunez-Abades and Cameron, 1997). A
recent study of XII MNs in mice found changes in dendrite morphology and dendritic
spine distribution from embryonic age E18 through postnatal age P28 (Kanjhan et al.,
2016). In addition, a few studies have utilized single compartment models (soma) to
model various aspects of XII MN electrophysiology (Fietkiewicz et al., 2011; Purvis and
Butera, 2005). However, most studies (morphological or electrophysiological) have

88
examined only a single or small window of ages within the neonatal period, or group ages
in a somewhat arbitrary manner (Kanjhan et al., 2016; Nunez-Abades and Cameron,
1995).
Therefore, there is a need to understand both electrophysiological behavior and
morphology to assess the relationship between morphology and biophysical function in
XII MNs. In this study we modeled passive and active electrophysiological properties
based on actual morphological geometries of XII MNs. Our objective was to simulate
actual electrophysiology experiments on morphologically accurate XII MNs and compare
our simulation results with experimental results reported in the literature. Our hypothesis
was that morphological characteristics can influence simulated passive and active
electrophysiological behavior. We chose three ages ranging from the first, second, and
third weeks of development. We utilized established single-compartment models and
iterated the parameter values until experimental and computational results were
comparable. Then we examined correlations between the electrophysiology and neuron
morphology.
Material and Methods
Animals
Pregnant Sprague-Dawley dams (Charles River Laboratories International, Inc.,
Wilmington, MA) obtained approximately 18 days after the start of pregnancy (E18)
were allowed to deliver naturally in the Loma Linda University Animal Care Facility. Rat
pups at nine postnatal ages (P1, P3, P5, P7, P10, P12, P13, P17, and P21 days) were
initially used in the study. Typical litter size was approximately 9–14 pups and no
distinction were made between genders. When two litters were used the two litters were

89
balanced to maintain consistent litter size (number of pups per litter) if needed. All
procedures and protocols used in this study were approved by the Institutional Animal
Care and Use Committee at Loma Linda University and followed the guidelines by the
National Institutes of Health Guide for the Care and Use of Laboratory Animals
(http://www.ncbi.nlm.nih.gov/books /NBK54050).
Golgi-Cox Staining
On the appropriate developmental day, animals were weighed, euthanized, and
the brain extracted. For postnatal ages P1 through P7 the pups were anesthetized with
isoflurane (Western Medical Supply, Arcadia, CA) until unresponsive to toe pinch, then
their brains were rapidly extracted and placed in chilled 0.9% saline. For postnatal ages
P10 through P21, animals were placed in an induction chamber with oxygen (100%) flow
at 0.65 L/min and isoflurane administered at a concentration of 3 to 4% based on the
postnatal age. Once the animal was unresponsive to toe pinch it was removed from the
induction chamber, placed on a platform with the oxygen and isoflurane continuously
administered via a nose cone, and perfused with 0.9% saline for approximately two
minutes after which the brain was removed. For ages P1 through P7, the whole brain was
maintained intact while for P10 through P21 the brain was sectioned coronally into two
tissue blocks to maintain a more consistent tissue volume.
The brains were immediately transferred from 0.9% saline to impregnation
solution from a commercial kit (superGolgi Kit, Bioenno Tech, LLC, Santa Ana,
California). Sections impregnated at different time durations showed that the best results
were obtained with 7 days of impregnation at room temperature changing the solution

90
after the initial two days. Therefore, impregnation solution was changed after two days
then the specimens were left in the solution for five more days according to the supplier’s
instructions and previous reported methods with all steps performed at room temperature
(Das et al., 2013). After a total of 7 days in impregnation solutions the brains were placed
in two changes of post-impregnation buffer (changed each day for two days). We
performed coronal sectioning of tissue at 150 m with a vibratome (Vibratome Series
1000 Classic–Tissue Sectioning System, Leica, St. Louis, MO) mounting the sections
onto gelatin-coated slides and then allowed to dry slowly in a humidified chamber
overnight (Das et al., 2013; Gibb and Kolb, 1998). The slides were dried at room
temperature and humidity for approximately one hour and then rehydrated in phosphate
buffered saline, stained, placed in post-staining buffer, and then washed, dehydrated, and
cleared in xylene as per the supplier’s instructions and the literature (Das et al., 2013).
After staining, Permount (Fisher Scientific, SP-15, Waltham, MA) was applied to the
slides which were then cover-slipped and allowed to fully dry.
Imaging
The XII nucleus from each animal was identified by comparing brainstem
sections imaged using a 2x objective with atlases (Khazipov et al., 2015) corresponding
to the appropriate postnatal period. We used a 40x objective to acquire image stacks for
each XII MN with one image every 2 μm in the z-direction. For the P1–P7 animals a
single image stack was obtained using a microscope (Ziess Axio Imager, Carl Zeiss
Microscopy, LLC, Peabody, MA USA) with a motorized stage (Applied Scientific
Instrumentation, Eugene, OR) and imaging software (Stereologer, Stereology Resource

91
Center, Tampa FL). For the P10–P21 animals, we acquired either a single image stack or
several overlapping image stacks (multiple stacks). Multiple stacks were required for
many of the P10–P21 animals in order to image the entire dendritic morphology of a
single neuron at 40x, so we used another microscope (Keyence, BZ-9000, Itasca, IL) to
image these neurons.
Mapping of Neuron Locations
The position of each XII MN was measured with ImageJ to acquire the length and
angle of a line from the apex of the fourth ventricle (rostral) or center of the central canal
(caudal). These lengths and angles were converted to x (horizontal) and y (vertical)
distances with x representing the medial-lateral and y representing the dorsal-ventral
direction. These points were plotted relative to the anatomical reference point along with
the boundary of the XII nucleus determined in a similar manner, as previously described
(Kanjhan et al., 2016). For the rostral-caudal extent of XII, sections were matched with a
representative rat atlas for each postnatal age and the lambda coordinate along with the y
axis (dorsal-ventral direction) was used to plot location in the sagittal plane similar to that
previously described (Kanjhan et al., 2016; Khazipov et al., 2015). Due to size
differences between the postnatal ages, lambda was normalized by the lambda value at
the obex. Neurons located in the XII nucleus for both the coronal and sagittal maps were
included while any neurons outside the XII were excluded from analysis.

92
Selection of Motoneurons
The majority of neurons in the XII nucleus are MNs, yet there are a few
interneurons (Boone and Aldes, 1984; Cooper, 1981; Takasu and Hashimoto, 1988). Due
to the presence of these interneurons we needed criteria to determine if the measured
neuron was a motoneuron. In the adult rat motoneurons are larger in diameter (19-50 m)
than the interneurons (10–18 m) (Boone and Aldes, 1984; Cooper, 1981). For mouse
XII MNs, it has been shown that the P1–P4 had a major diameter which was 25% lower
than for the P14–P28 (Kanjhan et al., 2016). Therefore, our main criteria for determining
a MN was that from P1 to P7 the size needed to be at least 18 m with the size being at
least 20 m at P10 to P21. Adult interneurons have been described as fusiform or oval in
shape with few primary dendrites from both poles and from the center, while
motoneurons were multipolar in shape (Boone and Aldes, 1984; Takasu and Hashimoto,
1988). However, this has not been as well established for neonatal XII MNs (Kanjhan et
al., 2016; Nunez-Abades et al., 1994; Nunez-Abades and Cameron, 1995). Therefore, our
main criteria for determining a MN was that from P1 to P7 the size needed to be at least
18 m with the size being at least 20 m at P10 to P21. Neuronal shape (oval, fusiform,
multipolar) was then used as a secondary criterion (Boone and Aldes, 1984; Cooper,
1981; Fukunishi et al., 1999; Nunez-Abades et al., 1994; Nunez-Abades and Cameron,
1995; Takasu and Hashimoto, 1988).
3D Reconstructions
For the P1 through P7 animals, single image stacks were obtained, however for
the P10 through P21 animals, multiple stacks were stitched together using the ImageJ

93
stitching plug-in (Preibisch et al., 2009). We obtained at least 5–7 pups per age from
seven litters. Litter size ranged from 9 to 14 (average of about 12 pups per litter). A total
number of 30 or more MNs were obtained for each postnatal age. From the image stacks
3D reconstructions were obtained For P3, P10, and P17 XII MNs using a software
package (Neuromantic, Reading, UK) with volumes and surface areas measured (Myatt
et al., 2012). For P3, P10, and P17 XII MNs with volumes equaled to or approximating
the minimum, maximum, and average volume values for the soma or dendrites were
selected. This provided XII MNs for each of the three ages with ten from the P3 XII MNs
and six each from the P10 and P17 XII MNs resulting in a total of 22 neurons for
simulation. Minimum, maximum, and average volumes were used to allow for the largest
range of morphologies to accommodate the regression analysis. Although this decreased
statistical power for comparison tests, a larger variance was more consistent for our
objective and hypothesis which were focused on the regression analysis.
Simulations
Selected neurons were imported into the program NEURON and simulations run using
the soma diameter of the neuron along with the actual dendritic tree morphology. A
simplified model of one previously published was utilized with the following channels
ionic currents: fast-sodium (INa), persistent sodium (INaP), fast-transient potassium (IA),
potassium (IK), hyperpolarization-activated current (Ih), and potassium leakage (Ileak)
(Engel et al., 1999; Fietkiewicz et al., 2011; Purvis and Butera, 2005). The Hodgkin-
Huxley formation for the membrane potential is given by the equation

94
𝐶𝑚𝑑𝑉
𝑑𝑡= 𝐼𝑙𝑒𝑎𝑘 + 𝐼𝑁𝑎𝑃 + 𝐼𝐴 + 𝐼𝑁𝑎(𝑠𝑜𝑚𝑎) + 𝐼ℎ(𝑠𝑜𝑚𝑎) + 𝐼𝐾(𝑠𝑜𝑚𝑎) + 𝐼𝑁𝑎(𝑑𝑒𝑛𝑑𝑟𝑖𝑡𝑒) + 𝐼ℎ(𝑑𝑒𝑛𝑑𝑟𝑖𝑡𝑒)
+ 𝐼𝐾(𝑑𝑒𝑛𝑑𝑟𝑖𝑡𝑒)
Where V is the membrane potential, t is time, and Cm is the membrane capacitance. For
an ionic current Ix, the current is expressed by the equation
𝐼𝑥 = 𝑔𝑥⋅ 𝑦𝑥 ⋅ (𝑉 − 𝐸𝑥)
Where ḡx is the maximum conductance, yx is the product of one or more activation or
inactivation gating variables raised to integer powers, V is the membrane potential, and
Ex is the equilibrium potential. The equations for each yx were taken from the literature
(Fietkiewicz et al., 2011; Purvis and Butera, 2005). The initial values for the parameters
were taken from previous work (Fietkiewicz et al., 2011) and then iterations performed to
adjust values until there was a match to published experimental data. For both soma and
dendrites, the cytoplasmic resistance was 100 Ohm-cm, the membrane capacitance was
0.25 pF/cm2, and the passive properties were gpas=0.00025 S/cm2 with Epas = -70 mV,
gleak=0.000125 S/cm2 with Eleak=-50 mV, gNaP=0.00003975 S/cm2, and gA=0.0025 S/cm2.
For the soma gNa(soma)=0.0075 S/cm2 with ENa(soma)=60 mV, gK(soma)=0.032 S/cm2 with
EK(soma)=-80 mV, and gh(soma)=0.00025 S/cm2 with Eh(soma)=-38.8 mV. For the dendrites
gNa(dendrite)=0.00075 S/cm2 with ENa(dendrite)=60 mV, gK(dendrite)=0.0032 S/cm2 with
EK(dendrite)=-80 mV, and gh(dendrite)=0.000025 S/cm2 with Eh(dendrite)=-38.8 mV.
Two different experiments were simulated with the model replicating previous
electrophysiological data from genioglossal MNs (Nunez-Abades et al., 1993). We
selected one experiment that yielded passive properties from current-voltage plots from

95
current clamp. The experiment and our simulation injected currents from 0.1 to 0.6 nA
for P3 XII MNs and from 0.1 to 1 nA for P10 and P17 both in increments of 0.1 nA. The
other experiment generated single action potentials yielding active properties including
the medium afterhyperpolarization (mAHP) potential (Nunez-Abades et al., 1993; Purvis
and Butera, 2005). In the reported experiment the membrane was held at a fixed potential
varying from -50 mV to -85 mV while a current was injected at a duration of 0.1 ms. In
our simulation we chose to set the Epas to values of -50, -60, -70, -80, and -85 mV to
generate the five values reported in the experiment. The results of the simulation were
compared with those previously obtained from the reported experiments (Nunez-Abades
et al., 1993).
Data Analysis
Descriptive summary statistics of simulation results were generated for each of
the three ages. Correlation coefficients and regression analysis was performed for the
electrophysiological measures as a function of the morphology (volume or surface area).
Nonparametric statistics were performed using the Kruskal-Wallis test and Dunn multiple
comparisons to compare measured and simulation results. The data was fitted with the
equation Y = a Xb, where ‘a’ is the intercept and ‘b’ is the exponent or slope of the
curve.

96
Results
3D Morphometrics and Electrophysiology
Examples (average volume for either soma or dendrites) of 3D reconstructions
and Sholl profiles for P3, P10, and P17 are shown in Figure 18. As can be seen by the
Sholl profiles the morphology changes with increases in dendritic tree size and
complexity. The total volume and surface area increased with age. The total volume
increased by a factor of about 1.52 from P3 to P10 and 3.55 from P3 to P17 (Table 11).
The total surface area increased by a factor of about 1.67 from P3 to P10 and 3.17 from
P3 to P17 (Table 11). Statistically, only the P3 and P17 were significantly different for
both volume and surface area. Power analysis suggested that approximately 75 P3 and
P10 neurons each would be required for a power of 0.80. Examples of the simulation
output from the current-voltage experiment for the P3, P10, and P17 XII MNs are shown
in Figure 19. It was necessary to decrease the hyperpolarization-activated current (Ih) by a
factor of 10 for both soma and dendrites, increase membrane capacitance by a factor of 2
to match the P3 results with experimental results. With the decreased hyperpolarization-
activated current and increased membrane capacitance, the peak resistance did not change
significantly, but the steady-state resistance did increase. Both peak and steady-state
resistance decreased with age. From P3 to P17 the peak resistance decreased by 63%
while the steady-state decreased by 71%. For the single action potential (Figure 20) we
observed decreasing width in the action potential with increasing age and the mAHP
amplitude decreased with increasing membrane potential (Figure 20). There was no
obvious statistically significant change in mAHP amplitude or duration with age (Table

97
11), but power analysis suggested that for mAHP amplitude, a sample size of 75 for each
age was required for a power = 0.8.
Electrophysiology as a Function of Morphology
The peak resistance (Rpeak) correlated with the total volume and surface area of
the XII MNs (Figures 21A and 21B). The intercept of the curve for total volume versus
Rpeak (Figure 21A) was 2212 with a slope of -0.38 (R=0.5462, p<0.01) while the total
volume surface area versus Rpeak (Figure 21B) had an intercept of 8227 with a slope of -
0.53 (R-0.5831, p<0.01). Although the amplitude of the mAHP was not found to
correlate (R=0.3375, p>0.20 for P3 and R=0.307, p>0.20 for P10/P17) with neuron
morphology (Figure 21C), there was a correlation between Rpeak and the amplitude of the
mAHP (Figure 21D) only for P10 & P17. For the P3 XII MNs the intercept for Rpeak
versus the amplitude of the mAHP was 1.43 with a slope of 0.13 (R=0.4058. P>0.10) and
for P10/P17 the intercept was 1.15 with a slope of 0.29 (R=0.6796, p<0.01).

98
Figure 18. Morphology of hypoglossal motoneurons at P3, P10, and P17. The 3D
reconstructions (top) and their associated Sholl profiles (bottom) are shown.

99
Table 11. Summary statistics of morphological and biophysical properties from XII MNs.
For each age the mean ± standard deviation is given for each parameter along with the
median shown in (). Shown are the morphometric parameters (volume and surface area),
passive properties (peak and steady-state resistance), and the active properties (amplitude
and duration of the medium afterhyperpolarization potential, mAHP).
Parameter P3 (N=10) P10 (N=6) P17 (N=6)
Volume (m3) 4766 ± 4510
(3334)
7259 ± 6104
(5156)
16904 ± 6997
(17390)
Surface Area (m2) 4258 ± 3759
(3320)
7096 ± 3856
(7112)
13510 ± 3868
(12822)
Peak Resistance (M) 143 ± 101
(117)
129± 50
(126)
53 ± 36
(52)
Steady-State Resistance (M) 140 ± 101
(114)
102 ± 42
(107)
41 ± 26
(39)
mAHP amplitude (mV) 2.77 ± 0.65
(2.57)
4.61 ± 1.21
(4.57)
3.69 ± 1.35
(3.70)
mAHP duration (ms) 173 ± 37
(183)
205 ± 21
(211)
184 ± 34
(190)

100
Figure 19. The I-V curves from P3, P10, and P17 XII MNs. On the left side are the voltage
curves corresponding to the injected current (right side) and on the far right is the current-
voltage (I-V) curves for the three age groups showing the slopes (resistance).

101
Figure 20. Action potentials and mAHP from P3, P10, and P17 XII MNs. On the left are
the action potentials with expanded views (right) showing the mAHP potentials at each
of the membrane potentials. On the far right is a graph of the membrane potential versus
the mAHP amplitude for each of the three postnatal ages.

102
Figure 21. Regression analysis of passive and active biophysical properties of XII MNs as
a function of morphology. Shown are a) total neuron volume versus peak resistance (Rpeak)
with regression line for P3, P10, and P17 combined, b) total neuron surface area versus
Rpeak with regression line for P3, P10, and P17 combined, c) total neuron volume versus
mAHP amplitude with regression for P3 only and regression for P10 and P17 combined,
and d) Rpeak versus mAHP amplitude with regression for P3 only and regression for P10
and P17 combined. All regression values are reported in the text.

103
Discussion
In this study we have, for the first time, examined the potential relationship
between the electrophysiological behavior and the morphology of XII MNs. We did not
establish a direct relationship between the morphology of the neuron and amplitude of the
mAHP, but we did show that mAHP amplitude is dependent on the neuron’s passive
properties, which suggests an indirect relationship between morphology and active
properties. We simulated XII MN electrophysiology behavior based on 3D morphology
measured from XII MNs in a rat pup model comparing theoretical passive and active
electrophysiology properties to previously reported experimental results (Nunez-Abades
et al., 1993). Although there are other studies of hypoglossal motoneuron
electrophysiology (Bayliss et al., 1994; Lamanauskas and Nistri, 2008; Lape and Nistri,
2001; Powers and Binder, 2003), most studied specific ion currents. Simulating these
studies could provide some insight into the ion currents, but do not provide information
on morphology or differences in ion currents between soma and dendrites. Additionally,
these studies did not examine the ages (P1–P2, P5–P6, P13–P15, and P19–P30) that
Nunez-Abades et al. (1993) examined. The action potentials and mAHP amplitudes
where similar to those in the literature (Nunez-Abades et al., 1993). To match the
waveforms from published experimental results (Nunez-Abades et al., 1993) we had to
alter the P3 XII MN parameters from those of the P10 and P17 XII MN parameters. We
were able to demonstrate a relationship between neuron size (volume and surface area)
and the passive properties showing decreased resistance (from I-V curves) with increased
cell size. Because the resistance is mostly due to the passive biophysical properties there
was little, if any differences between the P3 XII MNs and the P10/P17 XII MNs. With a
104
2-fold increase in total volume there was a 20% decrease in mAHP amplitude from P10
to P17. Since the simulation parameters were the same this change in mAHP could be
due to the increase in total volume.
Electrophysiology
Although the model we used was a single (somal) compartment, we incorporated
dendrites using the tools provided in NEURON (Fietkiewicz et al., 2011; Purvis and
Butera, 2005). In our model we utilized different values of fast sodium and potassium
conductance for soma and dendrites with the dendrites being 10-fold lower than the
soma, as well as, the hyperpolarization-activated current being 100-fold lower for
dendrites than for soma. A previous model, which included three dendrites with the soma,
also used different values for conductance of specific channels (Engel et al., 1999). In
this study, we found that the passive and active properties used for postnatal day 3 (P3) in
our model did not match experimental results unless the values for the hyperpolarization-
activated current and membrane capacitance were different from twice the value of those
that used for P10 and P17 neurons. Purvis and Butera (2005) have suggested that the
hyperpolarization-activated current is lower in neonates based on differences in mAHP
duration between adults and neonates with approximately a ten-fold decrease in neonates
compared with adults. Experimental data on membrane properties and cell size suggest
that the membrane capacitance can decrease by one-half from P1–P2 to P19–P30 (Nunez-
Abades and Cameron, 1997) meaning that the value at P3 is not necessarily the same at
P10 or P17. This may also be true for the P10 neuron since the membrane properties
appear to change with age (Nunez-Abades and Cameron, 1997), and the mAHP changes

105
with age related to the hyperpolarization-activated current (Berger et al., 1996; Cameron
and Nunez-Abades, 2000; Purvis and Butera, 2005; Yoshimoto et al., 2015). One study
has shown that the electrophysiological properties of P10 XII MNs differs from that of
P17 XII MNs (Nguyen et al., 2004). As a result, the electrophysiological properties of the
P10 XII MNs in this study may be different from experimental, but the previous study we
used for comparison did not measure P10 XII MNs (Nunez-Abades et al., 1993) so this
is, as of yet, unknown. Therefore, the changes we made to the P3 model are supported by
prior experimental work.
Electrophysiology as a Function of Morphology
We found that the peak resistance correlated with both the total volume and total
surface area of the neuron. This has been previously demonstrated experimentally
(Nunez-Abades and Cameron, 1997); however, we have shown that the proportion of a
subset of modeled ionic conductances are different between the P3 neurons and the
P10/P17 neurons. The membrane resistance (RM) decreases with increasing age, while the
amplitude of the mAHP changes little and there is some change in mAHP duration with
age. Although the amplitude of the mAHP did not correlate with the volume or surface
area of the neuron, we saw a relationship between mAHP amplitude and resistance
correlating with cell size. Therefore, while morphology may not directly influence the
active properties it certainly indirectly affects the excitability of the neuron via the
changes we report in the cell’s passive properties. Thus, our model provides a more
rigorous foundation for understanding how the developmental changes in brainstem
106
neurons can contribute to changes in excitability and reliability of neural activity in the
brainstem respiratory neural network.
Comparison with Previous Studies
Although this study is the first to relate biophysical properties and morphology in
an extensive range of developing brainstem neurons, there are theoretical models and
experimental studies that have focused on XII MNs. Our model is an extension of two
previous models for XII MNs that were single compartment Hodgkin-Huxley style
models (Fietkiewicz et al., 2011; Purvis and Butera, 2005). One main difference in our
study was the use of morphological data from measured XII MNs to simulated
experiments from electrophysiological studies published by others (Nunez-Abades et al.,
1993), then comparing our simulated results with the published experimental results.
Although one other study modeled a soma with three non-branching dendrites (Engel et
al., 1999), our study used neurons of different sizes, dendrite lengths, and degrees of
branching. An electrophysiology study on rat vibrissa motoneurons assessed measured
active and passive membrane properties as well as measuring neuron morphology
(Nguyen et al., 2004). They showed differences in branch length and membrane
impedance between P4–P5 and P15–P23 neurons but did not show correlations between
the membrane properties and neuron morphology.
Limitations of Model
Our model was limited by gaps in our knowledge concerning the range of ionic
conductances expressed and present in the membrane of XII MNs, as well as, differences

107
in channel density on the dendrite as compared with the soma and those changes
occurring across the time course of early development. Other studies have established the
location of some voltage-gated ion channels (Vacher et al., 2008), but little is known
about which ion channels are expressed where for XII MNs. There are many studies of
voltage-gated ion channel function (Ekberg and Adams, 2006; Jan and Jan, 2012;
Johnston et al., 2010; Yu and Catterall, 2003) and XII MNs specifically (Bayliss et al.,
1994; Lape and Nistri, 2001; Powers et al., 1999; Powers and Binder, 2003), but there is
no comprehensive information about ion channel relative densities on soma and dendrites
in XII MNs. One study found that ion channel expression in the rat ventral respiratory
column varies between adult and neonates with a subset of sodium, potassium, and
calcium channels having a six-fold or more increase in adults when compared with
neonates (González-Castillo et al., 2017). However, in our study we found that the
surface area in P17 neurons was about 3-fold greater compared with P3 neurons,
suggesting that the density may have about a 2-fold or more increase in our models. The
different sub-types of voltage-gated ion channels and which are present on the somata
and dendrites of XII MNs is another factor having a profound effect on
electrophysiological behavior. Beckh and colleagues (1989) showed that from P1 to
about P10 one sub-type of sodium channel III (Nav 1.3) is expressed on neurons while a
different sub-type sodium channel I (Nav 1.1) is expressed from P10 through adults
(Beckh et al., 1989). These two sodium channel sub-types (Nav 1.1 and Nav 1.3) exhibit
different activation inactivation, and deactivation kinetics (Ekberg and Adams, 2006;
Vacher et al., 2008). Although there are studies of expression of various channels
(González-Castillo et al., 2017; Beckh et al., 1989), most are for the whole brain and very

108
few, if any studies of channel distribution on neurons are available for brainstem neurons
and less for XII MNs.
Future Directions
In this study we have provided support for our hypothesis that morphological
changes may have a direct or indirect role in changes of the biophysical properties and
behavior of XII MNs. We also established support for changes in ion currents with age
that were necessary for us to match our simulation results with previous experimental
results. Therefore, both morphology and ion currents seem to be important in the
biophysical behavior of XII MNs. However, major challenges in this study included our
assumptions on channel location and density in the soma and dendrites. Studies
employing immunohistochemistry to stain various channels, allowing quantification of
numbers and location/density for XII MNs would aid in model development (Bocksteins
et al., 2012) and these studies would be a fruitful avenue for future investigation.
Although experimental electrophysiology on XII MNs using neurobiotin/biocytin fills
have provided morphology in XII MNs, (Nguyen et al., 2004; Nunez-Abades and
Cameron, 1997), there are few studies incorporating both electrophysiology and
morphology for the same set of neurons at multiple ages. Combining this
electrophysiology and morphology with modeling based on the morphology for direct
comparison of modeling results with experimental results should provide detailed
information about the relationship between morphology and biophysical properties in
vitro. This information should also provide a better understanding of electrophysiological

109
behavior as more detailed and extensive computational models are developed for motor
systems as well as higher CNS neural networks.
Conclusions
The results from this study suggests that the passive properties (resistance and
capacitance) correlate with the deverlopmental morphology changes in hypoglossal
neurons. Although the active properties were not found to correlate as significantly with
morphology, particularly the amplitude of mAHP, more work must be done to address
this feature of XII MN modeling. Our modeling results and experimental data reported in
published literature suggest that the ion currents are changing with age—resulting in
changes of the passive and active properties. However, very few if any studies have
thoroughly studied the electrophysiology of developing neurons in functional motor
networks.
Acknowledgements
Imaging was performed in the LLUSM Advanced Imaging and Microscopy Core
with support from National Science Foundation grant MRI-DBI 0923559 and Loma
Linda University School of Medicine. The authors thank Johnny Figueroa, PhD for
assistance and use of the Keyence microscope.

110
Literature Cited
Bayliss, D.A., Viana, F., Bellingham, M.C., Berger, A.J., 1994. Characteristics and
postnatal development of a hyperpolarization-activated inward current in rat
hypoglossal motoneurons in vitro. J Neurophysiol 71, 119–28.
Beckh, S., Noda, M., Lubbert, H., Numa, S., 1989. Differential regulation of three
sodium channel messenger RNAs in the rat central nervous system during
development. EMBO J 8, 3611–6.
Berger, A.J., Bayliss, D.A., Viana, F., 1996. Development of hypoglossal motoneurons.
J. Appl. Physiol. 81, 1039–1048.
Bocksteins, E., Shepherd, A.J., Mohapatra, D.P., Snyders, D.J., 2012. Immunostaining of
Voltage-Gated Ion Channels in Cell Lines and Neurons — Key Concepts and
Potential Pitfalls, in: Dehghani, H. (Ed.), Applications of Immunocytochemistry.
InTech.
Boone, T.B., Aldes, L.D., 1984. The ultrastructure of two distinct neuron populations in
the hypoglossal nucleus of the rat. Exp Brain Res 54, 321–6.
Cameron, W.E., Nunez-Abades, P.A., 2000. Physiological changes accompanying
anatomical remodeling of mammalian motoneurons during postnatal
development. Brain Res Bull 53, 523–7.
Carrascal, L., Nieto-Gonzalez, J.L., Cameron, W.E., Torres, B., Nunez-Abades, P.A.,
2005. Changes during the postnatal development in physiological and anatomical
characteristics of rat motoneurons studied in vitro. Brain Res Brain Res Rev 49,
377–87. https://doi.org/10.1016/j.brainresrev.2005.02.003
Cooper, M.H., 1981. Neurons of the hypoglossal nucleus of the rat. Otolaryngol Head
Neck Surg 89, 10–5. https://doi.org/10.1177/019459988108900103
Das, G., Reuhl, K., Zhou, R., 2013. The Golgi-Cox method. Methods Mol Biol 1018,
313–21. https://doi.org/10.1007/978-1-62703-444-9_29
Ekberg, J., Adams, D.J., 2006. Neuronal voltage-gated sodium channel subtypes: key
roles in inflammatory and neuropathic pain. Int J Biochem Cell Biol 38, 2005–10.
https://doi.org/10.1016/j.biocel.2006.06.008
Engel, J., Schultens, H.A., Schild, D., 1999. Small conductance potassium channels cause
an activity-dependent spike frequency adaptation and make the transfer function
of neurons logarithmic. Biophys J 76, 1310–9. https://doi.org/10.1016/S0006-
3495(99)77293-0
Feldman, J.L., Del Negro, C.A., 2006. Looking for inspiration: new perspectives on
respiratory rhythm. Nat. Rev. Neurosci. 7, 232–242.
https://doi.org/10.1038/nrn1871

111
Feldman, J.L., Del Negro, C.A., Gray, P.A., 2013. Understanding the rhythm of
breathing: so near, yet so far. Annu. Rev. Physiol. 75, 423–452.
https://doi.org/10.1146/annurev-physiol-040510-130049
Feldman, J.L., Smith, J.C., 1995. Neural control of respiratory pattern in mammals: an
overview, in: Dempsey, J.A., Pack, A.I. (Eds.), Regulation of Breathing. Marcel-
Dekker, New York, N.Y., pp. 39–69.
Ferrante, M., Migliore, M., & Ascoli, G. A., 2013. Functional impact of dendritic branch-
point morphology. J Neurosci, 33(5), 2156-2165.
doi:10.1523/JNEUROSCI.3495-12.2013
Fietkiewicz, C., Loparo, K.A., Wilson, C.G., 2011. Drive latencies in hypoglossal
motoneurons indicate developmental change in the brainstem respiratory network.
J. Neural Eng. 8. https://doi.org/10.1088/1741-2560/8/6/065011
Fukunishi, Y., Nagase, Y., Yoshida, A., Moritani, M., Honma, S., Hirose, Y., Shigenaga,
Y., 1999. Quantitative analysis of the dendritic architectures of cat hypoglossal
motoneurons stained intracellularly with horseradish peroxidase. J Comp Neurol
405, 345–58.
Gibb, R., Kolb, B., 1998. A method for vibratome sectioning of Golgi-Cox stained whole
rat brain. J Neurosci Methods 79, 1–4.
González-Castillo, C., Muñoz-Ortiz, E., Guzmán-Brambila, C., Rojas-Mayorquín, A.E.,
Beltran-Parrazal, L., Ortuño-Sahagún, D., Morgado-Valle, C., 2017. Differential
Expression of Ion Channels in Adult and Neonatal Rat Ventral Respiratory
Column. J. Mol. Neurosci. https://doi.org/10.1007/s12031-017-1001-2
Jan, L.Y., Jan, Y.N., 2012. Voltage-gated potassium channels and the diversity of
electrical signalling. J Physiol 590, 2591–9.
https://doi.org/10.1113/jphysiol.2011.224212
Johnston, J., Forsythe, I.D., Kopp-Scheinpflug, C., 2010. Going native: voltage-gated
potassium channels controlling neuronal excitability. J Physiol 588, 3187–200.
https://doi.org/10.1113/jphysiol.2010.191973
Kanjhan, R., Fogarty, M.J., Noakes, P.G., Bellingham, M.C., 2016. Developmental
changes in the morphology of mouse hypoglossal motor neurons. Brain Struct.
Funct. 221, 3755–3786. https://doi.org/10.1007/s00429-015-1130-8
Khazipov, R., Zaynutdinova, D., Ogievetsky, E., Valeeva, G., Mitrukhina, O., Manent, J.-
B., Represa, A., 2015. Atlas of the Postnatal Rat Brain in Stereotaxic Coordinates.
Front. Neuroanat. 9. https://doi.org/10.3389/fnana.2015.00161
Koizumi, H., Wilson, C.G., Wong, S., Yamanishi, T., Koshiya, N., Smith, J.C., 2008.
Functional Imaging, Spatial Reconstruction, and Biophysical Analysis of a
Respiratory Motor Circuit Isolated In Vitro. J. Neurosci. 28, 2353–2365.

112
Komendantov, A.O., Ascoli, G.A., 2009. Dendritic excitability and neuronal morphology
as determinants of synaptic efficacy. J Neurophysiol 101, 1847–66.
Lamanauskas, N., Nistri, A., 2008. Riluzole blocks persistent Na+ and Ca2+ currents and
modulates release of glutamate via presynaptic NMDA receptors on neonatal rat
hypoglossal motoneurons in vitro. Eur J Neurosci 27, 2501–14.
Lape, R., Nistri, A., 2001. Characteristics of fast Na(+) current of hypoglossal
motoneurons in a rat brainstem slice preparation. Eur J Neurosci 13, 763–72.
Lindsey, B.G., Rybak, I.A., Smith, J.C., 2012. Computational models and emergent
properties of respiratory neural networks. Compr Physiol 2, 1619–70.
https://doi.org/10.1002/cphy.c110016
Liu, Q., Lowry, T.F., Wong-Riley, M.T.T., 2006. Postnatal changes in ventilation during
normoxia and acute hypoxia in the rat: implication for a sensitive period. J
Physiol 577, 957–70.
Mortola, J.P., 1984. Breathing pattern in newborns. J Appl Physiol Respir Env. Exerc
Physiol 56, 1533–40.
McClung, J.R., Goldberg, S.J., 1999. Organization of motoneurons in the dorsal
hypoglossal nucleus that innervate the retrusor muscles of the tongue in the rat.
Anat Rec 254, 222–30.
Myatt, D.R., Hadlington, T., Ascoli, G.A., Nasuto, S.J., 2012. Neuromantic - from semi-
manual to semi-automatic reconstruction of neuron morphology. Front
Neuroinform 6, 4. https://doi.org/10.3389/fninf.2012.00004
Nguyen, Q.T., Wessel, R., Kleinfeld, D., 2004. Developmental regulation of active and
passive membrane properties in rat vibrissa motoneurones. J Physiol 556, 203–19.
https://doi.org/10.1113/jphysiol.2003.060087
Nunez-Abades, P.A., Cameron, W.E., 1997. Relationship between membrane properties
and cell size of developing rat genioglossal motoneurons studied in vitro.
Neurosci Lett 223, 41–4.
Nunez-Abades, P.A., Cameron, W.E., 1995. Morphology of developing rat genioglossal
motoneurons studied in vitro: relative changes in diameter and surface area of
somata and dendrites. J Comp Neurol 353, 129–42.
https://doi.org/10.1002/cne.903530112
Nunez-Abades, P.A., He, F., Barrionuevo, G., Cameron, W.E., 1994. Morphology of
developing rat genioglossal motoneurons studied in vitro: changes in length,
branching pattern, and spatial distribution of dendrites. J Comp Neurol 339, 401–
20. https://doi.org/10.1002/cne.903390308
113
Nunez-Abades, P.A., Spielmann, J.M., Barrionuevo, G., Cameron, W.E., 1993. In vitro
electrophysiology of developing genioglossal motoneurons in the rat. J
Neurophysiol 70, 1401–11.
Powers, R.K., Binder, M.D., 2003. Persistent sodium and calcium currents in rat
hypoglossal motoneurons. J Neurophysiol 89, 615–24.
https://doi.org/10.1152/jn.00241.2002
Powers, R.K., Sawczuk, A., Musick, J.R., Binder, M.D., 1999. Multiple mechanisms of
spike-frequency adaptation in motoneurones. J Physiol Paris 93, 101–14.
Preibisch, S., Saalfeld, S., Tomancak, P., 2009. Globally optimal stitching of tiled 3D
microscopic image acquisitions. Bioinformatics 25, 1463–1465.
https://doi.org/10.1093/bioinformatics/btp184
Purvis, L.K., Butera, R.J., 2005. Ionic Current Model of a Hypoglossal Motoneuron. J.
Neurophysiol. 93, 723–733.
Smith, J.C., Butera, R.J., Koshiya, N., Negro, C.D., Wilson, C.G., Johnson, S.M., 2000.
Respiratory rhythm generation in neonatal and adult mammals: the hybrid
pacemaker-network model. Respir. Physiol. 122, 131–147.
Takasu, N., Hashimoto, P.H., 1988. Morphological identification of an interneuron in the
hypoglossal nucleus of the rat: a combined Golgi-electron microscopic study. J
Comp Neurol 271, 461–71. https://doi.org/10.1002/cne.902710313
Vacher, H., Mohapatra, D.P., Trimmer, J.S., 2008. Localization and targeting of voltage-
dependent ion channels in mammalian central neurons. Physiol Rev 88, 1407–47.
https://doi.org/10.1152/physrev.00002.2008
Yoshimoto, R., Iwasaki, S., Takago, H., Nakajima, T., Sahara, Y., Kitamura, K., 2015.
Developmental increase in hyperpolarization-activated current regulates intrinsic
firing properties in rat vestibular ganglion cells. Neuroscience 284, 632–42.
https://doi.org/10.1016/j.neuroscience.2014.10.034
Yu, F.H., Catterall, W.A., 2003. Overview of the voltage-gated sodium channel family.
Genome Biol 4.

114
CHAPTER FOUR
DISCUSSION
Brainstem regions including the nucleus tractus solitarii, ventral respiratory
column, Bötzinger Complex, pre-Bötzinger Complex, and hypoglossal motor nucleus are
necessary for the generation and transmission of breathing rhythm and modification of
breathing pattern in response to sensory input (Feldman et al., 2013; Feldman and Del
Negro, 2006; Lindsey et al., 2012; Wong-Riley and Liu, 2005). This respiratory network
plays a key role in breathing pattern and control (Lindsey et al., 2012; Liu et al., 2006;
Mortola, 1984). This neural network behavior can be influenced by the morphology of
neurons, and connectivity can be altered due to changes in neurotransmitter release and
receptor up- and down-regulation (Ferrante et al., 2013; Komendantov and Ascoli, 2009).
Although not fully investigated, it has been suggested that morphology, neuron
electrophysiology, connectivity, and neurotransmitter expression changes during
development (Carrascal et al., 2005; Liu et al., 2009; Nunez-Abades et al., 1993; Wong-
Riley and Liu, 2005). Therefore, understanding how the breathing neural network is
remodeled during early life is key to elucidating the synergy between morphology and
the transmission of breathing rhythm in the perinatal period.
Developmental Morphology of Hypoglossal Motoneurons
In this work I have shown that the XII MN soma increases size with increasing
age, but that the shape changes very little, if any with increasing age. This supports a
recent study on XII MNs in mice (Refik Kanjhan et al., 2016) and suggest that the soma
has a gradual, continuous growth during the first three weeks post birth. However, the

115
dendritic tree increases in both size and complexity with increasing age. More
importantly, I have shown that there are at least three development windows: P1–P5, P7–
P12, and P13–P21. One of the main features of these three windows is the increase in the
number of primary branches during the P7–P12 period while during the P13–P21 period
there is only an increase in branching. This supports our hypothesis of the sensitive
period in that the increase in primary branches specifically during this P7–P12 window
represents a change which allows for more extensive branching influencing the surface
area available for ion channels and receptors. Another result supporting my hypothesis is
that the data could not be fitted to a single distribution, to a finite mixture model of two
normal distributions with the parameters being age-window dependent. For example, the
radius at which the maximum number of intersections occurred did not have the same
distribution parameters at P7–P12 as at P1–P5. At P13–P21 the data was more
represented as a single distribution, but the P7–P12 seems to represent a transition
between the P1–P5 and P13–P21. Therefore, there does appear to be changes that are
consistent with a morphological “sensitive period” or a transitional window between the
first and third weeks post-birth.
Except for the soma shape which did not change significantly with age, the size of
the soma, dendritic tree size, and complexity of dendritic trees all increased with
increasing age. The finite mixture model of two normal distributions was not consistent
for the three developmental windows (except for aspect ratio and form factor) suggesting
that soma size and dendrite development is not necessarily the same for all neurons at a
specific age. Changes in soma size relates in part to the metabolic capacity and dendritic
tree size and complexity relates partially to connectivity. If the dendritic tree lacks
116
sufficient surface area, then the number of synaptic contacts and ion channels is limited
which may impact function. In the hypoglossal nucleus this could limit the drive and
control of the tongue and upper airway potentially having a negative impact on upper
airway function.
Developmental Electrophysiology of Hypoglossal Motoneurons
The principle goal of modeling is to provide some theoretical understanding of a
phenomena and insight into testable hypotheses which can be tested experimentally.
Computer simulation, done correctly, can simulate several experiments in a shorter time
than actual experiments generating questions that can be addressed experimentally.
Modelling is simply an adjunct to experimental work which should complement and
enhance experimental data and results. I have shown that both passive and active
properties change with increasing age. Important to the electrophysiology, I have shown
that the passive properties correlate with morphology. Another important finding was that
for the P3 XII MNs it was necessary in the model to double the membrane capacitance
and decrease the hyperpolarization-activated current by ten to replicate the passive and
active properties measured experimentally. This would suggest that there are
developmental changes in at least some of the ionic currents such as the
hyperpolarization-activated current as well as the membrane capacitance with age. Both
of these have been suggested in previous studies (Nunez-Abades and Cameron, 1997;
Purvis and Butera, 2005). However, very little is known about any changes in other ion
currents such as the various types and sub-types of sodium and potassium currents with
age. Further study of the ionic currents at individual ages might provide more

117
understanding of the functional changes in neurons. Especially if there are any changes
during the sensitive period reflecting transitions in how the ion currents contribute to the
neuron’s electrophysiology could provide clues into other functional changes.
Limitations
There are several limitations from each part of this work. The Golgi-Cox staining
method is neuron selective, but what neurons are selectively stain and why are not
apparent. The 3D reconstructions are from image stacks with each image take at intervals
of 2 m. At a magnification of 40x the resolution in the x and y direction is about ±0.1
m. Therefore, the reconstructions do not represent true 3D models since an orthogonal
view is not acquired and the resolution in the z-direction is about ±1 m. This translates
to lack of accuracy and loss of information on dendrites extending from the bottom and
top of the soma. Neuromantic and other programs for 3D reconstruction generally assume
cylinder and conical shapes which may not completely represent actual morphologies of
the neuron soma or dendrite.
The simulation environment NEURON assumes a spherical soma consisting of a
single compartment, but this does not reflect the actual 3D morphology of XII MNs.
Many of the parameters for the model such as the ionic current densities for XII MN
soma and dendrites are not known. Previous electrophysiological studies cannot
distinguish between soma and dendritic channels. Studies investigating the expression of
voltage-gated channels usually process and examine the whole brain and not specific
regions. There are some studies on localization for voltage-gated channels, however these
studies are for neurons in general and not specific to XII MNs. I did not include calcium

118
channels nor the small-conductance calcium-activated potassium (SK) channel which are
less important to single action potentials and more important to a train of action
potentials. Therefore, an improvement to the present work would be to incorporate these
ionic currents into the model for passive, single action potentials, and action potential
trains.
Future Studies
One obvious extension of this work would be the 3D reconstructions and
morphometric analysis of the XII MNs. This is presently being pursued for all 460 XII
MNs reported in this study for later publication. Measures such as branch order, dendrite
length and diameter at each branch order, and other 3D morphometrics are being obtained
to generate dendrograms and graphs to summarize these geometric quantities.
Some of the questions about changes in ion currents with age resulting from the
electrophysiology simulations in this work could possibly be addressed by two strategies.
Since there are antibodies for some types and sub-types of voltage-gated channels
immunohistochemical techniques could be used to estimate the densities of these
channels on soma and dendrites of XII MNs (Bocksteins et al., 2012). Although actual
densities would be of benefit, estimates of the ratio of ion channel densities between
soma and dendrites could provide a constraint in current densities for the simulation
models. By increasing the number of known parameters, the number of solutions is
constrained thereby providing a convergence of model parameters such that simulations
optimally match experimental results. Another approach would be to use
pharmacological techniques to block specific ion currents. Pharmacological agents such

119
as TTX can be used to block sodium channels while agents such as minocycline can
block the hyperpolarization-activated current (Bayliss et al., 1994; Berger et al., 1996;
Carrascal et al., 2005). Reducing the number of ionic currents in the experiment would
also reduce the number of parameters in the simulation model reducing the number of
iterations to match simulated and experimental results. By matching the simulated and
experimental results with different ionic currents being blocked only specific ionic
currents combinations would be acting for each scenario allowing for stepwise iteration
of the parameters. Both approaches are limited due to lack of antibodies for all channels
and methodological limits for immunohistochemistry, and the limitation of
pharmacological agents targeting ionic currents. Therefore, by combining
immunohistochemistry and pharmacological approaches most of the ionic current
associated parameters could be worked out in the simulation model based on
experimental data.
Probably the most important direction for this work stems from the finding that
morphology has an indirect influence on active electrophysiological properties. By
determining the corresponding morphology of neurons with a specific
electrophysiological behavior a better understanding of the electrophysiology could be
obtained. One experiment to address this would be to perform electrophysiology on XII
motoneurons in rat pups from the different developmental windows. After the experiment
is completed fill the neuron with neurobiotin processing for either bright-field or
fluorescence imaging, acquire image stacks, and perform 3D reconstructions obtaining
3D morphology. These 3D geometrical models could then be imported into NEURON or
another simulation program where the experiment would be replicated, and simulated

120
results compared with the experimental results. By having the morphology to normalize
the comparison between simulated and experimental results any influence or variance
added by the morphology is accounted for allowing for better iteration of the ion currents.
However, it would be necessary to obtain a sufficient variance in the morphology to be
able to ascertain the relationship between morphology and electrophysiological
properties. Therefore, in this experiment both a suitable electrophysiological model for
simulation, and sufficient sample size and morphological variance is required for curve
fitting.
Other experiments that would expand the findings of my work would be to repeat
this work with different animals. This comparative morphology-electrophysiology could
provide a broader understanding of XII MNs exploring conserved and non-conserved
aspects of XII MNs. Differences in respiration and responses to conditions such as
hypoxia and hypercapnia between various strains of rats has been reported (Golder et al.,
2005; Strohl et al., 1997; Yang et al., 1999). Therefore, the study of other rat strains, such
as Brown Norway, Wistar, or Fischer compared to the Sprague-Dawley rats used in this
study would provide more depth in our understanding of XII MNs and development.
Establishing the pattern of maturation of XII MNs in two or more rat strains such as
Brown Norway or Wistar could provide a deeper understanding of neuron development
from the similarity and differences particularly in morphology, electrophysiology, and
their relationship. Since the rat pup model is one of premature birth since several systems
such as thermoregulation and respiration are not fully developed at birth another
extension of this would be to investigate XII MN development in full-term animal
models such as guinea pigs. Rats differ from other rodents such as mice (Mortola, 1991,

121
1984; Mortola and Lanthier, 2004), so characterization of the XII MN maturation in these
species compared to rats would provide a wider understanding of XII MN morphology
with age. Understanding the similarities and differences in animal models of full-term
and preterm births could provide information directed to problems associated with
preterm births.
Finally, the effects of conditions such as perinatal nicotine exposure or maternal
inflammation on the developmental maturation of XII MNs in a rat pup model could be
more precisely determined since there is now a baseline for normal maturation. In
conjunction with the previously mentioned studies a suitable simulation model for
electrophysiological behavior for XII MNs and its relationship with morphology can be
established. This foundation for understanding could allow for improved understanding
of both the morphological and electrophysiological changes due to adverse conditions
such as nicotine exposure or inflammation leading to better interpretation of short- and
long-term implications of these conditions. One such implication from this present work
is the differential morphology (finite mixture model results). One hypothesis for perinatal
nicotine exposure or maternal inflammation could be the lack of the differential
morphology. If certain morphological parameters which are non-normally distributed are
found to be normally distributed in the perinatal nicotine exposure or maternal
inflammation animals, then this could have implications even if there are no statistical
differences due to sample size or variance. Having a complete and detailed understanding
of the natural maturation of XII MNs could provide the foundation for adequate
interpretation of perinatal, maternal, and even postnatal conditions such as nicotine and
inflammation.

122
REFERENCES
Aldes, L.D., 1995. Subcompartmental organization of the ventral (protrusor)
compartment in the hypoglossal nucleus of the rat. J. Comp. Neurol. 353, 89–108.
Ascoli, G.A., Brown, K.M., Calixto, E., Card, J.P., Galvan, E.J., Perez-Rosello, T.,
Barrionuevo, G., 2009. Quantitative morphometry of electrophysiologically
identified CA3b interneurons reveals robust local geometry and distinct cell
classes. J Comp Neurol 515, 677–95. https://doi.org/10.1002/cne.22082
Bayliss, D.A., Viana, F., Bellingham, M.C., Berger, A.J., 1994. Characteristics and
postnatal development of a hyperpolarization-activated inward current in rat
hypoglossal motoneurons in vitro. J Neurophysiol 71, 119–28.
Beckh, S., Noda, M., Lubbert, H., Numa, S., 1989. Differential regulation of three
sodium channel messenger RNAs in the rat central nervous system during
development. EMBO J 8, 3611–6.
Berger, A.J., Bayliss, D.A., Viana, F., 1996. Development of hypoglossal motoneurons.
J. Appl. Physiol. 81, 1039–1048.
Bocksteins, E., Shepherd, A.J., Mohapatra, D.P., Snyders, D.J., 2012. Immunostaining of
Voltage-Gated Ion Channels in Cell Lines and Neurons -- KeyConcepts and
Potential Pitfalls, in: Dehghani, H. (Ed.), Applications of Immunocytochemistry.
InTech.
Boone, T.B., Aldes, L.D., 1984. Synaptology of the hypoglossal nucleus in the rat. Exp
Brain Res 57, 22–32.
Brust, R.D., Corcoran, A.E., Richerson, G.B., Nattie, E., Dymecki, S.M., 2014.
Functional and developmental identification of a molecular subtype of brain
serotonergic neuron specialized to regulate breathing dynamics. Cell Rep. 9,
2152–2165.
Cameron, W.E., Jodkowski, J.S., Fang, H., Guthrie, R.D., 1991. Electrophysiological
properties of developing phrenic motoneurons in the cat. J Neurophysiol 65, 671–
9.
Cameron, W.E., Nunez-Abades, P.A., 2000. Physiological changes accompanying
anatomical remodeling of mammalian motoneurons during postnatal
development. Brain Res Bull 53, 523–7.
Carrascal, L., Nieto-Gonzalez, J.L., Cameron, W.E., Torres, B., Nunez-Abades, P.A.,
2005. Changes during the postnatal development in physiological and anatomical
characteristics of rat motoneurons studied in vitro. Brain Res Brain Res Rev 49,
377–87. https://doi.org/10.1016/j.brainresrev.2005.02.003

123
Cooper, M.H., 1981. Neurons of the hypoglossal nucleus of the rat. Otolaryngol Head
Neck Surg 89, 10–5. https://doi.org/10.1177/019459988108900103
Cowan, W.M., Fawcett, J.W., O’Leary, D.D., Stanfield, B.B., 1984. Regressive events in
neurogenesis. Science 225, 1258–65.
Das, G., Reuhl, K., Zhou, R., 2013. The Golgi-Cox method. Methods Mol Biol 1018,
313–21.
De Carlos, J.A., Borrell, J., 2007. A historical reflection of the contributions of Cajal and
Golgi to the foundations of neuroscience. Brain Res. Rev. 55, 8–16.
https://doi.org/10.1016/j.brainresrev.2007.03.010
Delignette-Muller, M.L., Dutang, C., 2015. fitdistrplus: An R Package for Fitting
Distributions. J. Stat. Softw. Vol 1 Issue 4 2015 1.
Donohue, D.E., Ascoli, G.A., 2008. A comparative computer simulation of dendritic
morphology. PLoS Comput Biol 4, e1000089.
https://doi.org/10.1371/journal.pcbi.1000089
Dotta, A., Mortola, J.P., 1992. Postnatal development of the denervated lung in normoxia,
hypoxia, or hyperoxia. J Appl Physiol 1985 73, 1461–6.
Dutta, S., Sengupta, P., 2016. Men and mice: Relating their ages. Life Sci 152, 244–8.
Easter, S.S., Jr., Purves, D., Rakic, P., Spitzer, N.C., 1985. The changing view of neural
specificity. Science 230, 507–11.Ekberg, J., Adams, D.J., 2006. Neuronal voltage-
gated sodium channel subtypes: key roles in inflammatory and neuropathic pain.
Int J Biochem Cell Biol 38, 2005–10. https://doi.org/10.1016/j.biocel.2006.06.008
Engel, J., Schultens, H.A., Schild, D., 1999. Small conductance potassium channels cause
an activity-dependent spike frequency adaptation and make the transfer function
of neurons logarithmic. Biophys J 76, 1310–9. https://doi.org/10.1016/S0006-
3495(99)77293-0
Erickson, J.T., Shafer, G., Rossetti, M.D., Wilson, C.G., Deneris, E.S., 2007. Arrest of
5HT neuron differentiation delays respiratory maturation and impairs neonatal
homeostatic responses to environmental challenges. Respir. Physiol. Neurobiol.
159, 85–101. https://doi.org/10.1016/j.resp.2007.06.002
Everitt, B.S., 1996. An introduction to finite mixture distributions. Stat Methods Med Res
5, 107–27.
Feldman, J.L., Del Negro, C.A., 2006. Looking for inspiration: new perspectives on
respiratory rhythm. Nat. Rev. Neurosci. 7, 232–242.
https://doi.org/10.1038/nrn1871

124
Feldman, J.L., Del Negro, C.A., Gray, P.A., 2013. Understanding the rhythm of
breathing: so near, yet so far. Annu. Rev. Physiol. 75, 423–452.
https://doi.org/10.1146/annurev-physiol-040510-130049
Feldman, J.L., Smith, J.C., 1995. Neural control of respiratory pattern in mammals: an
overview, in: Dempsey, J.A., Pack, A.I. (Eds.), Regulation of Breathing. Marcel-
Dekker, New York, N.Y., pp. 39–69.
Ferrante, M., Migliore, M., & Ascoli, G. A., 2013. Functional impact of dendritic branch-
point morphology. J Neurosci, 33(5), 2156-2165.
doi:10.1523/JNEUROSCI.3495-12.2013
Ferreira, T.A., Blackman, A.V., Oyrer, J., Jayabal, S., Chung, A.J., Watt, A.J., Sjostrom,
P.J., van Meyel, D.J., 2014. Neuronal morphometry directly from bitmap images.
Nat Meth 11, 982–984.
Fietkiewicz, C., Loparo, K.A., Wilson, C.G., 2011. Drive latencies in hypoglossal
motoneurons indicate developmental change in the brainstem respiratory network.
J. Neural Eng. 8. https://doi.org/10.1088/1741-2560/8/6/065011
Fogarty, M.J., Kanjhan, R., Bellingham, M.C., Noakes, P.G., 2016. Glycinergic
Neurotransmission: A Potent Regulator of Embryonic Motor Neuron Dendritic
Morphology and Synaptic Plasticity. J Neurosci 36, 80–7.
Forbes, C., Evans, M., Hastings, N., Peacock, B., 2011. Stochastic Modeling, in:
Statistical Distributions. Hoboken, New Jersey, pp. 32–43.
Fregosi, R.F., 2011. Respiratory related control of hypoglossal motoneurons--knowing
what we do not know. Respir Physiol Neurobiol 179, 43–7.
https://doi.org/10.1016/j.resp.2011.06.023
Fregosi, R.F., Pilarski, J.Q., 2008. Prenatal nicotine exposure and development of
nicotinic and fast amino acid-mediated neurotransmission in the control of
breathing. Respir Physiol Neurobiol 164, 80–6.
https://doi.org/10.1016/j.resp.2008.05.008
Fujimoto, S., Yamaguchi, K., Gunjigake, K., 2009. Clinical estimation of mouth
breathing. Am J Orthod Dentofac. Orthop 136, 630 e1–7; discussion 630-1.
https://doi.org/10.1016/j.ajodo.2009.03.034
Fukunishi, Y., Nagase, Y., Yoshida, A., Moritani, M., Honma, S., Hirose, Y., Shigenaga,
Y., 1999. Quantitative analysis of the dendritic architectures of cat hypoglossal
motoneurons stained intracellularly with horseradish peroxidase. J Comp Neurol
405, 345–58.
Fulton, B.P., Walton, K., 1986. Electrophysiological properties of neonatal rat
motoneurones studied in vitro. J Physiol 370, 651–78.

125
García, S., Fernández, A., Luengo, J., Herrera, F., 2010. Advanced nonparametric tests
for multiple comparisons in the design of experiments in computational
intelligence and data mining: Experimental analysis of power. Inf. Sci. 180,
2044–2064. https://doi.org/10.1016/j.ins.2009.12.010
Ghasemi, A., Zahediasl, S., 2012. Normality tests for statistical analysis: a guide for non-
statisticians. Int J Endocrinol Metab 10, 486–9. https://doi.org/10.5812/ijem.3505
Gibb, R., Kolb, B., 1998. A method for vibratome sectioning of Golgi-Cox stained whole
rat brain. J Neurosci Methods 79, 1–4.
Golder, F.J., Zabka, A.G., Bavis, R.W., Baker-Herman, T., Fuller, D.D., Mitchell, G.S.,
2005. Differences in time-dependent hypoxic phrenic responses among inbred rat
strains. J Appl Physiol 1985 98, 838–44.
https://doi.org/10.1152/japplphysiol.00984.2004
González-Castillo, C., Muñoz-Ortiz, E., Guzmán-Brambila, C., Rojas-Mayorquín, A.E.,
Beltran-Parrazal, L., Ortuño-Sahagún, D., Morgado-Valle, C., 2017. Differential
Expression of Ion Channels in Adult and Neonatal Rat Ventral Respiratory
Column. J. Mol. Neurosci. https://doi.org/10.1007/s12031-017-1001-2
Guadiana, S.M., Semple-Rowland, S., Daroszewski, D., Madorsky, I., Breunig, J.J.,
Mykytyn, K., Sarkisian, M.R., 2013. Arborization of dendrites by developing
neocortical neurons is dependent on primary cilia and type 3 adenylyl cyclase. J
Neurosci 33, 2626–38.
Hall, R.L., 2005. Energetics of nose and mouth breathing, body size, body composition,
and nose volume in young adult males and females. Am J Hum Biol 17, 321–30.
https://doi.org/10.1002/ajhb.20122
Harper, R.M., Kinney, H.C., 2010. Potential Mechanisms of Failure in the Sudden Infant
Death Syndrome. Curr. Pediatr. Rev. 6, 39–47.
https://doi.org/10.2174/157339610791317214
Hartigan, J.A., Hartigan, P.M., 1985. The Dip Test of Unimodality. Ann. Stat. 13, 70–84.
Jan, L.Y., Jan, Y.N., 2012. Voltage-gated potassium channels and the diversity of
electrical signalling. J Physiol 590, 2591–9.
https://doi.org/10.1113/jphysiol.2011.224212
Johnston, J., Forsythe, I.D., Kopp-Scheinpflug, C., 2010. Going native: voltage-gated
potassium channels controlling neuronal excitability. J Physiol 588, 3187–200.
https://doi.org/10.1113/jphysiol.2010.191973
Kanjhan, Refik, Fogarty, M.J., Noakes, P.G., Bellingham, M.C., 2016. Developmental
changes in the morphology of mouse hypoglossal motor neurons. Brain Struct.
Funct. 221, 3755–3786. https://doi.org/10.1007/s00429-015-1130-8

126
Kanjhan, R., Noakes, P.G., Bellingham, M.C., 2016. Emerging Roles of Filopodia and
Dendritic Spines in Motoneuron Plasticity during Development and Disease.
Neural Plast 2016, 3423267. https://doi.org/10.1155/2016/3423267
Khazipov, R., Zaynutdinova, D., Ogievetsky, E., Valeeva, G., Mitrukhina, O., Manent, J.-
B., Represa, A., 2015. Atlas of the Postnatal Rat Brain in Stereotaxic Coordinates.
Front. Neuroanat. 9.
Kinney, H.C., 2009. Brainstem mechanisms underlying the sudden infant death
syndrome: evidence from human pathologic studies. Dev Psychobiol 51, 223–33.
https://doi.org/10.1002/dev.20367
Kitamura, S., Nishiguchi, T., Sakai, A., 1983. Location of cell somata and the peripheral
course of axons of the geniohyoid and thyrohyoid motoneurons: a horseradish
peroxidase study in the rat. Exp Neurol 79, 87–96.
Koizumi, H., Wilson, C.G., Wong, S., Yamanishi, T., Koshiya, N., Smith, J.C., 2008.
Functional Imaging, Spatial Reconstruction, and Biophysical Analysis of a
Respiratory Motor Circuit Isolated In Vitro. J. Neurosci. 28, 2353–2365.
Komendantov, A.O., Ascoli, G.A., 2009. Dendritic excitability and neuronal morphology
as determinants of synaptic efficacy. J Neurophysiol 101, 1847–66.
Koyama, Y., 2013. The unending fascination with the Golgi method. OA Anat. 1, 24–31.
Koyama, Y., Nishida, T., Tohyama, M., 2013. Establishment of an optimised protocol for
a Golgi-electron microscopy method based on a Golgi-Cox staining procedure
with a commercial kit. J Neurosci Methods 218, 103–9.
https://doi.org/10.1016/j.jneumeth.2013.05.004
Krichmar, J.L., Nasuto, S.J., Scorcioni, R., Washington, S.D., Ascoli, G.A., 2002. Effects
of dendritic morphology on CA3 pyramidal cell electrophysiology: a simulation
study. Brain Res 941, 11–28.
Lamanauskas, N., Nistri, A., 2008. Riluzole blocks persistent Na+ and Ca2+ currents and
modulates release of glutamate via presynaptic NMDA receptors on neonatal rat
hypoglossal motoneurons in vitro. Eur J Neurosci 27, 2501–14.
Lape, R., Nistri, A., 2001. Characteristics of fast Na(+) current of hypoglossal
motoneurons in a rat brainstem slice preparation. Eur J Neurosci 13, 763–72.
Le Boedec, K., 2016. Sensitivity and specificity of normality tests and consequences on
reference interval accuracy at small sample size: a computer-simulation study.
Vet Clin Pathol 45, 648–656. https://doi.org/10.1111/vcp.12390
Leal, R.B., Gomes, M.C., Granville-Garcia, A.F., Goes, P.S., de Menezes, V.A., 2016.
Impact of breathing patterns on the quality of life of 9- to 10-year-old

127
schoolchildren. Am J Rhinol Allergy 30, 147–52.
https://doi.org/10.2500/ajra.2016.30.4363
Levine, N.D., Rademacher, D.J., Collier, T.J., O’Malley, J.A., Kells, A.P., San Sebastian,
W., Bankiewicz, K.S., Steece-Collier, K., 2013. Advances in thin tissue Golgi-
Cox impregnation: fast, reliable methods for multi-assay analyses in rodent and
non-human primate brain. J Neurosci Methods 213, 214–27.
https://doi.org/10.1016/j.jneumeth.2012.12.001
Lewis, P.R., Flumerfelt, B.A., Shute, C.C., 1971. The use of cholinesterase techniques to
study topographical localization in the hypoglossal nucleus of the rat. J Anat 110,
203–13.
Lindsey, B.G., Rybak, I.A., Smith, J.C., 2012. Computational models and emergent
properties of respiratory neural networks. Compr Physiol 2, 1619–70.
https://doi.org/10.1002/cphy.c110016
Liu, Q., Fehring, C., Lowry, T.F., Wong-Riley, M.T., 2009. Postnatal development of
metabolic rate during normoxia and acute hypoxia in rats: implication for a
sensitive period. J Appl Physiol 1985 106, 1212–22.
https://doi.org/10.1152/japplphysiol.90949.2008
Liu, Q., Lowry, T.F., Wong-Riley, M.T.T., 2006. Postnatal changes in ventilation during
normoxia and acute hypoxia in the rat: implication for a sensitive period. J
Physiol 577, 957–70. https://doi.org/10.1113/jphysiol.2006.121970
Liu, Q., Wong-Riley, M.T.T., 2006. Developmental changes in the expression of GABAA
receptor subunits alpha1, alpha2, and alpha3 in brain stem nuclei of rats. Brain
Res 1098, 129–38.
Liu, Q., Wong-Riley, M.T., 2003. Postnatal changes in cytochrome oxidase expressions
in brain stem nuclei of rats: implications for sensitive periods. J Appl Physiol
1985 95, 2285–91. https://doi.org/10.1152/japplphysiol.00638.2003
Liu, Q., Wong-Riley, M.T.T., 2002. Postnatal expression of neurotransmitters, receptors,
and cytochrome oxidase in the rat pre-Botzinger complex. J. Appl. Physiol. 92,
923–934.
Liu, Y.Y., Wong-Riley, M.T., 2001. Developmental study of cytochrome oxidase activity
in the brain stem respiratory nuclei of postnatal rats. J Appl Physiol 1985 90, 685–
94.
Macari, A.T., Bitar, M.A., Ghafari, J.G., 2012. New insights on age-related association
between nasopharyngeal airway clearance and facial morphology. Orthod
Craniofac Res 15, 188–97. https://doi.org/10.1111/j.1601-6343.2012.01540.x
Marks, W.B., Burke, R.E., 2007a. Simulation of motoneuron morphology in three
dimensions. I. Building individual dendritic trees. J Comp Neurol 503, 685–700.

128
Marks, W.B., Burke, R.E., 2007b. Simulation of motoneuron morphology in three
dimensions. II. Building complete neurons. J Comp Neurol 503, 701–16.
Marsaglia, G., 2006. Ratios of Normal Variables. J. Stat. Softw. 16, 10.
Martin, R.J., Wilson, C.G., 2009. What to do about apnea of prematurity? J Appl Physiol
107, 1015–6. https://doi.org/10.1152/japplphysiol.00940.2009
Martinez-Tellez, R., Gomez-Villalobos Mde, J., Flores, G., 2005. Alteration in dendritic
morphology of cortical neurons in rats with diabetes mellitus induced by
streptozotocin. Brain Res 1048, 108–15.
https://doi.org/10.1016/j.brainres.2005.04.048
McClung, J.R., Goldberg, S.J., 1999. Organization of motoneurons in the dorsal
hypoglossal nucleus that innervate the retrusor muscles of the tongue in the rat.
Anat Rec 254, 222–30.
Mortola, J.P., 1991. Hamsters versus rats: ventilatory responses in adults and newborns.
Respir Physiol 85, 305–17.
Mortola, J.P., 1984. Breathing pattern in newborns. J Appl Physiol Respir Env. Exerc
Physiol 56, 1533–40.
Mortola, J.P., Fisher, J.T., 1981. Mouth and nose resistance in newborn kittens and
puppies. J Appl Physiol Respir Env. Exerc Physiol 51, 641–5.
https://doi.org/10.1152/jappl.1981.51.3.641
Mortola, J.P., Lanthier, C., 2004. Scaling the amplitudes of the circadian pattern of
resting oxygen consumption, body temperature and heart rate in mammals. Comp
Biochem Physiol Mol Integr Physiol 139, 83–95.
https://doi.org/10.1016/j.cbpb.2004.07.007
Myatt, D.R., Hadlington, T., Ascoli, G.A., Nasuto, S.J., 2012. Neuromantic - from semi-
manual to semi-automatic reconstruction of neuron morphology. Front
Neuroinform 6, 4. https://doi.org/10.3389/fninf.2012.00004
Nguyen, Q.T., Wessel, R., Kleinfeld, D., 2004. Developmental regulation of active and
passive membrane properties in rat vibrissa motoneurones. J Physiol 556, 203–19.
https://doi.org/10.1113/jphysiol.2003.060087
Nunez-Abades, P.A., Cameron, W.E., 1997. Relationship between membrane properties
and cell size of developing rat genioglossal motoneurons studied in vitro.
Neurosci Lett 223, 41–4.
Nunez-Abades, P.A., Cameron, W.E., 1995. Morphology of developing rat genioglossal
motoneurons studied in vitro: relative changes in diameter and surface area of
somata and dendrites. J Comp Neurol 353, 129–42.
https://doi.org/10.1002/cne.903530112
129
Nunez-Abades, P.A., He, F., Barrionuevo, G., Cameron, W.E., 1994. Morphology of
developing rat genioglossal motoneurons studied in vitro: changes in length,
branching pattern, and spatial distribution of dendrites. J Comp Neurol 339, 401–
20. https://doi.org/10.1002/cne.903390308
Nunez-Abades, P.A., Spielmann, J.M., Barrionuevo, G., Cameron, W.E., 1993. In vitro
electrophysiology of developing genioglossal motoneurons in the rat. J
Neurophysiol 70, 1401–11.
Odutola, A.B., 1976. Cell grouping and Golgi architecture of the hypoglossal nucleus of
the rat. Exp Neurol 52, 356–71.
Padzys, G.S., Thornton, S.N., Martrette, J.M., Trabalon, M., 2011. Effects of short term
forced oral breathing in rat pups on weight gain, hydration and stress. Physiol
Behav 102, 175–80. https://doi.org/10.1016/j.physbeh.2010.10.018
Powell, G.L., Gaddy, J., Xu, F., Fregosi, R.F., Levine, R.B., 2016. Developmental
Nicotine Exposure disrupts dendritic arborization patterns of hypoglossal
motoneurons in the neonatal rat. Dev Neurobiol.
https://doi.org/10.1002/dneu.22379
Powers, R.K., Binder, M.D., 2003. Persistent sodium and calcium currents in rat
hypoglossal motoneurons. J Neurophysiol 89, 615–24.
https://doi.org/10.1152/jn.00241.2002
Powers, R.K., Sawczuk, A., Musick, J.R., Binder, M.D., 1999. Multiple mechanisms of
spike-frequency adaptation in motoneurones. J Physiol Paris 93, 101–14.
Preibisch, S., Saalfeld, S., Tomancak, P., 2009. Globally optimal stitching of tiled 3D
microscopic image acquisitions. Bioinformatics 25, 1463–1465.
Purvis, L.K., Butera, R.J., 2005. Ionic current model of a hypoglossal motoneuron. J
Neurophysiol 93, 723–33. https://doi.org/10.1152/jn.00703.2004
Ranjan, A., Mallick, B.N., 2012. Differential staining of glia and neurons by modified
Golgi-Cox method. J Neurosci Methods 209, 269–79.
https://doi.org/10.1016/j.jneumeth.2012.06.023
Rourke, K.S., Mayer, C.A., MacFarlane, P.M., 2016. A critical postnatal period of
heightened vulnerability to lipopolysaccharide. Respir Physiol Neurobiol 232, 26–
34. https://doi.org/10.1016/j.resp.2016.06.003
Sant’Anna, G.M., Mortola, J.P., 2003. Thermal and respiratory control in young rats
exposed to cold during postnatal development. Comp Biochem Physiol Mol
Integr Physiol 134, 449–59.
Sant’Anna, G.M., Mortola, J.P., 2002. Thermal and respiratory control in young rats with
altered caloric intake during postnatal development. Respir Physiol Neurobiol

130
133, 215–27.
Sengupta, P., 2013. The Laboratory Rat: Relating Its Age With Human’s. Int J Prev Med
4, 624–30.
Sholl, D.A., 1950. A discussion on the measurement of growth and form; the theory of
differential growth analysis. Proc R Soc Lond B Biol Sci 137, 470–4.
Smith, J.C., Butera, R.J., Koshiya, N., Negro, C.D., Wilson, C.G., Johnson, S.M., 2000.
Respiratory rhythm generation in neonatal and adult mammals: the hybrid
pacemaker-network model. Respir. Physiol. 122, 131–147.
Smith, J.C., Ellenberger, H.H., Ballanyi, K., Richter, D.W., Feldman, J.L., 1991. Pre-
Bötzinger complex: a brainstem region that may generate respiratory rhythm in
mammals. Science 254, 726–729.
Standard Practice for Characterization of Particles (No. F 1877-98), 2003. ASTM.
Strohl, K.P., Thomas, A.J., St Jean, P., Schlenker, E.H., Koletsky, R.J., Schork, N.J.,
1997. Ventilation and metabolism among rat strains. J Appl Physiol 1985 82,
317–23. https://doi.org/10.1152/jappl.1997.82.1.317
Takasu, N., Hashimoto, P.H., 1988. Morphological identification of an interneuron in the
hypoglossal nucleus of the rat: a combined Golgi-electron microscopic study. J
Comp Neurol 271, 461–71. https://doi.org/10.1002/cne.902710313
Thoby-Brisson, M., Ramirez, J.-M., 2001. Identification of Two Types of Inspiratory
Pacemaker Neurons in the Isolated Respiratory Neural Network of Mice. J.
Neurophysiol. 86, 104–112.
Thoby-Brisson, M., Ramirez, J.-M., 2000. Role of Inspiratory Pacemaker Neurons in
Mediating the Hypoxic Response of the Respiratory Network \emphIn Vitro. J.
Neurosci. 20, 5858–5866.
Vacher, H., Mohapatra, D.P., Trimmer, J.S., 2008. Localization and targeting of voltage-
dependent ion channels in mammalian central neurons. Physiol Rev 88, 1407–47.
https://doi.org/10.1152/physrev.00002.2008
Wong-Riley, M.T., Liu, Q., 2005. Neurochemical development of brain stem nuclei
involved in the control of respiration. Respir Physiol Neurobiol 149, 83–98.
https://doi.org/10.1016/j.resp.2005.01.011
Wong-Riley, M.T., Liu, Q., Gao, X.P., 2013. Peripheral-central chemoreceptor
interaction and the significance of a critical period in the development of
respiratory control. Respir Physiol Neurobiol 185, 156–69.
https://doi.org/10.1016/j.resp.2012.05.026

131
Yang, X.X., Powell, W.S., Xu, L.J., Martin, J.G., 1999. Strain dependence of the airway
response to dry-gas hyperpnea challenge in the rat. J Appl Physiol 1985 86, 152–
8. https://doi.org/10.1152/jappl.1999.86.1.152
Yoshimoto, R., Iwasaki, S., Takago, H., Nakajima, T., Sahara, Y., Kitamura, K., 2015.
Developmental increase in hyperpolarization-activated current regulates intrinsic
firing properties in rat vestibular ganglion cells. Neuroscience 284, 632–42.
https://doi.org/10.1016/j.neuroscience.2014.10.034
Yu, F.H., Catterall, W.A., 2003. Overview of the voltage-gated sodium channel family.
Genome Biol 4, 207.
Zubler, F., Douglas, R., 2009. A Framework for Modeling the Growth and Development
of Neurons and Networks. Front. Comput. Neurosci. 3, 25.