changes in the spatial and temporal distribution of gray ... is presumed that the species was making...
TRANSCRIPT
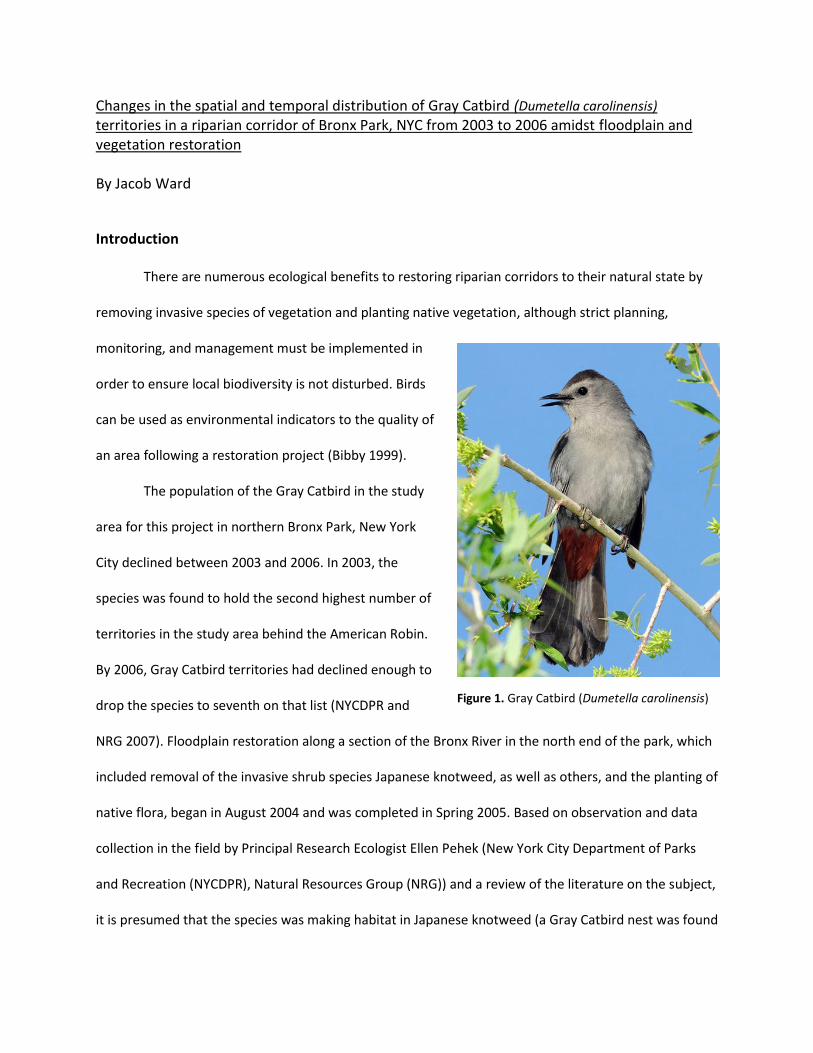
Changes in the spatial and temporal distribution of Gray Catbird (Dumetella carolinensis) territories in a riparian corridor of Bronx Park, NYC from 2003 to 2006 amidst floodplain and vegetation restoration By Jacob Ward
Introduction
There are numerous ecological benefits to restoring riparian corridors to their natural state by
removing invasive species of vegetation and planting native vegetation, although strict planning,
monitoring, and management must be implemented in
order to ensure local biodiversity is not disturbed. Birds
can be used as environmental indicators to the quality of
an area following a restoration project (Bibby 1999).
The population of the Gray Catbird in the study
area for this project in northern Bronx Park, New York
City declined between 2003 and 2006. In 2003, the
species was found to hold the second highest number of
territories in the study area behind the American Robin.
By 2006, Gray Catbird territories had declined enough to
drop the species to seventh on that list (NYCDPR and
NRG 2007). Floodplain restoration along a section of the Bronx River in the north end of the park, which
included removal of the invasive shrub species Japanese knotweed, as well as others, and the planting of
native flora, began in August 2004 and was completed in Spring 2005. Based on observation and data
collection in the field by Principal Research Ecologist Ellen Pehek (New York City Department of Parks
and Recreation (NYCDPR), Natural Resources Group (NRG)) and a review of the literature on the subject,
it is presumed that the species was making habitat in Japanese knotweed (a Gray Catbird nest was found
Figure 1. Gray Catbird (Dumetella carolinensis)

2
in Japanese knotweed in late June 2003) and that its removal was a significant factor in reductions in
Gray Catbird territories within the study area.
Research on Gray Catbird (Dumetella carolinensis) populations in various locations throughout
North America has shown the species to be relatively tolerant of less than natural conditions. A species
named for its “meow-like” birdcall, the Gray
Catbird is able to adapt to many harsh and
changing environments. With a preferred habitat
of low, dense shrubs, Gray Catbirds have been
found to be tolerant of fragmented and isolated
patches, often breeding in urban parks (Dowd
1992, Morgan et al 2007). Gray Catbirds have
been found in at least one case to have higher
nesting success in invasive species of vegetation than native (Schlossberg and King 2010). Coupled with
their high tolerance to human interaction and habitat alterations (provided shrubby habitat remains
present), Gray Catbirds are well suited to breed in city parks, urban forested wetlands, and
campgrounds (Dowd 1992).
The research question for this project is:
Did the removal of Japanese knotweed during a floodplain restoration project completed in 2005 in the study area negatively impact Gray Catbird sub-populations between 2003 and 2006?
To attempt to answer this question, territory maps were generated for the Gray Catbird in the
study area for 2003 and 2006 using ArcGIS 10. The maps were derived from observations recorded in
breeding bird surveys using the spot mapping method outlined in Bibby’s Bird Census Techniques (1992).
Spot mapping involves a data collector recording all bird observations (seen or heard) in a simple survey
Figure 2. Invasive Japanese knotweed (right of path).
3
map, including relevant attributes to generate territory maps for each species. The territory maps were
used to “weight” each observation as being within a confirmed, probable, or possible territory. The
weighted observations were then compared to the distribution of Japanese knotweed in the study area
to assess changes in the spatial distribution of Gray Catbird territories relative to changes in the spatial
distribution of Japanese knotweed. The original hypothesis was that Gray Catbird sub-populations
declined in areas where Japanese knotweed was removed. This was found to be true, although further
research is needed to determine if other variables were influencing the species, either separate from or
in combination with changes in Japanese knotweed distribution.
Study Area
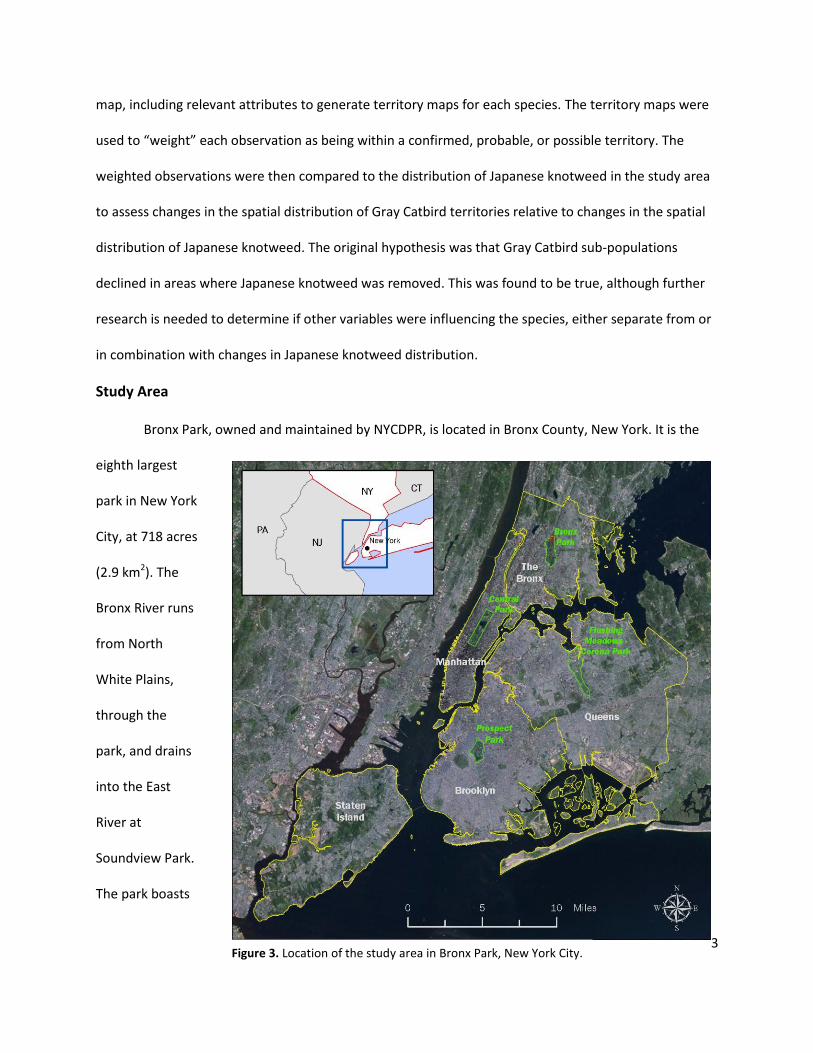
Bronx Park, owned and maintained by NYCDPR, is located in Bronx County, New York. It is the
eighth largest
park in New York
City, at 718 acres
(2.9 km2). The
Bronx River runs
from North
White Plains,
through the
park, and drains
into the East
River at
Soundview Park.
The park boasts
Figure 3. Location of the study area in Bronx Park, New York City.
4
a myriad of plants and animals that make their habitat along the banks of the 2-mile riparian corridor
and in the surrounding forest. Home to the Bronx Zoo and New York Botanical Garden, as well as
numerous playgrounds, athletic fields and bicycle paths, the park serves as a recreational area for
surrounding residents and visitors (NYCDPR 2011).
The area of interest for this
study, encompassing
approximately 29 acres along an
approximately 550-meter long
section of the Bronx River, is
located at the northern end of the
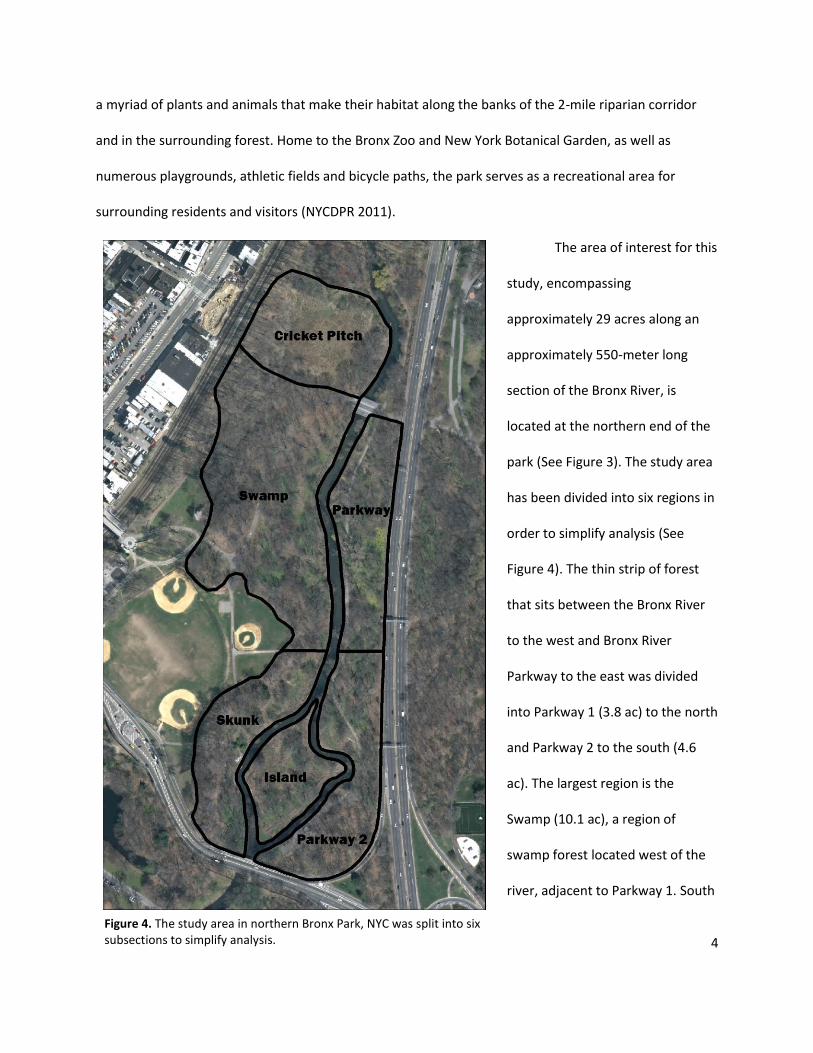
park (See Figure 3). The study area
has been divided into six regions in
order to simplify analysis (See
Figure 4). The thin strip of forest
that sits between the Bronx River
to the west and Bronx River
Parkway to the east was divided
into Parkway 1 (3.8 ac) to the north
and Parkway 2 to the south (4.6
ac). The largest region is the
Swamp (10.1 ac), a region of
swamp forest located west of the
river, adjacent to Parkway 1. South
Figure 4. The study area in northern Bronx Park, NYC was split into six subsections to simplify analysis.

5
of the Swamp region and west of the river is a strip of mature forest with skunk cabbage, mayapple, and
trout lily, dubbed the Skunk region (3.9 ac).The Island region exists between the Skunk and Parkway 2
regions (2.3 ac). The northern end of the study area is capped by the Cricket Pitch (4.3 ac), a region
containing an abandoned playing field that New York City’s Natural Resources Group (NRG) replanted
with wetland vegetation. The Cricket Pitch region was added to the study area for the 2006 bird census
(NYCDPR, NRG 2007).
New York City, as well as many other areas in the eastern and northeastern U.S., has very high
habitat suitability for Japanese knotweed, a highly invasive perennial weed (Barney et al 2008).
Floodplain restoration along the Bronx River in the study area from 2004-2005 included the removal of
large areas of Japanese knotweed to make way for the planting of native flora. The invasive species of
vegetation was commonly growing in the Bronx Park study area in dense stands over eight feet tall,
accelerating the natural accretion of sediment that forms along the river banks, thus limiting access to
the river and visibility (NYCDPR, NRG 2007).
Literature Review
Indicators can be used to quantify complex phenomena spatially and temporally to identify
trends and patterns. Some basic properties of effective indicators are that they must be quantitative and
non-ambiguous, simple, relevant to policy, scientifically credible, responsive to change, easily
understood by non-experts, realistic to collect, and able to be analyzed. It is difficult to find indicators
that meet all of these properties because they are often conflicting. Birds are considered good
environmental indicators because they fulfill many of these properties. Birds are an important
component of biodiversity and the preservation of biodiversity is part of environmental quality and
sustainability (Bibby 1999). Since the early 1990s, the breeding bird survey has become a powerful tool
in collecting information relative to breeding bird censuses, habitats, bird species interactions, and

6
territories. This method is cost-effective and has the potential to maximize the chances of highlighting
trends relative to environmental pressures (Bibby 1999).
In a study conducted by Peak and Thompson (2006) in northeastern Missouri in the 2000-2001
breeding seasons, bird surveys were collected using the spot-mapping method to determine if narrow
forested-riparian areas would have a greater density of grassland-shrub nesting species like the Gray
Catbird and a lesser density of forest area-sensitive avian species. The study also sought to determine if
forested-riparian areas with adjacent grassland-shrub buffer strips would have a greater density of
grassland-shrub-nesting species than forested-riparian areas without adjacent grassland-shrub buffer
strips (Peak and Thompson III 2006). For the Gray Catbird, a species associated with low-lying, dense,
shrubby habitat (Cimprich and Moore 1995), they found that the species density was negatively
associated with wide forested-riparian areas and the presence of riparian buffer strips positively
affected species density.
Habitat fragmentation can often have negative impacts on the reproductive success of birds and
animals. Parks in urban areas such as New York City are representative of fragmented habitats. Morgan
et al. (2007) completed a study to analyze the productivity of Gray Catbirds and yellow-breasted Chats in
a fragmented riparian system in southern British Columbia during the 2002-2003 breeding season. The
habitat fragmentation in the study area is a result of frequent flooding, ephemeral water sources, and
mountainous topography (Hejl 1992). They analyzed four large continuous riparian patches of 15-70
hectares in area, as well as five small isolated patches of less than two hectares. Analysis of spot
mapping surveys collected for the 2002-2003 breeding season revealed no evidence that fragmentation
or isolation of riparian habitats in a western landscape reduced reproductive success of either species.
They found nesting dates to be later in the season in isolated patches, although this had no impact on
reproductive success. They suggest that although quality may be similar, continuous patches may be

7
preferable to isolated patches simply due to the availability of more breeding resources (Morgan et al
2007).
In a complex multi-scale analysis of species-environment relationships of breeding birds in pitch
pine-scrub oak habitats, Grand and Cushman (2003) found landscape level factors to be the most
influential on Gray Catbird populations out of three environmental variables: plot, patch, and landscape.
The landscape level variables included six different land cover classes that were abundant in their study
area in Plymouth County, MA, as well as fifteen landscape configuration metrics and one class metric
(percentage of landscape area held by each land cover class) at five different scales. They suggest that
managing for landscape composition and configuration could benefit the Gray Catbird species, keeping
in mind that landscape characteristics vary with scale.
In a two-year study conducted at two urban, forested wetlands in Staten Island, New York City,
spot mapping censuses from early May to late June for the 1989 and 1990 avian breeding seasons
revealed interesting results about the Gray Catbird. Destruction of wetland vegetation from
construction, filling, and dumping of septic waste allowed for the introduction and spread of many
invasive species of vegetation, to include Phragmites communis, Japanese knotweed, Polygonum
cuspidatum, Japanese honeysuckle, Lonicera japonica, poison ivy, Rhus radicans, multiflora rose, Rosa
multiflora and greenbrier, and Smilax rotundifolia. The Gray Catbird was found to tolerate nearby
residential development as long as dense shrub habitat existed. At Richmond Creek, the Gray Catbird
preferred dense vegetation where wetland shrubs mixed with multiflora rose and greenbrier (invasive
species). At Latourette Park, the species thrived in areas of dense understory and greenbrier in areas
regenerating from storm and fire destruction (Dowd 1992).
Many bird species prefer invasive plants over native plants for nesting (Hecksher 2004). In a
recent study conducted by Schlossberg and King (2010) in western Massuchusetts in 2004 and 2005,

8
they found that Gray Catbirds had higher nesting success in invasive plants than in natives. Although
nesting cover was not quantified, the authors suggest that due to Catbirds having larger nests than
other species in their sample, the Catbirds may have benefited from the increased cover that invasive
species offer (Baicich and Harrison 1997).

9
Methods
Data Collection
The data used in
this analysis were collected
by Research Ecologists Ellen
Pehek and Susan Stanley
(NYCDPR). The data in the
form of breeding bird
surveys were collected using
the methods outlined in
Bibby’s Bird Census
Techniques (1992). Eight
surveys were conducted for
each year (2003 and 2006)
during the spring/summer
breeding season from May
to July. For each date
surveyed, all birds seen or
heard (except those flying
high overhead) from various
locations throughout the study area were documented using species codes and behavioral symbols (i.e.
singing, calling, visual, flying). When gender, juvenile status, and movement could be identified, those
characteristics were indicated as well. Weather, temperature, and start and finish times were included
Figure 5. Example of a breeding bird survey used in this study.
10
for most surveys. Data were collected for 2-3 hours just after sunrise between 5:40 AM and 9:55 AM for
all dates in order to make observations during times of heightened bird detectability (Shields 1977). To
minimize disturbance and equally weight all regions of the study area at all times, survey routes were
rotated for each visit date
within a season. Figure 5 above
shows a sample breeding bird
survey used in this study.
Data Entry and Preparation
All scanned breeding bird
surveys were geo-referenced in
ArcGIS 10 to the NAD83 Long
Island, New York (FIPS 3104)
State Plane coordinate system
in US survey feet. The most
current (2008) high-resolution
(2-ft) orthoimagery available for
the study area was used as the
reference image. The imagery
was downloaded from the
United States Geological Survey
(USGS) website using their
Seamless Server. Although the
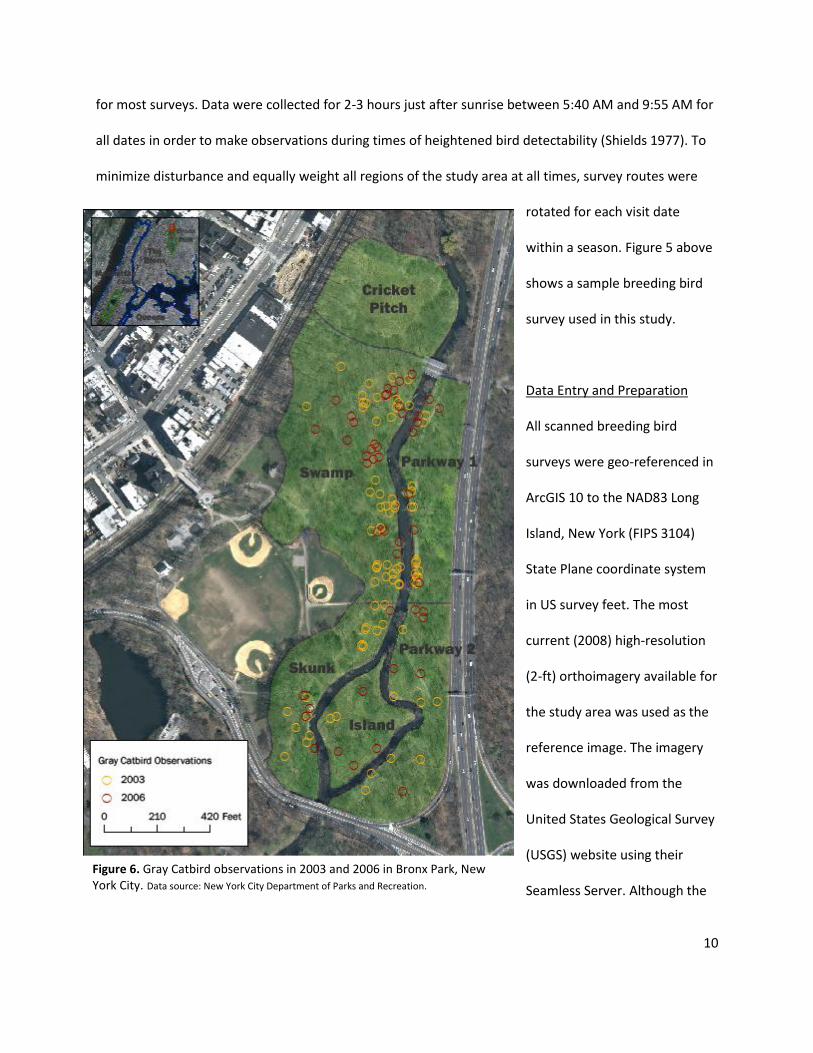
Figure 6. Gray Catbird observations in 2003 and 2006 in Bronx Park, New York City. Data source: New York City Department of Parks and Recreation.

11
breeding bird surveys contained all species observed, point features were digitized only for the Gray
Catbird. Attributes recorded for the points included gender, behavior (singing, calling, flying, fighting,
etc.), juvenile/adult, feeding/fledgling, weather and temperature, and start and finish times of the
survey. Figure 6 above depicts the raw observations of Gray Catbird for both years in the study.
Analysis
The first objective in this analysis was to validate the data points collected by the surveyors in 2006.
NYCDPR research ecologists Ellen Pehek and Susan Stanley surveyed the study area together in 2006,
but filled out their own breeding bird surveys, so both of their surveys were used to validate
observations. Points found in the same general region (within 30 feet) on a given date by both observers
were considered the same observation. Observations that were clearly unique (outside the 30-ft
threshold) were kept in the dataset.
The second objective was to create species maps delineating possible, probable, and confirmed Gray
Catbird territories in the study area for both years using the methods outlined in Chapter 3 of Bird
Census Techniques (Bibby 1992). The basic guidelines for generating the territories are as follows:
For a territory to be classified as confirmed, at least one of the following situations must have been observed:
o Singing bird in the area on at least three consecutive visits o An active nest o Bird carrying fecal sac o Bird carrying food o Unfledged or recently fledged young o Distraction display or injury-feigning
For a territory to be classified as probable, at least one of the following situations must have been observed:
o Singing bird in the area on more than one visit (not necessarily consecutive) o Pair in suitable breeding habitat o Chasing of conspecifics, agitated behavior, or anxiety calls o Bird carrying nesting material or excavation of a nesting hole o Courtship and display
12
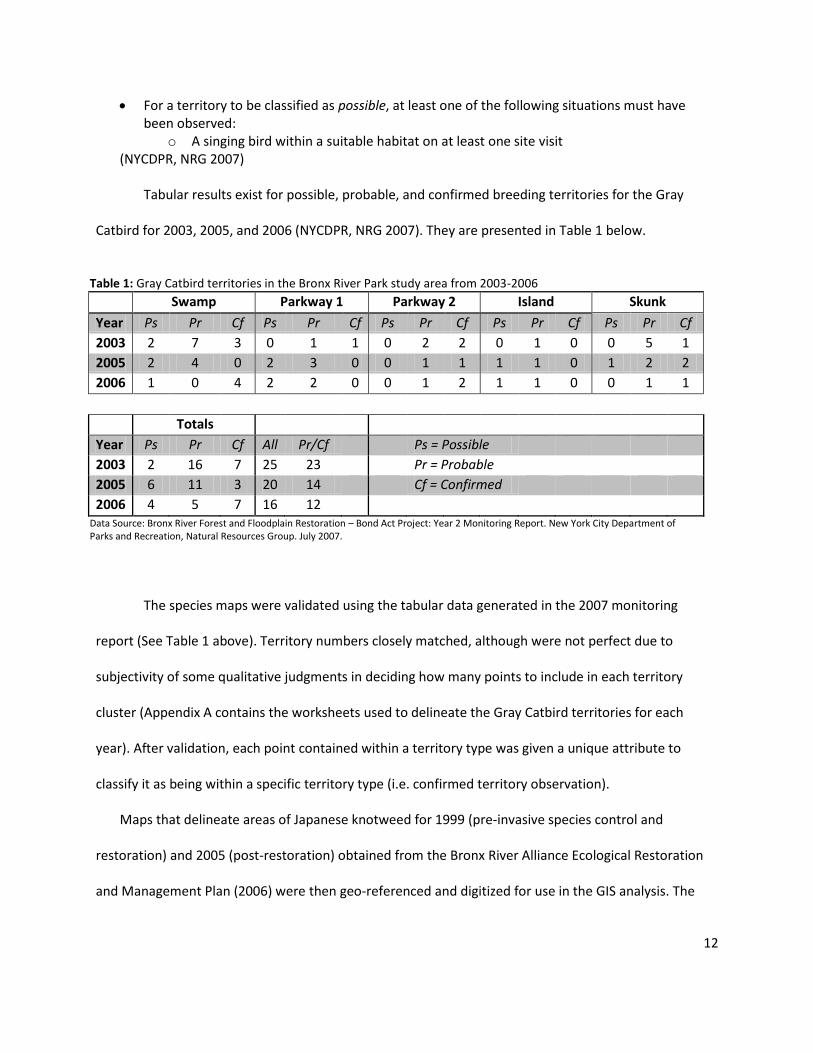
For a territory to be classified as possible, at least one of the following situations must have been observed:
o A singing bird within a suitable habitat on at least one site visit (NYCDPR, NRG 2007)
Tabular results exist for possible, probable, and confirmed breeding territories for the Gray
Catbird for 2003, 2005, and 2006 (NYCDPR, NRG 2007). They are presented in Table 1 below.
Table 1: Gray Catbird territories in the Bronx River Park study area from 2003-2006
Swamp Parkway 1 Parkway 2 Island Skunk
Year Ps Pr Cf Ps Pr Cf Ps Pr Cf Ps Pr Cf Ps Pr Cf
2003 2 7 3 0 1 1 0 2 2 0 1 0 0 5 1
2005 2 4 0 2 3 0 0 1 1 1 1 0 1 2 2
2006 1 0 4 2 2 0 0 1 2 1 1 0 0 1 1
Totals
Year Ps Pr Cf All Pr/Cf Ps = Possible
2003 2 16 7 25 23 Pr = Probable
2005 6 11 3 20 14 Cf = Confirmed
2006 4 5 7 16 12 Data Source: Bronx River Forest and Floodplain Restoration – Bond Act Project: Year 2 Monitoring Report. New York City Department of Parks and Recreation, Natural Resources Group. July 2007.
The species maps were validated using the tabular data generated in the 2007 monitoring
report (See Table 1 above). Territory numbers closely matched, although were not perfect due to
subjectivity of some qualitative judgments in deciding how many points to include in each territory
cluster (Appendix A contains the worksheets used to delineate the Gray Catbird territories for each
year). After validation, each point contained within a territory type was given a unique attribute to
classify it as being within a specific territory type (i.e. confirmed territory observation).
Maps that delineate areas of Japanese knotweed for 1999 (pre-invasive species control and
restoration) and 2005 (post-restoration) obtained from the Bronx River Alliance Ecological Restoration
and Management Plan (2006) were then geo-referenced and digitized for use in the GIS analysis. The

13
knotweed data for 2005 contained areas where knotweed was present, as well as areas where
knotweed was one of the top three species of vegetation. The 2005 data were used to represent
knotweed distribution in 2006 assuming similar post-restoration conditions existed for both years
(NYCDPR provided a shapefile delineating areas where knotweed was present in 2002 to be used as
representative of knotweed distribution in 2003, although the shapefile did not contain areas where
knotweed was one of the top three species of vegetation). The 1999 knotweed data derived from the
Bronx River Alliance report (2006) contained areas where knotweed was one of the top three species of
vegetation. These data were used to represent composition in 2002 under the assumption that
distribution of knotweed had not declined from 1999-2003.
The Gray Catbird observations classified by territory type were related to the spatial distribution of
Japanese knotweed in the study area for each year using simple spatial analysis techniques in ArcGIS 10.
First, 30-ft buffers were generated around the knotweed areas assuming some distance error exists
from the process of spot-mapping to digitization. Gray Catbird observations by territory type (confirmed,
probable, and, possible) were then identified within the knotweed buffer zones using the select by
location tool. This was done for all territory types in both years for areas where knotweed was present,
as well as areas where knotweed was known to be one of the top three vegetation species. The results
of this analysis are presented below.

14
Figure 7. Confirmed, probable, and possible Gray Catbird (GRCA) territories in the study area in 2003 relative to distribution of Japanese knotweed. Data courtesy of the New York City Department of Parks and Recreation and the Bronx River
Alliance.
Results
15
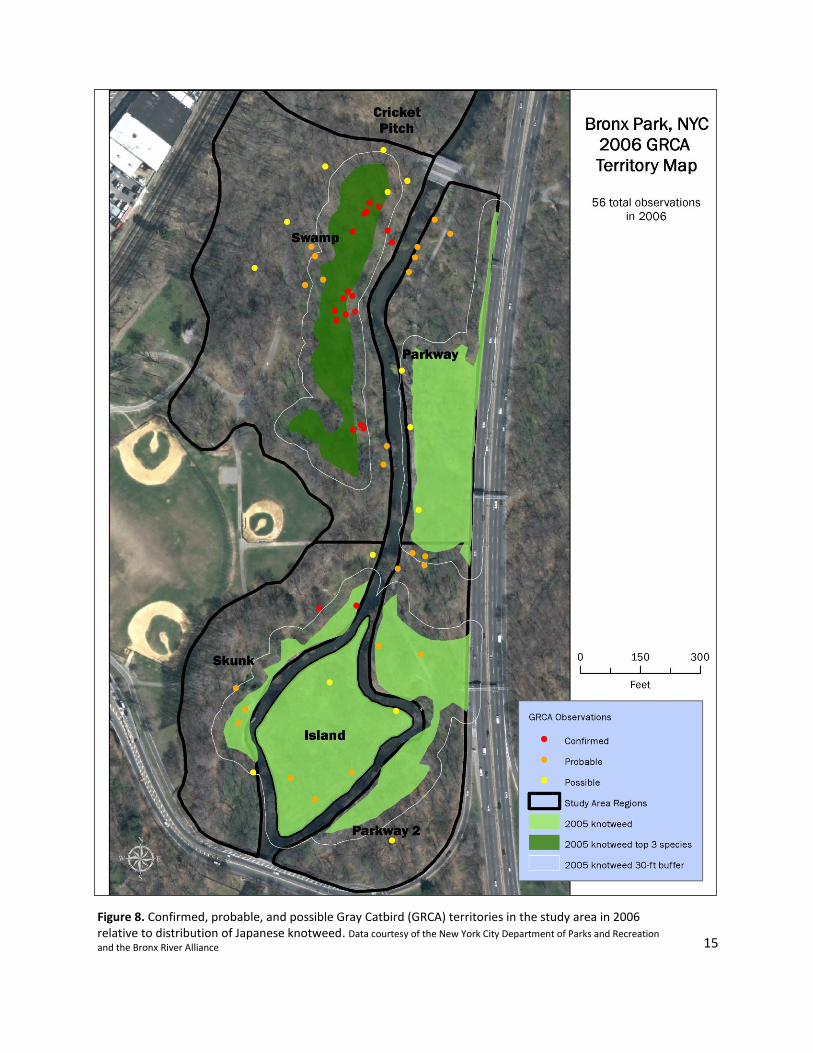
Figure 8. Confirmed, probable, and possible Gray Catbird (GRCA) territories in the study area in 2006 relative to distribution of Japanese knotweed. Data courtesy of the New York City Department of Parks and Recreation
and the Bronx River Alliance

16
Figure 9. Graphed percentages of 2003 GRCA observations found within 30 feet of Japanese knotweed (by territory classification).
0%
10%
20%
30%
40%
50%
60%
70%
80%
90%
Confirmed Territory
(n=34)
Probable Territory
(n=37)
Possible Territory
(n=9)
2003 GRCA Observations in Bronx Park, NYC
in areas with knotweed present
in areas with knotweed as top 3 species (from 1999 knotweed
inventory)
2003 GRCA Observations (n=80)
Knotweed Present (Top 3 species)
in areas with knotweed present
in areas with knotweed as top 3 species (from 1999 knotweed inventory)
Confirmed Territory (n=34) 28 (18) 82.4% 52.9%
Probable Territory (n=37) 29 (21) 78.4% 56.8%
Possible Territory (n=9) 5 (1) 55.6% 11.1%
Total 62 (40) 77.5% 50.0%
Table 2. Percentages of 2003 GRCA observations found within 30 feet of Japanese knotweed (by territory classification).

17
0%
10%
20%
30%
40%
50%
60%
70%
80%
90%
Confirmed Territory
(n=19)
Probable Territory
(n=23)
Possible Territory
(n=14)
2006 GRCA Observations in Bronx Park, NYC
in areas w/ knotweed present
in areas of knotweed as top 3 species (2005)
Figure 10. Graphed percentages of 2006 GRCA observations found within 30 feet of Japanese knotweed (by territory classification).
2006 GRCA Observations (n=56)
Knotweed Present (Top 3 species)
in areas with knotweed present
in areas with knotweed as top 3 species (2005)
Confirmed Territory (n=19) 16 (15) 84.2% 78.9%
Probable Territory (n=23) 11 (2) 47.8% 8.7%
Possible Territory (n=14) 7 (1) 50.0% 7.1%
Total 34 (18) 60.7% 32.1%
The results of the territory mapping revealed Gray Catbird (GRCA) confirmed and probable
territories to be widespread throughout the Swamp region relatively close to the river in 2003. The
Parkway region contained a substantial grouping of confirmed territory observations at the southern
Table 3. Percentages of 2006 GRCA observations found within 30 feet of Japanese knotweed (by territory classification).

18
end very close to the bank. There were two concentrated areas of probable territory within the Parkway
region. The northern Skunk region contained confirmed GRCA territory, as well as probable territory
distributed throughout. The Island and Parkway 2 regions contained no confirmed territories, but did
contain some sparsely distributed probable territories (See Figure 7).
Confirmed and probable GRCA territories in 2003 exhibited a similar relationship to Japanese
knotweed distribution in the area, both for areas with knotweed present and areas with knotweed as
one of the top three vegetation species. Approximately 80% of confirmed and probable territory GRCA
observations were found within 30 feet of areas where knotweed was present. 50-60% of those
observations were found within 30 feet of areas where knotweed was one of the top three vegetation
species. Possible territories were less associated with proximity to knotweed, especially in areas of
knotweed as one of the top three species (11.1 % of possible territory GRCA observations) (See Table 2
and Figure 9).
In 2006, the Swamp region contained three substantial areas of confirmed territory GRCA
observations, with one area of probable territory in the north, and possible territory observations
distributed throughout the northern end of the region. The Skunk region was the only other region
containing confirmed territory, located at the northern end of the region, with one probable territory
near the center. The Parkway, Parkway 2, and Island regions contained few and sparsely distributed
probable and possible territories. A noteworthy result of the territory analysis was that the substantial
confirmed territory in the Parkway region in 2003 was absent in 2006.
Confirmed territory GRCA observations were highly associated with the distribution of Japanese
knotweed in 2006. Nearly 85% of all confirmed territory observations were located within 30 feet of
areas where knotweed was present and almost 80% of all confirmed territory observations were located
within 30 feet of areas where knotweed was one of the top three vegetation species. Probable territory

19
GRCA observations were less associated with the distribution of knotweed in the study area than in
2003. Probable territory observations were much less associated with knotweed distribution than in
2003, and possible territory observations were slightly less associated (See Table 3 and Figure 10).
Discussion
It was important to establish confirmed, probable, and possible Gray Catbird territories in order
to more accurately identify the areas where the species was breeding in both years. The territory
delineation analysis allowed for the “weighting” of separate observations in the quantitative analysis of
the relationship between Gray Catbird observations and the distribution of Japanese knotweed.
It was very interesting to find that confirmed Gray Catbird territories were highly associated
with the distribution of knotweed in both years. The most noteworthy results indicating this association
were the increases in number of confirmed territory observations found in areas where knotweed was
present, but especially in areas of knotweed in the top three species of vegetation. A corridor of
knotweed present in 2003 in the Swamp region became an area of knotweed as the top three species of
vegetation in 2006. All confirmed territories located within that corridor remained intact. A confirmed
territory in the southern area of the Swamp region in 2003 located in an area of knotweed as a top three
species of vegetation was absent in 2006 after the knotweed was removed. Also noteworthy is the
finding that the confirmed territory in the Parkway region in 2003 (located in an area of knotweed as
one of the top three species of vegetation) was absent in 2006 after the area of knotweed was
downgraded to knotweed present after the completion of the restoration project. It is interesting that
the probable and possible territories were less associated with the distribution of knotweed than
confirmed territories in 2006. Gray Catbirds may have been breeding in other types of vegetation in the
area in both years, but prefer the invasive knotweed.
20
Conclusion and Avenues for Further Research
It was expected to find that Gray Catbird territories declined from 2003 to 2006 in areas where
Japanese knotweed was removed based on field observation and a review of the literature. The results
of this analysis provided enough evidence to conclude that the removal of Japanese knotweed was a
significant factor in the population and territory decline of the Gray Catbird. More extensive research
would be required to analyze the distribution of native shrub species that existed in the area before
restoration and the native shrub species that were planted as part of the restoration efforts. It could
then be determined what other suitable habitat existed in the area for the Gray Catbird.
It would be beneficial to look at the change in total area of native shrub vegetation in
combination with the invasive species over the time period to establish if overall shrub density impacted
the species. According to the Floodplain Restoration Year 2 Monitoring Report (NYCDPR, NRG 2007), the
number of territories held by other bird species increased significantly, particularly for the red-winged
blackbird and warbling vireo. New bird species were also found in 2006 that were not found in 2003. It
would be beneficial to determine if increases in the territories of other birds and new bird species
attracted to the area worked against successful breeding of Gray Catbirds (Zavaleta et al 2001).
It is yet another curiosity if the decrease of Gray Catbird population and territories had a
negative impact on the environmental quality of the study area, or if the decrease in these territories
was a move to be more in balance with other bird species in the area. A reduction in Gray Catbird
territories may not have been a negative occurrence if biodiversity increased as a result of the floodplain
restoration.
References
Baicich, P.J. & Harrison, C.J.O. A guide to the nests, eggs, and nestlings of North American birds. New York: Academic Press, 1997.

21
Barney, J.N., Whitlow, T.H., and Lembo Jr., A.J. 2008. Revealing Historic Invasion Patterns and Potential Invasion Sites for Two Non-Native Plant Species. PLoS ONE 3(2):1-8. Bibby, C.J. Bird Census Techniques. Academic Press, 1992.
Bibby, C.J. 1999. Making the most of birds as environmental indicators. Ostrich: The Journal of African Ornithology 70(1)81-88. Bronx River Alliance. May 2006. Ecological Restoration and Management Plan, Ch. 3: State of the River. Cimprich, D. A., and F. R. Moore. 1995. Gray catbird (Dumetella carolinensis). Number 167 in A. Poole and F. Gill, editors. The birds of North America. The Academy of Natural Sciences, Philadelphia, Pennsylvania, USA; and The American Ornithologists' Union, Washington, D.C., USA.
Dowd, C. 1992. Effect of Development on Bird Species Composition of Two Urban Forested Wetlands in Staten Island, New York. Journal of Field Ornithology 63 (4): 455-461.
Grand, J., and Cushman, S.A.. 2003. A multi-scale analysis of species-environment relationships: breeding birds in a pitch pine–scrub oak (Pinus rigida–Quercus ilicifolia) community. Biological Conservation 112(3):307-317. Heckscher, C.M. (2004). Veery nest sites in a Mid-Atlantic Piedmont forest: vegetative physiognomy and use of alien shrubs. Am. Midl. Nat. 151, 326–337. Hejl, S. J. 1992. The importance of landscape patterns to bird diversity: a perspective from the northern Rocky Mountains. Northwest Environmental Journal 8:119-137. Keller, C. M. E., C. S. Robbins, and J. S. Hatfield. 1993. Avian communities in riparian forests of different widths in Maryland and Delaware. Wetlands 13: 137-144.
Kilgo, J. C., R. A. Sargent, B. R. Chapman, and K. V. Miller. 1998. Effect of stand width and adjacent habitat on breeding bird communities in bottomland hardwoods. Journal of Wildlife Management 62:72-83.
Lent, R. A. 1990. Relationships among environmental factors, phenotypic characteristics, and fitness components in the Gray Catbird (Dumetella carolinensis). Phd Thesis. State Univ. of New York at Stony Brook, Stony Brook.
Morgan, T.C., Bishop, C.A., and Williams, T.D. 2007. Yellow-breasted Chat and Gray Catbird Productivity in a Fragmented Western Riparian System. Wilson Journal of Ornithology 119(3):494-498.
New York City Department of Parks and Recreation (NYCDPR). “Bronx River Forest Floodplain and River Channel Rehabilitation Project,” accessed November 3, 2011. http://www.nycgovparks.org/sub_about/parks_divisions/nrg/bronx_river_epa/restoration_projects/restoration_projects_pages/bond_act_floodplain_restoration.html

22
NYCDPR and the Natural Resources Group (NRG). July 2007. Bronx River Forest and Floodplain Restoration, Bond Act Project: Year 2 Monitoring Report. NYCDPR. “Bronx Park,” accessed October 18, 2011. http://www.nycgovparks.org/parks/bronxpark Peak, R.G., and Thompson III, F.A. 2006. Factors Affecting Avian Species Richness and Density in Riparian Areas. Journal of Wildlife Management 70(1):173-179. Schlossberg, S., and King, D.I. 2010. Effects of invasive woody plants on avian nest site selection and nesting success in shrublands. Animal Conservation 13(3):286-293.
Shields, W.M. 1977. The Effect of Time of Day on Avian Census Results. The Auk 94(2):380-383. Stauffer, D. F., and L. B. Best. 1980. Habitat selection by birds of riparian communities: evaluating effects of habitat alterations. Journal of Wildlife Management 44:1-15.
Zavaleta, E.S., Hobbs, R.J. & Mooney, H.A. (2001). Viewing invasive species removal in a whole-ecosystem context.