changes in whisky while maturing
TRANSCRIPT

CHANGES IN WHISICY WHILE MATURING
s
A. J. LIEBMANN -4ND BERNICE SCHERL Schenley Distillers Corporation, New York, N . Y .
T h e maturation of whisky represents a complicated chemical process influenced by a number of contributing factors. The changes which are taking place in the course of maturation have been made the subject of several prior investigations which, however, were based on a num- ber of samples which cannot be considered significant under modern statistical procedure. Four hundred sixty- nine barrels of whisky, mostly bourbon and rye, were set aside periodically in lots of five during a period of 4 gears. Samples from these barrels w-ere withdrawn at regular intervals over a period of 8 years, and their significant characteristics were determined by analysis. The data so ohtained were transferred to punch cards and statisti-
HIS investigation of whisky while maturing represents a T continuation of the work reported and published in 1943 (6). Result,s then given were in the nature of a preliminary report for the first 4 years of a total observation period of 8 years, vhich has since been terminated. The complete results and conclusions are here presented.
For the purpose of clarification of the intent of this study, it should be stated again that the quality of a beverage such as whisky is judged by the consumer on its properties affecting taste and odor. The development of a whisky is dependent on three fundamental production operations: fermentation, distillation, and maturing. This investigation is concerned solely with the last phase, maturing.
The maturing stage begins immediately after distillation, as the new colorless whisky is drawn into charred oak barrels. The barrels are placed in bonded warehouses (constructed of wood, brick, or concrete) and usually permitted to remain for four or more years under variably controlled conditions of temperature and humidity. The mat,uring stage ends with the v,4thdrawal of the aged TThisky from the barrels.
Three fundamental environmental factors are intimately re- lated t o the development of a whisky during maturing-tempera- ture, humidity, and ventilation. The barrel, serving primarily as a container, also act,s as a semipermeable membrane and per- mits the passage of alcohol and mater vapors from the interior of the barrel to the outside. This phenomenon is an integral phase of maturing. Under the conditions normally prevailing in storage warehouses-especially as to humidity and teinperature- the barrel permits water vapor to escape a t a faster rat,e than alcohol vapor. Consequently, there is a gradual accumulation of alcohol a t the expense of water inside the barrel. Thus the proof of the contents rises with age. Many warehouses are con- structed arid equipped to allow positive control of this phase of the maturing process.
During this period, the maturing whisky undergoes definite and intended changes in aromatic and taste Characteristics. These changes are caused by three major types of reactions occurring continually in the barrel:
Extraction of complex wood substances by liquid Oxidation of the orginal organic substances and of the extracted
Reaction between various organic substances present in the vood material
liquid t o form new products 534
cally examined. The means and standard deviations of eleven major constituents and characteristics of whisky were obtained for each age (period of storage) for all or most of the 469 barrels. The eleven characteristic proper- ties of whisky used for an interpretation and definition of maturing were proof, total acidity, fixed acidity, esters, aldehydes, furfural, fusel oil, solids, color, tannins, and pH. The large samples permitted the calculation of dis- persion limits. The average maturing characteristics of American whisky over an 8-year period and results of the chemical and statistical examination of the entire sample group are shown. The possibility is indicated for use of the data as a basis for specifications for w7hisky.
The development of quality, therefore, consists of specific chemical and physical changes in the properties of the liquid, some of which are relatively simple to determine. These proper- ties, or Characteristics, are commonly used as a guide to and measure of quality. Experience and observation have shown that abnormalities arising in one or several of the physicochemical characteristics generally will result in abnormalities of the taste characteristics of the liquid.
Despite the importance of the maturing development to an industry with an estimated yearly sales volume of about 5 billion dollars and with an excise revenue of more than 2.5 billion dollars to t,he Federal Government alone, only a small quantitv of pev- tinent data have been made available by publication.
The two previously published investigations originated in t,he laboratories of the .4lcohol Tax Unit of the Treasury Depart- ment (2, 9). The techniques of sampling, analysis, and data presentation are almost identical in both cases, although 28 wars separate the two investigations.
The earlier work was based on 31 different barrels, all chosen from 3-month production in 1898. Most of these whiskies were dist,illed in types of stills now obsolete and stored in warehouses entirely different from those of today. The later work was based on 22 different barrels chosen from a 6-month production period of December 1929 to May 1930. Of the 22 barrels, three con- tained whiskies derived from such low-yield production as to indicate abnormal fermentation or distillation and thus result in atypical products.
These highly skilled investigators worked under the handicap of being forced to rely on basic material and data furnished by pro- ducers not under their control, and on conditions not subject to their direct supervision. In both investigations, t,he average values for each characteristic were determined, and the minimum and maximum values (constituting the range) were used to indi- cate scatter. The exclusive use of the range as a measure of dis- persion must be treated with caution sincc it' is subject t,o con- siderable individual variation. Crampton and Tolman as well as Valaer and Frazier were forced either t'o indicate next highest or lowest values or to delete extreme values which were considered abnormal (3, IO). The subjective deletion of dat,a, even when based on considerable experience, is a dangerous procedure.
In contrast' to these two studies the present work was based on a variety and number of samples which may be considered adequate For modern statistical calculations.
March 1949 I N D U S T R I A L A N D E N G I N E E R I N G C H E M I S T R Y 935
SAMPLES
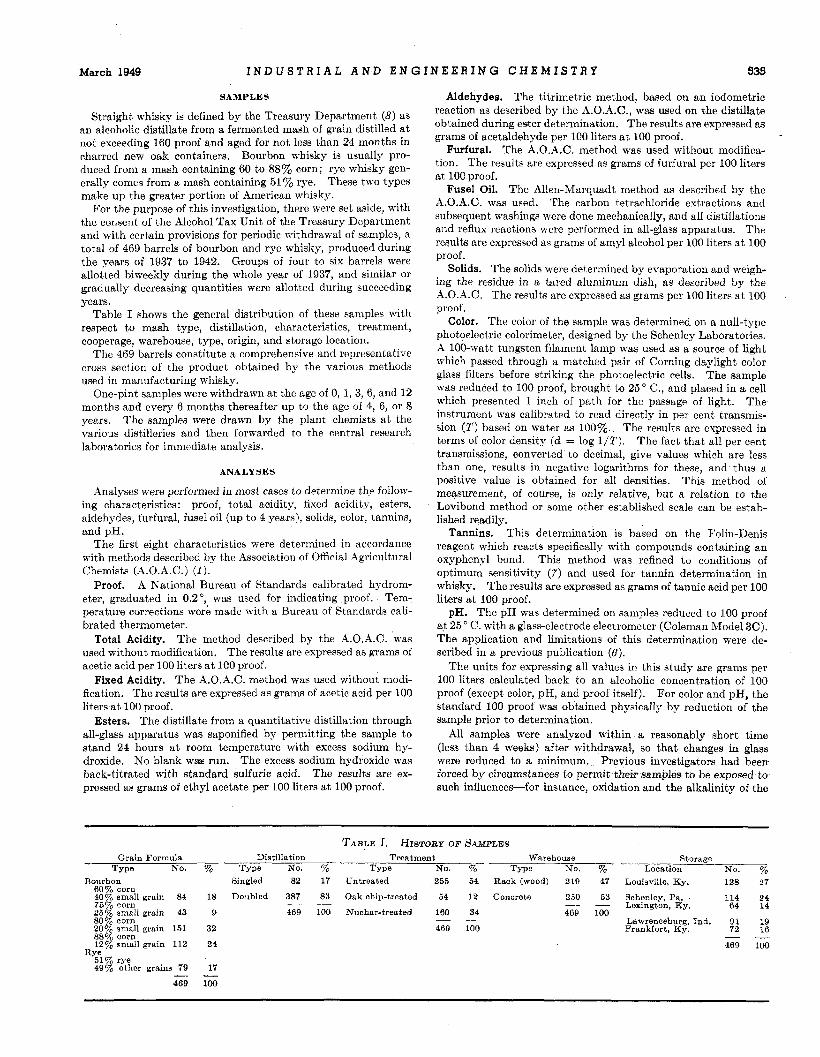
Straight whisky is defined by the Treasury Department (8) as an alcoholic distillate from a fermented mash of grain distilled at not exceeding 160 proof and aged for not less than 24 months in charred new oak containers. Bourbon whisky is usually pro- duced from a mash containing 60 to 88% corn; rye whisky gen- erally comes from a mash containing 51% rye. These two types make up the greater portion of American whisky.
For the purpose of this investigation, there were set aside, with the consent of the Alcohol Tax Unit of the Treasury Department and with certain provisions for periodic withdrawal of samples, a total of 469 barrels of bourbon and rye whisky, produced during the years of 1937 to 1942. Groups of four to six barrels were allotted biweekly during the whole year of 1937, and similar or gradually decreasing quantities were allotted during succeeding years.
Table I shows the general distribution of these samples with respect to mash type, distillation, characteristics, treatment, cooperage, warehouse, type, origin, and storage location.
The 469 barrels constitute a comprehensive and representative cross section of the product obtained by the various methods used in manufacturing whisky.
One-pint samples were withdrawn at the age of 0, 1 ,3 ,6 , and 12 months and every 6 months thereafter up to the age of 4, 6, or 8 years. The samples mere drawn by the plant chemists at the various distilleries and then forwarded to the central research laboratories for immediate analysis.
ANALYSES
rlnalyses were performed in most cases to determine the follow- ing characteristics: proof, total acidity, fixed acidity, esters, aldehydes, furfural, fusel oil (up to 4 years), solids, color, tannins, and pH.
The first eight characteristics were determined in accordance with methods described by the Association of Official Agricultural Chemists (A.O.A.C.) ( 1 ) .
A National Bureau of Standards calibrated hydrom- eter, graduated in 0.2",, was used for indicating proof. Tem- perature corrections were made with a Bureau of Standards cali- brated thermometer.
The method described by the A.O.A.C. was used without modification. The results are expressed as grams of acetic acid per 100 liters at 100 proof.
Fixed Acidity. The A.O.A.C. method was used without modi- fication. The results are expressed as grams of acetic acid per 100 liters at 100 proof.
Esters. The distillate from a quantitative distillation through all-glass apparatus was saponified by permitting the sample to stand 24 hours a t room temperature with excess sodium hy- droxide. No blank was run. The excess sodium hydroxide was back-titrated with standard sulfuric acid. The results are ex- pressed as grams of ethyl acetate per 100 liters at 100 proof.
Proof.
Total Acidity.
Aldehydes. The titrimetric method, btwed on an iodometric reaction as described by the A.O.A.C., was used on the distillate obtained during ester determination. The results are expressed as grams of acetaldehyde per 100 liters at 100 proof.
Furfural. The A.O.A.C. method was used without modifica- tion. The results are expressed as grams of furfural per 100 liters a t 100 proof.
Fusel Oil. The Allen-Marquadt method as described by the A.O.A.C. was used. The carbon tetrachloride extractions and subsequent washings were done mechanically, and all distillations and reflux reactions were performed in all-glass apparatus. The results are expressed as grams of amyl alcohol per 100 liters at 100 proof.
Solids. The solids were determined by evaporation and weigh- ing the residue in a tared aluminum dish, as described by the A.O.A.C. The results are expressed as grams per 100 liters a t 100 proof.
Color. The color of the sample was determined on a null-type photoelectric colorimeter, designed by the Schenley Laboratories. A 100-watt tungsten filament lamp was used as a source of light which passed through a matched pair of Corning daylight color glass filters before striking the photoelectric cells. The sample was reduced to 100 proof, brought to 25 O C., and placed in a cell which presented 1 inch of path for the passage of light. The instrument was calibrated to read directly in per cent transmis- sion ( T ) based on water as 100%. The resuIts are expressed in terms of color density (d = log l / T ) . The fact that all per cent transmissions, converted to decimal, give values which are less than one, results in negative logarithms for these, and thus a positive value is obtained for all densities. This method of measurement, of course, is only relative, but a relation to the Lovibond method or some other established scale can be estab- lished readily.
Tannins. This determination is based on the Folin-Denis reagent which reacts specifically with compounds containing a n oxyphenyl bond. This method was refined to conditions of optimum sensitivity (7) and used for tannin determination in whisky. The results are expressed as grams of tannic acid per 100 liters at 100 proof.
pH. The p H was determined on samples reduced to 100 proof a t 25' C. with a glass-electrode electrometer (Coleman Model 3C). The application and limitations of this determination were de- scribed in a previous publication (6).
The units for expressing all values in this study are grams per 100 liters calculated back to an alcoholic concentration of 100 proof (except color, pH, and proof itself). For color and pH, the standard 100 proof was obtained physically by reduction of the sample prior to determination.
All samples were analyzed within a reasonably short time (less than 4 weeks) after withdrawal, so that changes i n glass were reduced to a minimum. Previous investigators had been forced by circumstances to permit their samples to be exposed to such influences-for instance, oxidation and the alkalinity of the
TABLE I. HISTORY OF SAMPLES Grain Formula Distillation Treatment Warehouse Storage
TYPE No. '% Type No. 96 Type No. % Type No* % Location No. % Bourbon Singled 82 17 Untreated 255 54 Rack (wood) 219 47 Louisville, Ky. 128 27
60% corn 40% small grain 84 18 Doubled 387 83 Oak ohip-treated 54 12 Concrete 75% corn
469 100 Nnohar-treated 160 34 25% small grain 43 9
Et% grain 151 32 469 100 88Vo corn 12% small grain 112 24
__ --
- -_
R v r
114 24 250 53 Schenley, Pa. I _- -- Lexington, Ky. 64 14 469 100
Lawrenceburg, Ind. 91 19 Frankfort, Ky. 72 16 - --
469 100 -__ .
' Z e r grains 79 17
536 I N D U S T R I A L A N D E N G I N E E R I N G C H E M I S T R Y Vol. 41, No. 3 ~~ ~~ ~
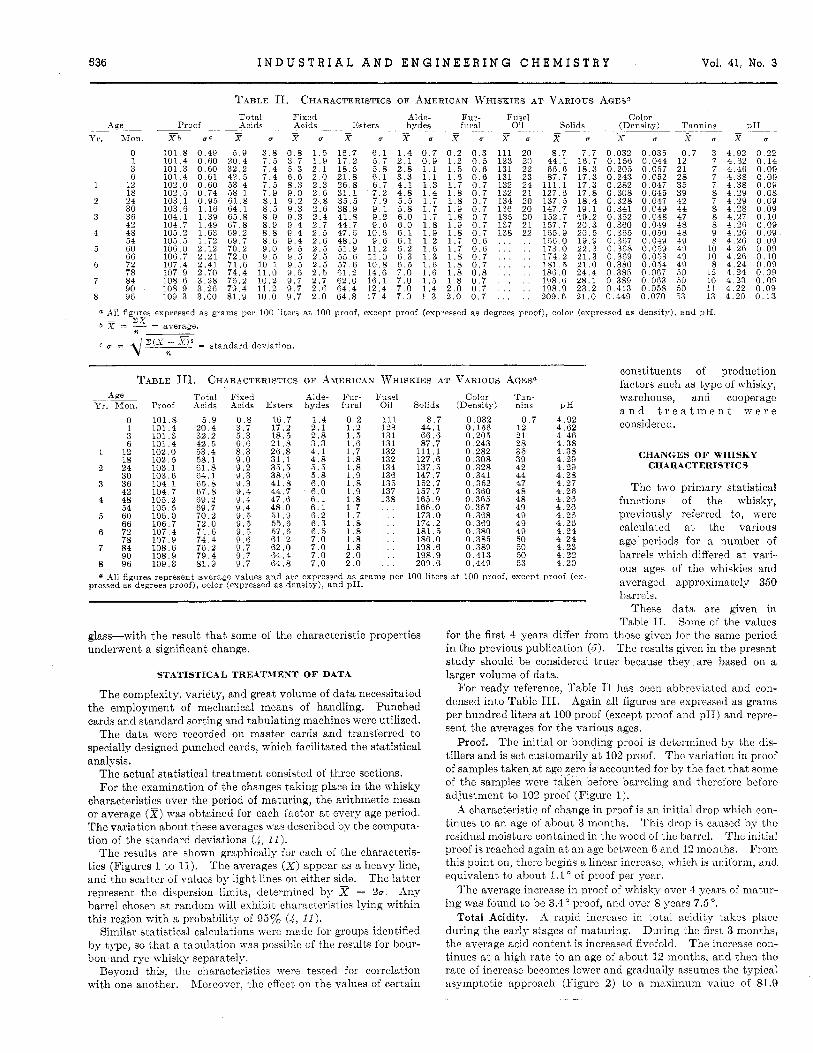
TABLE 11. CHARACTERISTICS O F AMERICAN &rHISKIES AT VARIOUS -4GEs" Total Fixed Alde- Fur- Fnsel Color
Solids (Dmsi ty) Tannins pTT - - - - - _____ ~ __ O i l - Proof .kcids Acids Esters hydes furnl
- - - Age Y r . ? r l o n X b c o % u X u 2 U ~ U X ' U X U X u X u X u X u
0 I 3 6
12 18 24 30 36 42 48 54 60 66 72 78 84 90 96
101.8 101.4 101 .3 101.4 1 0 2 . 0 102 .5 103 .1 103,G 1 0 4 . 1 104.7 105 .2 105 .5 106.0 106 .7 107.4 107 9 1 0 8 . 6 108 .9 109 .3
0 . 4 8 0 . 6 0 0 . 6 0 0 . 6 1 0 . 6 0 0 . 7 4 0 . 9 5 1 . 1 6 1 . 3 9 1 . 4 9 1 . 6 3 1 . 7 2 2 . 1 2 2 . 2 1 2 . 4 1 2 . 7 0 3 . 2 8 3 . 2 6 3 . 0 0
5 . 9 2 0 . 4 32 .2 4 2 . 5
0 8 , l 61 .8 6 4 . 1 6 5 . 8 6 7 . 8 6 9 . 2 6 9 . 7 7 0 . 2 72 .0 7 1 . 6 7 4 . 4 7 6 . 2 7 9 . 4 8 1 . 9
5 3 . 4
3 . 8 0 . 8 1 . 5 7 . ; 3 . 7 1 . 9 7 . 4 5 . 3 2 . 1 7 . 4 6 . 6 2 . 0 7 . 5 8 .3 2 . 3 7 . 9 9 . 0 2 . 6 8 .1 9 . 2 2..8 8 . 5 9 . 3 2 . 6 8 . 9 9 . 3 2 . 4 8 . 9 9 . 4 2 . 7 8 . 8 9 . 4 2 . 5 8.6 9 . 4 2 . 6 9 . 0 9 . 5 2 . 5 9 . 5 9 . 5 2 . 5
1 0 . 1 9 . 5 2 . 5 1 1 . 0 9 . 6 2 . 5 1 0 . 2 9 . 7 2 . 7 1 1 . 2 9 . 7 2 . 6 1 0 . 0 9 . 7 2 . 0
1 6 . 7 1 7 . 2 1 8 . 5 2 1 . 8 2 6 , 8 3 1 . 1 3 5 . 5 3 8 . 9 4 1 . 8 4 4 . 7 47 .6 4 8 . 0 51 .9 5 5 . 6 5 7 . 6 6 1 . 2 6 2 . 0 6 4 . 4 6 4 . 8
6 . 1 1 . 4 0 . 7 5 . 7 2 . 1 0 . 9 5 . 8 2 . 8 1.1 6 . 1 3.3 1.1 6 . 7 4 . 1 1 . 3 7 . 2 4 . 8 1 . 4 7 . 9 5 . 5 1 . 7 9 . 1 5 . 8 1 . 7 9 . 2 6 .0 1 . 7 9 . 6 6 . 0 1 .8
10 .6 6 . 1 1 . 9 9 . 6 6 . 1 1 . 2
11.2 6 . 2 1 . 6 1 1 . 0 6 . 3 1 . 3 1 0 . 8 6 . 5 1 . 6 1 4 . 6 7 . 0 1 . 6 1 6 . 1 7 . 0 1 . 5 1 2 . 4 7 . 0 1 . 4 1 7 . 4 7 . 0 1 .3
0 . 2 0 . 3 1 . 2 0 . 5 1 . 5 0 . 6 1 . 6 0 . 6 1 . 7 0 . 7 1 .8 0 . 7 1 .8 0 . 7 1 . 9 0 . 7 1 . 8 0 . 7 1 . 9 0 . 7 1.8 0 . 7 1 . 7 0 . 6 1 . 7 0 . 6 1.8 0 . 7 1.8 0 . 7 1.8 0 . 8 1 . 8 0 . 7 2 . 0 0 . 7 2 . 0 0 . 7
111 20 8 . 7 123 20 4 4 . 1 131 22 6 6 . 6 131 23 8 7 . 7 132 24 111.1 132 21 127 .6 134 20 1 3 7 . 5 136 20 147.7 135 20 152 .7 137 21 157 .7 138 22 165 .9 , . . . , 1 6 6 . 0 . . , . , 1 7 3 . 0 . , . . , 1 7 4 . 2 . . . . . 181.5 . . . . . 186.0 , , , , , 1 9 8 . 6 , . , . , 1 9 8 . 9 . . . . , 209.6
7 . 7 1 6 . 7 1 8 . 3 1 7 . 3 17 .3 17 .8 1 8 . 4 1 9 . 1 .19.2 2 0 . 3 2 0 . 5 19 .9 2 2 . 3 2 1 . 3 21.0 24 .4 2 8 . 1 23.2 21 . 0
0 .032 0 .156 0 , 2 0 8 0 . 2 4 3 0 .282 0 . 3 0 8 0 . 3 2 8 0 . 3 4 1 0 , 3 8 2 0 .360 0 .365 0 .867 0 .368 0.369 0 .380 0 .386 0 .389 0 413 0.449
0 .035 0 .044 0 . 0 5 7 0 . 0 5 2 0 .047 0 . 0 4 5 0 .047 0 .049 0 , 0 4 8 0 , 0 4 9 0 .050 0 , 0 4 9 0 .059 0 .053 0 , 0 3 4 0 .067 0 .063 0 .058 0 .070
0 . 7 12 21 28 35 39 42 44 47 48 48 49 49 49 49 50 50 50 53
3 4 .92 0 . 2 2 7 4 . 6 2 0 . 1 4 I 4 . 4 6 0 . 0 0 7 4 38 0 . 0 9 7 4 . 3 8 0 . 0 9 8 4 . 2 9 0 .08 7 4 . 2 9 0 . 0 9 8 4 . 2 8 0 09 8 4 27 0 10 8 4 26 0 09 9 4 26 0 09 8 4 26 0 09
10 4 26 0 09 10 4 26 0 10 8 4 24 0 09
12 4 24 0 09 10 4 23 0 09 11 4 22 0 09 13 4 20 0 13
a All figures expressed as grams per 100 liters a t 100 proof, except proof (expressed as degrees proof), color (expressed as density), and p H . b S = - = average.
c u = 4-p = standard deviation.
- Z X -
n
constituents of production factors such as type of whisky, TABLE 111. CHARACTERISTICS O F AMERICAN WHISKIES AT T'ARIOUS AGES"
Age Total Fixed Alde- Fur- Fusel Yr. Mon. Proof Acids Acids Esters hydes fural Oil
0 1 3 6
12 18 24 30 36 42 48 54 60 66 72 78 84 90 96
101 .8 101 .4 101 .3 101 .4 102 .0 1 0 2 , 5 103 .1 103 .6 1 0 4 . 1 1 0 4 , 7 105.2 105 .5 106 .0 106 .7 1 0 7 . 4 107 .9 108 .6 108 .9 109 .3
5 . 9 2 0 . 4 3 2 . 2 42 .5 5 3 . 4 5 8 . 1 6 1 . 8 64 .1 6 5 . 8 6 7 . 8 69 .2 69 .7 70.2 7 2 . 0 7 1 . 6 7 4 . 4 76.2 7 9 . 4 8 1 . 9
0 . 8 3 . 7 5 . 3 6 . 6 8 . 3 9 . 0 9 . 2 9 . 3 9 . 3 9 . 4 9 . 4 9 . 4 9 . 5 9 . 5 9 . 5 9 . 6 9 . 7 9 . 7 9 . 7
1 6 . 7 1 7 . 2 1 8 . 5 2 1 . 8 2 6 . 8 3 1 . 1 3 5 . 5 3 8 . 9 4 1 . 8 4 4 . 7 4 7 . 6 4 8 . 0 5 1 . 9 5 5 . 6 57.G 61 2 62 . 0 6 4 . 4 6 4 . 8
1 . 4 2 . 1 2 . 8 3 . 3 4 . 1 5; 5 . 8 6 . 0 6 . 0 6 . 1 6 . 1 6 . 2 6 . 3 6 . 5 7 . 0 7 . 0 7 . 0 7 . 0
0 . 2 1 . 2 1 . 5 1 . 6 1 . 7 1.8 1 . 8 1 . 9 1 .8 1 . 9 1 .8 1 . 7 1 . 7 1 .8 1 .8 1 . 8 1 .8 2 . 0 2 . 0
111 123 131 131 132 132 134 136 135 137 138
. . . . . , . . , . . , . . , . . . , .
Q All figures represent average values and are expressed as grams per pressed as degrees proof), color (expressed as density), and pH.
Color Tan- Solids (Density) nins pH
8 . 7 4 4 . 1 6 6 . 6 8 7 . 7
111.1 127.6 137 .5 147.7 152 .7 157 .7 165 .9 166.0 1 7 3 . 0 174 .2 1 8 1 . 5 186 .0 198 .6 1 9 8 . 9 209 .6
0 .032 0 . 1 5 6 0 . 2 0 8 0 , 2 4 3 0 .282 0 , 3 0 8 0 , 3 2 8 0 . 3 4 1 0 .352 0 .360 0 . 3 6 5 0 .367 0 . 3 6 8 0 .369 0 , 3 8 0 0 , 3 8 5 0.389 0 .413 0 , 4 4 9
0 . 7 4 . 9 2 12 4 . 6 2 21 4 46 28 4 . 3 8 3 5 4 . 3 8 39 4 .29 42 4 .29 44 4 . 2 8 47 4 . 2 7 48 4 . 2 6 48 4 . 2 6 49 4 . 2 6 49 4 . 2 6 49 4 . 2 6 49 4 . 2 4 50 4 , 2 4 50 4 . 2 3 50 4 . 2 2 53 4 . 2 0
100 liters a t 100 proof, except proof (ex-
warehouse, and cooperage a n d t r e a t m e n t w e r e considered.
CHANGES OF WHISKY CHARACTERISTICS
The tvvo primary statistical functions of the whisky, previously referred to, were calculated a t the various age periods for a number of barrels which differed a t vari- ous ages of the whiskies and averaged approximately 350 barrels.
These data are given in Table 11. Some of the values
for the first 4 years differ from those given for the same period in the previous publication (6). The results given in the present study should be considered truer because they are based on a larger volume of data.
glass-with the result that some of the characteristic properties underwent a significant change.
STATISTICAL TREATMENT OF DATA
The complexity, variety, and great volume of data necessitated the employment of mechanical means of handling. Punched cards and standard sorting and tabulating machines were utilized.
The data mere recorded on master cards and transferred to specially designed punched cards, which facilitated the statistical analysis.
The actual statistical treatment consisted of three sections. For the examination of the changes taking place in the whisky
characteristics over the period of maturing, the arithmetic mean or average (X) was obtained for each factor a t every age period. The variation about these averages was described by the computa- tion of the standard deviations (4 , 11).
The results are shown graphically for each of the characteris- tics (Figures 1 to 11). The averages (x) appear as a heavy line, and the scatter of values by light lines on either side. The latter represent the dispersion limits, determined by .%? * Z r ~ Any barrel chosen a t random will exhibit characteristics lying within this region with a probability of 95% (4 , 11).
Similar statistical calculations were made for groups identified by type, so that a tabulation was possible of the results for bour- bon and rye whisky separately.
Beyond this, the Characteristics were tested for corrclation with one another. Rloreover, the effect on the values of certain
- For ready reference, Table I1 has been abbreviated and con-
densed into Table 111. Again all figures are evpressed as grams per hundred liters a t 100 proof (except proof and pH) and rcprc- sent the averages for the various ages.
Proof. The initial or bonding proof is determined by the dis- tillers and is set customarily a t 102 proof. The variation in proof of samples taken a t age zero is accounted for by the fact that some of the samples were taken before barreling and therefore beforc adjustment to 102 proof (Figure 1).
A characteristic of change in proof is an initial drop which con- tinues to an age of about 3 months. This drop is caused by thc residual moisture contained in the wood of the barrel. The initial proof is reached again at an age between 6 and 12 months. From this point on, there begins a linear increase, mhich is uniform, and equivalent to about 1.1' of proof per year.
The average increase in proof of whisky over 4 years of matur- ing 1% as found to be 3.4 proof, and over 8 years 7.5 '.
Total Acidity. A rapid increase in total acidity takes placc during the early stages of maturing. Duiing the first 3 months, the average acid content is increased fivefold. The increase coil- tinues a t a high rate to an age of about 12 months, and then tho rate of inereax becomes lower and gradually assumes the typical asymptotic approach (Figure 2 ) to a maximum value of 81.9

March 1949 I N D U S T R I A L A N D E N G I N E E R I N G C H E M I S T R Y 531 -
114 - -
110 -
94 98 0 3 12 24 36 48 60 72 84 96
Age, Months Figure 1. Proof - Average; - disperaion limits
r r 0 12 24 36 48 60 72 84 96
Age, Months Figure 3. Fixed Acidity - Average; - dispersion limits
L 100 e
pi
8 80 i
+
A 60
0 .* % 20 s
0 12 24 36 48 60 72 84 96 Age, Months
Figure 2. Total Acids -Average; - dispersion limit.
20 c
0 12 24 36 48 60 72 84 96 Age, Months
Figure 4. Esters -Average; - dispersion limits
grams per 100 liters observed after 8 years. The average increase over this period is 76 grams per 100 liters.
This maximum value for the average total acidity is of con siderable interest, since it apparently represents the maximum amount of acid material which can be extracted from the barrel under normal storage conditions by an alcoholic solution, such as whisky, of 51 to 55% alcohol by volume.
The facts are of considerable importance for the examination of the maturing of whiskies which have undergone special treatment before barreling, as reported later in this study.
Fixed acids develop along the same charac- teristic lines as total acids, but the sharp initial rise during the initial storage period is considerably reduced (Figure 3). The entire fixed acidity normally is due to extraction of material from the barrels. It has been suggested (6) that some of this material may undergo degradation processes, thereby adding to the vola- tile acid content, but this theory has not been confirmed experi- mentally. Another investigator (9) believes that some volatile acids are obtained from extraction processes, but does not furnish experimental proof.
Undoubtedly, the extracted material undergoes oxidation proc- esses, and is subject to other chemical reactions which may re- sult in additions to the volatile acid content. The aromatic nature of these constituents are of some importance as contribu- tors to the quality of the final product.
Under normal conditions, new whisky has a fixed acidity of zero. Table I1 shows at that age, a content of 0.8 gram (cal- culated in acetic acid) per 100 liters at 100 proof, and Figure 3 also indicates this level. The apparent discrepadcy is due to the fact that a part of the production was treated with toasted oak chips before barreling, thereby imparting these characteristics to the new whisky. The earlier publication shows the initial fixed acidity a t 2 grams per 100 liters. As previously pointed out, the
Fixed Acidity.
earlier results were based on a sample size of 108 barrels, whereas the present work is based on examination of more than four times the size of the sample, or 469 barrels. The process of treating whisky was practiced to a small extent during a short period im- mediately following repeal (1933), and only a small proportion of whisky stored during 1937 had been undergoing a treatment (with oak chips) before barreling. All the samples of this kind are part of the 108 barrels reported in the first article (6), and the 361 additional barrels included in the entire study are normal (untreated) whisky. This is reflected obviously in the newer averages, which therefore represent a large preponderance of nor- mal whisky.
The average value for fixed acidity a t age 4 years for the large sample size is 9.4 grams per 100 liters, and a t 8 years of age, 9.7 grams per 100 liters.
This figure is not only lower than the one previously reported, but also is lower in comparison to figures found by ather investi- gators.
First, the whiskies examined before and directly after prohibi- tion came from barrels stored predominantly in old type rack warehouses, where the whisky was exposed, at least during certain periods, to higher temperatures than in the present majority of concrete warehouses. In these modern structures temperatures can be regulated better and are generally held somewhat lower than in former years.
The second influence is the choice and quality of barrels; these are more carefully selected in modern whisky production than previously. Finally, other investigators based their reports in many instances on single barrels, or at least such small numbers that any individual barrel with high acidity might easily have influenced the given result. In the present study, by the applica- tion of the indicated statistical procedure, the variation in results is accounted for and the averages are representative.
This discrepancy is due to several factors:

538 I N D U S T R I A L A N D E N G I N E E R I N G C H E M I S T R Y
200
'i; 160 3
rk
5 120 * d
4 80- E 0
\
Vd. 41. No. 3
- -
- - -
/
-
j 12 r
0 12 24 36 48 60 72 84 96 Age. M o n t h s
Bigure 5. Aldehydes - Average; -- dispersion l imits
0 - 0 12 24 36 48
Age, Months
Figure 7 . Fusel Oil
~ 4 0 1 1 I ! I I I I J
- Average: -- dispersion l imits
r
200 - c
0 12 24 36 48 60 72 84 96 Age, Montha
Figure 8. Solids - Average; - dispersion limits
Esters. The average increase in ester content over the first 4 years of maturing is 30 grams (calculated as ethyl acetate) per 100 liters and 48.1 grams over 8 years (Figure 4).
The increasc in csters with age is probably the most regular and consistent of all the characteristics and therefore may be regarded as the most reliable index for determination of age.
An analysis of initial results of this study seemed to indicate that the ester content underwent a drop after barreling, and re- turned to the starting point only after about 3 months. In view of the otherwise regular and consistent progress of ester furma- tion with only a gradual lowering in the rate of iiicrease over the entire 8 years, this apparent phenomenon, to which attention was called previously, mas further investigated. On the basis of the larger sampling it became evident that the earlier observation was largely the result of chance occurrence and could hardly be con- sidered in the light of coniplete results as significant enough to
* r
0 ' 0 12 24 36 48 60 72 84 96
Age, Months Figure 6. Furfural - Average; dispersion limits
wariant the assumption of an entirely new condition which more- over required the establishment of a specific theory.
Aldehydes. The rate of increase in aldehydes is greatest during the first 3 years, and proceeds at an aveiage for this period of 1.53 granis per 100 liters; the increase for the first year is 2.7 gramb (calculated as acetaldehyde) per 100 liters (Figure 5 ) . The rate of increase aftcr 3 years up to the age of 8 years is a t the average per year of 0.2 giam per 100 liters and is practically constant.
In all probability, the actual increase of aldehydes goes on at a greater rate but is partlv offset as a result of evaporation. As the volume of the liquid in the barrel decreases, the evaporation of this highly volatile conqtituent become3 more pronounced
The total aldehydes at the end of 4 years is 6.1, and aftcr 8 years, 7.0 grams pry 100 liters. Both figures are somewhat lower than given in the previous study and also by other investigators. The general tendency in production of u hisky has been ton ard 5
lower content of the usual constituents, and what ir: usually termed a lighter type of whisky.
Furfural. N e d y made whisky does not contain furfural. Thc content of this characteristic shown in Table I1 for age zero is due to thc inclusion in the averages of the portion of whisky which haq bren treated with toasted rhips before barreling. The greater proportion of this type of whisky in the first sampling (108 bai- rels) again accounts for a higher figure a t age zero and othei early ages, in cornparigon with the figures given in this Studv for the larger number (469 barrels) under investigation.
Furfural is formed in the process of charring the barrcl, ex- tracts of uncharred oak wood show only traces of furfural.
Since practically all the furfural is extracted during the firot few months of storage, the increase after the age of 6 months at which point the average is 1.6 grams per 100 liters is small (Figurc 6).
The average fuifural content at age of 4 years is 1.8 grams per 100 liters, and at age of 8 years, 2.0 grams per 100 liters.
Fusel Oil. The fusel oil (higher alcohols) constitutes an im- portant component of whisky so far as character and quality are concerned. I ts content is largely determined by the method of distilling used. The high evaporation point and chemiral sluggishness of this constituent are responsible for the fact that the original content a t age zero remains practically unchanged, although a slight loss has been found to occur in most cases.
Since the absolute quantity of fusel oil remains practically constant, determinations wrre made in this study only up to 4 years of age (Figure 7 ) . These results have akeady been given in the previous report. They are nevertheless repeated here for the sake of completeness.
The apparent increase in fusel oil during maturing shown in the figures is actually only an increase in concentration; the 1 0 s in volume is accounted for by the evaporation of ethyl alcohol.
The average increase in fusel oil concentration after 4 years of maturing is 27 grams (calculated 88 amyl alcohol) per 100 liters at 100 proof.

March 1949 I N D U S T R I A L A N D E N G I N E E R I N G C H E M I S T R Y 539
6 & 0 'O 5! c - m
I I I I f I I I I
0 12 24 36 48 GO 72 84 Y t i Age, Months
Figure 10. Tannins 0 12 24 36 48 GO 72 84 96 -Average; - dispersion l imits
Age, Month8 Figure 9. Color (Density) - Average; - dispersion limits
-
Solids. The solid content in whisky is derived from the wood of the barrel by extraction, unless the whisky has been treated with toasted wood chips prior to barreling. Since all whisky barrels are manufactured from a standard grade of white oaks, the ex- tracts are similar in character and impart to the final product 8
definite and authentic quality. Nearly half the solid contents reached over the 8-year maturing
periodis acquired during the first 6 months; after that the amount of increase decreases sharply and approaches a uniform rate after the age of 4 years.
Because of these sharp changes the average increase for 8 years is almost meaningless. It is calculated a t 200.9 grams per 100 liters, or 25.1 grams per year. The figure of 8.7 grams per 100 liters at age zero is ascribed to the fact that a small percentage of the whisky had been treated with toasted oak chips. The average increase for the first year was 102.4 grams per 100 liters; of this 79.0 was in the first 6 months and 23.4 in -
D
the second 6 months (Figure 8). The average increase for the next years, up to the age of 4 years, was 18.2 grams per 100 liters per year, and for the final 4 years, up to age of 8 years, it was 11.0 grams per 100 liters per year. The highest point reached was 209.6 grams per 100 liters at 100 proof.
Color. Similar to solids, color is entirely due to sub- stances extracted from the charred oak barrel. Newly distilled whisky is colorless, and the treatment of a por- tion of the whisky before barreling is responsible for the figure 0.032 at age zero. The color of the aging whisky changes gradually from colorless to light and deep yellow, then to amber, and finally to reddish brown (Figure 9).
1 4 . 0 ~ 1 , 1 , , l l , , l l l l l l ,
3.8 0 12 24 36 48 GO 72 84 96
Age, Months Figure 11. pH - Average; - dispersion l imits
d m" 6 30 J
Since this development is due to progressive extraction from wood entirely, the development curve and charac- teristics are similar to those of total acids and solids. The rate of increase declines rapidly after the first six months of maturing.
Tannins. Wood extractives are solely responsible for the tannin content of whisky, the same as for solids and color. Therefore, the initial rapid increase is again followed by a sharp decrease in rate, although the break occurs somewhat later than in the case of solids. Observations during the first 4 years of maturing indicated a possibility of a steady linear increase, but the results of the succeeding 4 years showed the characteristic decrease in rate and asymptotic approach as for the other characteristics. The value shown a t age zero is again ascribable to the presence of a small quantity of treated whisky.
The average increase in tannin content during the first 4 years of maturing is 47.3 grams (calculated as tannic acid) per 100 liters, and for 8 years, 52.3 grams per 100 liters a t 100 proof (Figure 10).
The curve representing changes of pH is similar in characteristics to those describing properties derived from
pH.
* /
. .
A . . .:
.. , I I I I I I I
60 70 80 90 Total Acids as G . Acetic Acid/lOO L. at 100 Proof
Figure 12. Total acids us. Esters
wood extractives-namely, total acidity, solids, tannins, and color, except that its graph appears ~ t s a mirror image of these (Figure 11). This is due to the definition of pH, which con- cerns the reciprocal of the hydrogen-ion concentration.
The initial rapid decrease is succeeded by a sharp drop in the rate of decrease after about 6 months, followed by the typical asymptotic approach after the age of 1 year.
The minimum average value after 8 years of maturing is 4.20. The average decreases of pH during 4 years is 0.68 and during 8 years, 0.72.
MATHEMATICAL REPRESENTATION
In the previous publication of results observed over the first 4- year period, the hypothesis was established that three of t h e

540 I N D U S T R I A L A N D E N G I N E E R I N G C H E M I S T R Y Vol. 41, No. 3
TABLE ITi. hfATHEYATICAL RCPREsESTATION O F h lATURING CHARACTERISTICS
Total Acids Esters Aldehvde, 1' urfiii al
1.250 0.577s O" y = 2.104 :O.l61t + y = y = ___-
= 0.109 +to.olzf + 5.9 1.353 A k.O(J53rt + "" t y obsd. y oalcd. Difference t y obad. y calcd. Difforenoe t y obsd. g calod. Difference t g obsd. I / ciilcl. Differonce
0 6 . 3 6 . 1 4 . 6 2 .2
- 0 . 3 -1.1 -1 .9 - 2 . 5 -2 2 -2 .2 - 2 . 8 - 3 2 - 2 . 5 - 3 . 2 -1 0
0 3 3 . 1 5 2
0 1 6 . 7 1 17.2 3 1 8 . 5
12 2 6 . 8 18 31 .1 24 3 5 , s 30 38 .9 36 41.8 42 44 .7 48 47.6 54 48 .0 GO 51 .9 66 5,S.G 72 57 .6 78 6 1 . 2 84 62.0 90 R4.4 96 64 .8
e 21.8
16 .7 1 7 . 4 18.9 21 .0 25.2 29 .1
36 .o 40.0 4 3 . 3 46.5
5 2 , 6 5 5 , 4 58.2 60 .8 63 .4 6 6 . 8 68.2
3 2 . 9
4 9 . 6
-6 .2 - 0 . 4
0 . 8 1 . 6 2 . 0 2 . 6 2 . 4 1 . 8 1 4 1 1
- 1 . 6 -0 .7 t 0 . 2 - 0 . 6 - 0 . 4 -1.4 - 1 . 4 - 3 4
0 I 3 6
12 18 24 30 36 42 48 54 GO 66 72 78 84 90 96
1 . 4 2 . 1 2 . 8 3 . 3 4 . 1
5 , 8 6 . 0 6 . 0 6 1 6 . 1 6 . 2 6 . 3 6 . 5 7 9 7 . 0 7 . 0 7 . 0
:::
1 . 4 1 8 2 6 3 . 4 4 . 4 5 .0 5.4 5 . 7 6 . 0 6 . 1 6 . 3 6 . 4 6 5 6 . 6 6 . 7 (1.7 8 . 8 6 . 8 6 . 9
0 n R 0 2
-0 1 -0 3 -0 2 -0 .1
0 1 0
- 0 . 1 - 0 . 2 - 0 . 3 - 0 . 3 - 0 . 3 - 0 . 2
0 . 3 0 . 2 0 . 2 0 . 1
n 1 3 6
12 18 24 30 36 42 48 54 60 66 72 78 84 90 96
0 . 2 1 . 2 1 . 5 1 . 6 1 7 1 . 8 1 . 8 1 . 9 1 . 8 1.9 1 . 8 1 . 7 1 . 7 1 . 8 1 . 8 1 . 8 1 . 8 2 . 0 2 . O
0 . 2 0 , s 1 . 2 1 . .5 1 . 7 1 . 8 1 . 8 1 . 8 1 . 8 1 . 9 1 .9 1 . 9 1 . 9 1 9 1 9 1 . 9 1 . 9 1 . 9 1 . 9
0 0 4 0 3 0 1
0 0 0
0 1 0 0
- 0 1 -0 2 -0 2 -0 1 -0 1 -0 1 -0 1
1 0 1 0
Solids Color Tannins P H t Y = _____ Y = - 4.9072-f;3x i- 4.92 = 0.061~ +t0.00471t + 8'7 ' 18.717 2 2.483t 0'032 0.125 + 0.0178t + O"
t gohsd . yca lcd . Difference t yobsd. goaled. Difference t yobad. yca icd . Difference t y0bs-L. 7jc~Ic:l. Diffcrence
? I 3 fi
l i 18 24 30 36 42 4x .. 54 60 66 72 78 84 90 96
8 . 7 44 , I 66 .6 87 .7
111.1 127 ,6 1 3 7 , s 147.7 152.7 157 .7 165.9 166 .O 173.0 174.2 181.5 186.0 198.6 198.9 209.6
8 . 7 2 3 . 7 48 .2 7 5 . 3
110 .1 131 .5 146 .0 l 5 6 , 4 164.3 170 .5 175.4 179.5 182.9 185.8 188,3 190.4 192 .3 194.0 l Y j . 5
n 2 0 . 4 18 .4 12 .4 1 .0
- 3 . 9 - 8 . 5 - 8 . 7 -11.6 -12 .8 - 9 . 5 - 1 3 . 5 - 9 . 9 -11.6 - G.8 - 4 . 4
6 . 3 4 9
1 4 . 1
0 1 Z 6
12 18 24 30 36 42 4x ~~
54 60 66 7 2 78 84 90 96
0 , 0 2 3 -0.156
0.205 0.243 0.282 0.308 0.328 0 , 3 4 1 0 ,382 0.360 0.36,5 0.367 0.368 0 .369 0.380 0 , 3 8 5 0.389 0.413 0.449
0.032 0.079 0 ,147 0 .211 0.279 0 .316 0.339 0 .354 0 ,365 0 , 373 0.380 0 , 3 8 8 0.390 0 ,393 0.397 0.399 0.402 0.404 0.403
0 -0.077
0.058 0.032 0 .003
-0 .008 -0.011 -0,013 -0,013 -0,013 -0 ,015 -0,018 -0,022 -0.024 -0.017 -0 ,014 -0,013
0.009 0 044
whisky characteristics-namel~r, total acidity, solids, and color-- follow a hyperbolic form. The extension of this investigation not only confirmed the propiiety of the use of this equation type for these three characteristics but indicated that the same form is applicable also to most of the other characteriqtics.
As already indicated in the first and partial publication of the results of this investigation, the development of most of the whisky constituents (the majority of which are customarily re- ferred to as congenerics) can be represented by the following hyperbolic formula :
t Y = + yo
where t = age in months; y = valuc of characterintic; yo = value of characteristic a t t = a; and a, b = constants. The values of a and b can be found readily since t / y - yo is a linear function of t-namely, t / y - yo = a + bt.
The method of least squares (11) was used in determining a and b.
Table IV shows the close agreement between values calculated from these equations and those determined by actual chemical analyses (observed values).
CORRELATIOV O F WHISKY CHARACTERISTICS
The importance of the correlation between the characteristic constitucnts has been indicated by some of the previous investi- gators, especially Crampton arid Tolnian (2). The technical and statistical data available to them were probably insufficient to permit the establishment of a niathcmatical interdependence.
The relationship, as it was found to exist, is undoubtedly of considerable practical importance. In the manufacture of the Lvhisky, it will be possible to influence a given factor, which is important for final quality but difficult to control during produc- tion by the manipulation of one of the closely related factors
0 1 3 fi
12 18 24 30 36 42 48 54 60 66 72 78 84 90 96
0 . 7 12 21 28 35 39 42 44 47 48 48 49 49 49 49 50 50 50 53
0 7 8
18 27 36 41 44 46 48 49 50 50 51 51 5 2 52 52 53 53
n 4 3 L
-1 - 2 - 2 - 2 -1 -1 - 2 -1 - 2 - 2 -3 -2 -2 - 3 0
0 1 3 6
12 18 24 30 36 42 48 54 60 66 72 78 84 90 90
4.92 4 . 6 2 4 . 4 6 4 . 3 8 4 . 3 8 4 . 2 9 4 29 4 . 2 8 4 .27 4.26 4 26 4 . 2 6 4 . 2 6 4 . 2 6 4 .24 4 .24 4.23 4 . 2 2 4.20
4.92 4 . 7 6 4.59 4 . 4 6 4.35 4 . 3 1 4.28 4.26 4 . 2 5 4 24 4.23 4.23 4.22 4.22 4 . 2 2 4.21 4 .21 4 .21 4.21
0 -0 14 - 0 . 1 3 -0.0'3
0 .03 -0 .02
0.01 0 . 0 2 0 .02 0 . 0 2 0 .03 0.03 0 . 0 4 0 .04 0.02 0.03 0 . 0 2 0 . 0 1
-0 .01
TTliich can be changed readily. for rapid tests or quality control by examination of only one of the pairs of closely related constituents. Finally, the existcncc of close relation between certain characterist,ics in normally matured whisky will make it possible in some instances to dctcct artificial manipulation and falsification.
Crampton and Tolman place great importance in this applica- tion, believing it of great value in the determination of the adul- teration of commercial whiskies. The findings presented here confirm this possibility but, caution should be exercised especially where conclusions arc inado concerning the age of the investi- gated product based solely on the relation bet\yeen the various constituents.
For the purpose of determining relations between values of the characteristics, scatter diagrams (11) ryere first set up for all pos- sible pairs of congenerics and these actually indicated linearity of relations. One of these scatter diagrams, shoiving the rclalion of total acids and esters, is shown in Figure 12.
As a consequence, the correlation coefficients were calculai ed. (Statistically, if the possible relation between tivo variablw can be assumed linear, the correlation coefficient, r , d l determine the amount of such relation which exists. The value of P will lic between - 1 and +1. The value r = +1 indicates perfect direct; relation, r = - 1, perfect inverse relation.)
I t was found that proof and aldehydes are two independent variables. I n this connection, it should t)c noted that in the early article by Crampton and Tolnian (a), the stalcmenl is made that changes in proof and volume are important in thcir bearing on the changes taking place in substanccs contained in the whisky. Such a relation viould have been difficult to undcr- stand from the purely chemical viewpoint. The authors' results concerning correlatious of proof with constituent substances in- dicate no such interdependence. Proof appears t o have no bear- ing on changes in the various congenerics.
The anal
March 1949 I N D U S T R I A L A N D E N G I N E E R I N G C H E M I S T R Y 541
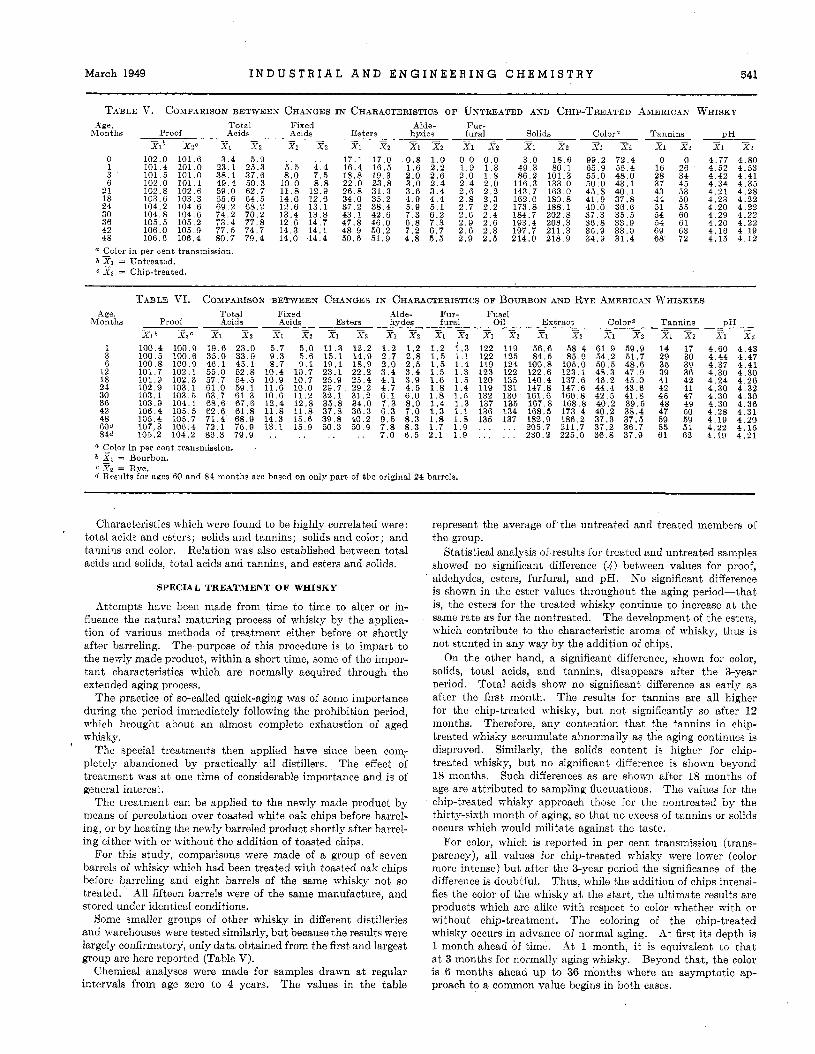
TABLE V. COMPARISON BETWEEN CHANGES IN CHARACTERISTICS OF UNTREATED AND CHIP-TREATED AMERICAN WHISKY Age. Total Fixed hydes Alde- fural Fur- Colors Tannins
PH - - Solids - Months Proof Acids Acids Esters - _~ Xlb x2c zl z2 zl x2 El xz 21 3 2 xi 2 2 xi ;i.2 21 X2 xl 2 2 x1 x2
0 1 3 6
21 18 24 30 36 42 48
102.0 101.4 101 I 5 102.0 102.8 103.6 104.2 104.8 105.5 106.0 106.6
101.6 101.0 101 . o 101.1 102.6 103.3 104.6 104.6 105.2 105.9 106.4
3 . 4 5.9 23 .1 25.3 38 .1 37.6 49.4 50 .3 59.0 62.7 65.6 64 .5 69.2 68.2 74.2 70.2 73.4 77.8 77 .5 74.7 80 .7 79 .4
a Color in per cent transmission.
C 8% = Chip-treated. = Untreated.
5 : 5 8.0
10.0 11 .8 14.6 12.6 13.4 1 2 . 6 14 .3 14.0
4 :4 7 . 5 8 . 8
12.9 12.6 13 .1 13 .8 14 .7 14 .1 14 .4
17 .1 17.0 16.4 16 .5 18.8 19 .3 22.0 23 .8 26 .8 31 .3 34.0 35.2 37.2 38.4 43.1 42.6 47.8 46.0 48.9 50.2 50.6 51.9
0 . 8 1 . 0 1 . 6 2 . 2 2 .0 2 . 6 3 . 0 2 . 4 3.6 3 . 4 4 . 9 4 . 4 5.9 5 . 1 7 . 3 6 .2 6.8 7 . 3 7.2 6 . 7 4.8 5 . 5
0 .0 0 . 0 1 . 9 1 . 3 2 . 0 1 . 8 2 . 4 2.0 2 . 6 2 . 2 2 . 8 2 . 3 2 . 7 2 . 2 2 .6 2 .4 2 . 9 2 .6 2 .6 2 . 8 2 . 9 2 .6
3 . 0 49 .3 86 .2
116.3 143.7 162.0 173.8 184.7 193.4 197.7 214.0
18 .6 80 .1
101.3 133.0 163.0 1 8 0 , s 188.1 202.8 203.3 211.3 218.9
99.2 72 .4 65.9 56 .4 55.0 48.0 50.0 43 .1 45 .8 40.1 41.9 37.8 40.0 36.6 3 7 . 3 35 .5 36 .8 33 .9 35.9 33 .0 3 4 . 9 31 .4
0 0 16 26 28 34 37 45 43 53 44 50 51 55 54 60 54 61 69 63 68 72
4.77 4.80 4.52 4.53 4.42 4 .41 4.34 4 . 3 5 4.21 4 .28 4 .23 4.22 4.20 4.22
4.29 4 .20 4.22 4.22 4.16 4 .19 4.15 4 .12
TABLE VI. COMPARISON BETWEEN CHAKGES IN CHARACTERISTICS OF BOURBON AND RYE AMERICAN WHISKIES Total Fixed Alde- Fur- Fusel Age,
hlonths Color5 Tannins PH -
Extract - - - Proof iicids Acids Esters ~~- hydes fural Oil _ - - - - X l h XZc X1 22 Xl Xz Xi xz 21 2 s xi 22 21 2 2 XI 2 2 2 1 3 2 XI XZ x1 2 2
1 3 6
12 18 24 30 36 42 48 BOd 84d
100.4 100.5 100 .8 101.7 101.9 102.9 103.1 103.9 106.4 105.4 107.3 105.2
100.9 100.6 100.9 1 0 2 , l 102.3 103.1 103 5 104.1 105.5 105 ,7 106.4 104.2
a Color in per cent transmission. b 21 = Bourbon. c Xp = Rye. d Results for ages 60 and 84 months are based on only par t of the original 24 barrels.
122 122 119 123 120 119 132 137 136 135
119 125 124 122 135 131 130 135 134 137 . . . . . .
56.6 8 4 . 5
100 .8 122.6 140 .4 147.8 161.6 167.8 168.5 182.9 205.7 230.2
58.4 85 .9
105.0 123.1 137.6 147.6 160.8 168.8 173.4 186.2 211.7 225.0
61.9 59.9 54.2 51 .7 50 .5 48.6 4 8 . 3 47.9 46 2 45.0 44 .4 43.6 42.5 41 .8 40.2 39 .5 40.2 38.4 37 .3 37.5 37.2 36.7 36.8 37.9
14 29 35 39 41 42 45 48 47 59 55 61
17 30 39 36 42 41 47 49 50 59 51 62
4.60 4.44 4.37 4.30 4 .24 4.30 4.30 4.30 4 .28 4.19 4.22 4.19
4 . 4 3 4.47 4.41 4 .30 4.26 4.32 4 .30 4.36 4.31 4.20 4 . 1 5 4 . 2 1
Characteristics which were found to be highly correlated were: total acids and esters; solids and tannins; solids and color; and tannins and color. Relation was also established between total acids and solids, total acids and tannins, and esters and solids.
SPECIAL TREATMENT OF WHISKY
Attempts have been made from time to time to alter or in- fluence the natural maturing process of whisky by the applica- tion of various methods of treatment either before or shortly after barreling. The purpose of this procedure is to impart to the newly made product, within a short time, some of the impor- tant characteristics which are normally acquired through the extended aging process.
The practice of so-called quick-aging was of some importance during the period immediately following the prohibition period, which brought about an almost complete exhaustion of aged whisky.
The special treatments then applied have since been com; pletely abandoned by practically all distillers. The effect of treatment was a t one time of considerable importance and is of general interest.
The treatment can be applied to the newly made product by means of percolation over toasted white oak chips before barrel- ing, or by heating the newly barreled product shortly after barrel- ing either with or without the addition of toasted chips.
For this study, comparisons were made of a group of seven barrels of whisky which had been treated with toasted oak chips before barreling and eight barrels of the same whisky not so treated. All fifteen barrels were of the same manufacture, and stored under identical conditions.
Some smaller groups of other whisky in different distilleries and warehouses were tested similarly, but because the results were largely confirmatory, only data obtained from the first and largest group are here reported (Table V).
Chemical analyses were made for samples drawn at regular intervals from age zero to 4 years. The values in the table
represent the average of the untreated and treated members of the group.
Statistical analysis of results for treated and untreated samples showed no significant difference (4) between values for proof, aldehydes, esters, furfural, and pH. No significant difference is shown in the ester values throughout the aging period-that is, the esters for the treated whisky continue to increase at the same rate as for the nontreated. The development of the esters, which contribute to the characteristic aroma of whisky, thus is not stunted in any way by the addition of chips.
On the other hand, a significant difference, shown for color, solids, total acids, and tannins, disappears after the 3-year period. Total acids show no significant difference as early as after the first month. The results for tannins are all higher for the chip-treated whisky, but not significantly so after 12 months. Therefore, any contention that the tannins in chip- treated whisky accumulate abnormally as the aging continues is disproved. Similarly, the solids content is higher for chip- treated whisky, but no significant difference is shown beyond 18 months. Such differences as are shown after 18 months of age are attributed to sampling fluctuations. The values for the chip-treated whisky approach those for the nontreated by the thirty-sixth month of aging, so that no excess of tannins or solids occurs which would militate against the taste.
For color, which is reported in per cent transmission (trans- parency), all values for chip-treated whisky were lower (color more intense) but after the 3-year period the significance of the difference is doubtful. Thus, while the addition of chips intensi- fies the color of the whisky a t the start, the ultimate results are products which are alike with respect to color whether with or without chip-treatment. The coloring of the chip-treated whisky occurs in advance of normal aging. At first its depth is 1 month ahead of time. At 1 month, it is equivalent to that a t 3 months for normally aging whisky. Beyond that, the color is 6 months ahead up to 36 months where an asymptotic ap- proach to a common value begins in both cases.

542 I N D U S T R I A L A N D E N G I N E E R I N G C H E M I S T R Y Vol. 41, No. 3
TABLE 1'11. COMPARISON BETWEEK CH.4KQEs I S CHARACTERISTICS O F AWX=~ICAK m H I S K Y IK RACK AIVD CONCRETE WAREHOUSES
Total Fixed Alde- Fur- Proof Acids Acids Esters hydes iura1 Solids Color' Tannins nH
Age, Months - .- - - .- - -
XI= X?b AYui .T? XI l e 21 xz XI E2 ZI X l til XY xi x2 31 27% x1 X? 0 1 3 fi
I2 18 24 30 36 42 48
101.3 101 .0 101 .1 101.3 102.4 103.2 104.3 105.1 105.9 107 .O 107.7
101.3 101 . o 100.9 101 .o 101.7 101.7 102 .4 102.6 103.0 103.7 104.1
8 . 4 28.0 37 6 48 7 59 2 64 1 67 .0 71.6 73 .2 75.6 76 .7
6 . 7 2 3 . 1 3 2 . 7 4 4 . 2 57 . 3 64.0
12 .1 7 4 . 7 75 .9 7g .0
$17.4
4 : 3 5 . 9 8 . 4
1 0 . 2 10.8 10 .9 11 .9 11 .5 12 .9 14 .4
4 ' 8 5 5 8 . 6
1 0 . 5 11 .3 10 .7 11 .7 1 2 . 3 1 4 . 1 14 .3
22.6 21 .8 21 .5 2 4 . 7 31 .1 36 .7 39 .7 42.8 46 .3 61.6 51.4
21.7 22 .6 20 .3 23.7 28 .3 33 .9 38 .4 42.9 44 .6 49 .4 49.2
1 . 3 2 . 0 3 . 1 3 . 3 4 . 0 5 . 1 5.9 7 .0 7 . 7 7 . 6 9 . 1
1.9 2 . 6 2.9 3 . 6 4 . 3 5 . 2 6 . 8 6 .9 8.1 9 . 3 9 .8
0 1 . 2 1 . 6 1 . 6 1 .7 1.8 2 . 0 2 . 1 2 . 2 2 . 2 2 .2
0 . 3 1 . 6 1 . 7 1 . 8 2 . 0 2 . 1 2 . 3 2 . 3 2 . 3 2 . 8 2 . 4
7 . 6 .io. 0 74.9 96.6
122 .0 135.6 153.8 164.4 163.2 174.4 182.3
8 . 2 4 3 . 3 6 6 . 3 8 7 . 8
119.2 133.7 153.0 165.2 172.9 176.9 186.3
96.2 68 .0 5 9 . 9 54.6 50.4 47.4 43.9 4 2 . 5 40.9 40 .3 38 7
92.9 68 .1 61 .2 5 6 , l 50 . 0 46.3 43.2 41.6 39.7 39 .3 38 .1
0 13 24 29 36 37 42 46 48 53 58
1 . 5 1 R 23 28 36 40 44 46 50 56 60
4.70 4 . 5 3 4 .43 4 . 3 3 4.2R 4 . 2 9 4 .28 4 .28 4.27 4.18 4 . 2 2
4.68 4.54 4 .43 4 . 3 7 4 .25 4 . 2 5 4.24 4.25 4.21 4.16 4 .15
Color in per cent transmission. b XI = Rack. 2 X, = Concrete.
As it has been shown already that some of the characteris- tics are closely related to those which can be controlled by means of chip treatment, this procedure would seem to offer a tool for influencing other characteristics which are considerrd of importance to the quality of the final product.
COMPARISON OF TYPES
The results reported for this entire study were carried out preponderantly with bourbon whisky. The two main types of whisky, bourbon and rye, do not show significant differences in their constituents which can be ascribed to the type of grain predominantly used in the mash. Other factors in the distilling operation are of greater influence on the constituents than the t,ypes and proportions of original grain. -is a rule, the difference in the proportion of grains used for
the various types is not a8 great under modern practice as before prohibition, but even in cases of ext.reme uses of one grain or another (corn or rye), chemical analysis cannot find the dif- ference p-hich organoleptic exaininat,ion (by taste and smell 1 is able to detect.
The differences in characteristics pointed out by other in- vestigators are chiefly due to production proccdures, especially distillation, and maturing conditions. Crampton and Tohnan (W) stat,e in their conclusions that rye whiskies show a higher content in solids, acids, esters, etc., than do bourbon whiskies, hut t,his is explained by the fact that heated warehouses are almost universally used for maturing of rye whiskies, and un- heated warehouses for the maturing of bourbon xhiskies.
The conditions referred to by these investigators have long since changed materially. All factors important, for maturing are carefully controlled in modern warehouses, and consequently the differences referred to in the above quotation are no longer encountered.
The results of such studies made in this investigation as con- cern differences in type are entirely consistent in this respect,
The comparisons made were under identical conditions as to distilling, treatment, eooperagc, and location; 24 barrels equally distributed between bourbon and rye were observed. These barrels were divided for the two types of whisky into groups, homogeneous a.s to distillery, treatment, source of cooperage, and warehouse construction.
The results of this comparison are given in Table V1.
EFFECT OF WAREHOUSE CONSTRUCTIOR
To test t,he possible effect of different warehouse construet,ions on the maturing whipky, samples were examined from barrels of whisky homogeneous with respect to all other factors.
The figures in Table VI1 represent average values obt,ained from 50 barrels. These barrels were divided, for the two types of warehouses-concrete and rack (wood)--into groups homo- geneous as to type of whisky, treatment, cooperage, and dist'il-
lery. KO significant differences in the characteristics could be found. The only exceptions were the values for proof which were higher for barrels in rack warehouses than for corresponding members of the group in concrete warehouses. This difference can be ascribed to higher temperatures which prevail at least in the upper sections of t,hc rack warehouses.
The absence of a decided difference betm-een the two types of warehouses can be ascribed to the fact that both types were of relatively modern construction and temperature cont,rolled as far as heating and ventilation permitted.
The effect of cooperage as studied in two distilleries whcre it was possible to set aside homogeneous groups differing only as to the source of cooperage. Conditions made it, difficult to estab- lish corresponding groups of equal size. In one instance the sample sizes were t\To and four, and in the other, two arid eight. Consequently, the significance of the results should be judged accordingly.
In dist,illery I, the resulbs from manufacturers MI and M 4 showed littlc difference. This is not surprising, as all barrels were ordered to specifications and were accepted only after close inspection. Nevertheless, the proof in !MI barrels was always higher, indicating great,er permeability for water vapors, arid in the same barrels, higher values appeared for furfural, color, and
In distillery 11, barrels from manufacturers M , and M4 showed only slightly different results. Higher valups appeared COIL-
sistently for barrels from $13 for total acids, esters, solids, tannins, and color. Obviously, differences cither in qualities of the ;\ood or degree of charring or both were responsihlr.
'
PH.
SUMMARY
;Z systematic study has been made on a representative sample (469 barrels) of the changes occurring in American whisky while maturing.
The changes in American whisky while maturing over a period of 8 years arc given in a table of eleven Characteristics.
Most of the important characteristics of whisky undergo changes due t o or influenced by Substances extracted from the barrel. The extraction of these substances is greatest at, the beginning of t,he storage period and decreases a t a gradually diminishing rate. These changes are mathematically expressed by a hyperbolic equation representative of the asymptotic ap- proach to a maximum value. .4 close correlation has been shown between several charac-
teristics, especially between total acidity and esters. The choice of grains has a relatively small influence on the
chemical composition of whisky. Changes while maturing in different, types of whisky (bourbon
and rye) are similar.
March 1949 I N D U S T R I A L A N D E N G I N E E R I N G C H E M I S T R Y 543
ACKNOWLEDGMENT
The authors wish to acknowledge the assistance of Jerome Polatnick in directing and supervising the great number of analytical determinations necessary for this investigation. The authors are grateful also to the plant managers and chemists a t the various distilleries for setting aside and sampling the experimental barrels. Acknowledgment also is made to M. Rosenblatt, the coauthor of the first section of this study, for his part in organizing and initiating the entire work.
LITERATURE CITED
(1) Assoc. Official Agr. Chem., Official and Tentative Methods of
(2) Crampton, C. A. , and Tolman, L. M., J. Am. Chem. Sot , 30, 97 Analysis, 4th and 6th ed., Sect. XVl (1940).
(1 908)
(3) Ibid., 122-3, Table XIVa. (4) Croxton, F. E., and Cowden, D. J., “Applied General Statistics,”
(5) Liebmann, A. J. , and Rosenblatt, M., IND. ENG. CHEM., 35, 994
(8) Liebmann, A. J., and Rosenblatt, M., J. Assoc. O f l . Agr.
(7) Rosenblatt, M., and Peluso, J. V., Ibid. , 24, 170 (1941). (5) U. S. Treasury Dept., Federal Alcohol Administration, Regula-
tion No. 6, Article 11, Sect. 21 (b) (March 1, 1939). (9) Valaer, Peter, and Frazier, W. H., IND. ENQ. CHEM., 28, 92
(1936).
pp. 286-7, New York, Prentice-Hall, Inc., 1940.
(1943).
Chemists, 25, 183 (1942).
(10) Ibid., 105, Table XIV. (11) Yule, G. U., and Kendall, M. G., “Introduction to Theory of
Statistics,” p. 386, London, G. Griffin, 1937.
R m m v R f ~ December 18, 1947.
Thermal Properties of GR-S Latices
F. W. DITTMAN’ AND c. c. WINDING Cornel1 University, Ithaca, N . Y .
Methoas were devised and apparatus built to measure direct the heat capacity and thermal conductivity of syn- thetic latex under pressure, vented and stripped. Sam- ples were obtained from pilot plant reactors at various degrees of completion of the butadiene-styrene copoly- merization reaction. Heat capacity of unvented samples increases moderately with temperature and decreases sharply with conversion as the reaction proceeds to com- pletion; most of the decrease occurs between 40 and 50% conversion. Heat capacity increases slightly on venting because of loss of butadiene. All values lie between 0.75
H E rapid development of the synthetic rubber program re- T quired many estimations and approximations of fundamental data to complete the design and construction of synthetic rub- ber plants. Concurrently, research programs were started to obtain actual experimental data to facilitate the operation of existing plants and to provide information on which to base fur- ther development work. As a part of this general program, ex- perimental apparatus and techniques were developed to obtain the heat capacity and thermal conductivity of latices formed by the copolymerization of butadiene and styrene, Experimental work was confined to the latices obtained in various stages of the production of standard GR-S rubber.
Samples of latices were obtained direct from pilot plant poly- merization kettles at various stages of conversion, These sam- ples were kept under pressure and all contained excess butadiene and styrene. They are referred to as unvented latices. Vented latices were obtained from this material by allowing the excess butadiene to flash off at atmospheric pressure. The removal of the excess styrene by steam stripping produced stripped latex.
The composition of each of the above types of samples is best specified by per cent conversion which is a direct function of the solids (copolymer) content of the samples as measured in the labo- ratory
Samples were drained direct from the reactors into bombs containing a small quantity of inhibitor The bombs were small
1 Present address. Koppers Company. Inc.. Pittsburgh. Pa.
and 0.91 cal. per gram, O C. Heat capacity of stripped latex is constant at 0.837 * 0.005 cal. per gram, O C. between 8” and 60” C. Thermal conductivity of latex under pres- sure shows a slight increase with temperature and a marked increase with per cent conversion. Values ranged from 0.00061 to 0.00099 gram-cal. per second cm., O C. Thermal conductivity could not be measured on samples below 50% conversion because of the existence of two liquid phases. Thermal conductivity of stripped latex ranged from 0.00095 to 0.00105 gram-cal. per second cm., O C., increasing slightly with temperature.
enough to be shaken thoroughly by hand before withdrawing B
portion for determination of thermal properties.
HEAT CAPACITY
Apparatus. The technique of accurate calorimetry has been well standardized and described a t length in the literature. Standard works on physical measurements, such as those of Drucker ( 7 ) and White ( 2 4 ) were referred to in detail during the process of designing and operating the present calorimeter.
The usual liquid calorimeter consists of an enclosed sample chamber with stirrer, heating element, and thermometer of the desired degree of accuracy, surrounded by an air gap within a thermostatically controlled water bath. Such equipment had to be modified in order to mmsure the heat capacity of stripped, vented, and unvented latices. The unvented samples contain- ing butadiene had to be kept under pressures ranging up to 75 pounds per square inch and totally enclosed a t all times to prevent loss of butadiene. All latices also deposited a thin film of rubber on the walls which had l o be easily removable.
The a p aratus finally adopted consisted essentially of two cyl- indrical ciambers cross-connected at top and bottom and sur- rounded by cotton-wool insulation. The entire assembly was placed in a large container which was fitted with a circular wooden lid. A Beckman thermometer, agitator shaft, and heat- ing element passed through openings in the lid into the cir- culating liquid in the inner chambers. Oil was used to sub- merge a pressure-tight bomb containing unvented samples, but