changes to higher education funding and student support...
TRANSCRIPT
Changes to higher education funding and student support in England from 2012/13 Standard Note: SN/SG/5753
Last updated: 6 February 2012
Author: Paul Bolton
Section Social & General Statistics
The Government will raise the cap on tuition fees to £9,000 in 2012/13 and cut most ongoing direct public funding for tuition. It will also change loan repayment terms by increasing the repayment threshold to £21,000, charging a real rate of interest on loans for those making repayment, extending the maximum duration of loans from 25 to 30 years and making fee loans available to part-time students. Institutions charging annual fees of over £6,000 will have to spend some of this additional income on widening participation. The average tuition fee, after discounts, is currently expected to be around £8,070 in 2012/13. The proposed new system will apply to new students in England from 2012/13.
An average fee of just over £8,000 could mean that England has the second highest (average) fees in the developed world and the highest in any ‘public’ system. This package of reforms is expected to result in a more progressive distribution of repayments than at present. The highest earning graduates will repay considerably more, the lowest somewhat less depending on the assumptions used. On average graduates will repay more overall because they will repay for longer. Half or slightly more than half of graduates are expected to have some loan written off under these proposals, up from around 15% at present.
The accounting treatment of loans means that these changes will lead to an immediate cut in public spending and help reduce the deficit. However, they will also increase the national debt in the short to medium term. The scale of the actual savings has been questioned by some commentators who believe the Government’s repayment model is too optimistic.
The average fee looks set to be above the £7,500 predicted by the Government. This would increase the public cost per loan and, if student numbers remain constant, savings would have to be made elsewhere. The financial impact on universities depends in large part on their fee levels and how they fare from changes to student number controls. The number of new students is expected to fall in 2012 as it did when fees were introduced and raised in the
This information is provided to Members of Parliament in support of their parliamentary duties and is not intended to address the specific circumstances of any particular individual. It should not be relied upon as being up to date; the law or policies may have changed since it was last updated; and it should not be relied upon as legal or professional advice or as a substitute for it. A suitably qualified professional should be consulted if specific advice or information is required.
This information is provided subject to our general terms and conditions which are available online or may be provided on request in hard copy. Authors are available to discuss the content of this briefing with Members and their staff, but not with the general public.
This note will not be updated unless there are major changes to the proposals it describes. Two new shorter notes cover specific impacts of the 2012 changes. These shorter notes will be routinely updated.
HE in England from 2012: Student numbers HE in England from 2012: Finance and funding

past. These earlier falls were quickly reversed. A deeper and longer fall in numbers could cause financial difficulties for some universities.
This note sets out a brief summary of the main technical aspects of the Government’s reforms for England and compares these with proposals in the Browne report and the current system. It looks at the impact on universities and public spending and on different groups of graduates. Finally it illustrates the effect of different assumptions about loans and fees.
2
3
Contents
1 Summary of the current system, Browne and the Government proposals 4
2 Background 5
3 The Government’s proposals 5
3.1 Details of changes and their overall impact 5
Interest rates 6
Repayment thresholds 7
Loan write off 7
Fee cap 7
Part-time students 9
Widening participation initiatives 10
3.2 Overall funding and student numbers 12
Student numbers in 2011 and beyond 13
3.3 Early repayment mechanism 14
4 Financial impact on universities 14
5 Impact on public spending 15
Impact of different fee levels 16
Impact on public expenditure v impact on public sector debt 18
The loan model 19
6 Illustration of the impacts of the Government’s proposals 21
6.1 Net present value (NPV) of repayments by lifetime income decile 21
Impact of threshold levels and uprating assumptions 23
6.2 Other measures and types of graduates by decile 24

1 Summary of the current system, Browne and the Government proposals Current system Browne Report recommendations Government's proposals
Repayment system
Real interest rate 0% 2.2% when earning above threshold0% below earnings threshold rising to 3.0% at higher threshold (£41,000)
Earnings Threshold£15,000 (from 2005)originally due for review in 2010
£21,000(For the first major cohort from 2016)
£21,000(For the first major cohort from 2016)
Uprating to earnings thresholdOriginally ad hoc. Now in line with inflation from 2012 to 2016. Periodically in line with earnings growth Annually in line with earnings growth
Proportion of income repaid above threshold 9% 9% 9%
Duration of loan before write-off 25 years 30 years 30 years
Tuition fees
Maximum annual tuition fee £3,290 (2010/11)
Not cap, but institutions to receive a declining proportion of total income from fees over £6,000
£9,000 cap but any university charging over £6,000 will have to '...show how they will spend some of the additional income making progress in widening participation and fair access.'
Tuition fee loans available for part-time students? No Yes Yes
Maintenance support
Main rates for students living away from home outside London.Value (vertical) versus householdincome (horizontal scale).
Support for students from lowincome households
£300 minimum bursary paid for by the university for students on a full grant
Bursary effectively incorporated into maintenance grant. No student worse off 'cash in hand'
Establish a new £150 million National Scholarship Programme
£0k £20k £40k £60k£0k
£2k
£4k
£6k GrantLoan
£0k £20k £40k £60k£0k
£2k
£4k
£6k GrantLoan
£0k £20k £40k £60k£0k
£2k
£4k
£6k GrantLoan
4

Terminology -Students take out student loans. -Graduates repay student loans. -Low earners are graduates who earn below average for graduates. -High earners are graduates who earn above average for graduates. -A student may come from a low income household, be eligible for a full grant etc. but this has no automatic impact on their ability to be a higher earner as a graduate. -A student from a high income background may similarly be a low earner as a graduate. -Direct public funding is money paid to universities by the funding council. This is different from the indirect support the public sector provides through the subsidy element in tuition fee loans.
2 Background The Browne Report1 was published on 12 October 2010. It made recommendations on the future funding and organisation of the higher education sector. The Government announced its plans for reform of higher education and student finance on 3 November 2010.2 This accepted most of the Browne recommendations, although some were modified, a few were rejected and no final decision was taken on others. Impact assessments of the proposals were published at the end of November.3 Changes to the proposals on thresholds and arrangements for part-time students were announced on 8 December 2010. The draft regulations to allow higher fees were approved on 9 December 2010. The provisions to charge a real rate of interest on loans are included in the Education Bill which had its second reading in the House of Commons on 8 February 2011. The Higher Education White Paper4 was published in June 2010. This gave some more detail about plans for student number controls alongside other proposed reforms. Many of these proposals formed the basis on consultations that have followed the White Paper. Some will be introduced in 2012/13, other consultations are still ongoing and will not be introduced until 2013/14 or later.
More background can be found in the Library’s notes on The Government’s proposals on higher education funding and student finance and their impact on access to higher education, Student Loan Statistics and Tuition Fee Statistics. Differences in student maintenance support from 2012/13 are given in more detail in The value of student maintenance support.
Many different organisations have commented on or published analysis of the Government’s proposals and those set out in the Browne Report. These include the Institute for Fiscal Studies, the Higher Education Policy Unit, Universities UK, the Russell Group, The Sutton Trust, million+, the 1994 group and the Social Market Foundation.
3 The Government’s proposals 3.1 Details of changes and their overall impact
The Government’s proposals followed many of the recommendations set out in the Browne Report. The biggest change being introduced in 2012/13 is the higher fee cap and the loss of much direct public funding for teaching. This results in a very obvious shift in the burden of
1 Securing a sustainable future for higher education –An independent review of higher education funding &
student finance 2 Reform for higher education and student finance, BIS (3 November 2010) 3 Interim equality impact assessment –Urgent reforms to higher education funding and student finance, BIS Interim impact assessment –Urgent reforms to higher education funding and student finance, BIS 4 Higher Education: Students at the Heart of the System, BIS (June 2011), Cm 8122
5

the costs of tuition from the state to the individual beneficiary. These two elements are fundamentally linked, but the other reforms are not.
The general arrangements for the fees and loan repayment remain much the same –students can take out loans to cover fees, they do not need to be paid up front, and graduates start repaying a fixed proportion of any income above the earnings threshold. Higher fees will mean average loans will increase. This increases the potential duration of repayments as monthly amounts depend on income and the level of the earnings threshold for repayment.
Interest rates Charging a real interest rate on loans removes part of loan subsidy and hence makes offering each £1 of loan cheaper for the public sector. This increases the duration of loan repayments for those who would otherwise have repaid their loans. Much of the interest rate subsidy currently goes to graduates on middle incomes. Those on lower incomes who do not earn above the repayment threshold will not repay their loans regardless of the interest rate charged and those on higher incomes will repay their loans relatively quickly so have less scope to benefit from the interest subsidy.5
The Government’s proposed phased higher rate of real interest would rise from 0% for those earning below the repayment threshold to 3.0% at incomes above a higher threshold (£41,000 in 2016). The Browne Report recommended a real interest rate of 2.2% for those earning above the threshold with a safeguard to ensure those making relatively small repayments did not see the balance of their loan increase.
The Government’s loan model assumptions about how real interest rates will vary with income are illustrated opposite. This will affect higher earners to a greater extent, making the expected value of lifetime repayments somewhat more progressive. It means that any graduate making repayments will see their outstanding debt fall in real terms. However, a graduate with a £30,000 loan would need to earn around £42,000 in their first year of repayments (2016-17) to see the outstanding balance fall in cash terms.6 An interest rate of inflation plus 3% will apply to all loans between when they are taken out and the date when repayment is due (April after the course is completed).7 The Government has said that the final formula for calculating variable interest rates is being developed and will be announced in due course.8
0%
1%
2%
3%
£0k £20k £40k £60k £80k
Interest rates for income contingent loans are currently subject to a ‘low interest cap’ because Bank of England base rates are so low. This has applied since late 2008 and has meant that interest rates are below inflation.9 Rates have been 1.5% since March 2009. Provisions in the Education Act 2011 mean that this cap will not apply to students who start under the new scheme from 2012. The note Student Loan Statistics gives more detail.
5 For a comprehensive description see N Barr and A Johnson, Interest subsidies on student loans: A better
class of drain, (CEE DP 114) LSE Centre for the Economics of Education 6 Assumes a debt at the statutory repayment date of £33,500 after 3% real interest applied to loan on top of the
inflation linked rate of 2.75%. 7 Full-time and part-time students: loans for tuition, BIS (4 February 2011) 8 HC Deb 10 January 2011 c155W 9 Below the rate that would have applied in the academic year based on RPI inflation in the previous financial
year
6

Repayment thresholds The higher level of repayment threshold (from 2016) is of most benefit to low earning graduates. It reduces their repayments by a larger proportion, takes a relatively high number out of repayment and makes it more likely that they will not fully repay their loan. A higher threshold increases the cost of the write-off element of the loan subsidy. Under a revision to initial proposals the £21,000 threshold will be uprated annually (rather than periodically) to reflect increases in earnings.10 This further increases the subsidy element of the loans and is again of more benefit to lower earners.
The current threshold (£15,000) was due for review by the last Government in 2011. It has remained at this level since April 2005. The current Government announced on 8 December 2010 that this threshold will not be uprated at all until 2012. From then it will be uprated in line with inflation until 2016.11 This means that the threshold in 2012 will be around 18% lower in real terms than its 2005 level.12 Not uprating in line with inflation over this period will affect (current scheme) lower earning graduates disproportionately. Increases in their monthly repayments will be proportionately greater than higher earning graduates and a greater percentage will be drawn above the threshold and start making repayments.13 The distribution of repayments for these graduates is therefore made relatively more ‘regressive’ by this decision. If it had been uprated for inflation for the whole period it would be around £20,500 in 2016 –broadly similar to the proposed threshold for new students from 2012/13.14
Loan write off The increase in the write-off duration from 25 to 30 years has most impact on low earners. Those earning just above the threshold, but not yet fully repaid after 25 years could continue making payments for an additional five years. However, the impact is relatively small compared to the benefit they gain from the higher earnings threshold. The distributional impact of different elements is illustrated in section 6 of this note. The Government estimates that around 15% of students under the current system will have some or all of their loan written off. This is expected to increase to 50-60% under the proposed new system.15
Fee cap The Government did not accept all the Browne Report proposals on fee levels. Browne recommended removing the fee cap, but controlling public expenditure by charging universities a levy on fee levels above £6,000. This would be equal to the Government’s cost of providing the additional support through the loans system. To illustrate this, the report estimated the levy could be set at 40% (of the marginal income between £6,000 and £7,000) and rise quite rapidly to 75% (marginal income at fee levels between £11,000 and £12,000).16 The aim was to make public spending more predictable and to put in place incentives to ensure that institutions faced part of the cost of higher fees.
The Government’s proposals are for an absolute cap at £9,000 and increased access obligations on universities charging above the lower cap of £6,000. These obligations are summarised in the section on widening participation initiatives below. This is likely to mean 10 BIS news release 8 December 2010 Cable announces improved higher education package; HC Deb 8
December 2010 c19-20WS 11 ibid. 12 ONS series CHAW and assumed 2.7% annual increases in the two years from April 2010 to April 2012. 13 Using the assumptions as set out, graduates could repay up to £340 more per year than if the threshold
retained its real 2005 value. 14 Uprated using the all-times RPI (ONS series CHAW) to April 2010 values. Assumes annual inflation of 2.75%
thereafter. 15 HC Deb 10 January 2011 c156W 16 Browne Report section 5.3
7
that the overall variation in fees between universities and across subjects is smaller than it would have been under the Browne proposals. However, the impact of this policy decision on mean fee levels could be in either direction. Professor David Eastwood, a member of the panel who drew up the Browne report, has said that ‘Almost certainly the median fee under the Browne proposal would have been lower than those that will emerge under the twin-cap system.’17 The Interim Impact Assessment of the proposals states that a fee cap is needed because:
Without one there would be no incentives for HEIs [Higher Education Institutions] to drive efficiency savings and could potentially lead to an unconstrained increase in graduate contributions (creating barriers to access particularly for low-income households).
Currently the maximum fee amount is increased each year in line with inflation. Under Government assumptions about the long-term rate of inflation an annual uprating of this kind would increase the lower £6,000 cap by around £170 per year and the £9,000 cap by around £250 per year.
The possible financial implications of different mean fee levels are looked at in section 3 of this note.
Evidence of fee levels for 2012-13 On 12 July 2011 the Office for Fair Access (Offa) published an analysis of the access agreements it had approved.18 Any institution that wants to set fees above £6,000 has to have this agreement approved by Offa. The agreements set out proposed fee levels and the access measures that each institution plans to put in place. All 123 universities and 16 of 105 further education institutions19 set fees of above £6,000. 80 universities had a maximum fee of £9,000, 47 set an average fee of £9,000. Overall the weighted average fee was estimated by Offa at £8,393. This is reduced to £8,161 after the fee waivers set out in the agreements are included.
The access agreements were submitted before institutions knew what was in the Higher Education White Paper. 25 institutions submitted revised agreements in response to the White Paper proposals. Virtually all reduced their post-waiver fee to £7,500 or less to give them the chance to bid for additional places. They did this by a combination of cutting headline fees and increasing fee-waivers. The increase in waivers was in-part ‘funded’ by reducing their earlier levels of spending on bursaries and scholarships. Offa’s estimate of the headline fee after these revisions is £8,354 or £8,071 after wavers are netted off.20
17 Soft cap too hard for ‘naive’ sector, Times Higher Education 17 February 2011 p.7 18 Offa press notice 12 July 2011 OFFA decisions on 2012-13 access agreements 19 FE institutions that teach higher education courses 20 Offa press release 2 December 2011, OFFA announces decisions on revised 2012-13 access agreements
8

Tuition fees: where will England rank from 2012/13?
The OECD estimated average fees in England in 2008/09 at $4,840. This was the third highest fee for public or state-dependent private institutions in the OECD after the US ($6,310) and Korea ($5,320) and just above Japan ($4,600). An average headline fee for new students in England of £8,350 in 2012 is equivalent to around $12,700 at current exchange rates. There is no prospect of any fee increase in any country with relatively high fees that would approach this level. Such a fee level would therefore be the highest average figure for public or state-dependent private institutions in the developed world.
The situation is less clear for the average across all types of universities. Fees in private US institutions are much higher than in the public sector. The average fee in 2009/10 across all 4-year institutions was $12,500. Future fee levels are not subject to any imposed limit, but the increase in average fees has been consistent over the past decade at $400-600 per year. If this continued over the next few years average fees in the US would be above those in England, but the difference would be much smaller than at present. Fees at private universities in Japan and Korea, where around-three quarters of students in both countries study, are also higher than public institutions. The weighted average fee across all institutions in 2009/10 was around $8,600 in Korea and $6,600 in Japan. Fee increases in both countries have been small in recent years and show no signs of increasing. This, coupled with the Korean Government’s plans to restrict fee increases, implies that there is no real prospect of average fee levels in either country which are above those for new students in England from 2012/13. The same applies to other countries with average fees that are below England at the moment, including Australia and Canada This would make average fees in England the second highest in the developed world.
These broad conclusions were also reached by the Higher Education Strategy Associates, who, writing shortly after the Browne Review was published, concluded that overall average fees in England would be second only to the US. England would have the most expensive headline fees at ‘public’ universities, but the costs faced by students –taking into account grants, living costs and loan subsidies, would be the third most expensive. They added that the increase in fees in 2012 ‘...would represent the single largest one-year increase in net costs anywhere in the world since mass higher education began’.
Sources: Education at a Glance 2011, OECD. Table B5.1 Digest of education statistics 2010, National Center for Education Statistics. Table 345 PPPs and exchange rates, OECD.StatExtracts The Global Higher Education Rankings 2010, Higher Education Strategy Associates House of Commons Library estimates
Part-time students Fee loans will be extended to part-time undergraduate students, but there will be cuts in direct funding for these courses and an end to means-tested grants which currently help some part-time students meet their fee and maintenance costs. These savings are thought to be greater than the additional costs of providing fee loans.
In the impact assessments the Government estimates that around 175,000 or one-third of part-time undergraduates will be eligible for fee loans, compared to around 15% who benefit from grants at present.21 22 These assessments also acknowledge the possibility that the withdrawal of direct funding for part-time courses might lead to an across the board increase 21 Interim equality impact assessment –Urgent reforms to higher education funding and student finance, BIS 22 HC Deb 18 January 2011 c763-4W
9

in part-time fees.23 24 Some potential part-time students could therefore be faced with higher fees and no fee loans. The Government has subsequently announced that more part-time courses will be eligible for fee loans, although the impact on the proportion of students affected has not been estimated.25
The cuts to direct public funding channelled through the funding council will also apply to part-time students. Currently just over £400 million is paid through the funding council for 109,000 full-time equivalent part-time students.26 The funding council provides direct support for around 240,000 part-time students (headcount).27 The net effect of the changes to funding for part-time students will be to cut public expenditure. The annual saving was estimated at £150 million in 2014-15.28 The decision to extend eligibility from courses of 33% or above to those of 25% or above will have reduced these savings by a small amount. 29
The earnings threshold for part-time students will be the same as for full-time entrants from 2012/13 (£21,000).30 Other loan terms which have been published so far are intended to mirror those for full-time students. The statutory repayment date for part-time students is the April three years after their course begins, unless they complete their course earlier in which case it is the April after they leave their course.31
Widening participation initiatives National Scholarship Programme The Government will introduce a new National Scholarships Programme (NSP) in 2012-13 which will be worth £150 million in 2014-15. It ‘...will be targeted at bright potential students from poor backgrounds.32 All institutions charging fees of over £6,000 per year will be obliged to participate in the scheme. The Government will ‘...look to increase the leverage of Government funding by getting matched contributions from universities.’.33 Further details set out in February 201134 are that the NSP will provide a direct benefit to eligible students of not less than £3,000 which could be through a fee waiver or discount, a free foundation year, discounted accommodation or a financial scholarship/bursary (limited to £1,000). This benefit will be for one year only. All institutions with an access agreement (needed to charge fees of over £6,000) will be expected to match this funding.
Only students with a household income below £25,000 per year (generally eligible for a full grant) will be considered eligible. However, not all these students will get support under the NSP. Institutions will be allowed to set their own eligibility criteria within this group. In 2010/11 around 200,000 students from England35 36 received a full grant. The NSP could benefit 50,000 students if it cost £3,000 each. Matched funding from universities could either 23 Interim impact assessment –Urgent reforms to higher education funding and student finance, BIS (26
November 2010). Table 9 24 Interim equality impact assessment –Urgent reforms to higher education funding and student finance,, BIS
(November 2010), p18 25 Written ministerial statement 8 November 2010 Higher education funding and student finance 26 October 2010 grant announcement, HEFCE 27 Student numbers from HESES and HEIFES surveys 2009, HEFCE 28 Interim equality impact assessment –Urgent reforms to higher education funding and student finance, BIS 29 Written ministerial statement 8 November 2010 Higher education funding and student finance 30 HC Deb 16 December 2010 c215-6WA 31 Full-time and part-time students: loans for tuition, BIS (4 February 2011) 32 Reform for higher education and student finance, BIS (3 November 2010) 33 HC Deb 3 November 2010 c925W 34 The National Scholarship Programme – Year one, BIS 35 Covers those in universities across the UK, while the NSP will only apply to students at English institutions. 36 Student Support for Higher Education In England, Academic Year 2010/11 (Provisional), Student Loans
Company. Table 3A
10
increase the financial benefit to these students or mean that a greater number benefit. Institutions without an access agreement can also take part in the NSP. They will face a reduced ‘matched’ funding requirement.
Aspects of the original proposals set out for the NSP were criticised by the IFS, The Sutton Trust and other groups. The main focus has been on the ‘perverse incentive’ on institutions not to accept students from poorer backgrounds and on the use of free school meals as an indicator.37
Access agreements At the same time as the details of the NSP were published the final guidance to the Director of Fair Access was produced. This set out what might be expected of universities that charge fees of over £6,000 per year.38 In March the Office of Fair Access published guidance on what to include in their access agreements and broad guidelines on how much should be spent. They suggest that access spending should start at a flat rate for fee levels just over £6,000 and this should vary according to the proportion of under-represented students at the institution (higher spend where this proportion is lower). This could then increase in line with fee levels above £6,000. Again there are varying rates with a suggestion of around 30% of fee income over £6,000 for institutions with lower proportions of under-represented students and around 15% for institutions with a high proportion. Offa emphasises that these are not prescriptive either in terms of overall spend or type of spending. They are broad guidelines and are only intended to be illustrative.39
Offa’s analysis of revised access agreements included a summary of planned spending on access. Total access agreement spending is planned to increase from just over £400 million in 2011/12 to around £620 million in 2015/16. The 2015/16 figure would be just over one-quarter of the additional income above the basic (£6,000) fee level. The profile of expenditure is expected to move away from bursaries, scholarships and discounts on student services and towards fee waivers, outreach and measures to move retention. Fee waivers are expected to be worth around £260 million in 2015/16 out of a total (access agreements and NSP) of £740 million. The strict financial benefit of fee waivers is to graduates and the taxpayer through reduced loan repayments and smaller loan subsidies. Current access agreement spending is largely made up of scholarships and bursaries and does not include fee waivers.40
Other access expenditure The current Aimhigher scheme which supports widening participation will end in July 2011.41 The requirement to pay a minimum bursary of 10% of the maximum fee to students on a full grant will also be ended. In 2008/09 this financial support for lower income students was worth £312 million and the average bursary was £980.42 HEFCE has maintained its support for widening participation in cash terms in 2011-12.43 It plans to keep a widening participation
37 Higher Education Reforms: Progressive but Complicated with an Unwelcome Incentive, IFS briefing note 113
(December 2010); Ministers' tuition fees exemption proposals panned, PublicFinance 6 December 2010; Responding to the new landscape for university access; The Sutton Trust
38 Guidance to the Director of Fair Access, BIS (February 2011) 39 How to produce an access agreement for 2012-13, Offa 40 Offa press release 2 December 2011, OFFA announces decisions on revised 2012-13 access agreements 41 HC Deb 25 November 2010 42 Access agreement monitoring 2008-09, and earlier, OFFA 43 Higher education funding for 2011-12 and beyond, BIS 20 December 2010
11
funding element in 2012-13. They also expect to provide a widening participation allocation from 2013-14 and are working to develop a new funding method.44
3.2 Overall funding and student numbers The 2011-12 funding letter to HEFCE set out the budget for 2011-12 and indicative teaching allocations for 2012-13.45 The recurrent grant for teaching will be cut by 6.1% in cash terms in 2011-12; a 7.9% cut in real terms.46 The indicative 2012-13 figure –which only takes partial account of the new arrangements for new students- is 23% below the 2010-11 figure in cash terms or a 26% real terms cut.47 The letter reports a BIS ‘projection’ that teaching grant in 2014-15 will be around £2 billion; 60% below 2010-11 levels in cash terms and around 63% below in real terms. By this time most, but not all students will come under the new arrangements. Cuts in research funding are much smaller; recurrent research funding in 2014-15 is around 11% less than the 2010-11 figure in real terms. Cuts in capital are much larger, but capital grant forms only a small share of total HEFCE funding. Total funding for higher education through HEFCE in 2011-12 will 9% less than 2010-11 levels in cash terms (11% real). The 2012-13 total will be 21% below 2010-11 levels in cash terms (24% real).
Browne recommended that student numbers should be increased by 10% (roughly 90,000 full-time equivalents48) over the next three years. The implication is that part of this increase should be made before the new arrangements are introduced in 2012/13. The report recommended that places should follow student demand, meaning that some institutions would grow by more than 10%, while others could shrink. It proposed that the Government should have some control over student numbers by limiting student finance (maintenance support and fee loans) only to prospective students who meet minimum entry requirements (set by Government each year).49
The statement on the Government’s reform proposals did not address the question of student numbers. The Minister for Higher Education has said that it will be addressed in the Government’s long-term response to the Browne Report.50 The grant letter said that student numbers should remain at 2010/11 levels in 2011/12. An additional 10,000 places were funded (for their full duration) in financial year 2010-11. The grant letter states that these additional places can be carried forward into 2011/12, but not into 2012/13.51 The White Paper acknowledged that the demand for higher education is likely to carry on growing and gave various reasons including improved school/college attainment, rising demand from employers. It said:52
We have no target for the “right” size of the higher education system but believe it should evolve in response to demand from students and employers, reflecting particularly the wider needs of the economy. Subject to expenditure constraints, we endorse the principle enunciated in the Robbins report that “courses of higher
44 Teaching funding and student number controls. Consultation on changes to be implemented in 2012-13,
HEFCE June 2011 45 ibid. 46 Prices adjusted using June 2010 Budget assumptions about the GDP deflator. The real cut is slightly larger
(8.4%) if OBR assumptions about the GDP deflator are used. 47 Again this uses Treasury assumptions about general inflation in the economy... 48 Based on HEFCE mainstream funded student numbers of 926,000 (including foundation degrees) in 2010-11.
HEFCE news release 22 July 2010 HEFCE publishes revised recurrent grant and student number allocations for 2010-11
49 This letter sets out funding for the upcoming financial year (2011-12). However, in the past where there has been a multi-year settlement it has given details for all years covered by the most recent spending review.
50 HC Deb 3 November 2010 c932 51 Higher education funding for 2011-12 and beyond, BIS 20 December 2010. para. 14 52 Cm 8122. Para 4.15
12
education should be available for all those who are qualified by ability and attainment to pursue them and who wish to do so.”
It stressed that overall costs still needed to be managed. There are no plans to increase the total number of controlled places, as stated in the funding letter, but some places will be free up for competition between institutions. Initially around 85,000 places (23%) of the total will be ‘freed up’ in 2012/13 and this proportion will be increased over time. The Government will do this by introducing a ‘core and margin model’ where institutions compete for places outside their core allocation. In 2012/13 there will be unrestricted recruitment of students achieving the equivalent of AAB53 at A level. It is expected that this will cover around 65,000 students. All institutions will have their core allocation reduced by the number of such student they currently recruit (57,000 in 2009/10) and there will be pro rata cuts in the core allocations of all institutions for the expected growth in this group. This is expected to take the total to around 65,000 students/places in 2012/13. Institutions will be able to compete for these students as they will have no limit on the number they can take. Competition for these students will be between the most selective institutions. The remaining places, estimated at 20,000 in 2012/13, will be taken in pro rata cuts in the core allocation of all institutions. Any institution that charges an average fee (after fee waivers) of £7,500 or below and can demonstrate the quality of and demand for their courses can bid for these places.54 The Government has asked HEFCE to consult on the details of this proposal. It plans to widen both of these elements after 2012/13 and shrink the core allocation of each institution. The impacts are not clear at the moment. With no overall increase in student numbers there will be winners and losers among institutions.
After consultation HEFCE made a number of changes to their initial core and margin proposals. These do not change the nature of the system, but are generally aimed at protecting particular subjects/institutions or helping to ensure fair access. Details are given in Student number controls for 2012-13 Invitation to bid for student places.
The White Paper also signalled a longer term intention to ensure that employer- or charity-sponsored places do not count against an institutions student number control, as all but ‘closed courses’ would do at present. This could increase the number of students, but the White Paper stresses that the Government needs to ensure that they do not create any additional cost to the public sector.55
Student numbers in 2011 and beyond The introduction of fees in 1998 and the increase in ‘variable fees’ in 2006/07 saw the only falls in applicants since the sector was reorganised in 1994. Both were preceded by large increases in applications and entrants to higher education.56
2009 and 2010 both saw increases in the numbers of applicants57 failing to gain a place. Provisional data for all UK universities 2011 show further increases in applicants and acceptances. The increase in applicants was 1.2%,58 a modest rise compared to those seen before the previous tuition fee increases. Analysis due out later this year will give a more accurate indication for home and EU applicants to English institutions.
53 No details have yet been published of exactly what or how many qualifications students will be able to count
against this target. 54 Higher education: Students at the heat of the system. Impact Assessment, BIS (June 2011) 55 Cm 8122. Paras 4.22-4.23 56 See Entrants to higher education for more detail 57 Full-time applicants via Ucas 58 Applicant statistics 22 September 2011, UCAS
13
The past pattern would on its own suggest that applications and possibly student numbers will fall in 2012/13. In addition the number of 18 and 19 year olds is projected to continue its recent fall in 2012/13 and beyond. Against these factors are the relatively large number of unsuccessful applicants in recent years and the tough labour market, especially for young people. The first meaningful evidence will come shortly after the main deadline for application in mid-January 2012. Student applicant numbers recovered quickly after the 2006/07 dip. Even if there is a fall in 2012 it could be some years before it is clear whether this is temporary and has had any impact on the long-term trend in participation.
3.3 Early repayment mechanism The Government started a consultation on an early repayment mechanism when the White Paper was published. This will run until September 2011 with the aim of introducing a system that allows for early repayments ‘... without undermining the progressive nature of the system overall.’
4 Financial impact on universities The Government has said that the cash available to universities in total through fees and direct support could increase over the next four years. The impact on individual universities will depend to a large extent on the level at which they set tuition fees and the response to this from potential students. The Higher Education White Paper sets out how student number controls will be relaxed in the future and hence the scope for competition between universities for students.
The annual funding letter from the Government to HEFCE said that the cash value of HEFCE recurrent teaching and research grant and tuition fees supported by student loans could increase by around £1 billion between 2010-11 and 2014-15.59 60 This would broadly keep pace with inflation over these years.61 Universities are expected to have to spend more on access initiatives and capital funding will be cut. These figures assume average fees of around £7,500. Were universities to charge such fees then overall they would be able to broadly maintain levels of funding in real terms over this period. The size of the cuts to teaching funding in 2011-12 were indicated in section 1.2.
The Browne Report estimated that direct public funding via the main funding formula for undergraduate teaching would be cut by 80% when its proposals were fully enacted.62 Their analysis suggested that Universities would have to charge around £7,000 on average to maintain investment at current levels.63 The precise ‘breakeven’ figure for the sector as a whole is not yet clear under the Government’s proposals. Funding is being cut in 2011/12, so the choice of baseline year will affect the breakeven level. It will vary considerably by institution and course. Core funding for tuition will be ended for arts and humanities courses (price bands C and D) and an amount equivalent to the band C cut (£3,830 before top-ups in 2010/11) is expected to be taken from funding for higher cost courses including medicine, dentistry and lab-based courses. The White Paper said that total funding for postgraduate courses would reduce from 2012/13 onwards ‘...in line with our reforms to funding for
59 Tuition fee income up by around £4 billion, teaching grant cut by almost £3 billion, research grant broadly at
the same level. 60 Higher education funding for 2011-12 and beyond, BIS 20 December 2010. para.12 61 Avlues adjusted using December 2010 GDP deflators 62 Browne Report p42 63 ibid. Section 4.2
14
undergraduate teaching.’64 HEFCE launched a consultation on the precise funding method following the publication of the White Paper.
The increase in fees in 2006/07 gave additional income to universities per student as it was not accompanied by a cash cut in public funding per student.65 The net financial impact on universities of these proposals will depend to a large extent on their decisions about fee levels and the response from students. Income per student could increase for some institutions that set fee levels high enough. The total impact on levels of public funding for individual institutions will also depend on how student numbers change, their obligations under the NSP, changes to current bursary arrangements and on the level of other funding streams from HEFCE.66
Universities may have greater incentives to use fee levels to boost total income by attracting more students. They had to propose fee levels before the White Paper set out how the new system should work, and before HEFCE had started its consultation on student number controls and how it will allocate its funding for teaching. Revised access agreements showed that some institutions were are prepared to cut fees to boost numbers, or at least to avoid a cut in numbers. The Government has indicated that total student numbers are not likely to be increased over the next four years.67 The previous section looked at the proposals in the White Paper for a more flexible allocation of places.
HEFCE published their funding totals for academic year 2011/12 in early February 2011. This funding is an underlying reduction of £685 million or 9.5%. Most of these cuts are to teaching and capital funding. The figure rises to £940 million if short-term funding for special programmes in 2010/11 is included.68
Direct public funding is one source of income for universities. Higher education finance statistics looks at the changing importance of different sources of income.
5 Impact on public spending Student loans and public expenditure Only the subsidy element of student loans made in any one year counts as public expenditure. These are viewed as the permanent costs to the taxpayer. The amount which is repaid is seen as the temporary effect of financial transaction. This system of resource accounting and budgeting (RAB) or accruals accounting has been in place in the public sector for more than a decade. The subsidy element is the face value of loans made in any one year less the present value of future repayments. This is frequently expressed as a proportion of the value of loans, the so-called RAB charge. When compared to commercial loans there are two main parts to the subsidy in student loans –their interest rate and their write off terms. From 2010-11 this subsidy element is being reclassified as an ‘impairment’ in departmental accounts. It is still included as part of resource Departmental Expenditure Limits (DEL), but is now in a category, alongside depreciation, that is excluded from total DEL and some resource DEL figures, such as the ‘headline’ Comprehensive Spending Review totals. This means it is
64 Cm 8122. Para 1.31 65 DIUS Departmental Annual Report 2009., Annex 1 table 16 66 In 2010-11 total HEFCE funding for teaching is around £4.7 billion, £3.9 billion of which is based on the main
teaching method (including postgraduates). A further £1.6 billion is paid for research and £1.1 billion for capital, special funding and other areas. Guide to funding How HEFCE allocates its funds, HEFCE (September 2010)
67 HC Deb 4 March 2011 c713W 68 Funding for universities and colleges for 2010-11 and 2011-12, HEFCE circular 05/2011
15
also excluded from Total Managed Expenditure, the main public spending aggregate, and does not count against the deficit.
The grant letter projections indicated that funding for teaching in 2014-15 could be around 60% lower than 2010-11 in cash terms and 64% less in real terms. The Comprehensive Spending Review settlement for BIS set out the total level of resources for higher education (excluding research). This was to fall from £7.1 billion in 2010-11 to £4.2 billion in 2014-15;69 a cut of 46% in real terms.70 This spending covers funding for teaching via HEFCE, direct maintenance support and spending by BIS on access. It excludes the cost of the subsidy element of student loans which are expected to increase from £1.7 billion in 2010-11 to £3.3 billion in 2014-15.71 Adding these two elements together means total public funding for higher education (excluding research) is expected to fall from £8.8 billion in 2010-11 to £7.5 billion in 2014-15; a real cut of 23%.
The savings from removing direct funding and fee and course grants for part-time students are thought to be greater than the additional costs of providing fee loans. The net saving on part-time student funding in 2014-15 has been estimated at £150 million.72
Even by financial year 2014-15 the full impact of the proposals will not have fed through as it covers academic years 2013/14 and 2014/15. Not all students will be under the new arrangements by then. This means that if nothing else changes there would still be cuts in public expenditure in 2015-16 as the proposals reach a greater proportion of students. The impact assessment estimated that the steady-state savings, when all students are under the new arrangements, will be around 20% greater than those in 2014-15.73
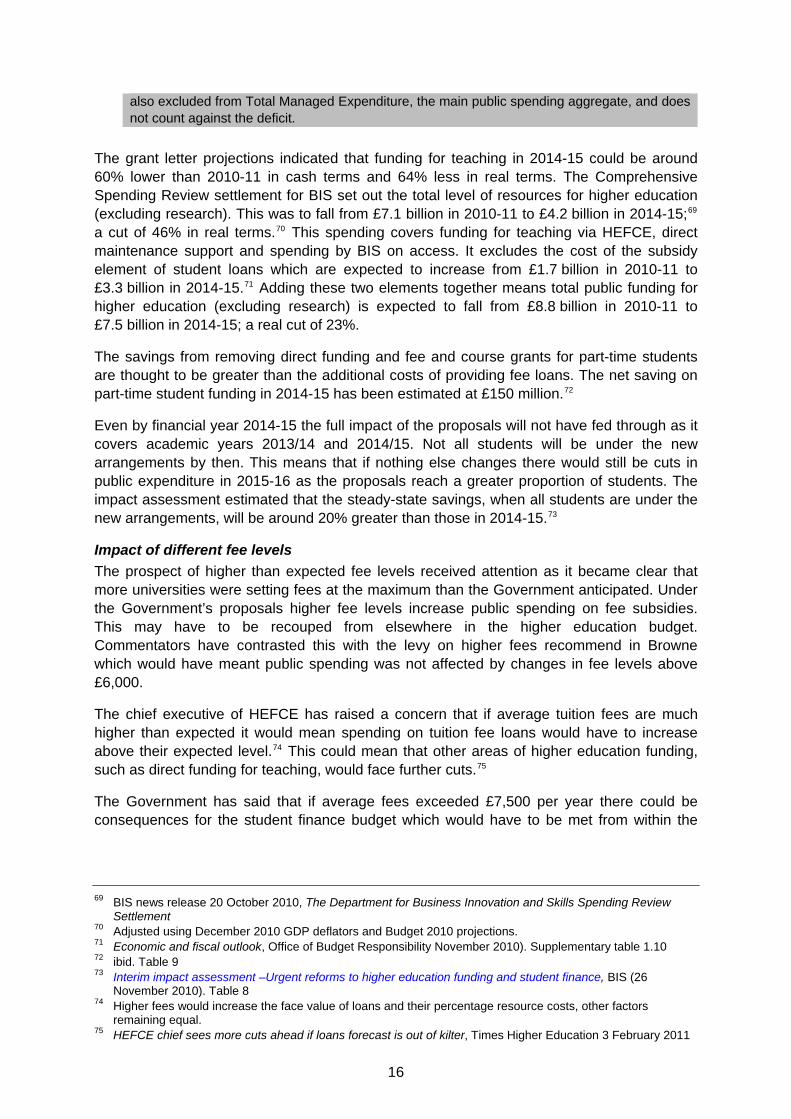
Impact of different fee levels The prospect of higher than expected fee levels received attention as it became clear that more universities were setting fees at the maximum than the Government anticipated. Under the Government’s proposals higher fee levels increase public spending on fee subsidies. This may have to be recouped from elsewhere in the higher education budget. Commentators have contrasted this with the levy on higher fees recommend in Browne which would have meant public spending was not affected by changes in fee levels above £6,000.
The chief executive of HEFCE has raised a concern that if average tuition fees are much higher than expected it would mean spending on tuition fee loans would have to increase above their expected level.74 This could mean that other areas of higher education funding, such as direct funding for teaching, would face further cuts.75
The Government has said that if average fees exceeded £7,500 per year there could be consequences for the student finance budget which would have to be met from within the
69 BIS news release 20 October 2010, The Department for Business Innovation and Skills Spending Review
Settlement 70 Adjusted using December 2010 GDP deflators and Budget 2010 projections. 71 Economic and fiscal outlook, Office of Budget Responsibility November 2010). Supplementary table 1.10 72 ibid. Table 9 73 Interim impact assessment –Urgent reforms to higher education funding and student finance, BIS (26
November 2010). Table 8 74 Higher fees would increase the face value of loans and their percentage resource costs, other factors
remaining equal. 75 HEFCE chief sees more cuts ahead if loans forecast is out of kilter, Times Higher Education 3 February 2011
16

overall higher education budget.76 In other words higher spending on loans could lead to a cut in funding paid directly to institutions via HEFCE.
The Government has used a figure of £7,500 as its estimate of average fees for planning purposes. This figure feeds through to the budgets it has set for higher education. A higher average tuition fee means a higher average tuition fee loan. This increases public spending in two ways. First because the face value of loans increases their total value increases accordingly. Second because with a larger loan the likelihood that graduates repay in full is smaller. Thus the percentage RAB charge increases. The combined effect is that public spending becomes a larger share of a larger total loan amount. The reverse is true with lower average fee levels. Any decline in student numbers would reduce the need for cuts to be made elsewhere, but a temporary decline would only delay this.
An alternative approach has been proposed by Barr and Shephard.77 This is intended to ensure that the potential costs of higher fees are borne by the institutions that charge them and hence allow student numbers to increase. On direct funding they propose a system where teaching grant is partially restored to institutions that charge lower fees, institutions receive a ‘pupil premium’ for accepting disadvantaged students. On loans they suggest repayment thresholds are raised less often and possibly by a smaller amount and costs of the ‘leaky’ loan system are reduced by a combination of a national risk premium (higher earning graduates pay more to balances losses from low earners) for fees up to a specified level and an institution-specific insurance premium (to match the predicted loss on the loans its students take out) for fees above a this.
Illustrations of the impact of higher fee loans The following example gives an illustration of the underlying mechanisms behind this. It uses a very large increase in loans and some simplifying assumptions and is for illustration only. The results are for a ‘steady-state’ situation where all students are under the new system, not the first year of changes. The RAB charges are from BIS loan ready reckoner and it uses 2012/13 loan terms.
0.9 million potentially fundable students, 90% fee and maintenance loan uptake where everyone takes out the same loans of £3,500 for maintenance and £6,000 for fees. RAB charge is 27%; total value of loans in year is £7.7 billion (0.9 million x 90% x £9,500) and the associated public expenditure is £2.1 billion (£7.7 billion x 27%).
Increasing the fee level to £9,000 increases the total value of loans in year to £10.1 billion. It also increases the RAB charge to 34%. This is not a marginal rate but applies to the whole loan value. The associated public expenditure increases to £3.4 billion.
The Browne proposals would have meant that public expenditure on loans would not have been affected by variations in the average fee level. The Government’s average fee level of £7,500 implies RAB charge for the new system of around 30%.78 While the percentage RAB charge does not vary greatly with changes in fee assumptions, the marginal rate does. This is the subsidy element of the additional loan amount. An increase in the total (fee plus maintenance) loan from £7,000 to £7,500 has a marginal RAB charge of 39%, this rises to a marginal rate of 60% for an increase from £12,000 to £12,500.
76 HC Deb 4 March 2011 c713W 77 Nicholas Barr & Neil Shephard, Towards setting student numbers free 78 HC Deb 19 January 2011 c834W and BIS loan repayment ready reckoner
17

It is important to note that fee waivers under the National Scholarship Programme and access initiatives of individual institutions are likely to mean that the average fee loan will be less than the average fee. It is the average fee loan that directly affects public spending. Offa’s estimated average fee post-waivers of £8,161 increases the RAB charge to around 32% and could increase public spending by around £300 million in steady-state. However, revised access agreements could mean the average fee is lower than this and, students may opt for less expensive courses. In addition a fall in student numbers would also reduce this cost.
These calculations look at fee levels and fee loans in isolation from the savings made in direct public support through HEFCE. Where loan funding replaces direct support any RAB charge below 100% represents a saving to public finances. In other words if we expect some repayments it is cheaper to support loans rather than pay directly. However, at some fee levels not all the loan funding will replace direct support. Browne assumed an average breakeven fee of around £7,000. At fee levels below the breakeven point the loan system which replaces direct support represents a saving to public funding. At higher fee levels the additional loans represent a cost to Government, but all the benefit goes to the institution. The Browne proposals for a levy on higher fees were aimed at reducing these effects and helping to control public spending.
Impact on public expenditure v impact on public sector debt The Government proposals will cut public expenditure because it is calculated on a resource or accruals basis. Only the subsidy element of the loan counts as public expenditure. The shift in funding from direct public support to loans means that public expenditure on higher education will fall despite the fact that the Government has indicated that the amount of cash universities receive from loans and direct support will increase. Public expenditure on this basis will fall, but the Government still needs cash to make these loans.
The Office for Budget Responsibility (OBR) has estimated that the additional cash needed to fund higher tuition fees will reach £4.3 billion in 2014-15 and rise to £5.6 billion in 2015-16. This adds to the stock of public sector debt. The cumulative addition by the end of the spending review period is estimated at £7.5 billion. This increases to £13 billion by 2015-16, the end of the OBR’s forecasting period.79 These estimates look at the impact of higher fee loans in isolation from the other aspects of the proposals so are not an estimate of the net impact on debt. They assume an average fee loan of £7,500 for new students from 2012/13.
The Government has indicated that the total cash for institutions backed by BIS (recurrent funding available for teaching and the cash value of fee loans) could increase by around 10% between 2010-11 and 2014-15.80 This implies that the net impact of these changes in funding and financing could be to increase public sector debt in the short to medium term, possibly by around £1 billion in 2014-15. In the longer term higher loan repayments are expected to reduce the size of the debt. It could be argued that an alternative policy would increase the debt in the short term by a greater amount.
The OBR’s July 2011 Fiscal sustainability report looks further forward. This projects that with a £7,500 fee loan from 2012/13 and annual upratings in line with RPI the addition to national debt from student loans will peak in around 2030 at 3.4% of GDP or around £50 billion in current prices. This increases to around £53 billion with an average fee loan from 2012/13 of £8,000. These calculations do not include the financing costs of this element of public debt
79 Economic and fiscal outlook November 2010, OBR. Box 4.3 80 Higher education funding for 2011-12 and beyond, BIS 20 December 2010
18

on its own. Any sale of the student loan portfolio would transfer some or all of this debt to the private sector.
The loan model Questions have been raised about the accuracy of the Government’s loan model used to calculate the RAB charge. The Higher Education Policy Institute (HEPI) has said that over optimistic assumptions about earnings growth and assumptions about the gender balance of graduates both mean that the estimated RAB charge is too low.81 According to the IFS the model over estimates annual earnings at the top of the income distribution compared to their profiles of lifetime earnings.82 Barr and Shephard have said ‘There are good grounds for regarding the underlying assumptions as optimistic.’83
There is no reason to think that this model is fundamentally different from those used in the past. The important differences under the proposed system are 1) that total public spending on loans will increase so a given percentage point inaccuracy in your estimate has a greater financial impact, 2) the expansion is in average loans/loan duration not numbers of borrowers so it is more important to accurately predict incomes further into the future which is fundamentally more difficult and iii) uncertainty about fee levels makes it harder to predict total student loans and how these vary. Taken together with changes to loan terms these factors mean it is both more important and more difficult to accurately predict future levels of repayment. The expansion of the loan system to part-time students, possible incentives for early repayment or upfront payment and the large proportionate increase in loans for EU students84 all add to the uncertainty.
The chart opposite illustrates the model ready reckoner assumptions about earnings growth. It compares average growth for graduates in employment with the assumed 2% annual increase in average earnings. Graduate incomes are assumed to increase rapidly at the start of their careers, increase slightly faster than average through their mid-career before the gap grows at a faster rate towards the end of this period. The average annual real earnings growth rate for the first five years is just under 15% for men and 11% for women. Average real growth rates for the whole period are assumed to be 5.2% for men and 3.6% for women.
0%
50%
100%
150%
200%
250%
300%
0 5 10 15 20 25 30
Model assumptions about earnings growthcummulative real growth for employed
Loan model graduates (average income of those employed each year)Model average earnings
The table below summarises some of the assumptions. The model assumes that the average earnings of male graduates 30 years after completing their course would be almost £220,000 in cash terms or just under £100,000 in 2016 prices. The gap between male and female earnings and its growth over time for the cohort are both very clear. 81 The government's proposals for higher education funding and student finance – an analysis, HEPI (November
2010) 82 Government proposals for higher education would squeeze high earners less and cost the taxpayer more, IFS
(November 2010) 83 Nicholas Barr & Neil Shephard, Towards setting student numbers free 84 EU students are only eligible for fee loans, so for any likely increase in fee loans their maximum loan will
increase to a much greater extent than home students who can also claim maintenance loans. Their share of the total amount borrowed by would only fall if their numbers fell quite dramatically.
19

Earnings and employment assumptions in the BIS loan model ready reckoner -2016 cohort
Average earnings of those in employment (£k cash)
Average earnings of those in employment (£k 2016 prices) % of cohort in employmenta
male female Total male female Total male female Total1 23.1 17.9 20.5 23.1 17.9 20.5 74% 75% 74%5 47.2 31.3 39.4 42.3 28.1 35.3 92% 88% 90%10 67.6 42.8 55.8 53.0 33.6 43.7 91% 83% 87%15 86.5 54.2 71.1 59.2 37.1 48.7 89% 80% 85%20 112.2 67.4 91.4 67.0 40.2 54.6 84% 72% 78%25 152.1 86.1 121.0 79.3 44.9 63.1 77% 69% 73%30 218.5 110.9 169.5 99.5 50.5 77.2 66% 55% 61%
(a) This is not an employment rate as its denominator includes borrowers who have had their loans written off due to death or disability
Source: Student Loan Repayment Ready Reckoner
Year post 'graduation'
HEPI has looked at the model in some detail to attempt to see whether the Government’s proposals will save money.85 They state that ‘...the RAB charge estimates are lower than they should be.’ Some of the earnings output from the model are said to look ‘optimistic’ particularly the acceleration of male earnings between 20 and 30 years into their careers. The model ready reckoner assumes a 50:50 gender split. HEPI’s adjustment to better reflect the actual gender balance on its own increases the RAB charge by 3-4 percentage points. At the time they also expected average fees to be higher than the Government’s planning assumption. Their assumption that 95% of fees set at £9,000 further increases the RAB charge. They conclude that ‘...the savings that will accrue to government will in reality be much lower than expected...’.
Rather than calculate an alternative RAB figure or range based on what they considered more realistic assumptions they first calculated the RAB charge break-even point. This is the level at which the new system costs the same as the old. This was calculated from their revised model at 47%. They then looked at the graduate earnings growth assumptions needed to hit this figure in order to determine whether it was realistic, optimistic or pessimistic. This was calculated at an average of 3.3% per year real compared to 2.0% real for average earnings and 4.5% assumed by BIS. The lower growth figure is said to be ‘entirely plausible’.
So the answer to the question, “will the proposals decrease the public contribution to HE” is, “it’s too close to call, but they could actually easily lead to a small increase in the public contribution”.86
These earnings growth figures were subsequently revised to take account of changes in threshold uprating. The new break-even figure was 3.75% -ie. earnings need to increase faster for the Government to break even under annual threshold uprating. They conclude:87
The increase in the frequency of the threshold updates makes it more likely tuition costs to government will not be decreased.
HEPI congratulated BIS on their ‘unprecedented level of openness’ in publishing this ready reckoner. It is important to realise that the Government’s main loan model is larger and includes some different elements, such as a more accurate gender balance and variations in
85 HEPI (2010) 86 ibid. para 15 87 The government's proposals for higher education funding and student finance – an analysis. Addendum:
Further details of government proposals, HEPI (December 2010)
20

loan amounts. This has not been made publicly available for scrutiny. While the certain outputs of this model may be somewhat different from those of the ready reckoner it is highly unlikely that the differences are substantial. For instance the Government has given no indication –either in its analysis of the impact of these proposals or responses to questions about the cost of the new system- of any RAB charge which is different from those produced by the ready reckoner.
Revisions to the loan model The Impact Assessment for the White Paper stated that standard modelling updates had increased the estimated overall RAB charge from 28% (given at the time the reforms were produced) to 32%. This increase was in large part due to the change from five-yearly to annual threshold uprating.88 The BIS annual report and accounts for 2010-11 described changes to the approach used to determine some model assumptions. In the past it was assumed that short-term fluctuations in earnings and the RPI would even out over the duration of the loans. Data from the OBR suggested that the lower levels of repayment expected in the short-term (due to the economic downturn) might not be ‘recovered’ over the lifetime of the loans. Therefore BIS has adopted OBR short-term forecasts for earnings growth and RPI up to 2015-16.89 The main impact of this is on the valuation of current loans, but it has implications for the overall level of public subsidy. Any further cut in earnings forecasts would increase the RAB charge and vice versa. The impact would be more important for the new system from 2012 where much more funding will come through loans with the aim of cutting public expenditure.
6 Illustration of the impacts of the Government’s proposals This section uses the BIS Student Loan Repayment Ready Reckoner: Model to show how repayments might vary by income group and how changes in the model’s parameters can affect these figures. It has been amended to reflect the change to annual threshold uprating. This model is a smaller version of the one used by BIS to calculate the resource cost of loans for its public expenditure figures. The main purpose of the ready reckoner is to give an indication of the impact of different model parameters. Detailed breakdowns of the impact by sub-group from this version of the model may not give the most accurate results. Readers should look at the BIS background note on the model to help understand how it was put together, what the results mean and its limitations. The model itself can be downloaded here.
6.1 Net present value (NPV) of repayments by lifetime income decile Main results Unless otherwise specified the charts in this section look at the NPV90 of loan repayments by lifetime income decile (10% band from lowest to highest). The chart opposite assumes an annual loan of £11,660 (£3,500 maintenance plus £8,160 fee loan). The fee loan element is based on the Offa estimate average fee post waivers and is above the £7,500 assumption used by the Government. This average loan is used for the other charts here, unless otherwise specified. The charts also give the RAB for the standard assumptions where relevant.
£0k
£10k
£20k
£30k
£40k
1 2 3 4 5 6 7 8 9 10
32% RABcharge
Here those in the lowest lifetime income band (decile 1) 88 Impact Assessment Higher Education: Student at the Heart of the System, BIS. pp53-54 89 BIS Annual Report and Accounts 2010-11. p143 90 The real value of repayments discounted at 2.2% per year. This is the standard Treasury discount rate,
equivalent to the Government’s assumed cost of borrowing.
21

repay an average discounted amount of just over £5,000, while the top four deciles all pay around £30,000. The average cash values of repayments are highest in deciles 7-9 where they are all above £77,000.
Variation in loan amounts. The charts below show the impact of increasing the average annual loan (maintenance + fees). The bottom four deciles are hardly affected by higher loan levels (higher fees by implication). Lower earners are less likely to repay their loans and adding more to the amount they borrow has no impact on this. Only those who fully repay their loans well before the 30-year write-off date are affected to any great extent. The NPV of repayments for the top two deciles is around £10,000 more when the average annual loan is increased from £10,000 to £13,000.
£11,000 £12,000 £13,000
£0k
£10k
£20k
£30k
£40k
1 2 3 4 5 6 7 8 9 10
30% RABcharge
£0k
£10k
£20k
£30k
£40k
1 2 3 4 5 6 7 8 9 10
33% RABcharge
£0k
£10k
£20k
£30k
£40k
1 2 3 4 5 6 7 8 9 10
35% RABcharge
Changes in loan terms. The next charts all assume a £10,000 annual average loan and look at the impact of the reversing the main changes to the repayment system one at a time.
0% real interest rate £15,000 repayment threshold 25 year write-off Main results
£0k
£10k
£20k
£30k
£40k
1 2 3 4 5 6 7 8 9 10
43% RABcharge
£0k
£10k
£20k
£30k
£40k
1 2 3 4 5 6 7 8 9 10
21% RABcharge
£0k
£10k
£20k
£30k
£40k
1 2 3 4 5 6 7 8 9 10
37% RABcharge
£0k
£10k
£20k
£30k
£40k
1 2 3 4 5 6 7 8 9 10
32% RABcharge
Compared to the main results (shown again on the right for comparison) lowering the interest rate benefits those in deciles 7-9 the most. A lower repayment threshold would mean that lower earners pay more, the highest earners are virtually unaffected and the overall shape of the distribution is less progressive. Both the lower interest rate and lower threshold have a large impact on the RAB charge. The shorter loan write-off period benefits those in the middle of the income scale (deciles 4-8) the most. Lower earners pay little or nothing more in the extra five years while the highest earners have already paid off their loans well before the shorter write-off deadline.
22

Impact of threshold levels and uprating assumptions While the changes to the interest rate and write off terms are simple ways to compare the current and proposed repayment systems, the repayment threshold is more complex. To compare them directly means assuming that the current £15,000 repayment threshold would still have been in place in 2016. While the last Government had no explicit uprating rule the threshold was initially set at £10,000 when income-contingent loans were first introduced in 1998/99 and increased to £15,000 in April 2005. It was reviewed in 2010, but the Government said that to change its value in line with (annual) RPI inflation at the time would have meant reducing the threshold, and it would be reviewed again in 12 months time.91
BIS analysis of the value of repayments by decile compared the Government’s original proposals and a lower average fee loan than used here, to those in the Browne Report and the current system. This concluded that graduates in the lowest two income deciles would pay less under the proposals than under the current scheme. This finding still holds with the higher average loan used here. The analysis makes certain assumptions about changes to the earnings threshold under the current system, but these are not made explicit. The model needs to use a lower level of periodic uprating to the current scheme threshold than the level assumed for the proposals to get the distributional ‘shape’ of repayments by decile it has produced. Alternative assumptions, such as setting the current threshold at a level which uprates it for changes in average earnings since 2005 (when it was set) and doing so every five years in the future (as the model did for the Government’s proposals), change the results. In this case the NPV of repayments is higher under the Government’s proposals in every income decile. The size of the gaps depend on the precise thresholds used, but are smallest in decile 1 and increase rapidly up the graduate income scale.
The BIS analysis was produced before the Government announced its intention to uprate the current threshold only from 2012 onwards. This will affect the precise differences between the two schemes shown, but does not affect their overall conclusion -the bottom two income deciles pay less under the proposals. This is because the current scheme threshold is being reduced in real terms to 2012, maintained in real terms to 2016, and then, if the policy continues, uprated at a slower rate than the threshold for the new scheme. Students do not have any direct choice about what repayment scheme they are under. The comparison is purely theoretical from an individual student’s perspective. Variations in the threshold assumptions do not alter the fact that the overall distribution of repayments is still more progressive under the Government’s proposals. As indicated earlier, changes to assumptions about average loan levels have little impact on repayments in the lowest income deciles. Higher fees make the distribution more progressive. What this analysis shows more than anything is the importance of the underlying assumptions used in modelling.
91 HC Deb 24 November 2009 c76W
23

6.2 Other measures and types of graduates by decile Repayments as a percentage of lifetime income. The chart opposite compares real levels of (undiscounted) repayments with lifetime earnings. This shows that when expressed as a proportion of lifetime income, average repayments per decile are largest among the lowest 50% of earners –they are not progressive. At higher incomes loans are repaid quickly and these graduates continue to earn large incomes afterwards and make no further repayments. Discounting repayments has no impact on the shape of this distribution. The shape remains broadly the same with higher fee assumptions, for instance with an average annual loan of £13,000 the distribution is virtually flat up to decile 8.
0.0%
0.5%
1.0%
1.5%
2.0%
1 2 3 4 5 6 7 8 9 10
Gender breakdown of each lifetime income decile. The chart opposite shows the proportion of women in each income decile. This shows a very clear pattern. The model assumes women have lower average earnings when in work and longer periods out of the labour market. The result is they make up more than 80% of the bottom half of graduates by income and just over 1% of the top 30%.
0%
20%
40%
60%
80%
1 2 3 4 5 6 7 8 9 10
Loan write-offs by type. Loans are written off after 30 years (effectively because of low income) or because of death or disability. The model also makes assumptions about the latter. The proportion of each decile who have their loans written off for different reasons is given opposite. A large majority of graduates do not repay in full in deciles 1-6. The lowest income decile includes a relatively large number of graduates who have their loans written off due to death or disability. The model assumes that it includes many more graduates aged 30 or above (64% compared to 22% across all groups).
0%
20%
40%
60%
80%
100%
1 2 3 4 5 6 7 8 9 10
death/disabilitylow income
Main results excluding death/disability write off. This chart reworks the main results excluding those who have their loans written off for death/disability. This effectively means that income deciles are more closely related to low average earnings in work and participation in the labour market. This particularly affects the lowest decile whose NPV of repayments is 35% above that in the standard assumptions.
£0k
£10k
£20k
£30k
£40k
1 2 3 4 5 6 7 8 9 10
24
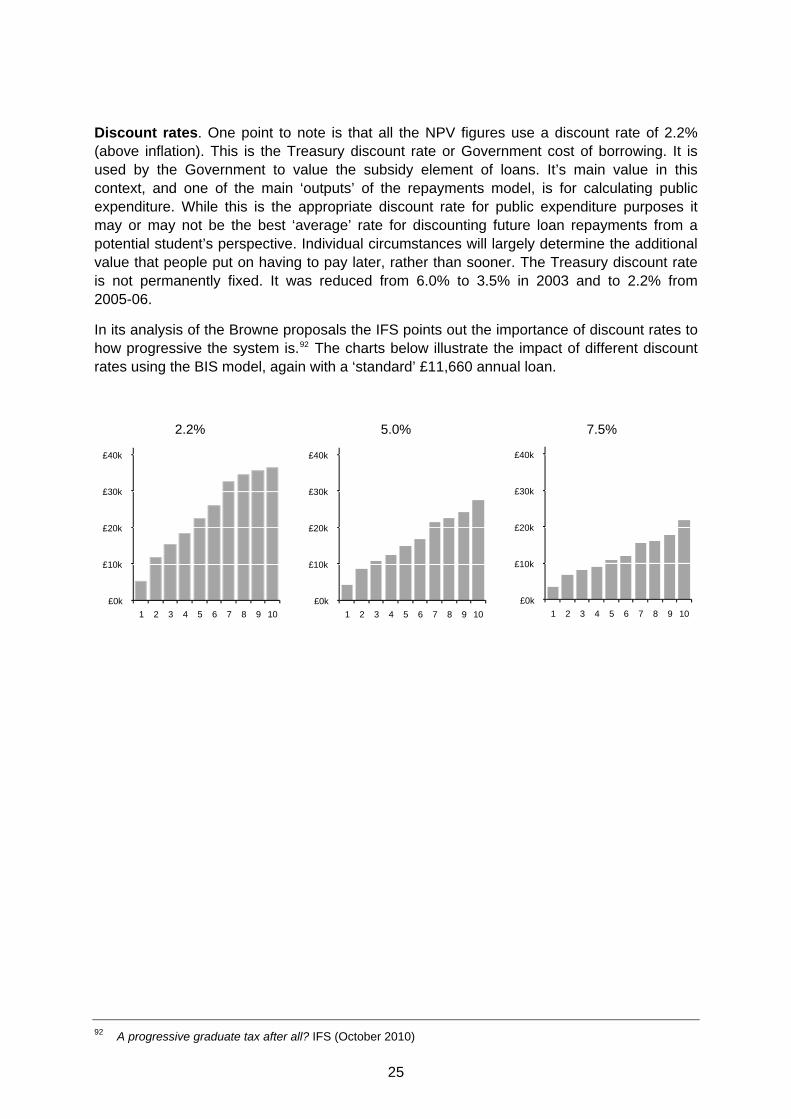
Discount rates. One point to note is that all the NPV figures use a discount rate of 2.2% (above inflation). This is the Treasury discount rate or Government cost of borrowing. It is used by the Government to value the subsidy element of loans. It’s main value in this context, and one of the main ‘outputs’ of the repayments model, is for calculating public expenditure. While this is the appropriate discount rate for public expenditure purposes it may or may not be the best ‘average’ rate for discounting future loan repayments from a potential student’s perspective. Individual circumstances will largely determine the additional value that people put on having to pay later, rather than sooner. The Treasury discount rate is not permanently fixed. It was reduced from 6.0% to 3.5% in 2003 and to 2.2% from 2005-06.
In its analysis of the Browne proposals the IFS points out the importance of discount rates to how progressive the system is.92 The charts below illustrate the impact of different discount rates using the BIS model, again with a ‘standard’ £11,660 annual loan.
2.2% 5.0% 7.5%
£0k
£10k
£20k
£30k
£40k
1 2 3 4 5 6 7 8 9 10
£0k
£10k
£20k
£30k
£40k
1 2 3 4 5 6 7 8 9 10
£0k
£10k
£20k
£30k
£40k
1 2 3 4 5 6 7 8 9 10
92 A progressive graduate tax after all? IFS (October 2010)
25