changin u.s. output of scientific articles: 1988-2003€¦ · output of scientific articles:...
TRANSCRIPT
Division of Science Resources StatisticsDirectorate for Social, Behavioral, and Economic Sciences
National Science Foundation May 2007
Changing U.S.Output ofScientific Articles:1988–2003
Special Report

Derek Hill, Alan I. Rapoport, Rolf F. Lehming,and Robert K. Bell
Special Report
Changing U.S.Output ofScientific Articles:1988–2003
Division of Science Resources StatisticsDirectorate for Social, Behavioral, and Economic Sciences
National Science Foundation May 2007

National Science FoundationArden L. Bement, Jr.Director
Directorate for Social, Behavioral, and Economic SciencesDavid W. LightfootAssistant Director
Division of Science Resources StatisticsLynda T. CarlsonDivision Director
Mary J. FraseDeputy Director
Science and Engineering Indicators ProgramRolf F. LehmingProgram Director
DIVISION OF SCIENCE RESOURCES STATISTICS
The Division of Science Resources Statistics (SRS) fulfills the legislative mandate of the National ScienceFoundation Act to ...
provide a central clearinghouse for the collection, interpretation, and analysis of data on scientific andengineering resources and to provide a source of information for policy formulation by other agencies ofthe Federal Government...
To carry out this mandate, SRS designs, supports, and directs periodic surveys as well as a variety of otherdata collections and research projects. These surveys yield the materials for SRS staff to compile, analyze, anddisseminate quantitative information about domestic and international resources devoted to science,engineering, and technology.
If you have any comments or suggestions about this or any other SRS product or report, we would like to hearfrom you. Please direct your comments to:
National Science FoundationDivision of Science Resources Statistics4201 Wilson Blvd., Suite 965Arlington, VA 22230Telephone: (703) 292-8780Fax: (703) 292-9092E-mail: [email protected]
Suggested CitationNational Science Foundation, Division of Science Resources Statistics, 2007. Changing U.S. Output ofScientific Articles: 1988–2003. NSF 07-320, Derek Hill, Alan I. Rapoport, Rolf F. Lehming, and Robert K. Bell(Arlington, VA).
May 2007
Information and data from the Division of Science Resources Statistics are available on theWeb at http://www.nsf.gov/statistics/. This report is available in electronic format only. ForNSF's Telephonic Device for the Deaf, dial toll-free (800) 281-8749 or (703) 292-5090.
ii

iii
CONTENTSPage
EXECUTIVE SUMMARY. ................................................................................................................................1
INTRODUCTION ...............................................................................................................................................2
Purpose and Scope ..................................................................................................................................... 2
Organization of the Report ......................................................................................................................... 2
METHODOLOGICAL ISSUES..........................................................................................................................4
The Journal Database ................................................................................................................................. 4
Expanding and Fixed Journal Sets ............................................................................................................. 4
Fractional and Whole Counts .................................................................................................................... 5
OUTPUT TRENDS IN MAJOR S&E PUBLISHING CENTERS. .................................................................7
Trends in U.S. Article Output. ...................................................................................................................7
U.S. Share of the World’s Articles ............................................................................................................. 9
Article Output in the EU-15, Japan, and the East Asia-4 ........................................................................10
TRENDS IN INFLUENTIAL ARTICLES AND JOURNALS. ..........................................................................14
United States ............................................................................................................................................ 14
The EU-15, Japan, and the East Asia-4 ....................................................................................................16
THE U.S. ACADEMIC SECTOR. ................................................................................................................ 20
Overall Output Trends ............................................................................................................................. 20
Trends in the Top 200 Academic Research Universities ......................................................................... 20
Output Trends .................................................................................................................................... 21
Collaboration Trends ......................................................................................................................... 24
CONCLUSION. ...............................................................................................................................................33
APPENDIX TABLES. .....................................................................................................................................35

iv

v
LIST OF TABLESTable Page
1. Average annual growth in federal research funding and S&E article output (fractional counts),by field: 1986–2003 ............................................................................................................................ 11
2. Indicators of international collaboration for major S&E publishing centers: selected years,1992–2003 ........................................................................................................................................... 11
3. World share of highly cited S&E articles (fractional counts), by major S&E publishing centerand percentile: 1992, 1997, and 2003 ................................................................................................. 15
4. Highly influential U.S. S&E articles (fractional counts), by field: selected years: 1996–2003 ......... 195. Highly influential S&E articles (fractional counts) of major S&E publishing centers:
selected years: 1996–2003 .................................................................................................................. 196. Average annual growth in U.S. academic S&E article output, by field: 1988–92 and 1992–2003 ....207. Average annual growth in U.S. S&E article output (fractional counts), by sector: 1988–2003,
1988–92, and 1992–2003 .................................................................................................................... 218. Carnegie institution type and administrative control of top 200 U.S. research universities ...............259. Average annual growth in S&E article output (fractional counts) of top 200 U.S. research
universities, by administrative control of institution and Carnegie institution type: 1988–2001,1988–92, and 1992–2001 .................................................................................................................... 25
10. Average annual growth in S&E article output (fractional counts) at departments of top 200 U.S.research universities, by field and National Research Council scholarly quality departmentalrating: 1988–2001 ............................................................................................................................... 27
LIST OF FIGURESFigure
1. Average annual growth in S&E article output (fractional counts) of major S&E publishingcenters: 1988–92 and 1992–2003 ......................................................................................................... 7
2. U.S. S&E article output (fractional counts), academic R&D expenditures, and academic R&Dworkforce: 1988–2003 .......................................................................................................................... 8
3. Average annual growth in S&E article (whole counts) of major S&E publishing centers:1988–92 and 1992–2003 .....................................................................................................................10
4. World share of S&E article output (fractional counts), by major S&E publishing center:1992–2003 ...........................................................................................................................................12
5. Decline in U.S. world share of S&E article output, by field: 1992–2003 .......................................... 136. S&E article output (fractional counts) of major S&E publishing centers: 1988–2003 ...................... 137. World share of highly influential S&E articles (fractional counts) of major S&E publishing
centers: 1996–2003 ............................................................................................................................. 158. Decline in U.S. world share of highly influential S&E articles, by field: 1996–2003 .......................179. Decline in U.S. world share of highly influential S&E articles (fractional counts) and of S&E
articles published in highly influential journals (fractional counts) between 1996 and 2003,by field ................................................................................................................................................ 18
10. Change in share of U.S. S&E articles (fractional counts) in academic, federal government,and private for-profit sectors: 1992–2003 ...........................................................................................22
11. Share of U.S. academic S&E articles (whole counts) with at least one author from the top 200research universities, by field: 1988–2001 .........................................................................................23
vi
12. Trends in S&E article output (whole and fractional counts) of entire U.S. academic sector andtop 200 research universities: 1988–2001...........................................................................................24
13. Average annual growth in S&E article output (fractional counts) of departments at top U.S.research universities, by National Research Council scholarly quality departmental rating:1988–2001 ...........................................................................................................................................26
14. Growth in S&E article output (fractional counts) at top 200 research universities, by quartile oftotal R&D growth: 1988–2001 and 1992–2001 ..................................................................................27
15. Ratio of fractional to whole counts of S&E articles for top 200 research universities, by field:1988, 1994, and 2001 ..........................................................................................................................28
16. Share of top 200 research universities with greater collaboration in 1995–2001 than in1988–1994, by field ............................................................................................................................29
17. S&E article output (whole counts) of top 200 academic research universities, by institutionalauthor type: 1988–2001 ...................................................................................................................... 30
18. S&E articles (whole counts) with authors at top 200 academic research universities,by institutional author type: 1988, 1995, and 2001 ............................................................................31
19. S&E articles (whole counts) with single author at a top 200 academic research university,by field: 1988, 1994, and 2001 ........................................................................................................... 31
20. S&E articles (whole counts) with at least one author from the top 200 research universitiesand one author at a foreign institution, by field: 1988, 1994, and 2001 .............................................32
21. Institutional addresses and authors per article for S&E articles (whole counts) with participationby a top 200 research university: 1988–2001 .....................................................................................32

1
In an unexpected development in the early 1990s, theabsolute number of science and engineering (S&E) ar-ticles published by U.S.-based authors in the world’smajor peer-reviewed journals plateaued. This was achange from a rise in the number of publications over atleast the two preceding decades. With some variation,this trend occurred across different categories of institu-tions, different institutional sectors, and different fieldsof research. It occurred despite continued increases inresource inputs, such as funds and personnel, that sup-port research and development (R&D).
In other developed countries—a group of 15 membersof the European Union (the EU-15) and Japan—the ab-solute number of articles continued to grow throughoutmost of the 1992–2003 period. During the mid- to late1990s, the number of articles published by EU scientistssurpassed those published by their U.S. counterparts, andthe difference between Japanese and U.S. article outputnarrowed. Late in the period, growth in the number ofarticles produced in some of these developed countriesshowed signs of slowing.
The trend in number of S&E articles produced in fourdeveloping East Asian economies (the East Asia-4) wasmarkedly different. This group exhibited strong growthin the number of articles, number of influential articles,and percentage of overall output classified as influen-tial. Nonetheless, because the East Asia-4 began the pe-riod with a much less mature S&E research establish-ment than the three S&E publishing centers named above,it continued to lag behind them on the measures exam-ined.
The unprecedented plateau in the number of U.S. S&Earticles should not be confused with a decades-long andfamiliar decline in the U.S. share of the world’s S&Earticles. As other states built up their S&E capabilities,
the U.S. share of the world’s articles in natural sciencesand engineering dropped from 38% in 1973 to 28% in2003. This decline in share is not surprising, nor has itbeen viewed as a cause for concern. By many measures,including articles published in peer-reviewed journals,the United States has been the world’s leading scientificnation for decades and remains the world’s leading sci-entific nation.
On the whole, the U.S. share of the world’s S&E articlesremained relatively more robust in biomedical fields thanin the physical sciences and engineering, where sharedeclines tended to be greatest and output statistics tendedto lag. In fields where U.S. shares of world article outputdropped least, the United States was increasing its rateof international collaboration relatively quickly and thuswas increasingly sharing credit with other countries.
Although the U.S. share of the world’s influential articlesdropped substantially, the United States remained domi-nant in this area. At the end of the period studied, U.S.institutions were at least partially responsible for half ofthe world’s influential articles; no other major publish-ing center approached this figure. Moreover, comparedwith other major publishing centers, a considerablyhigher percentage of total U.S. output was classified asinfluential.
The U.S. academic sector, which dominates U.S. articleproduction, largely mirrored the overall U.S. trends, al-though its growth in article output over the entire periodcompared favorably with that of other sectors. The mostprestigious academic institutions, however, experiencedrelatively slow output growth. The increase in collabo-ration across national, institutional, and sectoral bound-aries, which is most fully documented in academic sec-tor data, was perhaps the most striking trend in S&Eresearch and publication during this period.
EXECUTIVE SUMMARY

2
PURPOSE AND SCOPE
Scientists and engineers ordinarily publish their researchresults in peer-reviewed journal articles. The number ofthese articles is an indicator of research output, althoughan admittedly imperfect one. Citations to these articlesare an indicator, also imperfect, of the extent of the citedarticle’s influence. In recent years, international use ofthese and related indicators has become widespread ascountries have sought to assess their relative performancein S&E research.
This report is part of a larger study by the National Sci-ence Foundation (NSF), Division of Science ResourcesStatistics (SRS), on changing patterns and trends in U.S.production of scientific articles since the late 1980s. Thestudy was initiated in light of evidence that the growthin the number of U.S. articles, which had continued formore than two decades, began to slow in the 1990s eventhough R&D funds, research personnel, and similar re-search inputs continued to grow.
SRS plans to publish results from this study in a seriesof three reports, each focused on a different aspect of theissue. The present report is purely descriptive and doesnot attempt to speculate about explanations for the find-ings. It presents quantitative data on patterns and trendsin article production and citations during the 15-yearperiod between 1988 and 2003. The second report, TheChanging Research and Publication Environment inAmerican Research Universities (http://www.nsf.gov/statistics/srs07204), which is based on qualitative datafrom interviews and focus groups, summarizes the viewsof experienced observers and practitioners in researchuniversities about how the worlds of academic S&E re-search and publication changed during the study period.Some of the observations in that report bear on possibleexplanations of the patterns and trends in the quantita-tive data reported here. A third report (forthcoming) ana-lyzes quantitative data on research inputs and outputs inthe U.S. academic sector to explore possible factors as-sociated with the patterns and trends described in thefirst two reports. None of the reports speculate aboutpossible policy implications of the findings.
This report is confined to a presentation of data derivedfrom the most comprehensive database available on sci-entific publications. It makes no attempt to cover thelarge, dispersed literature bearing on various aspects ofthe changing environment for research and publication(e.g., Stephan et al. on faculty commercialization andpublication activities; Stossel and Stossel on publicationpatterns in a single discipline; Cummings and Kiesler onmultidisciplinary and multiinstitutional research; Tijssenon changes in publication practices in the industrial sec-tor; Tenopir and King on the rise of electronic journals).1Nonetheless, these more targeted studies and others likethem, which use other, more theoretically driven ana-lytic models and less-comprehensive databases, suggestsignificant avenues for further research. In many cases,studies such as these prompted examination of the pat-terns presented in this report.
ORGANIZATION OF THE REPORT
This report is divided into a methodological section andthree substantive sections. The methodological sectiondiscusses the database, selection of the journal set, andvarious ways to count articles. The first substantive sec-tion examines and compares overall trends in S&E ar-ticle production in four major publishing centers: theUnited States, the EU-15, Japan, and the East Asia-4.2
This section also includes a description and comparisonof trends in national article outputs in the different S&E
INTRODUCTION
1 Stephan, P.E., S. Gurmu, A.J. Sumell, and G. Black. Who’s Patentingin the University? Evidence from the Survey of Doctorate Recipients.Forthcoming in Economics of Innovation and New Technology. http://www2.gsu.edu/~ecosgg/research/pdf/sgsb_eint.pdf. Accessed Decem-ber 2006.; Stossel, T.P. and S.C. Stossel. 1990. Declining AmericanRepresentation in Leading Clinical Research Journals. New EnglandJournal of Medicine 322 (11): 739-42.; Cummings, J.N. and S. Kiesler.2005. Collaborative Research Across Disciplinary and OrganizationalBoundaries. Social Studies of Science 35/5 (October): 703-722.; Tijssen,R.J.W. 2004. Is the commercialisation of scientific research affectingthe production of public knowledge? Global trends in the output ofcorporate research articles. Research Policy 33: 709-33.; Tenopir, C. andD.W. King. 2000. Towards Electronic Journals: Realities for Scien-tists, Librarians, and Publishers. Washington, D.C.: SLA Publishing.
2 The four major publishing centers accounted for 78% of worldS&E article production in 2003.
3
fields. Subsequent sections examine patterns and trendsin strategically important parts of the research enterprise.The second substantive section focuses on influential(i.e., highly cited) articles and journals. These articlesand journals are important because a nation’s involve-ment in influential research indicates worldwide leader-ship in S&E and can have implications for economic andtechnological leadership. The third substantive sectiondescribes trends in the output of the U.S. academic sec-tor. This sector produces the most articles of any U.S.sector. Developments in this sector therefore are espe- 3 Based on total R&D expenditures during the 1988–2001 period.
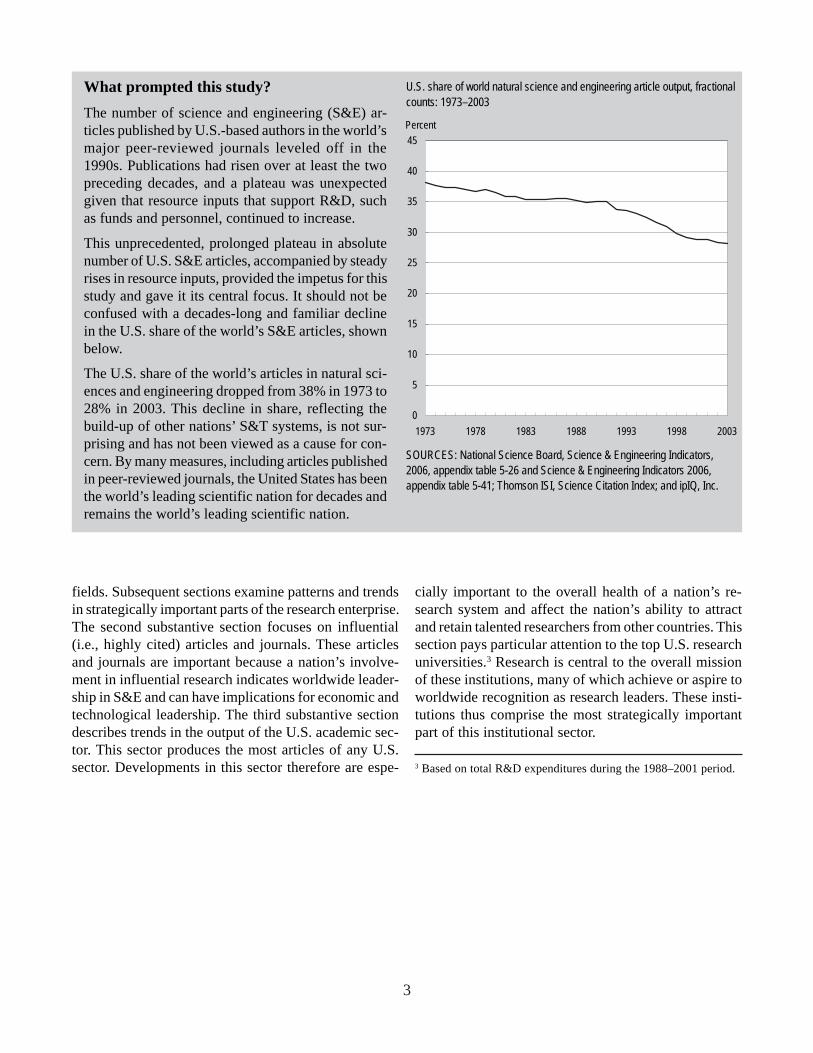
What prompted this study?The number of science and engineering (S&E) ar-ticles published by U.S.-based authors in the world’smajor peer-reviewed journals leveled off in the1990s. Publications had risen over at least the twopreceding decades, and a plateau was unexpectedgiven that resource inputs that support R&D, suchas funds and personnel, continued to increase.
This unprecedented, prolonged plateau in absolutenumber of U.S. S&E articles, accompanied by steadyrises in resource inputs, provided the impetus for thisstudy and gave it its central focus. It should not beconfused with a decades-long and familiar declinein the U.S. share of the world’s S&E articles, shownbelow.
The U.S. share of the world’s articles in natural sci-ences and engineering dropped from 38% in 1973 to28% in 2003. This decline in share, reflecting thebuild-up of other nations’ S&T systems, is not sur-prising and has not been viewed as a cause for con-cern. By many measures, including articles publishedin peer-reviewed journals, the United States has beenthe world’s leading scientific nation for decades andremains the world’s leading scientific nation.
cially important to the overall health of a nation’s re-search system and affect the nation’s ability to attractand retain talented researchers from other countries. Thissection pays particular attention to the top U.S. researchuniversities.3 Research is central to the overall missionof these institutions, many of which achieve or aspire toworldwide recognition as research leaders. These insti-tutions thus comprise the most strategically importantpart of this institutional sector.
U.S. share of world natural science and engineering article output, fractional
SOURCES: National Science Board, Science & Engineering Indicators,2006, appendix table 5-26 and Science & Engineering Indicators 2006, appendix table 5-41; Thomson ISI, Science Citation Index; and ipIQ, Inc.
counts: 1973–2003
0
5
10
15
20
25
30
35
40
45
1973 1978 1983 1988 1993 1998 2003
Percent
4
Numerous technical issues arise in counting the journalarticles that nations and institutions produce. Three suchissues are especially consequential: the journal database,expanding and fixed journal sets, and whole counts ver-sus fractional counts.
THE JOURNAL DATABASE
The first issue is which articles to count. This report pre-sents counts of S&E articles, notes, and reviews pub-lished in scientific and technical journals tracked byThomson ISI4 and indexed in the Science Citation Indexand Social Sciences Citation Index. Counts exclude allletters to the editor, news pieces, editorials, and othercontent whose central purpose is not presentation or dis-cussion of scientific data, theory, methods, apparatus, orexperiments.
Thomson ISI tracks a set of more than 5,000 internation-ally recognized journals that it has determined to be themost influential in the world. S&E articles in these jour-nals build primarily on one another to form the scientificliterature. These journals contain approximately 15 mil-lion citations, about 85% of which are to articles in jour-nals in the Thomson ISI database. Coverage extends toelectronic journals, including print journals with elec-tronic versions and electronic-only journals. Journals ofregional or local importance may not be covered, whichmay be especially salient for research in engineering/technology, psychology, the social sciences, the healthsciences, and the professional fields,5 as well as for na-tions with a small or applied science base. Thomson ISIcovers non-English language journals, but only those thatprovide their article abstracts in English, which limitscoverage of non-English language journals.
Relative to other bibliometric databases, Thomson ISIindexes a wider range of S&E fields and contains more
complete data on the institutional affiliations of anarticle’s authors. For particular fields, however, otherdatabases provide more complete coverage. Although thebody of this report relies exclusively on Thomson ISIdata, appendix table 1 contains comparable data fromseveral other bibliometric databases; brief descriptionsof those databases are provided in the table notes. Thesedatabases exhibited generally similar trends to theThomson ISI of flattening U.S. output and continuedgrowth by the EU-15 and Asian countries starting in themid-1990s.
EXPANDING AND FIXED JOURNALSETS
A second issue is how to deal with changes in the set ofjournals tracked by Thomson ISI. Over time, many newjournals emerge and attain influence, while a few olderjournals decline or stop publication. Because the globalS&E research enterprise is growing, the net direction ofchange is toward more articles and more journals in theThomson ISI database. The database grew from 4,460journals in 1988 to 5,262 in 2001, and many of the jour-nals indexed published more articles per issue and moreissues per year toward the end of the period than theydid in previous years.6
At any given time, the expanding set of journals trackedby Thomson ISI is the most suitable indicator of the mixof journals and articles. Patterns of authorship and cita-tion in this set reflect the fields, nations, and institutionsin which high-quality research is being produced. How-ever, an expanding set of journals poses problems fortrend analyses. Changes in the expanding set over timecan result not only from changes in how and where sci-entists and engineers perform research, but from changesin the journals Thomson ISI chooses to include or thedepth of its coverage in different fields or languages. Inaddition, an expanding universe of articles makes changesin the shares attributable to different parts of the researchcommunity less readily interpretable.
METHODOLOGICAL ISSUES
4 Thomson ISI changed its name to Thomson Scientific in June 2006.This article uses the company’s name at the time of the study. Alldata from the Thomson ISI database presented in this report derivefrom the Science Indicators database prepared for the National Sci-ence Foundation by ipIQ, Inc. (formerly CHI Research, Inc.).5 The professional fields include communication, education, informa-tion and library science, law, management and business, miscellaneousprofessional fields, and social work.
6 Among the journals included in the Thomson ISI database since1985, the average annual number of articles per journal rose from 102in 1986 to 142 in 1999.

5
One alternative analytic strategy is to follow a fixed setof journals that existed throughout the period under study.Changes over time within this set are likely to reflectreal output changes rather than variation in the depth ofThomson ISI’s coverage of different sources of output.However, comparisons within a fixed set of journals havea major limitation. Because new research communitiesoften spawn new journals to disseminate their researchfindings, a fixed journal set underrepresents, perhapsseverely, the types of research that were not already wellestablished at the outset of the period. The longer theperiod being studied, the less adequate a fixed journalset becomes as a representation of the world’s articlesthroughout the period.
In view of this limitation, and because the expanding setis more representative of the universe of high-quality re-search articles in any given year, this report presents dataon the expanding journal set. SRS has conducted paral-lel analyses on both journal sets and found very similarpatterns and trends. Appendix table 2 presents trend datadrawn from a fixed set of journals restricted to those thatwere in the Thomson ISI data set from 1985 through 2003.
FRACTIONAL AND WHOLE COUNTS
The third issue is how to attribute articles to nations,institutional sectors, institutions, and fields. The ThomsonISI database contains data on the institutional affiliationsof the researchers who receive authorship credit for ar-ticles in the journals it indexes. However, apart fromnames and institutional affiliations, it contains almostno information about the authors themselves—their dis-ciplines, citizenship, age, sex, rank, or status within theirinstitutions, and so forth. Although descriptions of thedata in this report may refer to “authorship,” unless speci-fied otherwise, this means institutional authorship—thatis, the institutional affiliation(s) of the individual(s) inthe list of authors.
SRS engages a contractor, ipIQ, Inc., to extract ThomsonISI data into a Science Indicators database. From thisdatabase, ipIQ generates article and citation counts andauthorship information. To assign credit for contributions,ipIQ records each institutional address listed in anarticle’s author list. It also records the number of authornames listed on the article but does not link author nameswith institutions. For U.S. institutions, ipIQ classifiesaddresses by institutional sector: academia, federal gov-ernment, state government, industry, nonprofit, and fed-
erally funded research and development centers(FFRDCs). Articles with a foreign institutional addressare attributed to their country of origin but are not allo-cated to particular institutions or sectors. Finally, ipIQassigns an article to a field of research on the basis of thejournal in which the article appears; the field classifica-tion of the journal, in turn, is based on the patterns of thejournal’s citations. ipIQ’s field classification is used inmost of the analyses presented in this report.
When only one institution is credited as author of an ar-ticle, attribution is simple: regardless of how many peoplecollaborated in writing the article, the institution receivesone credit for it. When articles are the product of col-laboration between authors at different institutions, in-stitutional credit may be assigned in two different ways:whole counting and fractional counting. Each has differ-ent advantages, and both are used in the analyses pre-sented in this report.
In whole counting, each institution that appears in theauthor list receives one credit for an article. When ar-ticles are authored by collaborating institutions frommultiple countries, each country receives one count forits participation, regardless of the number of its collabo-rating institutions. For example, the United States andFrance would each receive one credit for an article co-authored by one French institution and two U.S. institu-tions. Thus, the number of credits for an article varies,depending on the number of institutional authors or thenumber of countries represented among the collaborat-ing institutions. When institutions collaborate, a singlearticle is counted more than once. As a result, the sum ofthe whole counts attributed to institutions in a given U.S.institutional sector does not equal the whole count forthe sector itself. Likewise, the sum of U.S. sector countsexceeds the U.S. country count, and the sum of countrycounts exceeds the world count.
In fractional counting, each article receives a single credit,regardless of how many institutions earn authorshipcredit. When more than one institutional author is in-volved, credit for the article is divided equally amongthe institutions that appear in the author list.7 Thus, in
7 This method is used even for articles with a very large number of insti-tutional addresses. Thomson ISI does not truncate the list of institu-tional addresses. ipIQ did truncate after 25 addresses between 1988 and1991, but this practice affected less than 1% of articles during thisperiod.

6
collaborations among different institutions, each institu-tion receives a “fractional” credit that represents its shareof an article. In the prior example, the United States andFrance would receive 2/3 and 1/3 of a credit, respec-tively, for their co-authorship of the article. The samelogic applies in dividing credit for cross-sectoral and in-ternational collaborations. Because each article is countedonly once, the fractional counts for institutions within aU.S. institutional sector sum to the fractional count forthe entire sector, and the fractional counts for the vari-ous sectors sum to the count for the entire country.
Whole counts are useful indicators of how often an in-stitution, sector, or country is involved in producing ar-ticles. Fractional counts are useful in highlighting pat-terns and trends in the shares of credit attributable todifferent institutions, sectors, or countries. Neithermethod adequately captures the many factors that affecthow the research community allocates credit for articles.Taken together, the two counting methods provide re-lated, although sometimes different, perspectives on re-cent trends in the production of S&E articles in the UnitedStates and abroad.

7
TRENDS IN U.S. ARTICLE OUTPUT
The number of S&E articles credited to U.S. institutionsthrough fractional counting of the expanding ThomsonISI journal set has essentially remained constant since1992 after growing consistently during the preceding twodecades. It is convenient to divide the 1988–2003 periodinto an early period (1988–92) when U.S. article outputwas growing and a later period (1992–2003) when it wasessentially flat. Output grew at an average annual rate of0.6% between 1992 and 2003 but all the growth occurredin 2003, so growth was -0.2% through 2002, comparedwith 2.9% between 1988 and 1992 (figure 1).8 Appendixtable 3 shows U.S. article output and world article sharebased on fractional counts.9
The flattening of U.S. article output occurred despitecontinued growth of both real R&D expenditures andthe academic sector R&D workforce, which producesmost U.S. S&E articles (figure 2). Article output of thethree other major S&E publishing centers (the EU-15,Japan, and the East Asia-4) grew considerably faster thanU.S. output between 1992 and 2003 (figure 1). Thegrowth rates of the EU-15 and Japan during this period,however, were considerably slower than between 1988and 1992, in a pattern similar to that of the United States.
These changes are not the result of changes in ThomsonISI journal coverage. Although expanding journal cov-erage over time could affect measures of U.S. output forreasons that have little or nothing to do with publishingintensity, such as coverage of new non-English journals,data from the fixed set of journals that have been part ofthe Thomson ISI database since 1985 show a similargrowth pattern and identical change in the U.S. share
OUTPUT TRENDS IN MAJOR S&E PUBLISHING CENTERS
8 U.S. article output rose almost 8% in 2003 compared with 2002,following a decline between 2001 and 2002. A similar trend occurredin the EU countries and Japan. Although this trend may reflect a realchange in article output, it may also be the result of variation in howquickly publications are added to the Thomson ISI database.
9 Data on S&E article output from earlier in the 1980s and the 1970sare available in appendix table 5-44 of Science and Engineering Indi-cators 1998 and appendix table 5-21 of Science and Engineering In-dicators 1993, respectively.
(appendix table 2). In several other journal databases,the trend of faster growth in the rest of the world relativeto the United States was also similar (appendix table 1).Therefore, except as otherwise noted, this section reportsdata for the Thomson ISI expanding journal set.
Throughout the 1988–2003 period, international collabo-ration as indicated by article coauthorship was rising,which affects whole and fractional authorship countsdifferently (see sidebar “Effect of International Collabo-ration on Whole- and Fractional-Count Output”). How-ever, overall U.S. output trends based on these two mea-sures are congruent, albeit with somewhat higher U.S.
FIGURE 1. Average annual growth in S&E article output (fractional counts) of major S&E publishing centers: 1988–92 and 1992–2003
0
2
4
6
8
10
12
14
16
18
20
22
United States EU-15 Japan East Asia-4
Percent
1988–921992–2003
S&E = science and engineering; EU = European Union.
NOTES: Articles on fractional-count basis, i.e., for articles with collaborating institutions from multiple publishing centers, each publishing center receives fractional credit on basis of proportion of its participating institutions. East Asia-4 includes China, Singapore, South Korea, and Taiwan. China includes Hong Kong.
SOURCES: Thomson ISI, Science Citation Index and Social Sciences Citation Index, http://www.isinet.com/products/citation/; ipIQ, Inc.; and National Science Foundation, Division of Science Resources Statistics, special tabulations. See appendix table 3.

8
growth rates when whole counts are used. Thus, U.S.whole-count output slowed in a pattern similar to theflattening of output seen when fractional counts are used(figure 3 and appendix table 4), rising at an average an-nual rate of 1.2% between 1992 and 2003 compared with3.4% between 1988 and 1992 (figure 3). Output growthin whole counts in the three other major publishing cen-ters between 1995 and 2003 was higher than in the UnitedStates.
Unless otherwise indicated, the remainder of this reportpresents fractional-count data for the expandingThomson ISI journal set. However growth trends by fieldseen in the whole-count data and in the fixed journal setare similar.
U.S. growth trends by field showed some variation (ap-pendix tables 3 and 5). In some fields, the pattern tracksthe overall trend fairly closely, but with different dates forthe onset of flattening. These include the social sciences(1990), biology (1990), engineering/technology (1993),chemistry (1993), clinical medicine (1995), biomedicalresearch (1995), and psychology (1996). In physics, ar-ticle output flattened at the same time as overall outputbut exhibited an outright decline between 1995 and 2003.
In two fields, trends departed substantially from the over-all pattern. Article output in the earth/space sciences grewconsistently over the entire 15-year period. In mathemat-ics, output declined between 1988 and 1997 but then grewmodestly between 1997 and 2003.
FIGURE 2. U.S. S&E article output (fractional counts), academic R&D expenditures, and academic R&D workforce: 1988–2003
60
80
100
120
140
160
180
1988 1989 1990 1991 1992 1993 1994 1995 1996 1997 1998 1999 2000 2001 2002 2003
(Index 1992 = 100)
Academic R&D expenditures ($ constant)
Academic R&D workforce
Total S&E article output
S&E = science and engineering; R&D = research and development.
NOTES: Articles on fractional-count basis, i.e., for articles with collaborating institutions, each institution receives fractional credit on basis of proportion of its participating institutions. U.S. academic workforce is number of S&E doctorate-holders employed at all U.S. academic institutions whose primary or secondary activity is R&D. Academic R&D expenditures adjusted by gross domestic product deflator. Data for academic workforce available for odd years; 1992 base year data calculated by averaging 1991 and 1993 data.
SOURCES: Thomson ISI, Science Citation Index and Social Sciences Citation Index, http://www.isinet.com/products/citation/; ipIQ, Inc.; National Science Foundation, Division of Science Resources Statistics, special tabulations; Academic Research & Development Expenditures: Fiscal Year 2003; and Science and Engineering Indicators 2006, appendix table 5-32.

9
Effect of International Collaboration onWhole- and Fractional-Count Output
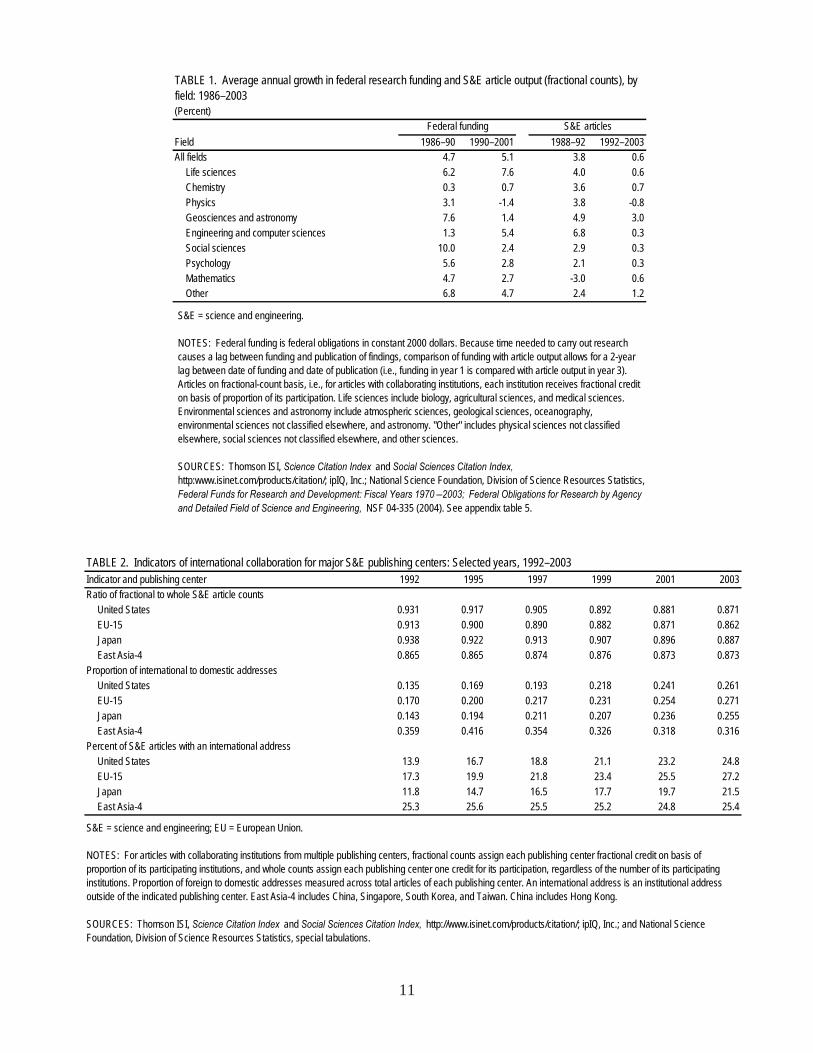
The ratio of a country’s fractional counts to its wholecounts is a measure of how much it collaborates in-ternationally. In some contexts, the international col-laborating entity is a publishing center, such as theEU-15 or East Asia-4. A lower ratio signifies morecollaboration. At the extreme, if a country never col-laborated internationally, fractional counting wouldgive it full credit for every article in which it partici-pated—that is, its fractional and whole counts wouldbe identical and the ratio would be 1. As collabora-tion with other countries increases, a country’s frac-tion of credit for its articles declines, growing smallerrelative to its whole counts. Substantively, a country’sratio of fractional counts to whole counts may beinterpreted as the proportion of credit attributable tothat country for the articles in which the countryplayed an authorship role.
International collaboration can reduce the ratio intwo ways: (1) a country may produce more articlesin collaboration with other countries or (2) even if the
country produces the same number of internationalarticles, it may increase the number of internationalcollaborators per article, so that the country’s frac-tion of credit for its international articles decreases.
Whole and fractional counting are imperfect mea-sures of international collaboration because the allo-cation of counts to countries is done by the addresseslisted on the article. Therefore, if a publication doesnot list the address of a collaborator, thecollaborator’s country would not receive credit forthe publication.
Between 1992 and 2003, the ratio of fractional countsto whole counts declined in three of the four majorS&E publishing centers—the United States, the EU-15, and Japan (table 2). Therefore, growth in articleoutput was less as measured on a fractional-countbasis than as measured on a whole-count basis inthese S&E publishing centers during this period. Be-cause there was little change in the ratio of fractionalcounts to whole counts in the East Asia-4, fractional-count and whole-count growth rates were very simi-lar (appendix table 5).
Trends in federal funding by field did not generally co-incide with trends in article output in broadly compa-rable fields (table 1).10 Beginning in 1990, real growthin federal funds was generally positive and robust, ex-cept in chemistry and physics. Yet corresponding growthin article output occurred only in the earth/space sciences,which receive funds classified under geosciences11 andastronomy. In physics, the funding trend—an increase inreal terms between FY 1986 and FY 1990, followed by adecline—was also similar to the trend in article output.
U.S. SHARE OF THE WORLD’S ARTICLES
The U.S. share of world article output declined between1992 and 2003. The combination of nearly stagnant U.S.
output and continued growth in the three other majorS&E publishing centers led the U.S. share to fall from37% to 30% (figure 4 and appendix table 3). A longerseries that is limited to natural sciences and engineeringarticles shows a long term decline from 38% in 1973 to28% in 2003 (see inset to figure 4).
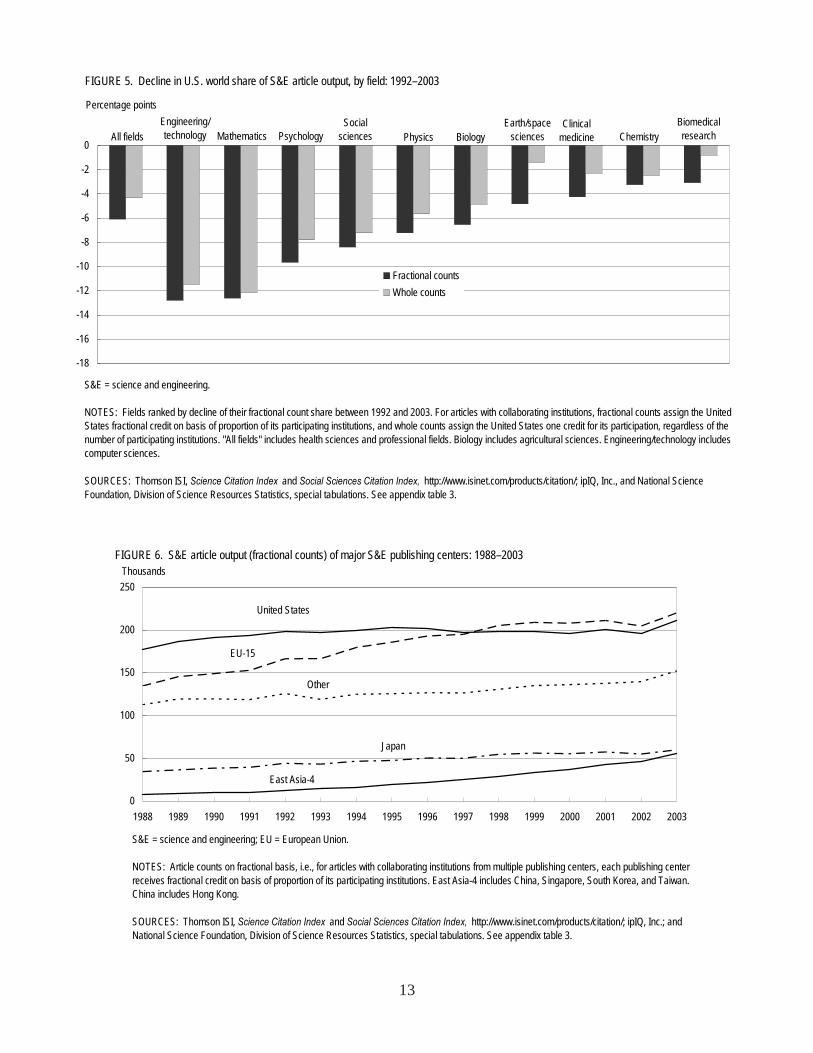
As with output trends, share trends by field varied fromthe overall average (figure 5). Two fields, engineering/technology and mathematics, experienced percentagepoint declines that were more than twice the overall U.S.decline during this period. Biomedical research, clinicalmedicine, the earth/space sciences, and chemistry had asignificantly lower than average decline in their sharescompared with the overall share trend.
For most fields, the size of the share decline was similarwhether measured in whole or fractional counts (figure 5and appendix tables 3 and 4). Three fields, clinical medi-cine, biomedical research, and the earth/space sciences,were exceptions. In these fields, the decline in whole-count share was substantially less than the decline in frac-
10 Because the time needed to carry out research causes a lag betweenfunding and publication of findings, the comparison of funding witharticle output allows for a 2-year lag between the date of funding andthe date of publication (i.e., funding in year 1 is compared with articleoutput in year 3).11 Geosciences consists of earth, atmospheric, and ocean sciences.

10
tional-count share. This finding suggests that, more thanin other fields, the loss of fractional-count share in thesefields was because U.S. authors were increasing theircollaboration with the rest of the world (see sidebar “Ef-fect of International Collaboration on Whole- and Frac-tional-Count Output”).
ARTICLE OUTPUT IN THE EU-15,JAPAN, AND THE EAST ASIA-4In contrast to the flattening of article output in the UnitedStates between 1992 and 2003, output expanded duringthis period in the three other major S&E publishing cen-ters (figure 6 and appendix table 3).
Article output in the EU-15 grew at an average annualrate of 2.8% between 1992 and 2003, more than four
times faster than in the United States (figure 1), and EU-15 output surpassed U.S. output in 1998 (figure 6 andappendix table 3). As in the United States, EU-15 growthafter 1992 was slower than growth between 1988 and1992. The EU-15 growth trend in the 1985 fixed journalset was very similar and surpassed U.S. output in 1997(appendix table 2). EU-15 fractional-count output grewfaster than U.S. output between 1992 and 2003 in allfields (appendix table 5). In the mid-1990s, EU-15 out-put surpassed the United States in clinical medicine, theearth/space sciences, engineering/technology, mathemat-ics, and physics (appendix table 3).
Japan’s output rose at an average annual rate of 3.1%between 1992 and 2003, five times faster than that of theUnited States (figure 1). As with the United States andthe EU-15, Japan’s growth rate began to slow in 1992.Japan’s output path was similar in the 1985 fixed jour-
FIGURE 3. Average annual growth in S&E article output (whole counts) of major S&E publishing centers: 1988–92 and 1992–2003
0
2
4
6
8
10
12
14
16
18
20
22
United States EU-15 Japan East Asia-4
Percent
1988–921992–2003
S&E = science and engineering; EU = European Union.
NOTES: Articles on whole-count basis, i.e., for articles with collaborating institutions from multiple publishing centers, each publishing center receives one count for its participation regardless of the number of its participating institutions. East Asia-4 includes China, Singapore, South Korea, and Taiwan. China includes Hong Kong.
SOURCES: Thomson ISI, Science Citation Index and Social Sciences Citation Index, http://www.isinet.com/products/citation/; ipIQ, Inc.; and National Science Foundation, Division of Science Resources Statistics, special tabulations. See appendix table 4.
11
(Percent)
Field 1986–90 1990–2001 1988–92 1992–2003All fields 4.7 5.1 3.8 0.6
Life sciences 6.2 7.6 4.0 0.6Chemistry 0.3 0.7 3.6 0.7Physics 3.1 -1.4 3.8 -0.8Geosciences and astronomy 7.6 1.4 4.9 3.0Engineering and computer sciences 1.3 5.4 6.8 0.3Social sciences 10.0 2.4 2.9 0.3Psychology 5.6 2.8 2.1 0.3Mathematics 4.7 2.7 -3.0 0.6Other 6.8 4.7 2.4 1.2
Federal funding S&E articles
TABLE 1. Average annual growth in federal research funding and S&E article output (fractional counts), by field: 1986–2003
S&E = science and engineering.
NOTES: Federal funding is federal obligations in constant 2000 dollars. Because time needed to carry out research causes a lag between funding and publication of findings, comparison of funding with article output allows for a 2-year lag between date of funding and date of publication (i.e., funding in year 1 is compared with article output in year 3). Articles on fractional-count basis, i.e., for articles with collaborating institutions, each institution receives fractional credit on basis of proportion of its participation. Life sciences include biology, agricultural sciences, and medical sciences. Environmental sciences and astronomy include atmospheric sciences, geological sciences, oceanography, environmental sciences not classified elsewhere, and astronomy. "Other" includes physical sciences not classified elsewhere, social sciences not classified elsewhere, and other sciences.
SOURCES: Thomson ISI, Science Citation Index and Social Sciences Citation Index, http:www.isinet.com/products/citation/; ipIQ, Inc.; National Science Foundation, Division of Science Resources Statistics, Federal Funds for Research and Development: Fiscal Years 1970 –2003; Federal Obligations for Research by Agency and Detailed Field of Science and Engineering, NSF 04-335 (2004). See appendix table 5.
TABLE 2. Indicators of international collaboration for major S&E publishing centers: Selected years, 1992–2003Indicator and publishing center 1992 1995 1997 1999 2001 2003Ratio of fractional to whole S&E article counts
United States 0.931 0.917 0.905 0.892 0.881 0.871EU-15 0.913 0.900 0.890 0.882 0.871 0.862Japan 0.938 0.922 0.913 0.907 0.896 0.887East Asia-4 0.865 0.865 0.874 0.876 0.873 0.873
Proportion of international to domestic addressesUnited States 0.135 0.169 0.193 0.218 0.241 0.261EU-15 0.170 0.200 0.217 0.231 0.254 0.271Japan 0.143 0.194 0.211 0.207 0.236 0.255East Asia-4 0.359 0.416 0.354 0.326 0.318 0.316
Percent of S&E articles with an international addressUnited States 13.9 16.7 18.8 21.1 23.2 24.8EU-15 17.3 19.9 21.8 23.4 25.5 27.2Japan 11.8 14.7 16.5 17.7 19.7 21.5East Asia-4 25.3 25.6 25.5 25.2 24.8 25.4
S&E = science and engineering; EU = European Union.
NOTES: For articles with collaborating institutions from multiple publishing centers, fractional counts assign each publishing center fractional credit on basis of proportion of its participating institutions, and whole counts assign each publishing center one credit for its participation, regardless of the number of its participating institutions. Proportion of foreign to domestic addresses measured across total articles of each publishing center. An international address is an institutional address outside of the indicated publishing center. East Asia-4 includes China, Singapore, South Korea, and Taiwan. China includes Hong Kong.
SOURCES: Thomson ISI, Science Citation Index and Social Sciences Citation Index, http://www.isinet.com/products/citation/; ipIQ, Inc.; and National Science Foundation, Division of Science Resources Statistics, special tabulations.

12
nal set (appendix table 2). Japanese output growth ex-ceeded that of the United States in all fields between1992 and 2003 (appendix table 5). In physics, the gap inarticle output between Japan and the United States nar-rowed substantially between 1992 and 2003 (appendixtable 3), with Japan producing less than one-half thenumber of physics articles as the United States in 1992,but two-thirds as many in 2003.
Authors based in the East Asia-4 produced S&E articlesat a sharply accelerating pace. Between 1992 and 2003,growth in collective article output averaged almost 16%per annum, more than 25 times faster than in the United
States (figure 1). Rapid growth pushed this region’s shareof the world’s S&E articles from 2% in 1992 to 8% in2003, nearly equivalent to Japan’s share (figure 4 andappendix table 3). Growth in East Asia-4 article outputin the 1985 fixed journal set was equally rapid, resultingin a share increase of similar magnitude (appendix table2). Engineering/technology and chemistry were amongthe fields that grew the most rapidly during this period.In 1992, the East Asia-4’s article output in engineering/technology and in chemistry was less than 20% that ofthe United States. In 2003, they reached more than 70%of the U.S. total (appendix table 3). Output in both fieldssurpassed that of Japan in about 2000.
FIGURE 4. World share of S&E article output (fractional counts), by major S&E publishing center: 1992–2003
0
5
10
15
20
25
30
35
40
1992 1993 1994 1995 1996 1997 1998 1999 2000 2001 2002 2003
Percent
United States
EU-15
Japan
East Asia-4
S&E = science and engineering; EU = European Union.
NOTES: Articles on fractional-count basis, i.e., for articles with collaborating institutions from multiple publishing centers, each publishing center receives fractional credit on basis of proportion of its participating institutions. East Asia-4 includes China, Singapore, South Korea, and Taiwan. China includes Hong Kong.
SOURCES: Thomson ISI, Science Citation Index and Social Sciences Citation Index, http://www.isinet.com/products/citation/; ipIQ, Inc.; and National Science Foundation, Division of Science Resources Statistics, special tabulations. See appendix table 3.
Other
U.S. share of world natural science and engineering article output (fractional counts): 1973–2003
05
1015202530354045
1973 1978 1983 1988 1993 1998 2003
Percent
13
FIGURE 6. S&E article output (fractional counts) of major S&E publishing centers: 1988–2003
0
50
100
150
200
250
1988 1989 1990 1991 1992 1993 1994 1995 1996 1997 1998 1999 2000 2001 2002 2003
Thousands
S&E = science and engineering; EU = European Union.
NOTES: Article counts on fractional basis, i.e., for articles with collaborating institutions from multiple publishing centers, each publishing center receives fractional credit on basis of proportion of its participating institutions. East Asia-4 includes China, Singapore, South Korea, and Taiwan. China includes Hong Kong.
SOURCES: Thomson ISI, Science Citation Index and Social Sciences Citation Index, http://www.isinet.com/products/citation/; ipIQ, Inc.; and National Science Foundation, Division of Science Resources Statistics, special tabulations. See appendix table 3.
United States
EU-15
Japan
East Asia-4
Other
FIGURE 5. Decline in U.S. world share of S&E article output, by field: 1992–2003
-18
-16
-14
-12
-10
-8
-6
-4
-2
0
Percentage points
Fractional countsWhole counts
S&E = science and engineering.
NOTES: Fields ranked by decline of their fractional count share between 1992 and 2003. For articles with collaborating institutions, fractional counts assign the United States fractional credit on basis of proportion of its participating institutions, and whole counts assign the United States one credit for its participation, regardless of the number of participating institutions. "All fields" includes health sciences and professional fields. Biology includes agricultural sciences. Engineering/technology includes computer sciences.
SOURCES: Thomson ISI, Science Citation Index and Social Sciences Citation Index, http://www.isinet.com/products/citation/; ipIQ, Inc., and National Science Foundation, Division of Science Resources Statistics, special tabulations. See appendix table 3.
All fieldsEngineering/technology Mathematics Psychology
Social sciences Physics Biology
Earth/space sciences
Clinical medicine Chemistry
Biomedical research

14
A publishing center’s authorship of prominent S&E ar-ticles can be an indicator of the quality or influence ofthe research results it produces. Two citation measuresare used to gauge quality and influence: (1) the frequencywith which an article is cited and (2) the frequency ofcitation to the journal in which the article appears. Bet-ter and more influential articles tend to generate morecitations.12 Because articles in frequently cited journals13
tend to be more widely noticed, these journals are ableto attract better submissions and to publish better articles.These citation measures provide an indication of capa-bility and competitiveness at the frontiers of research.
Shares of highly cited articles are used to analyze trendsbecause worldwide counts of highly cited articles fluc-tuate for reasons unrelated to influence (see sidebar“Methodology for Determining Influential Article Countsby Percentile”). Unless otherwise noted, the top 5% shareof cited articles and journals is used as the measure ofhighly influential research. Results were similar whenanalyses were conducted using other percentile shares(see sidebar “Trends in Various Percentiles of Cited Ar-ticles and Journals”).
UNITED STATES
The U.S. share of the world’s highly influential S&E ar-ticles slipped between 1992 and 1996 (appendix table 8).It then dropped more substantially, from 56% in 1996 to50% in 2003 (figure 7).14 The drop paralleled the decline
TRENDS IN INFLUENTIAL ARTICLES AND JOURNALS
Methodology for Determining InfluentialArticle Counts by PercentileIn a given group of articles, the 5% that receive themost citations are classified as highly cited. For ex-ample, in a set of 765 articles, the 38 most frequentlycited articles (.05 x 765) would be counted as highlycited if there were no ties. In the example below, 20articles received at least 30 citations each and 40 re-ceived at least 25 citations each; therefore the totalnumber of articles in the top 5% is either 20 or 40,depending on whether the 20 articles that are tiedwith 25 citations are excluded or included. In suchcases, SRS excludes the articles in the tie. Becauseties are ubiquitous in the citation data, the actualnumber of articles included in the top 5% is ordi-narily less than 5% (how much less varies from yearto year).
12 Citations are not a straightforward measure of either quality or in-fluence. Other factors affect what authors choose to cite; e.g., they arelikely to cite their own previous articles and the work of colleagues, men-tors, friends, or scientists in their own country. Different fields havedifferent citation patterns. In addition, authors who are members ofrelatively large disciplinary or national communities are cited more fre-quently than those in smaller communities.
13 Journals are ranked by the average number of citations to articlespublished in each journal. Because the journal citation ranking is anaverage, articles appearing in highly cited journals may not necessarilybe highly cited.
14 Citation counts are based on a 3-year period with a 2-year lag. In2003, for example, a highly influential article is an article publishedbetween 1999 and 2001 that received more citations in 2003 than95% of the articles published in these years. Because of the lag be-tween publication and citation, the measure of highly influential ar-ticles begins with 1992, using data on articles cited in that year thatwere published between 1988 and 1990.
Citations Article counts (N = 765)75 150 435 530 1025 2020 5015 7510 100 5 200 0 300
Trends in Various Percentiles of Cited Articlesand Journals
Trends among the top 1%, 5%, and 10% of citedarticles were similar in the four S&E publishing cen-ters and in most fields (table 3 and appendix tables 6and 7). In a few fields—notably mathematics—trendsin the top 1% were somewhat different from trendsin the top 5% and top 10%, possibly because of thevery low article counts in the top 1% in these fields.

15
FIGURE 7. World share of highly influential S&E articles (fractional counts) of major S&E publishing centers: 1996–2003
0
10
20
30
40
50
60
1996 1997 1998 1999 2000 2001 2002 2003
Percent
United States
EU-15
Japan
East Asia-4
S&E = science and engineering; EU = European Union.
NOTES: Citations are references to scientific articles in journals covered by Science Citation Index (SCI) and Social Sciences Citation Index (SSCI). Highly influential articles are top 5% of cited articles based on a 3-year period with a 2-year lag (e.g., for 2003, highly influential articles are articles published in 1999–2001 that were among the top 5% in citations in articles published in 2003). Actual number of articles in top 5% is ordinarily less than 5% because articles with same frequency of citation that exceed top 5% are not included. Articles on fractional-count basis, i.e., for articles with collaborating institutions from multiple publishing centers, each publishing center receives fractional credit on basis of proportion of its participating institutions. East Asia-4 includes China, Singapore, South Korea, and Taiwan. China includes Hong Kong.
SOURCES: Thomson ISI, SCI and SSCI, http://www.isinet.com/products/citation/; ipIQ, Inc.; and National Science Foundation, Division of Science Resources Statistics, special tabulations. See appendix table 8.
Other
TABLE 3. World share of highly cited S&E articles (fractional counts), by major S&E publishing center and percentile: 1992, 1997, and 2003(Percent distribution)
1992 1997 2003 1992 1997 2003 1992 1997 2003All publishing centers 100.0 100.0 100.0 100.0 100.0 100.0 100.0 100.0 100.0
United States 64.6 61.6 56.6 58.5 55.2 50.3 56.0 51.5 46.5EU-15 23.3 25.1 27.7 26.2 28.8 30.7 27.3 30.5 32.3Japan 4.2 4.4 5.3 5.3 5.2 6.0 5.7 5.9 6.6East Asia-4 0.1 0.2 1.1 0.3 0.5 1.9 0.4 0.7 2.4All other 7.8 8.8 9.3 9.8 10.4 11.0 10.6 11.4 12.2
Top 10%Publishing center
Top 1% Top 5%
S&E = science and engineering; EU = European Union.
NOTES: Citations are references to scientific articles in journals covered by Science Citation Index (SCI) and Social Sciences Citation Index (SSCI). Highly cited articles based on a 3-year period with a 2-year lag (e.g., for 2003, highly cited articles are articles published in 1999–2001 that received the most citations in articles published in 2003). Highly influential articles are top 5% cited articles. Actual number of articles in top 5% is ordinarily less than 5% because articles with same frequency of citation that exceed top 5% are not included. Articles on fractional-count basis, i.e., for articles with collaborating institutions from multiple publishing centers, each publishing center receives fractional credit on basis of proportion of its participating institutions. East Asia-4 includes China, Singapore, South Korea, and Taiwan. China includes Hong Kong.
SOURCES: Thomson ISI, SCI and SSCI, http://www.isinet.com/products/citation/; ipIQ, Inc.; and National Science Foundation, Division of Science Resources Statistics, special tabulations. See appendix table 6,7, and 8.

16
in the U.S. share of published articles that occurred whenoverall U.S. article output flattened beginning in 1992(figure 6). For the three other major S&E publishing cen-ters, shares of the world’s most influential S&E articlesincreased during this period.
By field, the change in the U.S. share of highly influen-tial articles was largely similar to the change in the U.S.share of total article output (figures 5 and 8).15 In phys-ics and engineering/technology, the United States expe-rienced the largest declines during this period; by 2003the U.S. shares of highly influential articles were lowerin these fields than in all others. Shares in the earth/spacesciences and mathematics declined by nearly as much asthose in physics and engineering/technology. The declinein the U.S. share of highly influential articles in clinicalmedicine and biomedical research was less than the over-all decline in the U.S. share of highly influential articles.Similarly, those fields experienced less of a decline intheir shares of total world article output than did theUnited States as a whole.
Whole-count trends in the U.S. share of the world’s highlyinfluential articles between 1996 and 2003 were similarto fractional-count trends: the U.S. lost share while theshares of the three other major S&E publishing centersincreased. The U.S. whole-count share during this pe-riod fell from 62% to 58% (figure 8 and appendix table9). The whole-count decline was less than the fractional-count decline, however. Consistent with the overall trendfor all publications, the United States increasingly re-ceived credit for highly influential articles by participat-ing in international collaborations.
The U.S. whole-count share declined in all fields between1996 and 2003, but the size of the decline varied by field(figure 8 and appendix table 9). In three fields—clinicalmedicine, biomedical research, and the earth/space sci-ences—more than half of the U.S. share decline disap-peared when publications were measured using whole
counts rather than fractional counts. This finding sug-gests that the United States largely maintained its world-wide position in these fields, although it did so by morefrequently engaging in international collaboration. Thesame trend occurred in all U.S. articles in these fields(figure 5). In all other fields, however, whole countingproduced only marginal differences in the size of the U.S.decline, suggesting that other nations with growing ar-ticle shares were displacing some of the U.S. share inhighly influential publications.
Between 1996 and 2003, the overall decline in the U.S.share of articles published in highly influential journalswas similar to the decline in highly influential articles(figure 9 and appendix table 10). The magnitude of thedecline differed among fields, however, and these dif-ferences in magnitude did not correspond to differencesfor highly cited articles. For chemistry, clinical medi-cine, and engineering/technology, the decline in the shareof articles in highly influential journals was greater thanin the decline in the share of highly influential articles.In contrast, for the earth/space sciences and social sci-ences, the decline in share of articles in highly influen-tial journals was smaller than the decline in share ofhighly influential articles.
The percentage of total U.S. article output classified ashighly cited is a somewhat different indicator of qualityand influence. It indicates whether prominent articles arebecoming more or less common in the output that theUnited States generates. This percentage remained steadybetween 1996 and 2003 and was higher than would beexpected by chance (i.e., above 5%) (table 4). Likewise,this indicator remained steady in most fields (appendixtable 11). The exceptions were engineering/technology andmathematics, where the percentage of U.S. articles classi-fied as highly cited increased between 1996 and 2003.
THE EU-15, JAPAN, AND THE EASTASIA-4The EU-15’s share of the world’s highly influential ar-ticles rose slightly from 28% in 1996 to 31% in 2003(figure 7 and appendix table 8). By field, the EU-15 shareof highly influential articles surpassed that of the UnitedStates in physics in 2003, and its gap with the UnitedStates in mathematics and engineering/technology nar-rowed considerably (appendix table 8). For articles ininfluential journals, share trends by field were somewhat
15 In analyses of the entire set of S&E articles, the number of articles inthe database as a whole is used to calculate the top 5% considered to behighly influential. Because citation patterns vary from field to field, thismethod of determining the number of highly influential articles causesarticles in some fields to be overrepresented and articles in other fields tobe underrepresented. However, when citation counts are analyzed byfield, articles are classified as highly influential if they are among the top5% cited in their field, which partially controls for field differences incitation patterns. Thus, the same article may be classified as highlyinfluential in some analyses and not highly influential in others.

17
different. However, the EU-15’s gap with the UnitedStates narrowed considerably in engineering/technologyand physics, two fields that exhibited similar trends inhighly influential articles (appendix table 10).
Japan’s share of the world’s highly influential articlesremained steady, rising slightly in all fields except thesocial sciences and psychology during the post-1996period (figure 7 and appendix table 8). Share trends forarticles in influential journals were similar in all fieldsexcept physics, where the Japanese share increased at asmaller rate between 1996 and 2003 (appendix table 10).
The East Asia-4’s share of the world’s highly influentialarticles more than quadrupled but remained very lowoverall, rising from less than 1% in 1996 to 2% in 2003
(figure 7 and appendix table 8). However, the East Asia-4 share increased considerably in physics, chemistry, and,especially, engineering/technology. Its share of theworld’s highly influential engineering/technology articlesrose from 3% in 1996 to 10% in 2003, nearly equal toJapan’s share. Trends were similar for articles in influ-ential journals (appendix table 10).
Among U.S., EU-15, and Japanese articles, the percent-age classified as highly influential remained roughly con-stant between 1996 and 2003. In contrast, the percent-age of East Asia-4 articles in this category doubled duringthis period (table 5). Despite this trend, the East Asia-4ended the period with the lowest percentage of its ar-ticles (1.6) in the highly cited group, well behind theUnited States (8.1), the EU-15 (4.7), and Japan (3.4).
FIGURE 8. Decline in U.S. world share of highly influential S&E articles, by field: 1996–2003
-12
-10
-8
-6
-4
-2
0
Percentage points
Fractional countsWhole counts
S&E = science and engineering.
NOTES: Citations are references to scientific articles in journals covered by Science Citation Index (SCI) and Social Sciences Citation Index (SSCI). Highly influential articles are top 5% of cited articles based on a 3-year period with a 2-year lag (e.g., for 2003, highly influential articles are articles published in 1999–2001 that were among the top 5% in citations in articles published in 2003). Actual number of articles in top 5% is ordinarily less than 5% because articles with same frequency of citation that exceed top 5% are not included. Fields ranked by difference between 1996 and 2003 fractional count shares. For articles with collaborating institutions, fractional counts assign the United States fractional credit on basis of proportion of its participating institutions, and whole counts assign the United States one credit for its participation, regardless of the number of participating institutions. "All fields" includes health sciences and professional fields. Biology includes agricultural sciences. Engineering/technology includes computer sciences.
SOURCES: Thomson ISI, SCI and SSCI, http://www.isinet.com/products/citation/; ipIQ, Inc.; and National Science Foundation, Division of Science Resources Statistics, special tabulations. See appendix table 8 and 9.
All fields PhysicsEngineering/technology
Earth/space sciences Mathematics Psychology
Social sciences Biology Chemistry
Clinical medicine
Biomedical research

18
FIGURE 9. Decline in U.S. world share of highly influential S&E articles (fractional counts) and of S&E articles published in highly influential journals (fractional counts) between 1996 and 2003, by field
-25
-20
-15
-10
-5
0
Percentage points
ArticlesJournals
S&E = science and engineering.
NOTES: Citations are references to scientific articles in journals covered by Science Citation Index (SCI) and Social Sciences Citation Index (SSCI). Highly influential articles are top 5% of cited articles based on a 3-year period with a 2-year lag (e.g., for 2003, highly influential articles are articles published in 1999–2001 that were among the top 5% in citations in articles published in 2003). Actual number of articles in top 5% is ordinarily less than 5% because articles with same frequency of citation that exceed top 5% are not included. Articles on fractional-count basis; i.e., for articles with collaborating institutions, the United States receives fractional credit on basis of proportion of its participating institutions. Highly influential journals are top 5% cited journals based on a 3-year period with a 2-year lag (e.g., for 2003, citations are references made in articles published in 2003 to articles published in 1999–2001). Journals ranked by average ratio of citations to articles published in each journal and by each citing year; number may vary each year because of changes in total number of cited journals. Fields ranked by world share decline in highly influential articles. "All fields" includes health sciences and professional fields. Biology includes agricultural sciences. Engineering/technology includes computer sciences.
SOURCES: Thomson ISI, SCI and SSCI, http://www.isinet.com/products/citation/; ipIQ, Inc.; and National Science Foundation, Division of Science Resources Statistics, special tabulations. See appendix table 8 and 10.
All fields PhysicsEngineering/technology
Earth/space sciences Mathematics Psychology
Social sciences Biology Chemistry
Clinical medicine
Biomedical research

19
Field 1996 1998 2000 2002 2003All fields 7.8 7.9 8.0 8.0 8.1
Chemistry 10.0 9.7 10.0 9.8 9.9Physics 8.8 8.7 8.6 8.9 8.6Biomedical research 8.0 8.1 8.2 8.1 8.0Mathematics 6.9 7.9 7.6 7.4 7.7Clinical medicine 7.3 7.4 7.5 7.5 7.5Earth/space sciences 7.8 7.5 7.5 7.5 7.5Biology 7.0 6.7 6.9 7.1 7.0Social sciences 6.8 6.8 6.9 7.0 6.8Engineering/technology 5.3 5.4 5.9 6.5 6.7Psychology 6.1 6.2 6.2 6.1 5.9
(Percent of U.S. S&E articles)
TABLE 4. Highly influential U.S. S&E articles (fractional counts), by field: selected years, 1996–2003
S&E = science and engineering.
NOTES: Citations are references to scientific articles in journals covered by Science Citation Index (SCI) and Social Sciences Citation Index (SSCI). Highly influential articles are top 5% of cited articles based on a 3-year period with a 2-year lag (e.g., for 2003, highly influential articles are articles published in 1999–2001 that were among the top 5% in citations in articles published in 2003). Top 5% article counts normalized to equal 5% of total articles. Actual number of articles in top 5% is ordinarily less than 5% because articles with same frequency of citation that exceed top 5% are not included. Articles on fractional-count basis, i.e., for articles with collaborating institutions from multiple publishing centers, the United States receives fractional credit on basis of proportion of its participating institutions. Fields ranked by 2003 share. "All fields" includes health sciences and professional fields. Biology includes agricultural sciences. Engineering/technology includes computer sciences.
SOURCES: Thomson ISI, SCI and SSCI, http://www.isinet.com/products/citation/; ipIQ, Inc.; and National Science Foundation, Division of Science Resources Statistics, special tabulations. See appendix table 11.
(Percent of major publishing center S&E articles)Publishing center 1996 1998 2000 2002 2003United States 7.8 7.9 8.0 8.0 8.1EU-15 4.5 4.5 4.5 4.7 4.7Japan 3.2 3.1 3.3 3.4 3.4East Asia-4 0.8 0.8 1.0 1.4 1.6Other 2.3 2.4 2.5 2.6 2.6
TABLE 5. Highly influential S&E articles (fractional counts) of major S&E publishing centers: selected years, 1996–2003
S&E = science and engineering; EU = European Union.
NOTES: Citations are references to scientific articles in journals covered by Science Citation Index (SCI) and Social Sciences Citation Index (SSCI). Highly influential articles are top 5% of cited articles based on a 3-year period with 2-year lag (e.g., for 2003, highly influential articles are articles published in 1999–2001 that were among the top 5% in citations in articles published in 2003). Top 5% article counts normalized to equal 5% of total articles. Actual number of articles in top 5% is ordinarily less than 5% because articles with same frequency of citation that exceed top 5% are not included. Articles on fractional-count basis, i.e., for articles with collaborating institutions from multiple publishing centers, each publishing center receives fractional credit on basis of proportion of its participating institutions. East Asia-4 includes China, Singapore, South Korea, and Taiwan. China includes Hong Kong.
SOURCES: Thomson ISI, SCI and SSCI, http://www.isinet.com/products/citation/; ipIQ, Inc.; and National Science Foundation, Division of Science Resources Statistics, special tabulations. See appendix table 11.

20
OVERALL OUTPUT TRENDS
The academic sector dominates U.S. S&E article pro-duction, accounting for nearly three-quarters of U.S.output. Because this sector plays such an important role,indicators of patterns and trends in its article output areworthy of special attention.16
Similar to overall U.S. output, academic sector outputgrew considerably between 1988 and 1992 and flattenedthereafter. Average annual growth in the U.S. academicsector was 3.0% between 1988 and 1992, but only 0.8%between 1992 and 2003. Field trends in output were gen-erally consistent with the overall sector trend in bothperiods, and trends were similar whether measured inwhole counts or fractional counts (table 6 and appendixtable 12).
Academic sector performance compared favorably withperformance in the nonacademic sectors, where growthin annual output was slower in the earlier period (2.4%versus 3.0% for the academic sector) and output declinedin the later period (-0.1% annual rate versus 0.8% forthe academic sector) (table 7). Within the nonacademicsectors, output between 1988 and 2003 declined in thefederal government, the state and local governments, andthe private for-profit sectors and increased in the FFRDCand private nonprofit sectors (appendix table 13).
During the period of overall flattening in article output(1992–2003), in almost every ipIQ broad field, the aca-demic sector’s share of U.S. articles increased, while theprivate for-profit sector’s and the federal government’sshares declined (figure 10). The combined pattern of theacademic sector’s rising share of articles and the for-profitsector’s falling share was especially dramatic in engi-neering/technology, physics, the social sciences, and theearth/space sciences. The fields of clinical medicine andbiology (which has a large component of agriculturalsciences) are the only two fields in which the academicsector’s share did not increase and the only two in whichthe private for-profit sector’s share did not decline.
TRENDS IN THE TOP 200 ACADEMICRESEARCH UNIVERSITIES
Within the academic sector, the top 200 R&D institu-tions (based on R&D expenditures during the 1988–2001period) account for most of the article output. In 2001,the share of academic articles with at least one authorfrom these institutions was 94%.17 Because the academicsector dominates U.S. S&E article production and thetop 200 R&D institutions are at the core of the academicsector, the analyses that follow are structured aroundthese institutions and how they operate.
Accordingly, unlike other analyses in this report, the fol-lowing analyses use the S&E field classification of the
THE U.S. ACADEMIC SECTOR
17 For technical reasons, the analysis of the top 200 research universi-ties was confined to the 1988–2001 period. However, data for 2003are generally consistent with the patterns and trends reported in thissection.
16 Other sectors in which researchers produced articles are the federalgovernment, the private for-profit sector, FFRDCs, the private non-profit sector, and state and local governments. Articles that cannot beassigned to one of these sectors are categorized as “unknown.”
(Percent)
Field 1988–92 1992–2003 1988–92 1992–2003All fields 3.0 0.8 3.6 1.5
Biology 0.4 0.3 1.1 1.1Biomedical research 4.7 0.6 5.4 1.2Chemistry 3.5 0.9 4.1 1.4Clinical medicine 2.7 0.7 3.0 1.3Earth/space sciences 3.6 3.3 4.7 4.5Engineering/technology 6.5 1.2 7.1 2.0Mathematics -2.0 0.7 -1.1 1.4Physics 3.7 0.0 5.0 1.0Psychology 1.4 0.6 1.4 1.0Social sciences 2.3 0.7 2.4 0.9
S&E = science and engineering.
TABLE 6. Average annual growth in U.S. academic S&E article output, by field: 1988–92 and 1992–2003
SOURCES: Thomson ISI, Science Citation Index and Social Sciences Citation Index, http://www.isinet.com/products/citation/; ipIQ, Inc.; and National Science Foundation, Division of Science Resources Statistics, special tabulations. See appendix table 12.
Fractional counts Whole counts
NOTES: For articles with collaborating institutions, fractional counts assign each participating institution fractional credit on basis of proportion of its participation, and whole counts assign academic sector one credit for its participation, regardless of the number of participating institutions. "All fields" includes health sciences and professional fields. Biology includes agricultural sciences. Engineering/technology includes computer sciences.

21
Integrated Science and Engineering Resources Data Sys-tem (WebCASPAR) when presenting data by field ratherthan the ipIQ field classification. (For a crosswalk be-tween WebCASPAR and ipIQ fields, see appendix table14.) In addition to aligning more closely with the way inwhich academic institutions are organized, WebCASPARfields have a second important advantage: they enableanalyses of the relationship between publication outputsand field-specific resource inputs (e.g., academic R&Dexpenditures, postdocs, S&E doctoral degree recipi-ents).18
The top 200 R&D institutions dominate S&E article out-put in all WebCASPAR fields, receiving authorship creditfor between 82% and 83% (psychology, social sciences)and 98% (agricultural and medical sciences) of academicsector articles (figure 11). Output trends for these insti-tutions basically mirror trends for the academic sectoras a whole for both fractional and whole article counts(figure 12).
OUTPUT TRENDS
Article output trends varied somewhat for different typesof academic institutions, even among the top 200 R&Dperformers. However, the overarching trend of strongergrowth between 1988 and 1992 than in the subsequentperiod is manifested in practically every category of in-stitution that the study examined.
The Carnegie Foundation for the Advancement of Teach-ing classification of academic institutions is a widelyrecognized system for distinguishing among institutionsby the range and breadth of their research and educationprograms.19 The majority of the top 200 R&D institu-tions are classified as Carnegie research institutions(n = 125), followed by doctorate-granting institutions(n = 39) and freestanding medical institutions (n = 23)(table 8). Public institutions (n = 145) constitute over70% of the top 200 institutions.
For the entire 1988–2001 period, output growth rateswere greater in private research I universities and bothpublic and private freestanding medical institutions thanin public research I universities and both public and pri-vate research II universities (table 9 and appendix table15).20 There were also relatively large increases in top200 institutions, both public and private, in the othercategory. For all of these Carnegie classes, growth ratesfor the 1988–92 period exceeded those for the 1992–2001 period.
Output growth appeared to be weakest in high-qualitydepartments among the top 200 institutions. SRS usedthe 1994 National Research Council (NRC) ratings ofthe scholarly quality of graduate departments at U.S.universities as a measure of a university’s quality in the
18 Such analyses will be presented in a future report, as discussed inthe conclusion below.
19 For the purposes of this study, the 1994 Carnegie classification wasmore useful than the 2000 version because it relies on criteria that aremore relevant to the institutional characteristics associated with re-search and publication. The Carnegie Foundation recently completeda complete revision of its classification system.
20 Research I and II universities offer a full range of baccalaureateprograms, are committed to graduate education through the doctorate,and give high priority to research. Both classes of institutions award50 or more doctoral degrees each year. Research I institutions receive$40 million or more in federal support annually and research II insti-tutions receive between $15.5 million and $40 million annually.
(Percent)Sector 1988–2003 1988–92 1992–2003All U.S. sectors 1.2 2.9 0.6
Academic 1.4 3.0 0.8Nonacademic 0.6 2.4 -0.1
Federal government -0.1 1.5 -0.7FFRDCs 1.0 0.8 1.1State and local government -0.7 0.0 -0.9Private for-profit -0.3 2.8 -1.4Private nonprofit 1.8 3.1 1.4Joint 8.2 11.9 6.8Unknown 2.3 9.8 -0.2
TABLE 7. Average annual growth in U.S. S&E article output (fractional counts), by sector: 1988–2003, 1988–92, and 1992–2003
SOURCES: Thomson ISI, Science Citation Index and Social Sciences Citation Index, http://www.isinet.com/products/citation/; ipIQ, Inc.; and National Science Foundation, Division of Science Resources Statistics, special tabulations. See appendix table 13.
S&E = science and engineering; FFRDC = federally funded research and development center.
NOTES: Articles on fractional-count basis, i.e., for articles with collaborating institutions, each sector receives fractional credit on basis of proportion of its participating institutions.
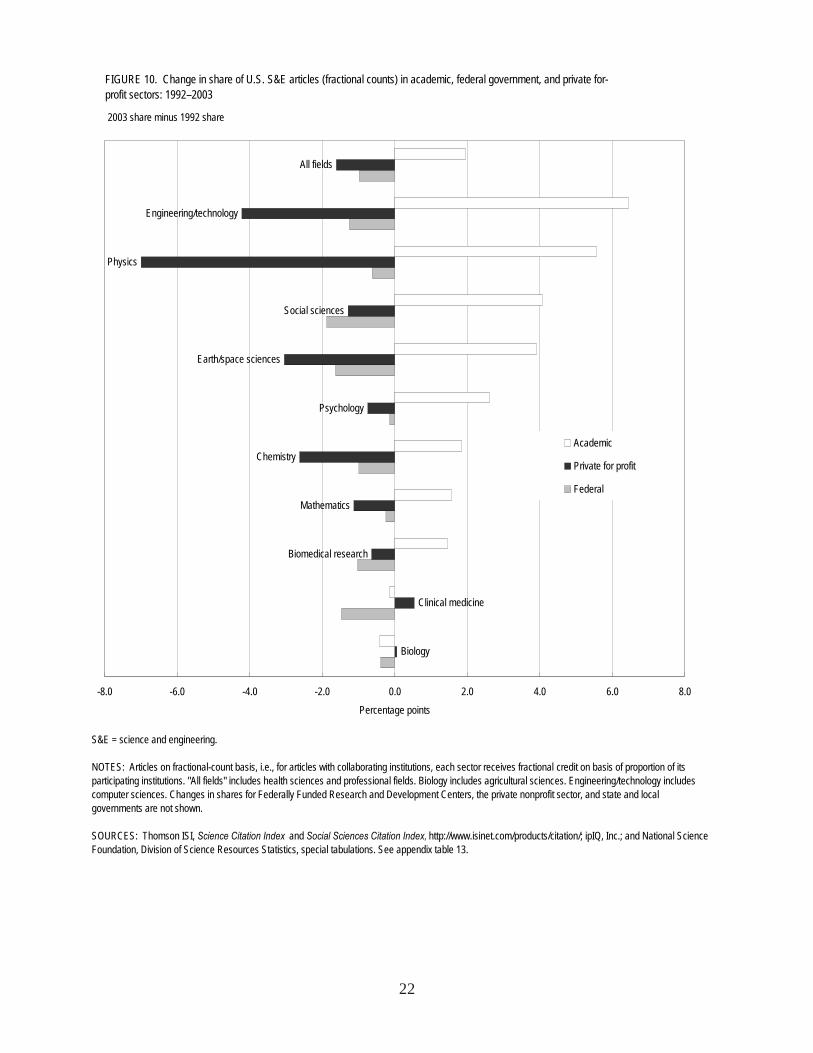
22
FIGURE 10. Change in share of U.S. S&E articles (fractional counts) in academic, federal government, and private for-profit sectors: 1992–2003
Biology
Clinical medicine
Biomedical research
Mathematics
Chemistry
Psychology
Social sciences
Physics
Engineering/technology
All fields
Earth/space sciences
-8.0 -6.0 -4.0 -2.0 0.0 2.0 4.0 6.0 8.0Percentage points
Academic
Private for profit
Federal
S&E = science and engineering.
NOTES: Articles on fractional-count basis, i.e., for articles with collaborating institutions, each sector receives fractional credit on basis of proportion of its participating institutions. "All fields" includes health sciences and professional fields. Biology includes agricultural sciences. Engineering/technology includes computer sciences. Changes in shares for Federally Funded Research and Development Centers, the private nonprofit sector, and state and local governments are not shown. SOURCES: Thomson ISI, Science Citation Index and Social Sciences Citation Index, http://www.isinet.com/products/citation/; ipIQ, Inc.; and National Science Foundation, Division of Science Resources Statistics, special tabulations. See appendix table 13.
2003 share minus 1992 share
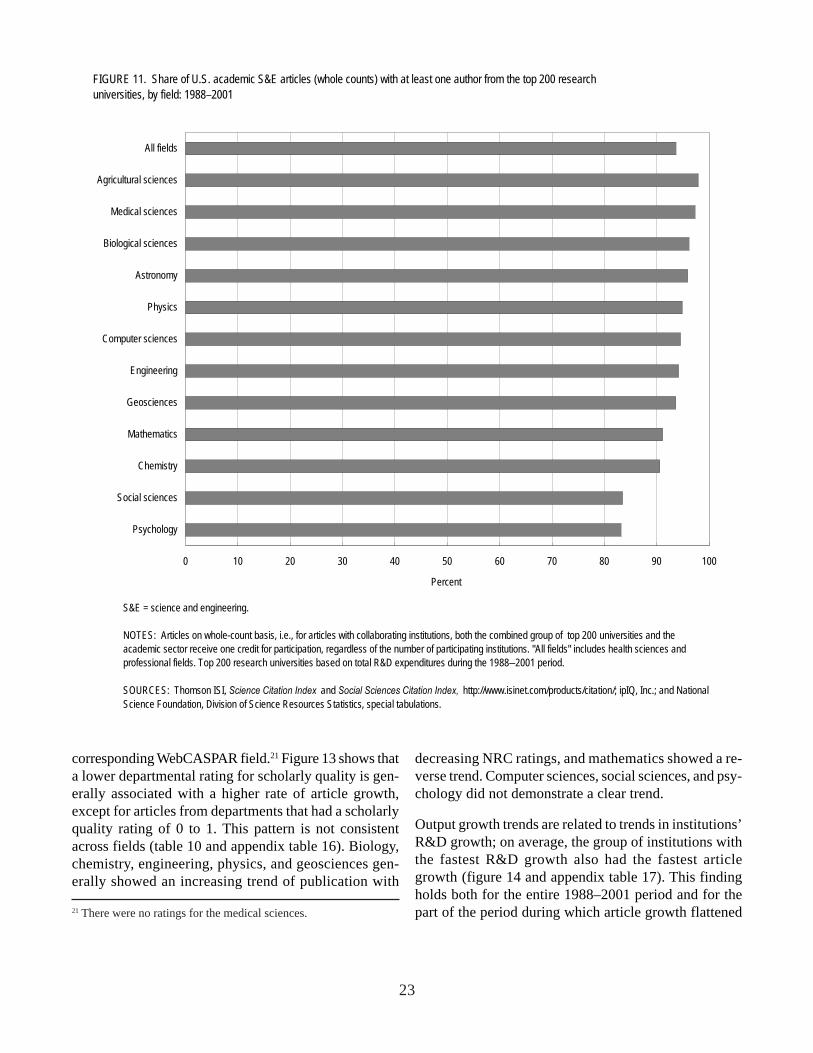
23
corresponding WebCASPAR field.21 Figure 13 shows thata lower departmental rating for scholarly quality is gen-erally associated with a higher rate of article growth,except for articles from departments that had a scholarlyquality rating of 0 to 1. This pattern is not consistentacross fields (table 10 and appendix table 16). Biology,chemistry, engineering, physics, and geosciences gen-erally showed an increasing trend of publication with
decreasing NRC ratings, and mathematics showed a re-verse trend. Computer sciences, social sciences, and psy-chology did not demonstrate a clear trend.
Output growth trends are related to trends in institutions’R&D growth; on average, the group of institutions withthe fastest R&D growth also had the fastest articlegrowth (figure 14 and appendix table 17). This findingholds both for the entire 1988–2001 period and for thepart of the period during which article growth flattened21 There were no ratings for the medical sciences.
FIGURE 11. Share of U.S. academic S&E articles (whole counts) with at least one author from the top 200 research universities, by field: 1988–2001
0 10 20 30 40 50 60 70 80 90 100
Psychology
Social sciences
Chemistry
Mathematics
Geosciences
Engineering
Computer sciences
Physics
Astronomy
Biological sciences
Medical sciences
Agricultural sciences
All fields
Percent
S&E = science and engineering.
NOTES: Articles on whole-count basis, i.e., for articles with collaborating institutions, both the combined group of top 200 universities and the academic sector receive one credit for participation, regardless of the number of participating institutions. "All fields" includes health sciences and professional fields. Top 200 research universities based on total R&D expenditures during the 1988–2001 period.
SOURCES: Thomson ISI, Science Citation Index and Social Sciences Citation Index, http://www.isinet.com/products/citation/; ipIQ, Inc.; and National Science Foundation, Division of Science Resources Statistics, special tabulations.

24
(1992–2001). (See figure 2 for an index of both R&Dand article growth.)
COLLABORATION TRENDS
SRS’s international data indicate that during the periodunder study, collaboration across geographic boundariesbecame much more widespread. SRS’s U.S. data con-tain information about patterns and trends in collabora-tion across sectoral and institutional boundaries that isnot available internationally. If comparable data on othernations and regions become available, future researchcan examine how different national trends in collabora-tion across various kinds of boundaries (if such trends
exist) relate to the different trends in overall nationalS&E publication output.
The U.S. academic sector participated in the worldwidetrend toward increased collaboration across geographicboundaries. Between 1988 and 2001, the article output ofthe academic sector became more collaborative not onlyinternationally, but also across U.S. sectoral and institu-tional boundaries. As a result, output trends for differenttypes of articles varied substantially, depending onwhether collaboration was involved and the type of col-laboration that was involved. In general, article outputfor various types of collaborative articles increased, whilesingle-author and single-institution output declined.
FIGURE 12. Trends in S&E article output (whole and fractional counts) of entire U.S. academic sector and top 200 research universities: 1988–2001
100
110
120
130
140
150
160
170
180
190
200
1988 1989 1990 1991 1992 1993 1994 1995 1996 1997 1998 1999 2000 2001
Thousands
Academic sector (whole counts )
Top 200 research universities (whole counts)
Academic sector (fractional counts)
Top 200 research universities (fractional counts)
S&E = science and engineering.
NOTES: For articles with collaborating institutions, fractional counts assign each participating institution fractional credit on basis of proportion of its participation, and whole counts assign both the combined group of top 200 research universities and the academic sector one credit for participation, regardless of the number of participating institutions. Top 200 research universities based on total R&D expenditures during the 1988–2001 period.
SOURCES: Thomson ISI, Science Citation Index and Social Sciences Citation Index, http://www.isinet.com/products/citation/; ipIQ, Inc.; and National Science Foundation, Division of Science Resources Statistics, special tabulations.

25
The ratio of fractional to whole counts is a measure ofcollaboration intensity (see sidebar “Effect of Interna-tional Collaboration on Whole- and Fractional-CountOutput”). For the top 200 institutions, the average ratioof fractional counts to whole counts declined between1988 and 2001, indicating more collaboration over time.Increased collaboration occurred in each WebCASPARfield (figure 15 and appendix table 18); the fields thatwere more collaborative (astronomy, geosciences, phys-ics) and less collaborative (chemistry, social sciences,psychology) in 1988 were generally the same in 2001.
For most of the top 200 institutions, the trend towardcollaborative publications occurred not only on average,but also in each field. For all 200 institutions, the frac-tional-count to whole-count ratio for all fields combinedwas lower in 2001 than in 1988 (appendix table 19). Atthe individual field level, because some institutions pro-duced a small number of articles in some fields in a givenyear, it is more appropriate to compare collaborationacross two periods (1988–94 and 1995–2001) rather thanfor individual years throughout the 1988–2001 period.The percentage of the top 200 institutions in which col-laboration was greater in the 1995–2001 period than inthe 1988–94 period ranged from 72% in the agriculturaland other life sciences to 98% in the biological sciences(figure 16).
The distribution of types of collaborative articles at thetop 200 academic institutions changed dramatically be-tween 1988 and 2001. Articles in which an author at atop 200 institution participates can be broken down intosingle-author articles and six types of multiple-authorarticles (figure 17 and appendix table 20):
Single institutions
• Single department-multiple authors.• Single institution-multiple departments.
Multiple institutions
• More than one top 200 institution.• Top 200 institution(s) and other U.S.
institution(s).• Top 200 institution(s) and foreign institution(s).• Top 200 institution(s), other U.S. institution(s),
and foreign institution(s).
Institution type All top 200 Public PrivateTop 200 200 145 55
Research I 89 60 29Research II 36 26 10Doctorate-granting I 16 12 4Doctorate-granting II 23 20 3Masters and liberal arts 8 7 1Engineering 1 1 0Medical 23 15 8Other Carnegie 1 1 0Not classified 3 3 0
TABLE 8. Carnegie institution type and administrative control of top 200 U.S. research universities
SOURCE: Carnegie Foundation for the Advancement of Teaching, A Classification of Institutions of Higher Education, Princeton University Press (1994).
Administrative control
NOTES: Institutions designated by 1994 Carnegie classification code. Top 200 research universities based on total R&D expenditures during the 1988–2001 period.
(Percent)
Type of control and Carnegie classification 1988–2001 1988–92 1992–2001Public 1.0 3.1 0.1
Research I 0.9 2.9 0.0Research II 1.1 3.4 0.1Medical 2.0 4.1 1.0All other 2.0 4.6 0.8
Private 1.6 2.9 1.0Research I 1.6 2.7 1.1Research II 0.6 1.5 0.2Medical 2.1 4.9 0.9All other 2.4 6.7 0.5
TABLE 9. Average annual growth in S&E article output (fractional counts) of top 200 U.S. research universities, by administrative control of institution and Carnegie institution type: 1988–2001, 1988–92, and 1992–2001
SOURCES: Thomson ISI, Science Citation Index and Social Sciences Citation Index, http://www.isinet.com/products/citation/; ipIQ, Inc.; and National Science Foundation, Division of Science Resources Statistics, special tabulations. See appendix table 15.
NOTES: Articles on fractional-count basis, i.e., for articles with collaborating institutions, each institution type receives fractional credit on basis of proportion of its participating institutions. Institutions designated by 1994 Carnegie classification code. For information on these institutional categories, see Carnegie Foundation for the Advancement of Teaching, A Classification of Institutions of Higher Education, Princeton University Press (1994).Top 200 research universities based on total R&D expenditures during the 1988–2001 period.
S&E = science and engineering.

26
Collaborative articles across institutional boundaries (thelast four categories listed above) increased substantiallyduring this period, whereas other types of articles didnot (figure 17). In absolute numbers, the largest increase(about 19,000) occurred for articles in which authors fromthe top 200 institutions collaborated with authors at for-eign institutions. In relative terms, the most dramatic in-crease (almost 300%) was for articles in which authorsfrom the top 200 institutions collaborated with authorsfrom both other U.S. institutions and foreign institutions,but this growth was from a small base. In contrast, ar-ticles with either a single author or multiple authors froma single department declined, and the number of articleswith authors from multiple departments at a single insti-tution remained fairly flat. The net result of these trendswas a drop from 60% to 46% in the proportion of ar-ticles credited to a single top 200 academic institution
and an increase from 10% to 23% in the proportion ofpublications with at least one author from a U.S. institu-tion and one author from a foreign institution (figure 18).The trends in individual fields were similar to the over-all change (figures 19 and 20). The extent of collabora-tion varied considerably across fields.
Collaborative articles also showed a trend toward involv-ing more institutions and more individual authors. Forarticles with participation by a top 200 institution, the num-bers of authors, top 200 institutional addresses, and non-top 200 institutional addresses increased between 1988and 2001 (figure 21). The number of authors per articleincreased by nearly 50%, and the number of non-top 200institutional addresses per article almost doubled duringthis period. The number of top 200 institutional addressesper article increased less rapidly, rising by less than 14%.
FIGURE 13. Average annual growth in S&E article output (fractional counts) of departments at top 200 U.S. research universities, by National Research Council scholarly quality departmental rating: 1988–2001
0
0.2
0.4
0.6
0.8
1
1.2
1.4
1.6
1.8
All >4 3 < 4 2 < 3 <2 1 < 2 0 < 1 None
Percent
S&E = science and engineering.
NOTES: 1994 National Research Council ratings of scholarly quality of graduate departments at U.S. universities used as measure of university quality in corresponding field in Integrated Science and Engineering Resources Data System (WebCASPAR), http://caspar.nsf.gov. Higher ratings signify higher scholarly quality. Articles on fractional-count basis, i.e., for articles with collaborating institutions, each institution receives fractional credit on basis of proportion of its participation. Number of articles in each scholarly quality range for each WebCASPAR field in which ratings were provided were aggregated across the 200 universities. For more information about data and methods, see M.L. Goldberger, B.A. Maher, and P.E. Flattau, editors, Research-Doctorate Programs in the United States: Continuity and Change, National Research Council (1995). Top 200 research universities based on total R&D expenditures during the 1988–2001 period.
SOURCES: Thomson ISI, Science Citation Index and Social Sciences Citation Index, http://www.isinet.com/products/citation/; ipIQ, Inc.; and National Science Foundation, Division of Science Resources Statistics, special tabulations. See appendix table 16.
>4
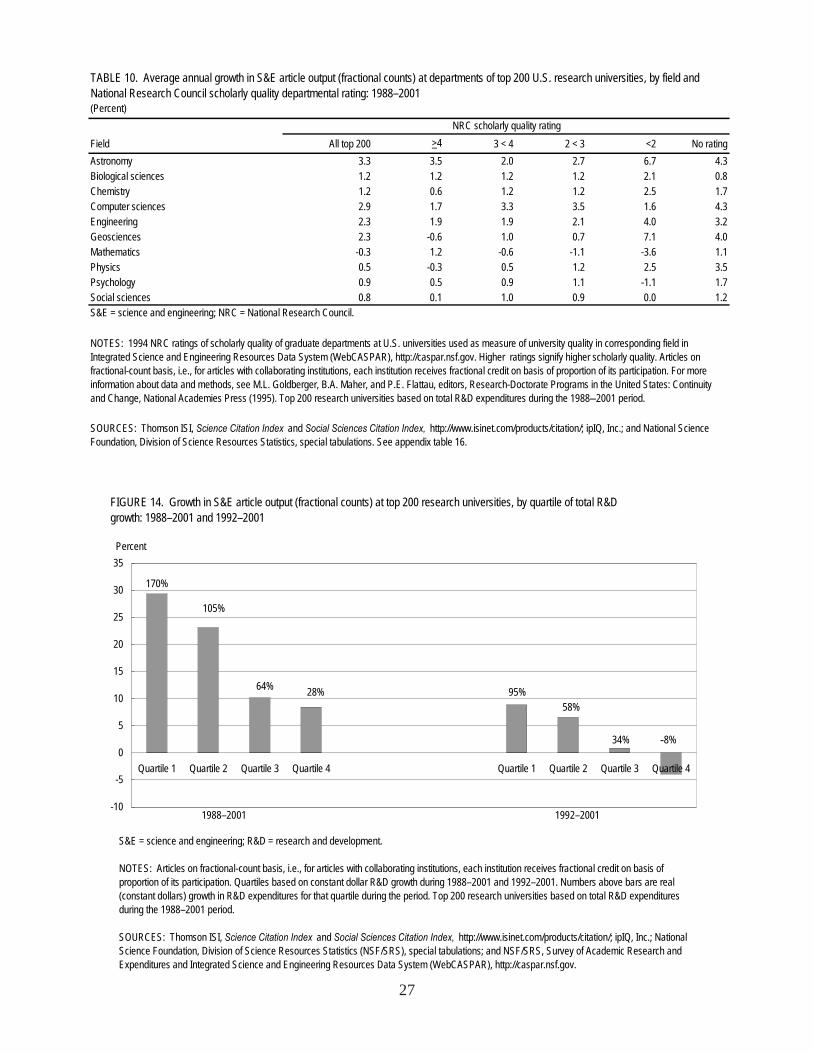
27
FIGURE 14. Growth in S&E article output (fractional counts) at top 200 research universities, by quartile of total R&D growth: 1988–2001 and 1992–2001
-10
-5
0
5
10
15
20
25
30
35
Quartile 1 Quartile 2 Quartile 3 Quartile 4 Quartile 1 Quartile 2 Quartile 3 Quartile 4
Percent
1988–2001 1992–2001
S&E = science and engineering; R&D = research and development.
NOTES: Articles on fractional-count basis, i.e., for articles with collaborating institutions, each institution receives fractional credit on basis of proportion of its participation. Quartiles based on constant dollar R&D growth during 1988–2001 and 1992–2001. Numbers above bars are real (constant dollars) growth in R&D expenditures for that quartile during the period. Top 200 research universities based on total R&D expenditures during the 1988–2001 period.
SOURCES: Thomson ISI, Science Citation Index and Social Sciences Citation Index, http://www.isinet.com/products/citation/; ipIQ, Inc.; National Science Foundation, Division of Science Resources Statistics (NSF/SRS), special tabulations; and NSF/SRS, Survey of Academic Research and Expenditures and Integrated Science and Engineering Resources Data System (WebCASPAR), http://caspar.nsf.gov.
170%
105%
64% 28% 95%58%
34% -8%
(Percent)
Field All top 200 ?4 3 < 4 2 < 3 <2 No ratingAstronomy 3.3 3.5 2.0 2.7 6.7 4.3Biological sciences 1.2 1.2 1.2 1.2 2.1 0.8Chemistry 1.2 0.6 1.2 1.2 2.5 1.7Computer sciences 2.9 1.7 3.3 3.5 1.6 4.3Engineering 2.3 1.9 1.9 2.1 4.0 3.2Geosciences 2.3 -0.6 1.0 0.7 7.1 4.0Mathematics -0.3 1.2 -0.6 -1.1 -3.6 1.1Physics 0.5 -0.3 0.5 1.2 2.5 3.5Psychology 0.9 0.5 0.9 1.1 -1.1 1.7Social sciences 0.8 0.1 1.0 0.9 0.0 1.2
TABLE 10. Average annual growth in S&E article output (fractional counts) at departments of top 200 U.S. research universities, by field and National Research Council scholarly quality departmental rating: 1988–2001
NOTES: 1994 NRC ratings of scholarly quality of graduate departments at U.S. universities used as measure of university quality in corresponding field in Integrated Science and Engineering Resources Data System (WebCASPAR), http://caspar.nsf.gov. Higher ratings signify higher scholarly quality. Articles on fractional-count basis, i.e., for articles with collaborating institutions, each institution receives fractional credit on basis of proportion of its participation. For more information about data and methods, see M.L. Goldberger, B.A. Maher, and P.E. Flattau, editors, Research-Doctorate Programs in the United States: Continuity and Change, National Academies Press (1995). Top 200 research universities based on total R&D expenditures during the 1988–2001 period.
SOURCES: Thomson ISI, Science Citation Index and Social Sciences Citation Index, http://www.isinet.com/products/citation/; ipIQ, Inc.; and National Science Foundation, Division of Science Resources Statistics, special tabulations. See appendix table 16.
S&E = science and engineering; NRC = National Research Council.
NRC scholarly quality rating>4
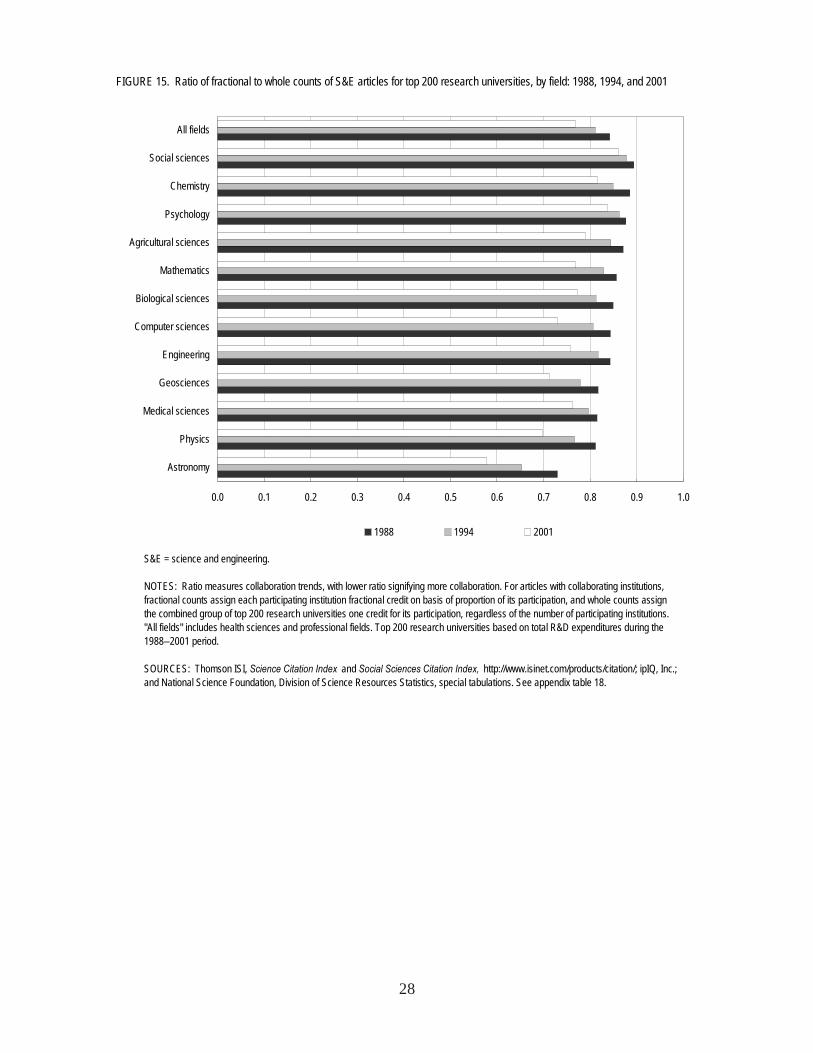
28
0.0 0.1 0.2 0.3 0.4 0.5 0.6 0.7 0.8 0.9 1.0
Astronomy
Physics
Medical sciences
Geosciences
Engineering
Computer sciences
Biological sciences
Mathematics
Agricultural sciences
Psychology
Chemistry
Social sciences
All fields
1988 1994 2001
S&E = science and engineering.
NOTES: Ratio measures collaboration trends, with lower ratio signifying more collaboration. For articles with collaborating institutions, fractional counts assign each participating institution fractional credit on basis of proportion of its participation, and whole counts assign the combined group of top 200 research universities one credit for its participation, regardless of the number of participating institutions. "All fields" includes health sciences and professional fields. Top 200 research universities based on total R&D expenditures during the 1988–2001 period.
SOURCES: Thomson ISI, Science Citation Index and Social Sciences Citation Index, http://www.isinet.com/products/citation/; ipIQ, Inc.; and National Science Foundation, Division of Science Resources Statistics, special tabulations. See appendix table 18.
FIGURE 15. Ratio of fractional to whole counts of S&E articles for top 200 research universities, by field: 1988, 1994, and 2001

29
FIGURE 16. Share of top 200 research universities with greater collaboration in 1995–2001 than in 1988–1994, by field
0 10 20 30 40 50 60 70 80 90 100
Agricultural sciences
Computer sciences
Social sciences
Engineering
Psychology
Astronomy
Chemistry
Mathematics
Physics
Medical sciences
Geosciences
Biological sciences
NOTES: Collaboration measured by ratio of fractional to whole counts, with lower ratio signifying more collaboration. For articles with collaborating institutions, fractional counts assign each participating institution fractional credit on basis of proportion of its participation, and whole counts assign each participating institution one credit for its participation. Top 200 research universities based on total R&D expenditures during the 1988–2001 period.
SOURCES: Thomson ISI, Science Citation Index and Social Sciences Citation Index, http://www.isinet.com/products/citation/; ipIQ, Inc.; and National Science Foundation, Division of Science Resources Statistics, special tabulations.
Percent

30
FIGURE 17. S&E article output (whole counts) of top 200 academic research universities, by institutional author type: 1988–2001
0
5
10
15
20
25
30
35
40
45
50
1988 1989 1990 1991 1992 1993 1994 1995 1996 1997 1998 1999 2000 2001
Articles (thousands)
S&E = science and engineering.
NOTES: Articles on whole-count basis, i.e., for articles with collaborating institutions, the combined group of top 200 research universities receives one credit for its participation, regardless of the number of participating institutions. Top 200 research universities based on total R&D expenditures during the 1988–2001 period.
SOURCES: Thomson ISI, Science Citation Index and Social Sciences Citation Index, http://www.isinet.com/products/citation/; ipIQ, Inc.; and National Science Foundation, Division of Science Resources Statistics, special tabulations. See appendix table 20.
Single department-multiple
Top 200 + other U.S. institutions
Top 200 + foreign institutions
Single author
Single institution-multiple departments
Multiple top 200 institutions
Top 200 + other U.S. and foreign institutions
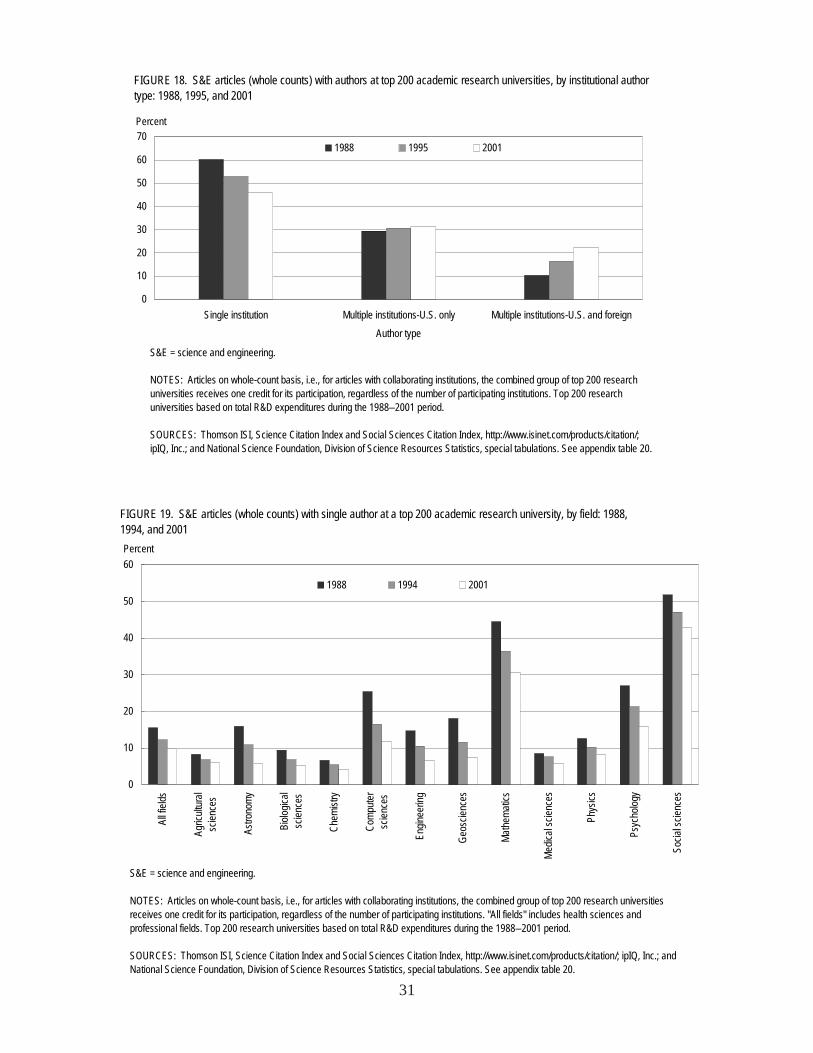
31
FIGURE 19. S&E articles (whole counts) with single author at a top 200 academic research university, by field: 1988, 1994, and 2001
0
10
20
30
40
50
60
All fi
elds
Agric
ultur
alsc
ience
s
Astro
nomy
Biolo
gical
scien
ces
Chem
istry
Comp
uter
scien
ces
Engin
eerin
g
Geos
cienc
es
Mathe
matic
s
Medic
al sc
ience
s
Phys
ics
Psyc
holog
y
Socia
l scie
nces
Percent
1988 1994 2001
S&E = science and engineering.
NOTES: Articles on whole-count basis, i.e., for articles with collaborating institutions, the combined group of top 200 research universities receives one credit for its participation, regardless of the number of participating institutions. "All fields" includes health sciences and professional fields. Top 200 research universities based on total R&D expenditures during the 1988–2001 period.
SOURCES: Thomson ISI, Science Citation Index and Social Sciences Citation Index, http://www.isinet.com/products/citation/; ipIQ, Inc.; and National Science Foundation, Division of Science Resources Statistics, special tabulations. See appendix table 20.
FIGURE 18. S&E articles (whole counts) with authors at top 200 academic research universities, by institutional author type: 1988, 1995, and 2001
0
10
20
30
40
50
60
70
Single institution Multiple institutions-U.S. only Multiple institutions-U.S. and foreignAuthor type
Percent
1988 1995 2001
S&E = science and engineering.
NOTES: Articles on whole-count basis, i.e., for articles with collaborating institutions, the combined group of top 200 research universities receives one credit for its participation, regardless of the number of participating institutions. Top 200 research universities based on total R&D expenditures during the 1988–2001 period.
SOURCES: Thomson ISI, Science Citation Index and Social Sciences Citation Index, http://www.isinet.com/products/citation/; ipIQ, Inc.; and National Science Foundation, Division of Science Resources Statistics, special tabulations. See appendix table 20.

32
FIGURE 20. S&E articles (whole counts) with at least one author at a top 200 research university and one author at a foreign institution, by field: 1988, 1994, and 2001
0
10
20
30
40
50
60Al
l field
s
Agric
ultur
alsc
ience
s
Astro
nomy
Biolo
gical
scien
ces
Chem
istry
Comp
uter
scien
ces
Engin
eerin
g
Geos
cienc
es
Mathe
matic
s
Medic
alsc
ience
s
Phys
ics
Psyc
holog
y
Socia
l scie
nces
Percent
1988 1994 2001
S&E = science and engineering.
NOTES: Articles on whole-count basis, i.e., for articles with collaborating institutions, the combined group of top 200 research universities receives one credit for its participation, regardless of the number of participating institutions. "All fields" includes health sciences and professional fields. Top 200 research universities based on total R&D expenditures during the 1988–2001 period.
SOURCES: Thomson ISI, Science Citation Index and Social Sciences Citation Index, http://www.isinet.com/products/citation/; ipIQ, Inc.; and National Science Foundation, Division of Science Resources Statistics, special tabulations. See appendix table 20.
FIGURE 21. Institutional addresses and authors per article for S&E articles (whole counts) with participation by a top 200 research university: 1988–2001
0.0
0.5
1.0
1.5
2.0
2.5
3.0
3.5
4.0
4.5
5.0
1988 1989 1990 1991 1992 1993 1994 1995 1996 1997 1998 1999 2000 2001
Authors/article
Top 200 addresses/article
Non-top 200 addresses/article
Total addresses/article
S&E = science and engineering.
NOTES: Articles on whole-count basis, i.e., for articles with collaborating institutions, the combined group of top 200 research universities receives one credit for its participation, regardless of the number of participating institutions. Top 200 research universities based on total R&D expenditures during the 1988–2001 period.
SOURCES: Thomson ISI, Science Citation Index and Social Sciences Citation Index, http://www.isinet.com/products/citation/; ipIQ, Inc.; and National Science Foundation, Division of Science Resources Statistics, special tabulations.

33
The descriptive information in this report leaves manyquestions about changing publication practices unan-swered. Some are descriptive. For example, what werethe trends in manuscript submission during the periodstudied, and how do they relate to publication trends?Although journal editors have told SRS that submissionsfrom other countries have increased more rapidly thanthose from the United States, the systematic quantitativedata needed to make international comparisons are notavailable.
Other questions relate to the causes for the observedtrends and thus go beyond the purpose and scope of thisreport. Readers seeking insight into the causes of thetrends reported here should consult the following twoSRS reports:
• The Changing Research and Publication Environ-ment in American Research Universities. This re-port, a working paper (http://www.nsf.gov/statistics/srs07204) being released concomitantly with thepresent report, summarizes the views of experiencedobservers and practitioners in research universitiesabout how the worlds of academic S&E research and
CONCLUSION
publication changed during the 15-year period between1988 and 2003. The qualitative data in this explor-atory report cannot answer these causal questions.But, in discussing some of the changes that occurredin how research is performed and disseminated, howuniversities function, and how researchers in univer-sities divide their time among their various activi-ties, this exploratory report may suggest some causalhypotheses that warrant further examination.
• U.S. Academic Scientific Publishing. Scheduled forrelease as an SRS working paper, this report will alsohave implications for causal analysis of the changingtrends in S&E article output. By examining quantifi-able relationships among publications, resource inputs,and institutional characteristics, this report will ad-dress how various institutional characteristics (e.g.,quality, R&D funding, institutional control, availabil-ity of S&E graduate students and doctorate holders,and patenting activity) relate to article production,how changes over time in these institutional character-istics relate to changes in article production, and howthe variables related to an institution’s article pro-duction differ for various S&E fields.

34

35
LIST OF APPENDIX TABLESTable Page
1. S&E article output in selected journal databases, by publishing center: 1987–2002 .........................362. S&E article output (fixed journal set, fractional counts) of major publishing centers: by field:
1988–2003 ........................................................................................................................................... 373. S&E article output (fractional counts) of major S&E publishing centers, by field: 1988–2003 ........ 414. S&E article output (whole counts) of major S&E publishing centers, by field: 1988–2003 .............455. Average annual growth rate of S&E article output (fractional and whole counts) of major
S&E publishing centers: by field: 1988–2003 ....................................................................................486. World share of top 1% cited articles (fractional counts) of major S&E publishing centers,
by field: 1992–2003 ............................................................................................................................497. World share of top 10% cited articles (fractional counts) of major S&E publishing centers,
by field: 1992–2003 ............................................................................................................................518. World share of highly influential S&E articles (fractional counts) of major S&E publishing
centers, by field: 1992–2003 ...............................................................................................................539. World share of highly influential S&E articles (whole counts) of major S&E publishing
centers, by field: 1992–2003 ...............................................................................................................5510. World share of S&E articles (fractional counts) published in highly influential journals,
by field and major S&E publishing center: 1992–2003 ......................................................................5711. Share of S&E article output classified as highly influential (fractional counts), by major
S&E publishing center and field: 1992–2003 .....................................................................................5912. U.S. academic article output, by field: 1988–2003 .............................................................................6113. U.S. article output (fractional counts), by field and sector: 1988–2003 .............................................6214. Crosswalk of WebCASPAR and ipIQ field classification .................................................................. 6515. S&E article output (fractional counts) of top 200 research universities, by Carnegie
institution type and administrative control of institution: 1988–2001 ................................................6816. S&E article output (fractional counts) of top 200 research universities, by field and National
Research Council scholarly quality rating: 1988–2001 ......................................................................6917. Growth in R&D and article output (fractional counts) of top 200 research universities,
by R&D quartile: 1988–2001 and 1992–2001 ....................................................................................7118. S&E article output of top 200 research universities, by field: 1988–2001 .........................................7619. Ratio of fractional to whole counts of S&E articles for top 200 research universities,
by institution: 1988–2001 ................................................................................................................... 7720. S&E articles output (whole counts) of top 200 research universities, by field and
institutional author type: 1988–2001 ..................................................................................................82

Database and publishing center 1987 1988 1989 1990 1991 1992 1993 1994 1995 1996 1997 1998 1999 2000 2001 2002
Chemical Abstract Service
United States 107,620 106,654 110,485 110,006 132,256 117,838 126,207 158,188 152,191 160,266 151,577 136,617 141,286 136,339 139,284 na
Selected EU-15 countries 81,275 83,333 84,717 83,079 100,711 95,910 107,165 121,197 134,403 139,931 135,898 128,852 133,806 127,821 134,705 na
France 16,236 16,785 16,756 16,398 19,178 19,080 21,163 23,852 26,153 26,846 26,817 24,810 25,602 23,917 24,726 na
Germany 23,622 24,413 24,673 24,420 31,468 26,699 33,435 35,933 43,130 43,671 44,917 43,781 44,146 40,242 42,270 na
Italy 8,702 9,292 9,306 9,030 10,758 11,362 11,858 13,980 15,338 16,563 11,362 11,858 13,980 15,338 16,563 na
Netherlands 5,508 5,686 5,844 5,810 6,960 7,050 7,295 8,514 8,633 9,097 8,898 8,565 8,389 7,936 8,552 na
Spain 5,237 5,407 5,450 5,845 6,546 7,078 7,627 9,130 10,125 10,744 11,484 10,543 11,798 11,521 12,296 na
United Kingdom 21,970 21,750 22,688 21,576 25,801 24,641 25,787 29,788 31,024 33,010 32,420 29,295 29,891 28,867 30,298 na
Japan 45,026 44,635 47,056 47,646 56,637 56,958 59,582 69,116 72,285 72,544 76,553 75,684 79,939 76,928 79,213 na
East Asia-4 16,699 17,673 19,543 22,217 24,364 27,397 27,819 44,967 47,922 49,112 56,102 61,289 71,704 73,413 80,496 na
All other 135,846 137,390 135,357 131,997 139,672 132,147 127,963 149,046 156,154 157,254 165,400 156,567 164,357 158,968 172,981 na
Compendex
United States na 17,148 37,289 39,573 40,260 33,960 59,085 69,422 60,568 66,487 73,820 69,558 63,109 59,480 65,430 28,102
All other na 35,192 69,045 66,206 79,965 66,033 105,198 138,083 115,930 145,504 178,797 175,645 159,152 160,261 194,740 93,068
Inspec
United States na 73,452 73,968 77,141 77,108 76,835 79,695 83,028 84,190 85,100 83,571 81,945 80,054 77,117 71,568 na
Selected EU-15 countries na 47,980 47,728 51,160 51,369 52,599 56,095 61,600 69,666 73,438 74,051 73,589 73,183 71,040 64,938 na
Germany na 14,936 14,597 16,189 15,938 15,884 16,805 18,112 22,142 23,620 23,397 24,068 23,012 21,723 19,631 na
United Kingdom na 15,366 14,912 15,726 15,488 15,267 16,353 18,104 19,511 19,633 19,370 18,492 18,751 18,086 15,519 na
France na 10,116 10,307 10,473 10,593 11,462 12,337 13,373 14,750 15,304 15,679 15,128 14,849 14,663 13,384 na
Italy na 5,618 5,986 6,474 6,943 7,262 7,357 8,483 9,228 10,247 10,515 10,348 10,598 10,774 10,469 na
Spain na 1,944 1,926 2,298 2,407 2,724 3,243 3,528 4,035 4,634 5,090 5,553 5,973 5,794 5,935 na
Japan na 20,608 21,868 23,599 23,375 24,270 25,588 27,511 29,950 32,809 32,372 33,534 35,564 34,879 32,647 na
China na 6,820 6,790 7,131 7,019 7,373 8,327 9,126 9,847 12,715 13,692 16,212 18,009 25,980 27,347 na
All other na 97,847 97,411 98,549 91,318 91,052 89,992 98,409 106,297 116,280 122,094 125,867 125,451 124,428 119,292 na
PASCAL
United States na na 156,979 168,348 180,495 185,087 145,502 124,853 135,786 146,848 152,192 149,478 144,943 na na na
All other na na 331,365 360,108 394,411 395,267 379,007 335,733 340,973 352,103 358,500 359,277 355,419 na na na
APPENDIX TABLE 1. S&E article output in selected journal databases, by publishing center: 1987–2002
na = not available.
S&E = science and engineering; EU = European Union; Inspec = Information Service for Physics, Electronics and Computing.
NOTES: Compendex is a comprehensive database of engineering scholarly journals, trade magazines, and conference proceedings; PASCAL, a multilingual, multidisciplinary database, covers core scientific
literature in science, technology, and medicine, with special emphasis on European literature; Inspec is a comprehensive database covering physics, electronics, and computer sciences. Articles assigned to
publishing center or country on basis of institutional address of first author listed on article. Data not available for all years for some databases. East Asia-4 includes China, Singapore, South Korea, and Taiwan.
China includes Hong Kong.
SOURCES: American Chemical Society (ACS), Chemical Abstract Service, http://www.cas.org; Elsevier Engineering Information, Inc., Compendex, http://www.ei.org/compendex.html; Inspec,
http://www.ei.org/inspec.html; and Institut de l'Information Scientifique et Technique du Centre National de la Recherche Scientifique (INIST-CNRS), PASCAL, http://www.inist.fr/en/PRODUITS/pascal.php (to
search database: http://stneasy.cas.org).
36

APPENDIX TABLE 2. S&E article output (fixed journal set, fractional counts) of major S&E publishing centers, by field: 1988–2003
Field and publishing center 1988 1989 1990 1991 1992 1993 1994 1995 1996 1997 1998 1999 2000 2001 2002 2003
All fields
All publishing centers 454,627 480,966 485,626 487,942 508,926 496,449 512,235 517,323 520,192 514,260 525,227 529,575 519,350 523,837 512,662 550,636
United States 172,288 180,448 181,322 182,254 183,129 180,186 178,665 179,327 174,073 167,166 165,673 163,727 159,089 160,901 154,268 165,607
EU-15 131,311 140,516 142,415 144,666 154,097 152,489 162,140 165,002 169,336 169,081 174,383 174,680 170,980 170,119 164,312 173,970
Japan 33,622 35,589 36,821 37,457 41,281 40,108 42,454 42,618 44,950 44,154 47,201 47,855 46,481 47,492 45,614 48,526
East Asia-4 7,093 8,347 9,595 10,109 12,038 13,144 14,751 17,108 18,968 22,046 24,351 27,501 29,646 33,903 35,865 41,514
All other 110,314 116,066 115,473 113,456 118,381 110,522 114,225 113,269 112,865 111,813 113,619 115,813 113,154 111,422 112,602 121,018
Clinical medicine
All publishing centers 133,860 141,971 142,060 142,707 146,427 143,779 148,053 146,992 148,803 148,291 150,553 153,602 149,061 147,781 142,866 152,672
United States 53,512 55,592 55,516 55,428 55,516 55,794 55,362 55,535 54,220 52,948 52,421 52,631 50,186 50,569 47,782 51,278
EU-15 45,555 48,928 49,395 49,115 51,780 50,517 53,159 52,941 54,291 54,758 55,612 56,339 54,822 53,494 51,374 54,319
Japan 8,700 10,038 9,848 10,756 11,811 11,764 12,312 12,139 13,347 13,203 14,094 14,339 13,850 13,630 12,918 13,043
East Asia-4 1,295 1,523 1,797 1,692 2,036 2,054 2,403 2,618 3,080 3,248 3,866 4,283 4,537 5,264 5,490 6,533
All other 24,798 25,889 25,505 25,716 25,283 23,650 24,818 23,758 23,865 24,134 24,560 26,010 25,666 24,825 25,301 27,499
Biomedical research
All publishing centers 68,568 73,462 73,613 74,529 77,302 75,817 76,958 78,543 77,511 76,448 79,115 77,511 76,055 76,471 72,845 78,173
United States 26,552 28,401 28,536 28,935 29,810 29,688 29,730 30,408 29,454 28,605 28,597 27,818 27,667 28,160 26,422 28,037
EU-15 19,932 21,705 21,975 22,533 23,697 23,868 24,830 25,529 25,519 24,940 25,902 25,730 24,265 24,593 23,175 24,395
Japan 5,017 5,564 5,721 5,847 6,339 6,318 6,469 6,683 6,366 6,614 7,085 6,960 6,605 6,830 6,480 6,706
East Asia-4 512 523 523 654 794 872 930 1,134 1,393 1,491 2,138 2,449 2,716 3,122 3,245 4,023
All other 16,555 17,269 16,857 16,559 16,662 15,072 14,999 14,789 14,778 14,797 15,394 14,553 14,802 13,766 13,522 15,012
Biology
All publishing centers 34,571 36,281 37,860 36,608 37,089 36,270 36,767 37,445 36,690 37,227 37,893 37,301 38,806 37,660 39,681 41,468
United States 12,730 13,421 13,922 13,664 12,885 12,061 12,134 11,857 11,266 11,050 11,057 10,059 10,970 10,864 11,416 11,824
EU-15 8,720 9,387 9,903 9,391 10,146 10,023 10,467 11,261 11,075 11,689 11,808 11,877 12,180 11,384 11,859 12,203
Japan 2,349 2,415 2,514 2,640 2,607 2,609 2,754 2,706 2,707 2,466 2,735 2,802 2,859 2,878 2,832 3,096
East Asia-4 315 383 412 429 497 549 561 722 733 969 1,061 1,207 1,206 1,404 1,718 1,939
All other 10,457 10,676 11,110 10,483 10,954 11,028 10,851 10,899 10,909 11,053 11,231 11,356 11,592 11,130 11,855 12,405
Chemistry
All publishing centers 56,707 58,809 60,507 59,926 62,502 61,141 63,263 64,365 65,519 64,356 65,944 66,347 64,106 64,489 62,864 68,063
United States 13,059 13,172 13,483 14,018 13,779 14,024 13,445 13,709 13,941 13,082 12,816 12,458 12,308 12,166 11,761 13,131
EU-15 17,453 17,693 18,243 18,472 19,236 19,880 20,689 20,962 21,476 21,350 21,903 21,537 20,183 20,315 19,162 20,049
Japan 6,052 6,070 6,808 6,435 6,802 6,320 6,836 6,967 7,056 6,898 7,573 7,670 7,546 7,244 6,909 7,268
East Asia-4 1,042 1,404 1,824 2,006 2,339 2,688 2,919 3,608 3,964 4,651 5,188 5,901 6,440 7,237 7,606 8,658
All other 19,101 20,469 20,148 18,995 20,346 18,228 19,373 19,119 19,083 18,375 18,464 18,782 17,630 17,527 17,426 18,957
Physics
All publishing centers 61,760 65,482 66,262 68,203 73,950 70,244 76,879 77,449 78,799 77,970 78,427 80,726 77,992 79,226 79,881 85,958
United States 17,883 18,923 18,907 20,098 19,632 18,946 19,652 18,815 17,992 17,146 16,945 17,017 15,965 16,376 15,809 17,115
EU-15 17,252 18,496 18,541 20,016 21,725 20,953 24,204 24,496 25,749 25,309 25,815 26,094 25,679 25,086 25,340 26,628
Japan 6,505 6,500 6,905 6,581 8,341 7,657 8,445 8,615 9,730 9,378 9,241 10,148 9,747 10,205 10,095 11,446
East Asia-4 1,999 2,176 2,474 2,495 3,163 3,355 4,016 4,592 4,643 5,829 5,648 6,469 6,653 7,725 8,394 9,387
All other 18,121 19,386 19,434 19,013 21,089 19,333 20,562 20,930 20,685 20,308 20,777 20,998 19,948 19,834 20,244 21,383
Number
37

APPENDIX TABLE 2. S&E article output (fixed journal set, fractional counts) of major S&E publishing centers, by field: 1988–2003
Field and publishing center 1988 1989 1990 1991 1992 1993 1994 1995 1996 1997 1998 1999 2000 2001 2002 2003
Earth/space sciences
All publishing centers 18,815 21,086 22,036 22,595 24,074 23,265 25,441 25,742 27,825 26,612 26,875 29,014 28,212 29,856 29,023 32,402
United States 7,951 8,422 8,658 8,896 9,070 9,239 9,656 10,000 10,156 9,567 9,145 10,101 9,522 9,796 9,209 10,858
EU-15 4,835 5,773 6,021 6,190 6,836 6,611 7,641 7,785 9,208 8,847 9,345 9,704 9,666 10,313 9,934 10,783
Japan 636 773 782 780 858 832 977 1,010 1,061 1,014 1,277 1,208 1,442 1,509 1,440 1,687
East Asia-4 241 229 249 385 350 341 441 480 689 909 940 1,005 1,185 1,539 1,654 1,897
All other 5,152 5,889 6,327 6,345 6,961 6,242 6,725 6,466 6,711 6,275 6,168 6,995 6,396 6,699 6,786 7,176
Engineering/technology
All publishing centers 29,405 30,162 31,733 32,538 35,653 34,896 35,229 36,234 35,346 35,845 37,564 36,137 36,381 38,987 37,410 40,410
United States 10,978 11,277 12,077 11,719 12,894 11,825 11,897 11,877 11,110 10,533 10,385 9,550 9,176 9,743 8,721 9,623
EU-15 7,143 7,500 7,861 8,325 9,111 8,981 9,323 9,609 9,336 9,733 10,606 9,984 10,166 11,008 10,324 10,825
Japan 3,500 3,288 3,469 3,536 3,693 3,831 3,793 3,697 3,815 3,721 4,207 3,769 3,463 4,143 3,987 4,207
East Asia-4 1,121 1,473 1,626 1,762 2,094 2,491 2,634 2,945 3,295 3,657 4,171 4,687 5,230 5,669 5,902 6,810
All other 6,664 6,624 6,699 7,197 7,860 7,768 7,581 8,107 7,790 8,200 8,195 8,147 8,346 8,425 8,476 8,945
Mathematics
All publishing centers 9,624 10,128 7,933 8,113 9,212 8,927 8,663 8,738 9,180 8,830 10,172 10,340 10,553 10,997 10,251 11,495
United States 3,856 3,972 3,239 3,329 3,429 3,394 3,185 3,013 3,076 2,788 3,072 3,017 2,984 2,834 2,771 2,895
EU-15 2,770 3,083 2,275 2,397 2,903 2,890 2,929 3,144 3,175 3,197 3,722 3,880 3,893 4,086 3,761 4,271
Japan 484 483 301 390 358 335 355 301 382 355 489 470 494 594 462 596
East Asia-4 252 318 286 310 409 405 410 458 565 636 704 771 919 1,025 962 1,203
All other 2,263 2,273 1,831 1,687 2,112 1,903 1,784 1,822 1,982 1,853 2,185 2,202 2,263 2,459 2,294 2,531
Psychology
All publishing centers 11,282 11,289 11,529 10,931 11,206 10,529 10,774 11,300 10,875 10,424 10,705 10,502 10,191 10,489 10,279 10,873
United States 6,900 6,777 6,975 6,526 6,784 6,080 5,968 6,367 5,959 5,705 5,550 5,514 5,130 5,329 5,326 5,442
EU-15 2,085 2,200 2,257 2,180 2,277 2,289 2,431 2,543 2,587 2,568 2,833 2,761 2,771 2,893 2,733 3,078
Japan 168 174 190 208 192 188 234 228 253 219 225 212 211 199 204 168
East Asia-4 40 64 88 47 63 55 66 83 93 96 119 118 117 139 131 154
All other 2,089 2,074 2,019 1,970 1,890 1,917 2,075 2,079 1,982 1,836 1,979 1,897 1,962 1,929 1,884 2,031
Social sciences
All publishing centers 15,167 16,147 16,226 16,002 16,013 15,908 15,192 15,047 14,854 14,389 14,154 14,179 14,047 14,287 13,534 14,615
United States 8,303 9,041 8,917 8,682 8,535 8,389 7,719 7,704 7,383 7,047 6,984 6,917 6,612 6,826 6,369 6,778
EU-15 3,383 3,489 3,547 3,578 3,887 3,974 3,784 3,880 4,024 3,947 4,047 3,904 4,325 4,026 3,913 4,224
Japan 162 191 215 198 222 181 207 191 164 198 205 186 190 185 190 214
East Asia-4 188 154 186 222 185 192 213 248 263 291 242 291 305 378 329 409
All other 3,130 3,273 3,360 3,322 3,183 3,172 3,270 3,024 3,019 2,906 2,676 2,882 2,615 2,871 2,733 2,989
All fields
All publishing centers 100.0 100.0 100.0 100.0 100.0 100.0 100.0 100.0 100.0 100.0 100.0 100.0 100.0 100.0 100.0 100.0
United States 37.9 37.5 37.3 37.4 36.0 36.3 34.9 34.7 33.5 32.5 31.5 30.9 30.6 30.7 30.1 30.1
EU-15 28.9 29.2 29.3 29.6 30.3 30.7 31.7 31.9 32.6 32.9 33.2 33.0 32.9 32.5 32.1 31.6
Japan 7.4 7.4 7.6 7.7 8.1 8.1 8.3 8.2 8.6 8.6 9.0 9.0 8.9 9.1 8.9 8.8
East Asia-4 1.6 1.7 2.0 2.1 2.4 2.6 2.9 3.3 3.6 4.3 4.6 5.2 5.7 6.5 7.0 7.5
All other 24.3 24.1 23.8 23.3 23.3 22.3 22.3 21.9 21.7 21.7 21.6 21.9 21.8 21.3 22.0 22.0
Percent distribution
38

APPENDIX TABLE 2. S&E article output (fixed journal set, fractional counts) of major S&E publishing centers, by field: 1988–2003
Field and publishing center 1988 1989 1990 1991 1992 1993 1994 1995 1996 1997 1998 1999 2000 2001 2002 2003
Clinical medicine
All publishing centers 100.0 100.0 100.0 100.0 100.0 100.0 100.0 100.0 100.0 100.0 100.0 100.0 100.0 100.0 100.0 100.0
United States 40.0 39.2 39.1 38.8 37.9 38.8 37.4 37.8 36.4 35.7 34.8 34.3 33.7 34.2 33.4 33.6
EU-15 34.0 34.5 34.8 34.4 35.4 35.1 35.9 36.0 36.5 36.9 36.9 36.7 36.8 36.2 36.0 35.6
Japan 6.5 7.1 6.9 7.5 8.1 8.2 8.3 8.3 9.0 8.9 9.4 9.3 9.3 9.2 9.0 8.5
East Asia-4 1.0 1.1 1.3 1.2 1.4 1.4 1.6 1.8 2.1 2.2 2.6 2.8 3.0 3.6 3.8 4.3
All other 18.5 18.2 18.0 18.0 17.3 16.4 16.8 16.2 16.0 16.3 16.3 16.9 17.2 16.8 17.7 18.0
Biomedical research
All publishing centers 100.0 100.0 100.0 100.0 100.0 100.0 100.0 100.0 100.0 100.0 100.0 100.0 100.0 100.0 100.0 100.0
United States 38.7 38.7 38.8 38.8 38.6 39.2 38.6 38.7 38.0 37.4 36.1 35.9 36.4 36.8 36.3 35.9
EU-15 29.1 29.5 29.9 30.2 30.7 31.5 32.3 32.5 32.9 32.6 32.7 33.2 31.9 32.2 31.8 31.2
Japan 7.3 7.6 7.8 7.8 8.2 8.3 8.4 8.5 8.2 8.7 9.0 9.0 8.7 8.9 8.9 8.6
East Asia-4 0.7 0.7 0.7 0.9 1.0 1.1 1.2 1.4 1.8 2.0 2.7 3.2 3.6 4.1 4.5 5.1
All other 24.1 23.5 22.9 22.2 21.6 19.9 19.5 18.8 19.1 19.4 19.5 18.8 19.5 18.0 18.6 19.2
Biology
All publishing centers 100.0 100.0 100.0 100.0 100.0 100.0 100.0 100.0 100.0 100.0 100.0 100.0 100.0 100.0 100.0 100.0
United States 36.8 37.0 36.8 37.3 34.7 33.3 33.0 31.7 30.7 29.7 29.2 27.0 28.3 28.8 28.8 28.5
EU-15 25.2 25.9 26.2 25.7 27.4 27.6 28.5 30.1 30.2 31.4 31.2 31.8 31.4 30.2 29.9 29.4
Japan 6.8 6.7 6.6 7.2 7.0 7.2 7.5 7.2 7.4 6.6 7.2 7.5 7.4 7.6 7.1 7.5
East Asia-4 0.9 1.1 1.1 1.2 1.3 1.5 1.5 1.9 2.0 2.6 2.8 3.2 3.1 3.7 4.3 4.7
All other 30.2 29.4 29.3 28.6 29.5 30.4 29.5 29.1 29.7 29.7 29.6 30.4 29.9 29.6 29.9 29.9
Chemistry
All publishing centers 100.0 100.0 100.0 100.0 100.0 100.0 100.0 100.0 100.0 100.0 100.0 100.0 100.0 100.0 100.0 100.0
United States 23.0 22.4 22.3 23.4 22.0 22.9 21.3 21.3 21.3 20.3 19.4 18.8 19.2 18.9 18.7 19.3
EU-15 30.8 30.1 30.2 30.8 30.8 32.5 32.7 32.6 32.8 33.2 33.2 32.5 31.5 31.5 30.5 29.5
Japan 10.7 10.3 11.3 10.7 10.9 10.3 10.8 10.8 10.8 10.7 11.5 11.6 11.8 11.2 11.0 10.7
East Asia-4 1.8 2.4 3.0 3.3 3.7 4.4 4.6 5.6 6.0 7.2 7.9 8.9 10.0 11.2 12.1 12.7
All other 33.7 34.8 33.3 31.7 32.6 29.8 30.6 29.7 29.1 28.6 28.0 28.3 27.5 27.2 27.7 27.9
Physics
All publishing centers 100.0 100.0 100.0 100.0 100.0 100.0 100.0 100.0 100.0 100.0 100.0 100.0 100.0 100.0 100.0 100.0
United States 29.0 28.9 28.5 29.5 26.5 27.0 25.6 24.3 22.8 22.0 21.6 21.1 20.5 20.7 19.8 19.9
EU-15 27.9 28.2 28.0 29.3 29.4 29.8 31.5 31.6 32.7 32.5 32.9 32.3 32.9 31.7 31.7 31.0
Japan 10.5 9.9 10.4 9.6 11.3 10.9 11.0 11.1 12.3 12.0 11.8 12.6 12.5 12.9 12.6 13.3
East Asia-4 3.2 3.3 3.7 3.7 4.3 4.8 5.2 5.9 5.9 7.5 7.2 8.0 8.5 9.8 10.5 10.9
All other 29.3 29.6 29.3 27.9 28.5 27.5 26.7 27.0 26.3 26.0 26.5 26.0 25.6 25.0 25.3 24.9
Earth/space sciences
All publishing centers 100.0 100.0 100.0 100.0 100.0 100.0 100.0 100.0 100.0 100.0 100.0 100.0 100.0 100.0 100.0 100.0
United States 42.3 39.9 39.3 39.4 37.7 39.7 38.0 38.8 36.5 36.0 34.0 34.8 33.8 32.8 31.7 33.5
EU-15 25.7 27.4 27.3 27.4 28.4 28.4 30.0 30.2 33.1 33.2 34.8 33.4 34.3 34.5 34.2 33.3
Japan 3.4 3.7 3.5 3.5 3.6 3.6 3.8 3.9 3.8 3.8 4.8 4.2 5.1 5.1 5.0 5.2
East Asia-4 1.3 1.1 1.1 1.7 1.5 1.5 1.7 1.9 2.5 3.4 3.5 3.5 4.2 5.2 5.7 5.9
All other 27.4 27.9 28.7 28.1 28.9 26.8 26.4 25.1 24.1 23.6 23.0 24.1 22.7 22.4 23.4 22.1
39

APPENDIX TABLE 2. S&E article output (fixed journal set, fractional counts) of major S&E publishing centers, by field: 1988–2003
Field and publishing center 1988 1989 1990 1991 1992 1993 1994 1995 1996 1997 1998 1999 2000 2001 2002 2003
Engineering/technology
All publishing centers 100.0 100.0 100.0 100.0 100.0 100.0 100.0 100.0 100.0 100.0 100.0 100.0 100.0 100.0 100.0 100.0
United States 37.3 37.4 38.1 36.0 36.2 33.9 33.8 32.8 31.4 29.4 27.6 26.4 25.2 25.0 23.3 23.8
EU-15 24.3 24.9 24.8 25.6 25.6 25.7 26.5 26.5 26.4 27.2 28.2 27.6 27.9 28.2 27.6 26.8
Japan 11.9 10.9 10.9 10.9 10.4 11.0 10.8 10.2 10.8 10.4 11.2 10.4 9.5 10.6 10.7 10.4
East Asia-4 3.8 4.9 5.1 5.4 5.9 7.1 7.5 8.1 9.3 10.2 11.1 13.0 14.4 14.5 15.8 16.9
All other 22.7 22.0 21.1 22.1 22.0 22.3 21.5 22.4 22.0 22.9 21.8 22.5 22.9 21.6 22.7 22.1
Mathematics
All publishing centers 100.0 100.0 100.0 100.0 100.0 100.0 100.0 100.0 100.0 100.0 100.0 100.0 100.0 100.0 100.0 100.0
United States 40.1 39.2 40.8 41.0 37.2 38.0 36.8 34.5 33.5 31.6 30.2 29.2 28.3 25.8 27.0 25.2
EU-15 28.8 30.4 28.7 29.5 31.5 32.4 33.8 36.0 34.6 36.2 36.6 37.5 36.9 37.2 36.7 37.2
Japan 5.0 4.8 3.8 4.8 3.9 3.8 4.1 3.4 4.2 4.0 4.8 4.5 4.7 5.4 4.5 5.2
East Asia-4 2.6 3.1 3.6 3.8 4.4 4.5 4.7 5.2 6.2 7.2 6.9 7.5 8.7 9.3 9.4 10.5
All other 23.5 22.4 23.1 20.8 22.9 21.3 20.6 20.8 21.6 21.0 21.5 21.3 21.4 22.4 22.4 22.0
Psychology
All publishing centers 100.0 100.0 100.0 100.0 100.0 100.0 100.0 100.0 100.0 100.0 100.0 100.0 100.0 100.0 100.0 100.0
United States 61.2 60.0 60.5 59.7 60.5 57.7 55.4 56.3 54.8 54.7 51.8 52.5 50.3 50.8 51.8 50.0
EU-15 18.5 19.5 19.6 19.9 20.3 21.7 22.6 22.5 23.8 24.6 26.5 26.3 27.2 27.6 26.6 28.3
Japan 1.5 1.5 1.6 1.9 1.7 1.8 2.2 2.0 2.3 2.1 2.1 2.0 2.1 1.9 2.0 1.5
East Asia-4 0.4 0.6 0.8 0.4 0.6 0.5 0.6 0.7 0.9 0.9 1.1 1.1 1.2 1.3 1.3 1.4
All other 18.5 18.4 17.5 18.0 16.9 18.2 19.3 18.4 18.2 17.6 18.5 18.1 19.3 18.4 18.3 18.7
Social sciences
All publishing centers 100.0 100.0 100.0 100.0 100.0 100.0 100.0 100.0 100.0 100.0 100.0 100.0 100.0 100.0 100.0 100.0
United States 54.7 56.0 55.0 54.3 53.3 52.7 50.8 51.2 49.7 49.0 49.3 48.8 47.1 47.8 47.1 46.4
EU-15 22.3 21.6 21.9 22.4 24.3 25.0 24.9 25.8 27.1 27.4 28.6 27.5 30.8 28.2 28.9 28.9
Japan 1.1 1.2 1.3 1.2 1.4 1.1 1.4 1.3 1.1 1.4 1.5 1.3 1.4 1.3 1.4 1.5
East Asia-4 1.2 1.0 1.1 1.4 1.2 1.2 1.4 1.6 1.8 2.0 1.7 2.1 2.2 2.6 2.4 2.8
All other 20.6 20.3 20.7 20.8 19.9 19.9 21.5 20.1 20.3 20.2 18.9 20.3 18.6 20.1 20.2 20.5
S&E = science and engineering; EU = European Union.
NOTES: Data drawn from fixed set of journals restricted to those in Thomson ISI data set existing in 1985. Articles on fractional-count basis, i.e., for articles with collaborating institutions from multiple publishing centers, each publishing
center receives fractional credit on basis of proportion of its participating institutions."All fields" includes health sciences and professional fields. Biology includes agricultural sciences. Engineering/technology includes computer sciences.
East Asia-4 includes China, Singapore, South Korea, and Taiwan. China includes Hong Kong.
SOURCES: Thomson ISI, Science Citation Index and Social Sciences Citation Index, http://www.isinet.com/products/citation/; ipIQ, Inc.; and National Science Foundation, Division of Science Resources Statistics, special tabulations.
40

APPENDIX TABLE 3. S&E article output (fractional counts) of major S&E publishing centers, by field: 1988–2003
Field and publishing center 1988 1989 1990 1991 1992 1993 1994 1995 1996 1997 1998 1999 2000 2001 2002 2003
All fields
All publishing centers 466,419 497,102 508,795 515,530 547,617 540,491 567,204 580,809 593,568 594,467 617,762 632,059 632,781 649,795 641,388 698,726
United States 177,662 187,224 191,559 194,015 198,864 197,397 199,769 202,887 201,798 197,531 197,890 198,524 196,221 200,870 195,792 211,233
EU-15 134,551 145,337 149,032 152,761 166,230 166,540 179,710 185,842 193,172 195,060 205,479 209,006 208,128 211,177 204,769 220,002
Japan 34,435 36,569 38,570 39,590 44,143 43,339 46,692 47,603 50,392 50,171 54,658 56,134 55,413 57,420 55,085 60,067
East Asia-4 7,214 8,687 10,146 10,638 12,807 14,297 16,220 19,097 21,675 25,381 28,980 33,405 36,837 42,699 46,132 55,324
All other 112,557 119,285 119,488 118,526 125,572 118,918 124,814 125,380 126,532 126,324 130,755 134,990 136,182 137,629 139,610 152,100
Clinical medicine
All publishing centers 136,878 147,368 149,656 152,165 160,471 158,323 167,091 168,009 172,482 174,852 180,416 183,822 182,033 184,825 179,724 194,937
United States 55,016 58,133 58,850 59,488 61,097 61,312 62,610 63,367 63,057 62,676 63,077 63,190 61,745 63,709 60,785 65,933
EU-15 46,451 50,722 52,030 52,436 57,239 56,198 60,497 61,153 63,483 64,926 67,329 68,068 67,468 67,204 64,900 69,558
Japan 8,820 10,219 10,289 11,364 12,565 12,775 13,833 13,697 15,004 15,182 16,366 16,618 16,435 16,502 15,744 16,309
East Asia-4 1,313 1,560 1,856 1,763 2,166 2,215 2,588 2,893 3,570 3,886 4,571 5,107 5,500 6,531 6,816 8,253
All other 25,278 26,734 26,632 27,115 27,404 25,822 27,563 26,899 27,368 28,182 29,073 30,838 30,886 30,878 31,480 34,883
Biomedical research
All publishing centers 70,723 76,228 78,150 79,594 84,192 83,616 86,926 89,424 88,371 88,553 92,429 91,704 91,463 92,078 88,735 95,633
United States 27,455 29,427 30,703 31,177 32,906 33,117 33,750 35,048 33,991 33,661 33,978 33,423 33,482 34,041 32,407 34,427
EU-15 20,599 22,647 23,322 24,140 25,772 26,342 28,052 29,216 29,142 29,034 30,530 30,640 29,388 29,774 28,366 30,138
Japan 5,219 5,794 5,990 6,170 6,791 6,824 7,070 7,352 7,054 7,424 7,997 7,962 7,756 8,016 7,638 7,996
East Asia-4 521 536 542 680 856 937 1,017 1,295 1,629 1,759 2,546 2,957 3,306 3,838 4,099 5,070
All other 16,929 17,824 17,593 17,427 17,866 16,396 17,037 16,512 16,555 16,675 17,377 16,723 17,531 16,409 16,225 18,002
Biology
All publishing centers 35,167 36,992 38,598 37,562 38,768 38,395 39,224 40,530 40,325 40,785 42,283 42,075 44,973 44,292 46,745 49,589
United States 12,862 13,544 14,028 13,898 13,366 12,671 12,845 12,664 12,310 12,027 12,126 11,271 12,496 12,499 13,122 13,855
EU-15 8,968 9,673 10,215 9,734 10,701 10,733 11,266 12,223 12,183 12,766 13,295 13,442 14,304 13,805 14,270 14,956
Japan 2,388 2,457 2,565 2,673 2,699 2,779 3,041 3,144 3,153 2,917 3,250 3,311 3,427 3,490 3,455 3,764
East Asia-4 320 388 422 447 527 593 598 789 795 1,053 1,188 1,379 1,402 1,641 1,995 2,331
All other 10,629 10,929 11,369 10,810 11,474 11,618 11,474 11,709 11,883 12,023 12,424 12,672 13,343 12,858 13,902 14,682
Chemistry
All publishing centers 57,434 60,056 62,550 62,686 66,182 65,768 67,767 70,419 71,618 70,501 74,628 76,688 75,724 77,051 76,419 83,483
United States 13,186 13,398 13,990 14,681 14,647 15,089 14,577 14,915 15,219 14,375 14,414 14,491 14,560 14,342 14,043 15,763
EU-15 17,677 18,143 18,833 19,376 20,418 21,397 22,194 23,162 23,862 23,614 25,165 25,299 23,944 24,018 23,076 24,363
Japan 6,083 6,143 7,106 6,806 7,273 6,989 7,423 7,842 7,841 7,709 8,828 8,853 8,698 8,544 8,153 8,837
East Asia-4 1,054 1,446 1,885 2,081 2,476 2,882 3,102 3,906 4,286 5,008 5,822 7,105 7,804 8,909 9,752 11,181
All other 19,434 20,925 20,735 19,741 21,367 19,412 20,472 20,593 20,411 19,795 20,399 20,940 20,718 21,238 21,395 23,339
Physics
All publishing centers 62,246 66,224 67,313 69,627 76,207 73,325 80,854 82,111 84,021 82,859 85,010 87,302 84,367 86,758 88,412 96,953
United States 18,023 19,067 19,196 20,515 20,158 19,602 20,427 19,709 18,906 18,048 17,966 18,074 16,897 17,385 17,301 18,657
EU-15 17,423 18,736 18,806 20,391 22,480 21,859 25,411 25,704 27,127 26,621 27,523 27,979 27,292 27,206 27,438 29,228
Japan 6,568 6,573 7,049 6,843 8,705 7,968 8,805 9,074 10,287 9,778 10,030 10,777 10,430 10,978 10,866 12,507
East Asia-4 2,013 2,310 2,692 2,650 3,299 3,730 4,565 5,213 5,474 6,763 6,979 7,640 8,015 9,221 10,199 12,455
All other 18,218 19,538 19,570 19,228 21,564 20,166 21,646 22,412 22,227 21,649 22,513 22,832 21,734 21,966 22,608 24,105
Number
41
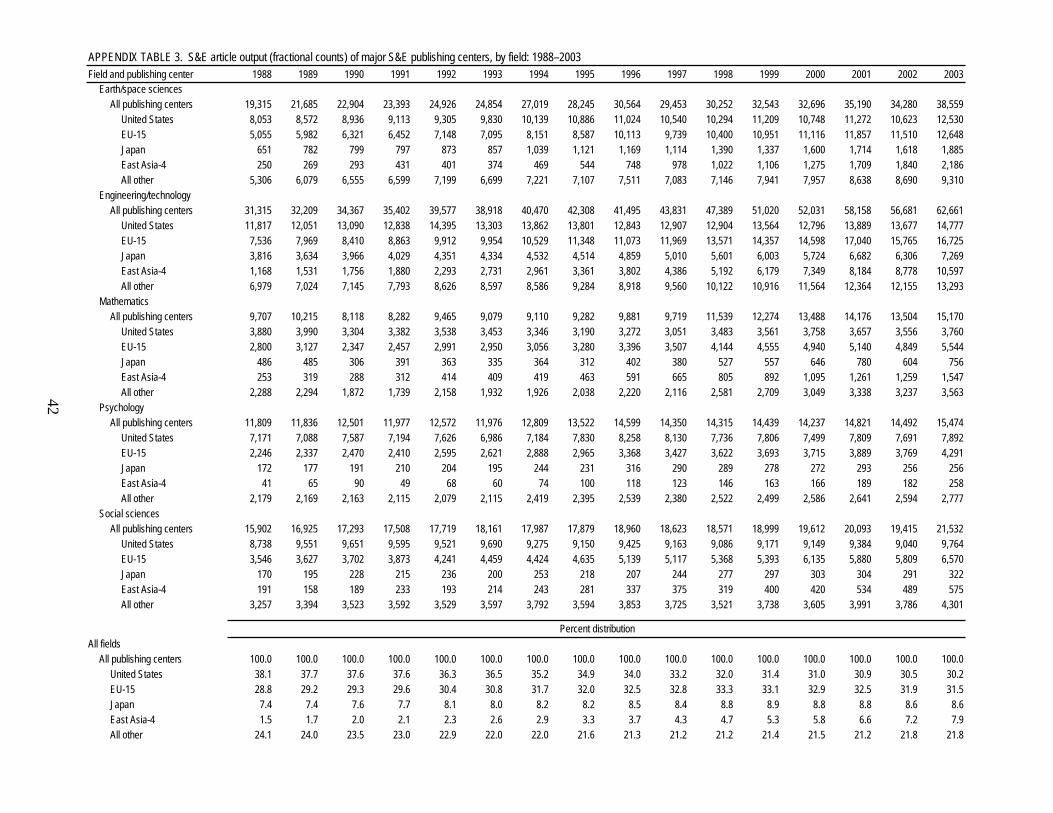
APPENDIX TABLE 3. S&E article output (fractional counts) of major S&E publishing centers, by field: 1988–2003
Field and publishing center 1988 1989 1990 1991 1992 1993 1994 1995 1996 1997 1998 1999 2000 2001 2002 2003
Earth/space sciences
All publishing centers 19,315 21,685 22,904 23,393 24,926 24,854 27,019 28,245 30,564 29,453 30,252 32,543 32,696 35,190 34,280 38,559
United States 8,053 8,572 8,936 9,113 9,305 9,830 10,139 10,886 11,024 10,540 10,294 11,209 10,748 11,272 10,623 12,530
EU-15 5,055 5,982 6,321 6,452 7,148 7,095 8,151 8,587 10,113 9,739 10,400 10,951 11,116 11,857 11,510 12,648
Japan 651 782 799 797 873 857 1,039 1,121 1,169 1,114 1,390 1,337 1,600 1,714 1,618 1,885
East Asia-4 250 269 293 431 401 374 469 544 748 978 1,022 1,106 1,275 1,709 1,840 2,186
All other 5,306 6,079 6,555 6,599 7,199 6,699 7,221 7,107 7,511 7,083 7,146 7,941 7,957 8,638 8,690 9,310
Engineering/technology
All publishing centers 31,315 32,209 34,367 35,402 39,577 38,918 40,470 42,308 41,495 43,831 47,389 51,020 52,031 58,158 56,681 62,661
United States 11,817 12,051 13,090 12,838 14,395 13,303 13,862 13,801 12,843 12,907 12,904 13,564 12,796 13,889 13,677 14,777
EU-15 7,536 7,969 8,410 8,863 9,912 9,954 10,529 11,348 11,073 11,969 13,571 14,357 14,598 17,040 15,765 16,725
Japan 3,816 3,634 3,966 4,029 4,351 4,334 4,532 4,514 4,859 5,010 5,601 6,003 5,724 6,682 6,306 7,269
East Asia-4 1,168 1,531 1,756 1,880 2,293 2,731 2,961 3,361 3,802 4,386 5,192 6,179 7,349 8,184 8,778 10,597
All other 6,979 7,024 7,145 7,793 8,626 8,597 8,586 9,284 8,918 9,560 10,122 10,916 11,564 12,364 12,155 13,293
Mathematics
All publishing centers 9,707 10,215 8,118 8,282 9,465 9,079 9,110 9,282 9,881 9,719 11,539 12,274 13,488 14,176 13,504 15,170
United States 3,880 3,990 3,304 3,382 3,538 3,453 3,346 3,190 3,272 3,051 3,483 3,561 3,758 3,657 3,556 3,760
EU-15 2,800 3,127 2,347 2,457 2,991 2,950 3,056 3,280 3,396 3,507 4,144 4,555 4,940 5,140 4,849 5,544
Japan 486 485 306 391 363 335 364 312 402 380 527 557 646 780 604 756
East Asia-4 253 319 288 312 414 409 419 463 591 665 805 892 1,095 1,261 1,259 1,547
All other 2,288 2,294 1,872 1,739 2,158 1,932 1,926 2,038 2,220 2,116 2,581 2,709 3,049 3,338 3,237 3,563
Psychology
All publishing centers 11,809 11,836 12,501 11,977 12,572 11,976 12,809 13,522 14,599 14,350 14,315 14,439 14,237 14,821 14,492 15,474
United States 7,171 7,088 7,587 7,194 7,626 6,986 7,184 7,830 8,258 8,130 7,736 7,806 7,499 7,809 7,691 7,892
EU-15 2,246 2,337 2,470 2,410 2,595 2,621 2,888 2,965 3,368 3,427 3,622 3,693 3,715 3,889 3,769 4,291
Japan 172 177 191 210 204 195 244 231 316 290 289 278 272 293 256 256
East Asia-4 41 65 90 49 68 60 74 100 118 123 146 163 166 189 182 258
All other 2,179 2,169 2,163 2,115 2,079 2,115 2,419 2,395 2,539 2,380 2,522 2,499 2,586 2,641 2,594 2,777
Social sciences
All publishing centers 15,902 16,925 17,293 17,508 17,719 18,161 17,987 17,879 18,960 18,623 18,571 18,999 19,612 20,093 19,415 21,532
United States 8,738 9,551 9,651 9,595 9,521 9,690 9,275 9,150 9,425 9,163 9,086 9,171 9,149 9,384 9,040 9,764
EU-15 3,546 3,627 3,702 3,873 4,241 4,459 4,424 4,635 5,139 5,117 5,368 5,393 6,135 5,880 5,809 6,570
Japan 170 195 228 215 236 200 253 218 207 244 277 297 303 304 291 322
East Asia-4 191 158 189 233 193 214 243 281 337 375 319 400 420 534 489 575
All other 3,257 3,394 3,523 3,592 3,529 3,597 3,792 3,594 3,853 3,725 3,521 3,738 3,605 3,991 3,786 4,301
All fields
All publishing centers 100.0 100.0 100.0 100.0 100.0 100.0 100.0 100.0 100.0 100.0 100.0 100.0 100.0 100.0 100.0 100.0
United States 38.1 37.7 37.6 37.6 36.3 36.5 35.2 34.9 34.0 33.2 32.0 31.4 31.0 30.9 30.5 30.2
EU-15 28.8 29.2 29.3 29.6 30.4 30.8 31.7 32.0 32.5 32.8 33.3 33.1 32.9 32.5 31.9 31.5
Japan 7.4 7.4 7.6 7.7 8.1 8.0 8.2 8.2 8.5 8.4 8.8 8.9 8.8 8.8 8.6 8.6
East Asia-4 1.5 1.7 2.0 2.1 2.3 2.6 2.9 3.3 3.7 4.3 4.7 5.3 5.8 6.6 7.2 7.9
All other 24.1 24.0 23.5 23.0 22.9 22.0 22.0 21.6 21.3 21.2 21.2 21.4 21.5 21.2 21.8 21.8
Percent distribution
42

APPENDIX TABLE 3. S&E article output (fractional counts) of major S&E publishing centers, by field: 1988–2003
Field and publishing center 1988 1989 1990 1991 1992 1993 1994 1995 1996 1997 1998 1999 2000 2001 2002 2003
Clinical medicine
All publishing centers 100.0 100.0 100.0 100.0 100.0 100.0 100.0 100.0 100.0 100.0 100.0 100.0 100.0 100.0 100.0 100.0
United States 40.2 39.4 39.3 39.1 38.1 38.7 37.5 37.7 36.6 35.8 35.0 34.4 33.9 34.5 33.8 33.8
EU-15 33.9 34.4 34.8 34.5 35.7 35.5 36.2 36.4 36.8 37.1 37.3 37.0 37.1 36.4 36.1 35.7
Japan 6.4 6.9 6.9 7.5 7.8 8.1 8.3 8.2 8.7 8.7 9.1 9.0 9.0 8.9 8.8 8.4
East Asia-4 1.0 1.1 1.2 1.2 1.4 1.4 1.5 1.7 2.1 2.2 2.5 2.8 3.0 3.5 3.8 4.2
All other 18.5 18.1 17.8 17.8 17.1 16.3 16.5 16.0 15.9 16.1 16.1 16.8 17.0 16.7 17.5 17.9
Biomedical research
All publishing centers 100.0 100.0 100.0 100.0 100.0 100.0 100.0 100.0 100.0 100.0 100.0 100.0 100.0 100.0 100.0 100.0
United States 38.8 38.6 39.3 39.2 39.1 39.6 38.8 39.2 38.5 38.0 36.8 36.4 36.6 37.0 36.5 36.0
EU-15 29.1 29.7 29.8 30.3 30.6 31.5 32.3 32.7 33.0 32.8 33.0 33.4 32.1 32.3 32.0 31.5
Japan 7.4 7.6 7.7 7.8 8.1 8.2 8.1 8.2 8.0 8.4 8.7 8.7 8.5 8.7 8.6 8.4
East Asia-4 0.7 0.7 0.7 0.9 1.0 1.1 1.2 1.4 1.8 2.0 2.8 3.2 3.6 4.2 4.6 5.3
All other 23.9 23.4 22.5 21.9 21.2 19.6 19.6 18.5 18.7 18.8 18.8 18.2 19.2 17.8 18.3 18.8
Biology
All publishing centers 100.0 100.0 100.0 100.0 100.0 100.0 100.0 100.0 100.0 100.0 100.0 100.0 100.0 100.0 100.0 100.0
United States 36.6 36.6 36.3 37.0 34.5 33.0 32.7 31.2 30.5 29.5 28.7 26.8 27.8 28.2 28.1 27.9
EU-15 25.5 26.1 26.5 25.9 27.6 28.0 28.7 30.2 30.2 31.3 31.4 31.9 31.8 31.2 30.5 30.2
Japan 6.8 6.6 6.6 7.1 7.0 7.2 7.8 7.8 7.8 7.2 7.7 7.9 7.6 7.9 7.4 7.6
East Asia-4 0.9 1.0 1.1 1.2 1.4 1.5 1.5 1.9 2.0 2.6 2.8 3.3 3.1 3.7 4.3 4.7
All other 30.2 29.5 29.5 28.8 29.6 30.3 29.3 28.9 29.5 29.5 29.4 30.1 29.7 29.0 29.7 29.6
Chemistry
All publishing centers 100.0 100.0 100.0 100.0 100.0 100.0 100.0 100.0 100.0 100.0 100.0 100.0 100.0 100.0 100.0 100.0
United States 23.0 22.3 22.4 23.4 22.1 22.9 21.5 21.2 21.2 20.4 19.3 18.9 19.2 18.6 18.4 18.9
EU-15 30.8 30.2 30.1 30.9 30.9 32.5 32.8 32.9 33.3 33.5 33.7 33.0 31.6 31.2 30.2 29.2
Japan 10.6 10.2 11.4 10.9 11.0 10.6 11.0 11.1 10.9 10.9 11.8 11.5 11.5 11.1 10.7 10.6
East Asia-4 1.8 2.4 3.0 3.3 3.7 4.4 4.6 5.5 6.0 7.1 7.8 9.3 10.3 11.6 12.8 13.4
All other 33.8 34.8 33.1 31.5 32.3 29.5 30.2 29.2 28.5 28.1 27.3 27.3 27.4 27.6 28.0 28.0
Physics
All publishing centers 100.0 100.0 100.0 100.0 100.0 100.0 100.0 100.0 100.0 100.0 100.0 100.0 100.0 100.0 100.0 100.0
United States 29.0 28.8 28.5 29.5 26.5 26.7 25.3 24.0 22.5 21.8 21.1 20.7 20.0 20.0 19.6 19.2
EU-15 28.0 28.3 27.9 29.3 29.5 29.8 31.4 31.3 32.3 32.1 32.4 32.0 32.3 31.4 31.0 30.1
Japan 10.6 9.9 10.5 9.8 11.4 10.9 10.9 11.1 12.2 11.8 11.8 12.3 12.4 12.7 12.3 12.9
East Asia-4 3.2 3.5 4.0 3.8 4.3 5.1 5.6 6.3 6.5 8.2 8.2 8.8 9.5 10.6 11.5 12.8
All other 29.3 29.5 29.1 27.6 28.3 27.5 26.8 27.3 26.5 26.1 26.5 26.2 25.8 25.3 25.6 24.9
Earth/space sciences
All publishing centers 100.0 100.0 100.0 100.0 100.0 100.0 100.0 100.0 100.0 100.0 100.0 100.0 100.0 100.0 100.0 100.0
United States 41.7 39.5 39.0 39.0 37.3 39.6 37.5 38.5 36.1 35.8 34.0 34.4 32.9 32.0 31.0 32.5
EU-15 26.2 27.6 27.6 27.6 28.7 28.5 30.2 30.4 33.1 33.1 34.4 33.6 34.0 33.7 33.6 32.8
Japan 3.4 3.6 3.5 3.4 3.5 3.4 3.8 4.0 3.8 3.8 4.6 4.1 4.9 4.9 4.7 4.9
East Asia-4 1.3 1.2 1.3 1.8 1.6 1.5 1.7 1.9 2.4 3.3 3.4 3.4 3.9 4.9 5.4 5.7
All other 27.5 28.0 28.6 28.2 28.9 27.0 26.7 25.2 24.6 24.0 23.6 24.4 24.3 24.5 25.3 24.1
43
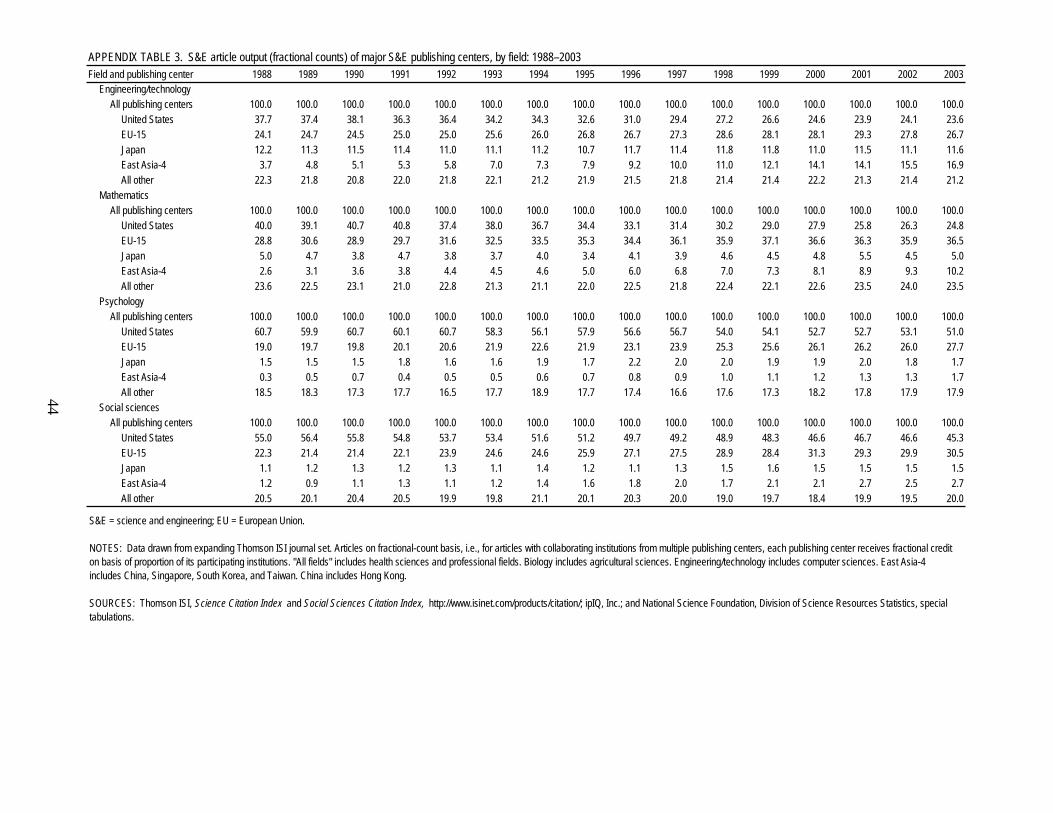
APPENDIX TABLE 3. S&E article output (fractional counts) of major S&E publishing centers, by field: 1988–2003
Field and publishing center 1988 1989 1990 1991 1992 1993 1994 1995 1996 1997 1998 1999 2000 2001 2002 2003
Engineering/technology
All publishing centers 100.0 100.0 100.0 100.0 100.0 100.0 100.0 100.0 100.0 100.0 100.0 100.0 100.0 100.0 100.0 100.0
United States 37.7 37.4 38.1 36.3 36.4 34.2 34.3 32.6 31.0 29.4 27.2 26.6 24.6 23.9 24.1 23.6
EU-15 24.1 24.7 24.5 25.0 25.0 25.6 26.0 26.8 26.7 27.3 28.6 28.1 28.1 29.3 27.8 26.7
Japan 12.2 11.3 11.5 11.4 11.0 11.1 11.2 10.7 11.7 11.4 11.8 11.8 11.0 11.5 11.1 11.6
East Asia-4 3.7 4.8 5.1 5.3 5.8 7.0 7.3 7.9 9.2 10.0 11.0 12.1 14.1 14.1 15.5 16.9
All other 22.3 21.8 20.8 22.0 21.8 22.1 21.2 21.9 21.5 21.8 21.4 21.4 22.2 21.3 21.4 21.2
Mathematics
All publishing centers 100.0 100.0 100.0 100.0 100.0 100.0 100.0 100.0 100.0 100.0 100.0 100.0 100.0 100.0 100.0 100.0
United States 40.0 39.1 40.7 40.8 37.4 38.0 36.7 34.4 33.1 31.4 30.2 29.0 27.9 25.8 26.3 24.8
EU-15 28.8 30.6 28.9 29.7 31.6 32.5 33.5 35.3 34.4 36.1 35.9 37.1 36.6 36.3 35.9 36.5
Japan 5.0 4.7 3.8 4.7 3.8 3.7 4.0 3.4 4.1 3.9 4.6 4.5 4.8 5.5 4.5 5.0
East Asia-4 2.6 3.1 3.6 3.8 4.4 4.5 4.6 5.0 6.0 6.8 7.0 7.3 8.1 8.9 9.3 10.2
All other 23.6 22.5 23.1 21.0 22.8 21.3 21.1 22.0 22.5 21.8 22.4 22.1 22.6 23.5 24.0 23.5
Psychology
All publishing centers 100.0 100.0 100.0 100.0 100.0 100.0 100.0 100.0 100.0 100.0 100.0 100.0 100.0 100.0 100.0 100.0
United States 60.7 59.9 60.7 60.1 60.7 58.3 56.1 57.9 56.6 56.7 54.0 54.1 52.7 52.7 53.1 51.0
EU-15 19.0 19.7 19.8 20.1 20.6 21.9 22.6 21.9 23.1 23.9 25.3 25.6 26.1 26.2 26.0 27.7
Japan 1.5 1.5 1.5 1.8 1.6 1.6 1.9 1.7 2.2 2.0 2.0 1.9 1.9 2.0 1.8 1.7
East Asia-4 0.3 0.5 0.7 0.4 0.5 0.5 0.6 0.7 0.8 0.9 1.0 1.1 1.2 1.3 1.3 1.7
All other 18.5 18.3 17.3 17.7 16.5 17.7 18.9 17.7 17.4 16.6 17.6 17.3 18.2 17.8 17.9 17.9
Social sciences
All publishing centers 100.0 100.0 100.0 100.0 100.0 100.0 100.0 100.0 100.0 100.0 100.0 100.0 100.0 100.0 100.0 100.0
United States 55.0 56.4 55.8 54.8 53.7 53.4 51.6 51.2 49.7 49.2 48.9 48.3 46.6 46.7 46.6 45.3
EU-15 22.3 21.4 21.4 22.1 23.9 24.6 24.6 25.9 27.1 27.5 28.9 28.4 31.3 29.3 29.9 30.5
Japan 1.1 1.2 1.3 1.2 1.3 1.1 1.4 1.2 1.1 1.3 1.5 1.6 1.5 1.5 1.5 1.5
East Asia-4 1.2 0.9 1.1 1.3 1.1 1.2 1.4 1.6 1.8 2.0 1.7 2.1 2.1 2.7 2.5 2.7
All other 20.5 20.1 20.4 20.5 19.9 19.8 21.1 20.1 20.3 20.0 19.0 19.7 18.4 19.9 19.5 20.0
S&E = science and engineering; EU = European Union.
NOTES: Data drawn from expanding Thomson ISI journal set. Articles on fractional-count basis, i.e., for articles with collaborating institutions from multiple publishing centers, each publishing center receives fractional credit
on basis of proportion of its participating institutions. "All fields" includes health sciences and professional fields. Biology includes agricultural sciences. Engineering/technology includes computer sciences. East Asia-4
includes China, Singapore, South Korea, and Taiwan. China includes Hong Kong.
SOURCES: Thomson ISI, Science Citation Index and Social Sciences Citation Index, http://www.isinet.com/products/citation/; ipIQ, Inc.; and National Science Foundation, Division of Science Resources Statistics, special
tabulations.
44

APPENDIX TABLE 4. S&E article output (whole counts) of major S&E publishing centers, by field: 1988–2003
Field and publishing center 1988 1989 1990 1991 1992 1993 1994 1995 1996 1997 1998 1999 2000 2001 2002 2003
All fields
All publishing centers 466,419 497,102 508,795 515,530 547,617 540,491 567,204 580,809 593,568 594,467 617,762 632,059 632,781 649,795 641,388 698,726
United States 187,225 197,930 203,194 207,116 213,624 212,903 216,862 221,335 221,414 218,274 220,182 222,474 221,207 228,015 223,521 242,397
EU-15 144,157 156,306 160,964 166,394 182,099 183,266 198,561 206,578 215,494 219,143 231,534 237,022 237,255 242,529 236,780 255,262
Japan 36,041 38,419 40,717 41,997 47,079 46,499 50,309 51,625 54,614 54,952 59,963 61,908 61,421 64,073 61,717 67,728
East Asia-4 8,194 9,892 11,522 12,314 14,808 16,520 18,675 22,066 24,923 29,051 33,068 38,151 41,919 48,918 52,751 63,400
Biology
All publishing centers 35,167 36,992 38,598 37,562 38,768 38,395 39,224 40,530 40,325 40,785 42,283 42,075 44,973 44,292 46,745 49,589
United States 13,522 14,308 14,807 14,743 14,235 13,615 13,791 13,696 13,367 13,177 13,361 12,566 14,002 14,049 14,863 15,810
EU-15 9,614 10,358 10,989 10,551 11,592 11,653 12,298 13,415 13,418 14,170 14,864 15,122 16,183 15,770 16,452 17,347
Japan 2,506 2,589 2,706 2,821 2,865 2,964 3,235 3,380 3,366 3,159 3,507 3,601 3,750 3,854 3,813 4,201
East Asia-4 400 499 532 585 652 734 741 977 981 1,275 1,433 1,650 1,721 2,033 2,448 2,868
Biomedical research
All publishing centers 70,723 76,228 78,150 79,594 84,192 83,616 86,926 89,424 88,371 88,553 92,429 91,704 91,463 92,078 88,735 95,633
United States 29,198 31,388 32,924 33,656 35,740 36,111 37,052 38,626 37,719 37,546 38,325 37,913 38,139 39,001 37,319 39,848
EU-15 22,389 24,646 25,543 26,590 28,661 29,365 31,428 32,943 32,996 33,182 35,053 35,433 34,171 34,838 33,413 35,719
Japan 5,521 6,183 6,417 6,651 7,366 7,438 7,748 8,160 7,841 8,319 9,035 9,041 8,826 9,222 8,834 9,287
East Asia-4 627 653 679 849 1,063 1,170 1,251 1,577 1,957 2,132 2,985 3,510 3,874 4,556 4,872 6,040
Chemistry
All publishing centers 57,434 60,056 62,550 62,686 66,182 65,768 67,767 70,419 71,618 70,501 74,628 76,688 75,724 77,051 76,419 83,483
United States 13,896 14,187 14,866 15,677 15,742 16,236 15,833 16,223 16,654 15,852 16,001 16,185 16,282 16,146 15,874 17,807
EU-15 18,694 19,306 20,052 20,820 22,073 23,128 24,101 25,312 26,116 26,067 27,951 28,215 26,879 27,135 26,314 27,783
Japan 6,236 6,307 7,333 7,048 7,544 7,292 7,758 8,198 8,257 8,176 9,365 9,445 9,288 9,135 8,769 9,580
East Asia-4 1,147 1,562 2,019 2,264 2,717 3,119 3,362 4,198 4,606 5,393 6,247 7,609 8,340 9,578 10,457 12,047
Clinical medicine
All publishing centers 136,878 147,368 149,656 152,165 160,471 158,323 167,091 168,009 172,482 174,852 180,416 183,822 182,033 184,825 179,724 194,937
United States 57,378 60,790 61,704 62,643 64,767 65,243 67,027 68,110 68,148 68,205 68,964 69,618 68,407 70,989 68,111 74,240
EU-15 48,755 53,383 54,885 55,599 60,864 60,141 64,852 65,894 68,594 70,505 73,228 74,356 74,087 74,370 72,055 77,638
Japan 9,226 10,692 10,825 11,988 13,313 13,607 14,817 14,683 16,077 16,353 17,583 17,965 17,864 18,047 17,208 17,958
East Asia-4 1,512 1,788 2,122 2,042 2,517 2,620 3,018 3,395 4,099 4,465 5,249 5,866 6,338 7,552 7,851 9,551
Earth/space sciences
All publishing centers 19,315 21,685 22,904 23,393 24,926 24,854 27,019 28,245 30,564 29,453 30,252 32,543 32,696 35,190 34,280 38,559
United States 8,783 9,423 9,922 10,215 10,535 11,093 11,617 12,523 12,904 12,411 12,288 13,506 13,078 13,926 13,386 15,757
EU-15 5,776 6,882 7,392 7,595 8,458 8,429 9,736 10,315 12,213 11,869 12,633 13,548 13,779 14,841 14,582 16,082
Japan 755 896 936 951 1,041 1,020 1,258 1,355 1,468 1,414 1,738 1,698 1,993 2,188 2,117 2,485
East Asia-4 325 351 388 557 537 488 638 742 1,000 1,222 1,286 1,434 1,635 2,189 2,321 2,829
Engineering/technology
All publishing centers 31,315 32,209 34,367 35,402 39,577 38,918 40,470 42,308 41,495 43,831 47,389 51,020 52,031 58,158 56,681 62,661
United States 12,430 12,730 13,826 13,709 15,353 14,272 14,950 15,013 13,983 14,221 14,407 15,185 14,514 15,938 15,671 17,119
EU-15 8,024 8,505 9,021 9,592 10,747 10,857 11,529 12,459 12,234 13,359 15,166 16,224 16,484 19,435 18,115 19,196
Japan 3,963 3,802 4,134 4,225 4,591 4,596 4,811 4,846 5,162 5,397 6,048 6,547 6,277 7,362 6,995 8,042
East Asia-4 1,322 1,745 1,984 2,148 2,598 3,060 3,332 3,807 4,262 4,940 5,793 6,901 8,096 9,129 9,796 11,798
Number
45

APPENDIX TABLE 4. S&E article output (whole counts) of major S&E publishing centers, by field: 1988–2003
Field and publishing center 1988 1989 1990 1991 1992 1993 1994 1995 1996 1997 1998 1999 2000 2001 2002 2003
Mathematics
All publishing centers 9,707 10,215 8,118 8,282 9,465 9,079 9,110 9,282 9,881 9,719 11,539 12,274 13,488 14,176 13,504 15,170
United States 4,301 4,428 3,698 3,811 4,052 3,925 3,811 3,646 3,812 3,567 4,097 4,254 4,523 4,459 4,375 4,651
EU-15 3,152 3,524 2,692 2,839 3,461 3,377 3,508 3,767 3,926 4,055 4,808 5,352 5,877 6,076 5,749 6,620
Japan 525 525 342 430 407 368 398 348 442 419 589 627 739 889 708 881
East Asia-4 302 375 347 371 498 495 496 551 699 783 965 1,088 1,320 1,530 1,515 1,881
Physics
All publishing centers 62,246 66,224 67,313 69,627 76,207 73,325 80,854 82,111 84,021 82,859 85,010 87,302 84,367 86,758 88,412 96,953
United States 19,683 20,905 21,204 22,923 22,840 22,437 23,559 23,062 22,389 21,709 21,803 22,144 21,081 21,801 21,902 23,582
EU-15 19,321 20,936 21,212 23,419 26,110 25,701 29,920 30,542 32,344 32,151 33,293 34,062 33,569 33,609 34,120 36,361
Japan 6,867 6,891 7,467 7,310 9,363 8,678 9,637 10,037 11,288 10,978 11,320 12,173 11,906 12,545 12,453 14,429
East Asia-4 2,189 2,529 2,966 3,016 3,752 4,285 5,192 6,007 6,305 7,726 8,016 8,775 9,235 10,607 11,719 14,292
Psychology
All publishing centers 11,809 11,836 12,501 11,977 12,572 11,976 12,809 13,522 14,599 14,350 14,315 14,439 14,237 14,821 14,492 15,474
United States 7,342 7,294 7,788 7,407 7,864 7,219 7,432 8,137 8,587 8,500 8,116 8,211 7,892 8,270 8,168 8,472
EU-15 2,356 2,465 2,596 2,547 2,751 2,791 3,064 3,194 3,620 3,692 3,941 4,001 4,048 4,291 4,170 4,780
Japan 185 191 206 226 231 211 264 252 350 317 326 314 300 336 294 300
East Asia-4 47 78 105 61 87 82 101 130 158 160 188 219 216 246 252 336
Social sciences
All publishing centers 15,902 16,925 17,293 17,508 17,719 18,161 17,987 17,879 18,960 18,623 18,571 18,999 19,612 20,093 19,415 21,532
United States 9,043 9,863 10,002 9,959 9,927 10,121 9,731 9,615 9,945 9,662 9,575 9,695 9,676 9,988 9,671 10,510
EU-15 3,724 3,816 3,896 4,091 4,498 4,728 4,705 4,951 5,479 5,473 5,760 5,778 6,579 6,373 6,311 7,191
Japan 188 220 257 241 268 230 278 247 237 273 322 330 331 351 334 365
East Asia-4 213 184 220 268 231 260 304 358 424 458 399 492 506 651 607 699
All fields
United States 40.1 39.8 39.9 40.2 39.0 39.4 38.2 38.1 37.3 36.7 35.6 35.2 35.0 35.1 34.8 34.7
EU-15 30.9 31.4 31.6 32.3 33.3 33.9 35.0 35.6 36.3 36.9 37.5 37.5 37.5 37.3 36.9 36.5
Japan 7.7 7.7 8.0 8.1 8.6 8.6 8.9 8.9 9.2 9.2 9.7 9.8 9.7 9.9 9.6 9.7
East Asia-4 1.8 2.0 2.3 2.4 2.7 3.1 3.3 3.8 4.2 4.9 5.4 6.0 6.6 7.5 8.2 9.1
Biology
United States 38.5 38.7 38.4 39.2 36.7 35.5 35.2 33.8 33.1 32.3 31.6 29.9 31.1 31.7 31.8 31.9
EU-15 27.3 28.0 28.5 28.1 29.9 30.4 31.4 33.1 33.3 34.7 35.2 35.9 36.0 35.6 35.2 35.0
Japan 7.1 7.0 7.0 7.5 7.4 7.7 8.2 8.3 8.3 7.7 8.3 8.6 8.3 8.7 8.2 8.5
East Asia-4 1.1 1.3 1.4 1.6 1.7 1.9 1.9 2.4 2.4 3.1 3.4 3.9 3.8 4.6 5.2 5.8
Biomedical research
United States 41.3 41.2 42.1 42.3 42.5 43.2 42.6 43.2 42.7 42.4 41.5 41.3 41.7 42.4 42.1 41.7
EU-15 31.7 32.3 32.7 33.4 34.0 35.1 36.2 36.8 37.3 37.5 37.9 38.6 37.4 37.8 37.7 37.4
Japan 7.8 8.1 8.2 8.4 8.7 8.9 8.9 9.1 8.9 9.4 9.8 9.9 9.6 10.0 10.0 9.7
East Asia-4 0.9 0.9 0.9 1.1 1.3 1.4 1.4 1.8 2.2 2.4 3.2 3.8 4.2 4.9 5.5 6.3
Chemistry
United States 24.2 23.6 23.8 25.0 23.8 24.7 23.4 23.0 23.3 22.5 21.4 21.1 21.5 21.0 20.8 21.3
EU-15 32.5 32.1 32.1 33.2 33.4 35.2 35.6 35.9 36.5 37.0 37.5 36.8 35.5 35.2 34.4 33.3
Japan 10.9 10.5 11.7 11.2 11.4 11.1 11.4 11.6 11.5 11.6 12.5 12.3 12.3 11.9 11.5 11.5
Percent
46

APPENDIX TABLE 4. S&E article output (whole counts) of major S&E publishing centers, by field: 1988–2003
Field and publishing center 1988 1989 1990 1991 1992 1993 1994 1995 1996 1997 1998 1999 2000 2001 2002 2003
East Asia-4 2.0 2.6 3.2 3.6 4.1 4.7 5.0 6.0 6.4 7.6 8.4 9.9 11.0 12.4 13.7 14.4
Clinical medicine
United States 41.9 41.3 41.2 41.2 40.4 41.2 40.1 40.5 39.5 39.0 38.2 37.9 37.6 38.4 37.9 38.1
EU-15 35.6 36.2 36.7 36.5 37.9 38.0 38.8 39.2 39.8 40.3 40.6 40.5 40.7 40.2 40.1 39.8
Japan 6.7 7.3 7.2 7.9 8.3 8.6 8.9 8.7 9.3 9.4 9.7 9.8 9.8 9.8 9.6 9.2
East Asia-4 1.1 1.2 1.4 1.3 1.6 1.7 1.8 2.0 2.4 2.6 2.9 3.2 3.5 4.1 4.4 4.9
Earth/space sciences
United States 45.5 43.5 43.3 43.7 42.3 44.6 43.0 44.3 42.2 42.1 40.6 41.5 40.0 39.6 39.0 40.9
EU-15 29.9 31.7 32.3 32.5 33.9 33.9 36.0 36.5 40.0 40.3 41.8 41.6 42.1 42.2 42.5 41.7
Japan 3.9 4.1 4.1 4.1 4.2 4.1 4.7 4.8 4.8 4.8 5.7 5.2 6.1 6.2 6.2 6.4
East Asia-4 1.7 1.6 1.7 2.4 2.2 2.0 2.4 2.6 3.3 4.1 4.3 4.4 5.0 6.2 6.8 7.3
Engineering/technology
United States 39.7 39.5 40.2 38.7 38.8 36.7 36.9 35.5 33.7 32.4 30.4 29.8 27.9 27.4 27.6 27.3
EU-15 25.6 26.4 26.2 27.1 27.2 27.9 28.5 29.4 29.5 30.5 32.0 31.8 31.7 33.4 32.0 30.6
Japan 12.7 11.8 12.0 11.9 11.6 11.8 11.9 11.5 12.4 12.3 12.8 12.8 12.1 12.7 12.3 12.8
East Asia-4 4.2 5.4 5.8 6.1 6.6 7.9 8.2 9.0 10.3 11.3 12.2 13.5 15.6 15.7 17.3 18.8
Mathematics
United States 44.3 43.3 45.6 46.0 42.8 43.2 41.8 39.3 38.6 36.7 35.5 34.7 33.5 31.5 32.4 30.7
EU-15 32.5 34.5 33.2 34.3 36.6 37.2 38.5 40.6 39.7 41.7 41.7 43.6 43.6 42.9 42.6 43.6
Japan 5.4 5.1 4.2 5.2 4.3 4.1 4.4 3.7 4.5 4.3 5.1 5.1 5.5 6.3 5.2 5.8
East Asia-4 3.1 3.7 4.3 4.5 5.3 5.5 5.4 5.9 7.1 8.1 8.4 8.9 9.8 10.8 11.2 12.4
Physics
United States 31.6 31.6 31.5 32.9 30.0 30.6 29.1 28.1 26.6 26.2 25.6 25.4 25.0 25.1 24.8 24.3
EU-15 31.0 31.6 31.5 33.6 34.3 35.1 37.0 37.2 38.5 38.8 39.2 39.0 39.8 38.7 38.6 37.5
Japan 11.0 10.4 11.1 10.5 12.3 11.8 11.9 12.2 13.4 13.2 13.3 13.9 14.1 14.5 14.1 14.9
East Asia-4 3.5 3.8 4.4 4.3 4.9 5.8 6.4 7.3 7.5 9.3 9.4 10.1 10.9 12.2 13.3 14.7
Psychology
United States 62.2 61.6 62.3 61.8 62.6 60.3 58.0 60.2 58.8 59.2 56.7 56.9 55.4 55.8 56.4 54.7
EU-15 20.0 20.8 20.8 21.3 21.9 23.3 23.9 23.6 24.8 25.7 27.5 27.7 28.4 29.0 28.8 30.9
Japan 1.6 1.6 1.6 1.9 1.8 1.8 2.1 1.9 2.4 2.2 2.3 2.2 2.1 2.3 2.0 1.9
East Asia-4 0.4 0.7 0.8 0.5 0.7 0.7 0.8 1.0 1.1 1.1 1.3 1.5 1.5 1.7 1.7 2.2
Social sciences
United States 56.9 58.3 57.8 56.9 56.0 55.7 54.1 53.8 52.5 51.9 51.6 51.0 49.3 49.7 49.8 48.8
EU-15 23.4 22.5 22.5 23.4 25.4 26.0 26.2 27.7 28.9 29.4 31.0 30.4 33.5 31.7 32.5 33.4
Japan 1.2 1.3 1.5 1.4 1.5 1.3 1.5 1.4 1.3 1.5 1.7 1.7 1.7 1.7 1.7 1.7
East Asia-4 1.3 1.1 1.3 1.5 1.3 1.4 1.7 2.0 2.2 2.5 2.1 2.6 2.6 3.2 3.1 3.2
S&E = science and engineering; EU = European Union.
NOTES: Articles on whole-count basis, i.e., for articles with collaborating institutions from multiple publishing centers, each publishing center receives one count for its participation, regardless of the number of its participating
institutions. Shares may add to more than 100% because articles with institutional authors from multiple publishing centers are counted once for each publishing center. "All fields" includes health sciences and professional
fields. Biology includes agricultural sciences. Engineering/technology includes computer sciences. East Asia-4 includes China, Singapore, South Korea, and Taiwan. China includes Hong Kong.
SOURCES: Thomson ISI, Science Citation Index and Social Sciences Citation Index, http://www.isinet.com/products/citation/; ipIQ, Inc.; and National Science Foundation, Division of Science Resources Statistics, special
tabulations.
47

(Percent)
1988–92 1992–2003 1988–92 1992–2003
United States
All fields 3.8 0.6 4.5 1.3
Biology 1.3 0.4 1.7 1.1
Biomedical research 6.2 0.5 7.0 1.1
Chemistry 3.6 0.7 4.2 1.2
Clinical medicine 3.6 0.8 4.1 1.4
Earth/space sciences 4.9 3.0 6.3 4.1
Engineering/technology 6.8 0.3 7.3 1.1
Mathematics -3.0 0.6 -2.0 1.4
Physics 3.8 -0.8 5.1 0.3
Psychology 2.1 0.3 2.3 0.7
Social sciences 2.9 0.3 3.2 0.6
EU-15
All fields 7.3 2.8 8.1 3.4
Biology 6.1 3.4 6.4 4.1
Biomedical research 7.8 1.6 8.6 2.2
Chemistry 4.9 1.8 5.7 2.3
Clinical medicine 7.2 2.0 7.7 2.5
Earth/space sciences 12.2 5.9 13.6 6.6
Engineering/technology 9.6 5.4 10.2 6.0
Mathematics 2.2 6.4 3.2 6.7
Physics 8.9 2.7 10.6 3.4
Psychology 4.9 5.2 5.3 5.7
Social sciences 6.1 4.5 6.5 4.8
Japan
All fields 8.6 3.1 9.3 3.7
Biology 4.2 3.4 4.6 3.9
Biomedical research 9.2 1.6 10.1 2.3
Chemistry 6.1 2.0 6.6 2.4
Clinical medicine 12.5 2.6 13.0 3.0
Earth/space sciences 10.3 8.0 11.3 9.1
Engineering/technology 4.5 5.3 5.0 5.8
Mathematics -9.3 7.6 -8.1 8.0
Physics 9.8 3.7 10.9 4.4
Psychology 5.9 2.3 7.7 2.6
Social sciences 11.6 3.2 12.5 3.1
East Asia-4
All fields 21.1 15.8 21.8 15.7
Biology 18.1 16.0 17.7 16.0
Biomedical research 18.0 19.5 19.2 19.0
Chemistry 32.9 16.3 33.3 16.1
Clinical medicine 18.2 14.3 18.5 14.3
Earth/space sciences 17.0 18.5 18.2 18.1
Engineering/technology 25.2 16.5 25.3 16.3
Mathematics 17.9 14.1 18.1 14.2
Physics 17.9 14.2 19.7 14.3
Psychology 18.3 14.3 22.8 14.5
Social sciences 0.3 11.6 2.7 11.7
APPENDIX TABLE 5. Average annual growth rate of S&E article output (fractional and whole counts) of major S&E
publishing centers, by field: 1988–2003
Publishing center and field
Fractional counts Whole counts
S&E = science and engineering; EU = European Union.
NOTES: For articles with collaborating institutions from multiple publishing centers, fractional counts assign each publishing center
fractional credit on basis of proportion of its participating institutions, and whole counts assign each publishing center one credit for
its participation, regardless of the number of its participating institutions. East Asia-4 includes China, Singapore, South Korea, and
Taiwan. China includes Hong Kong. "All fields" includes health sciences and professional fields. Biology includes agriculture
sciences. Engineering/technology includes computer sciences.
SOURCES: Thomson ISI, Science Citation Index and Social Sciences Citation Index, http://www.isinet.com/products/citation/;
ipIQ, Inc.; and National Science Foundation, Division of Science Resources Statistics, special tabulations.
48

(Percent distribution)
Field and publishing center 1992 1993 1994 1995 1996 1997 1998 1999 2000 2001 2002 2003
All fieldsAll publishing centers 100.0 100.0 100.0 100.0 100.0 100.0 100.0 100.0 100.0 100.0 100.0 100.0
United States 64.6 63.8 63.0 62.1 62.0 61.6 61.8 60.6 59.8 58.2 57.2 56.6
EU-15 23.3 23.8 24.3 24.5 24.6 25.1 24.7 25.2 25.6 27.0 27.5 27.7
Japan 4.2 4.5 4.5 4.6 4.5 4.4 4.3 4.6 5.0 5.1 5.1 5.3
East Asia-4 0.1 0.1 0.2 0.2 0.2 0.2 0.3 0.4 0.4 0.5 0.8 1.1
All other 7.8 7.8 8.0 8.6 8.7 8.8 8.9 9.1 9.2 9.2 9.3 9.3
Clinical medicine
All publishing centers 100.0 100.0 100.0 100.0 100.0 100.0 100.0 100.0 100.0 100.0 100.0 100.0
United States 62.9 62.5 61.0 60.5 60.7 60.8 60.6 60.4 59.1 57.2 56.7 57.5
EU-15 25.5 25.9 26.3 26.7 26.9 27.1 26.7 26.2 27.1 28.6 29.3 28.0
Japan 3.3 3.6 4.1 4.1 4.1 3.8 3.6 3.6 3.7 3.7 3.6 4.1
East Asia-4 0.1 0.1 0.2 0.2 0.2 0.2 0.2 0.4 0.4 0.5 0.7 0.9
All other 8.2 7.8 8.3 8.5 8.0 8.1 8.9 9.5 9.7 10.0 9.7 9.5
Biomedical research
All publishing centers 100.0 100.0 100.0 100.0 100.0 100.0 100.0 100.0 100.0 100.0 100.0 100.0
United States 67.8 68.3 68.1 68.5 68.1 67.9 68.5 66.9 66.7 64.4 64.2 63.5
EU-15 21.1 21.2 21.2 20.2 20.9 20.6 19.9 20.6 20.1 21.8 22.4 22.9
Japan 4.7 4.0 4.3 4.5 4.0 3.8 4.0 4.6 5.1 4.8 4.8 5.1
East Asia-4 0.1 0.1 0.1 0.1 0.1 0.2 0.2 0.3 0.4 0.5 0.4 0.5
All other 6.4 6.5 6.3 6.7 6.9 7.6 7.3 7.5 7.8 8.5 8.1 8.1
Biology
All publishing centers 100.0 100.0 100.0 100.0 100.0 100.0 100.0 100.0 100.0 100.0 100.0 100.0
United States 58.6 56.3 53.6 54.7 53.7 53.2 50.5 48.8 47.4 46.8 44.1 43.9
EU-15 22.5 24.9 26.6 26.5 28.6 27.7 31.9 32.3 32.4 34.0 35.8 35.8
Japan 2.5 2.7 3.0 2.5 2.7 3.0 2.7 2.8 4.0 3.3 4.2 4.2
East Asia-4 0.1 0.0 0.1 0.1 0.1 0.3 0.7 1.0 0.8 0.4 0.5 0.9
All other 16.3 16.1 16.7 16.1 14.8 15.9 14.2 15.0 15.4 15.5 15.4 15.2
Chemistry
All publishing centers 100.0 100.0 100.0 100.0 100.0 100.0 100.0 100.0 100.0 100.0 100.0 100.0
United States 59.1 57.0 56.0 54.3 50.5 47.4 50.7 47.5 47.3 44.8 44.3 43.4
EU-15 23.1 25.3 25.4 26.8 29.8 31.3 29.4 32.1 30.4 32.3 32.3 32.2
Japan 7.5 7.7 7.5 7.4 7.3 7.3 7.6 7.1 8.9 8.8 9.5 8.5
East Asia-4 0.2 0.4 0.4 0.5 0.6 0.7 0.8 1.2 1.4 1.8 2.7 3.8
All other 10.1 9.6 10.7 11.0 11.7 13.3 11.6 12.1 12.0 12.3 11.2 12.1
Physics
All publishing centers 100.0 100.0 100.0 100.0 100.0 100.0 100.0 100.0 100.0 100.0 100.0 100.0
United States 60.4 57.5 57.3 53.5 51.0 48.4 48.0 45.9 43.0 43.0 42.2 40.4
EU-15 23.9 25.5 26.5 28.8 29.5 30.2 30.2 32.5 34.1 34.1 34.8 33.8
Japan 6.2 7.3 6.5 6.0 6.6 7.3 7.9 9.0 9.7 9.7 8.4 9.6
East Asia-4 0.4 0.3 0.3 0.4 0.5 0.8 0.8 1.1 1.6 1.3 1.8 4.0
All other 9.1 9.5 9.4 11.2 12.4 13.3 13.1 11.5 11.6 12.0 12.9 12.2
APPENDIX TABLE 6. World share of top 1% cited articles (fractional counts) of major S&E publishing centers, by field: 1992–2003
49

(Percent distribution)
Field and publishing center 1992 1993 1994 1995 1996 1997 1998 1999 2000 2001 2002 2003
APPENDIX TABLE 6. World share of top 1% cited articles (fractional counts) of major S&E publishing centers, by field: 1992–2003
Earth/space sciencesAll publishing centers 100.0 100.0 100.0 100.0 100.0 100.0 100.0 100.0 100.0 100.0 100.0 100.0
United States 60.1 58.7 63.9 63.0 64.2 62.4 61.5 57.9 56.0 55.8 55.2 53.5
EU-15 22.4 24.1 21.5 21.8 22.6 25.1 25.6 28.9 30.2 31.3 31.6 32.6
Japan 2.7 2.7 1.5 1.6 1.5 1.9 2.1 2.6 3.2 2.0 2.2 1.9
East Asia-4 0.0 0.3 0.1 0.1 0.2 0.1 0.3 0.2 0.3 0.2 0.2 0.8
All other 14.9 14.1 13.1 13.4 11.6 10.4 10.5 10.5 10.4 10.7 10.8 11.2
Engineering/technology
All publishing centers 100.0 100.0 100.0 100.0 100.0 100.0 100.0 100.0 100.0 100.0 100.0 100.0
United States 63.3 61.7 65.4 58.2 53.1 49.2 52.6 46.8 50.2 46.0 45.3 45.4
EU-15 17.9 23.5 19.0 22.7 23.9 27.0 23.6 27.2 25.6 29.2 25.5 25.9
Japan 8.6 7.7 8.4 10.6 10.6 10.1 10.6 11.5 10.9 10.2 11.7 9.5
East Asia-4 0.9 0.8 1.1 0.8 1.5 1.7 2.7 4.2 2.6 3.2 6.4 7.2
All other 9.4 6.3 6.1 7.6 10.9 12.1 10.6 10.3 10.7 11.4 11.2 11.9
Mathematics
All publishing centers 100.0 100.0 100.0 100.0 100.0 100.0 100.0 100.0 100.0 100.0 100.0 100.0
United States 60.2 62.8 63.5 53.0 56.5 57.6 62.3 54.2 59.0 50.1 49.7 51.2
EU-15 28.0 25.6 26.4 29.7 32.3 26.4 23.7 31.7 28.9 35.5 34.9 33.9
Japan 2.4 3.7 2.8 4.3 1.0 2.1 0.5 0.5 1.2 2.1 1.5 1.7
East Asia-4 1.3 1.2 0.5 0.9 0.9 0.2 1.5 3.0 1.2 2.3 3.4 5.6
All other 8.1 6.7 6.8 12.1 9.4 13.6 12.0 10.6 9.7 10.0 10.5 7.6
Psychology
All publishing centers 100.0 100.0 100.0 100.0 100.0 100.0 100.0 100.0 100.0 100.0 100.0 100.0
United States 82.5 74.8 76.6 78.6 77.6 77.8 75.2 73.2 71.6 73.7 71.2 68.4
EU-15 8.6 13.4 13.7 10.0 10.4 11.8 13.6 16.1 16.5 15.5 18.1 23.4
Japan 0.1 0.0 0.0 0.1 0.3 0.4 0.0 0.2 0.4 0.8 0.7 0.3
East Asia-4 0.0 0.2 0.1 0.0 0.0 0.0 0.1 0.4 0.2 0.3 0.3 0.3
All other 8.8 11.7 9.6 11.3 11.7 10.0 11.0 10.1 11.2 9.7 9.7 7.6
Social sciences
All publishing centers 100.0 100.0 100.0 100.0 100.0 100.0 100.0 100.0 100.0 100.0 100.0 100.0
United States 82.9 84.2 80.4 79.3 78.1 79.4 74.5 75.2 72.3 73.6 75.2 71.5
EU-15 10.7 9.3 13.1 13.7 15.9 13.2 18.4 18.6 20.4 19.2 19.0 22.7
Japan 0.7 0.2 0.4 0.2 0.2 0.5 0.3 0.2 0.2 0.3 0.1 0.1
East Asia-4 0.0 0.2 0.1 0.4 0.4 0.7 0.5 0.6 1.0 0.8 0.8 0.6
All other 5.7 6.2 6.0 6.4 5.4 6.3 6.3 5.5 6.2 6.1 4.9 5.0
S&E = science and engineering; EU = European Union.
NOTES: Citations are references to scientific articles in journals covered by Science Citation Index (SCI) and Social Sciences Citation Index (SSCI). Top 1% of cited articles based on a 3-year period with a 2-year
lag (e.g., for 2003, top 1% cited articles are articles published in 1999–2001 that were among the top 1% in citations in articles published in 2003). Actual number of articles in top 1% is ordinarily less than 1%
because articles with same frequency of citation that exceed top 1% are not included. Articles on fractional-count basis, i.e., for articles with collaborating institutions from multiple publishing centers, each publishing
center receives fractional credit on basis of proportion of its participating institutions. "All fields" includes health sciences and professional fields. Biology includes agricultural sciences. Engineering/technology includes
computer sciences. East Asia-4 includes China, Singapore, South Korea, and Taiwan. China includes Hong Kong.
SOURCES: Thomson ISI, SCI and SSCI, http://www.isinet.com/products/citation/; ipIQ, Inc.; and National Science Foundation, Division of Science Resources Statistics, special tabulations.
50

APPENDIX TABLE 7. World share of top 10% cited articles (fractional counts) of major S&E publishing centers, by field: 1992–2003(Percent distribution)
Field and publishing center 1992 1993 1994 1995 1996 1997 1998 1999 2000 2001 2002 2003
All fieldsAll publishing centers 100.0 100.0 100.0 100.0 100.0 100.0 100.0 100.0 100.0 100.0 100.0 100.0
United States 56.0 55.6 54.6 53.7 52.7 51.5 50.8 49.7 48.9 47.2 46.7 46.5
EU-15 27.3 27.9 28.4 29.0 29.8 30.5 30.9 31.5 31.8 32.7 32.5 32.3
Japan 5.7 5.6 5.8 5.7 5.7 5.9 5.9 6.1 6.4 6.6 6.6 6.6
East Asia-4 0.4 0.4 0.5 0.6 0.7 0.7 0.9 1.1 1.3 1.4 2.0 2.4
All other 10.6 10.5 10.7 11.0 11.1 11.4 11.5 11.6 11.7 12.0 12.2 12.2
Clinical medicine
All publishing centers 100.0 100.0 100.0 100.0 100.0 100.0 100.0 100.0 100.0 100.0 100.0 100.0
United States 55.7 55.5 55.8 54.5 53.4 53.2 52.2 51.6 50.5 49.4 49.0 48.7
EU-15 29.0 29.4 29.0 29.9 30.8 31.1 31.7 32.0 32.3 33.1 33.3 33.2
Japan 4.5 4.6 4.8 4.8 5.1 5.0 5.1 5.3 5.4 5.6 5.5 5.5
East Asia-4 0.3 0.3 0.4 0.5 0.5 0.5 0.5 0.6 0.8 0.9 1.2 1.5
All other 10.4 10.2 9.9 10.3 10.2 10.2 10.4 10.5 11.0 11.0 11.0 11.2
Biomedical research
All publishing centers 100.0 100.0 100.0 100.0 100.0 100.0 100.0 100.0 100.0 100.0 100.0 100.0
United States 61.8 61.5 60.9 60.5 60.1 59.4 60.4 59.3 59.0 56.9 56.8 55.8
EU-15 24.5 24.8 25.2 25.2 25.6 26.3 25.6 26.1 26.2 27.3 27.4 27.4
Japan 5.5 5.3 5.3 5.1 5.2 5.1 4.8 5.1 5.4 5.9 5.6 6.0
East Asia-4 0.1 0.2 0.2 0.3 0.2 0.3 0.3 0.4 0.5 0.6 0.8 1.1
All other 8.1 8.3 8.3 8.9 8.9 9.0 8.9 9.0 8.9 9.2 9.4 9.7
Biology
All publishing centers 100.0 100.0 100.0 100.0 100.0 100.0 100.0 100.0 100.0 100.0 100.0 100.0
United States 45.9 46.2 44.9 43.2 42.9 40.0 38.8 37.9 39.0 37.0 36.8 37.6
EU-15 28.0 28.0 28.2 30.3 31.1 32.6 34.6 35.5 36.1 37.1 37.3 36.3
Japan 4.5 4.3 5.1 4.8 4.6 5.0 4.8 4.9 4.4 4.8 4.7 4.8
East Asia-4 0.5 0.5 0.5 0.5 0.6 0.8 0.9 1.1 1.0 1.1 1.5 1.4
All other 21.2 21.0 21.3 21.3 20.8 21.5 20.9 20.6 19.5 20.0 19.7 19.9
Chemistry
All publishing centers 100.0 100.0 100.0 100.0 100.0 100.0 100.0 100.0 100.0 100.0 100.0 100.0
United States 47.7 47.4 45.5 45.6 43.7 41.0 39.9 38.3 37.0 38.2 37.5 37.1
EU-15 29.8 30.4 31.0 30.8 32.2 34.0 34.5 34.3 34.7 34.6 33.7 33.2
Japan 9.5 9.5 9.7 9.8 9.1 9.8 10.1 10.1 10.6 10.1 10.0 9.9
East Asia-4 1.0 1.3 1.5 1.4 1.8 2.1 2.6 3.4 3.7 3.5 4.9 6.0
All other 11.9 11.4 12.4 12.4 13.1 13.2 13.0 14.0 14.0 13.7 13.8 13.8
Physics
All publishing centers 100.0 100.0 100.0 100.0 100.0 100.0 100.0 100.0 100.0 100.0 100.0 100.0
United States 48.5 47.4 45.7 44.4 41.7 39.2 38.2 36.9 35.1 33.4 32.8 32.2
EU-15 30.2 30.7 32.0 32.9 34.8 35.4 35.8 37.0 37.8 37.5 37.2 36.2
Japan 8.8 8.9 8.7 8.7 8.6 8.7 8.9 9.4 9.6 10.4 10.2 11.1
East Asia-4 0.7 1.0 1.0 1.3 1.5 1.9 2.1 2.6 2.9 3.5 4.6 5.7
All other 11.8 12.1 12.6 12.9 13.4 14.8 14.9 14.1 14.6 15.1 15.1 14.7
Earth/space sciences
All publishing centers 100.0 100.0 100.0 100.0 100.0 100.0 100.0 100.0 100.0 100.0 100.0 100.0
United States 57.0 57.0 56.0 58.9 55.8 53.9 53.4 51.5 50.8 49.1 46.7 46.6
EU-15 24.9 25.8 26.3 24.4 27.2 28.7 29.3 30.4 30.5 32.6 33.0 33.1
Japan 2.5 2.5 2.1 1.9 2.3 2.3 2.3 2.6 3.2 3.0 3.4 3.6
East Asia-4 0.3 0.4 0.3 0.3 0.3 0.5 0.7 0.6 1.0 1.0 1.3 1.9
All other 15.3 14.3 15.3 14.5 14.4 14.6 14.3 14.9 14.5 14.4 15.6 14.7
Engineering/technology
All publishing centers 100.0 100.0 100.0 100.0 100.0 100.0 100.0 100.0 100.0 100.0 100.0 100.0
United States 52.5 51.1 49.6 47.9 45.0 42.8 42.9 39.2 38.4 35.9 33.7 33.0
EU-15 23.7 25.1 25.3 25.9 27.5 28.3 27.7 29.8 29.7 31.0 30.2 29.5
Japan 10.4 9.3 10.1 10.3 10.3 10.0 10.8 10.6 10.9 10.8 11.6 11.4
East Asia-4 1.9 3.1 2.8 3.4 3.6 4.5 5.2 5.8 7.2 7.5 9.3 11.2
All other 11.6 11.4 12.3 12.5 13.5 14.4 13.4 14.5 13.8 14.8 15.3 14.9
51

APPENDIX TABLE 7. World share of top 10% cited articles (fractional counts) of major S&E publishing centers, by field: 1992–2003(Percent distribution)
Field and publishing center 1992 1993 1994 1995 1996 1997 1998 1999 2000 2001 2002 2003
Mathematics
All publishing centers 100.0 100.0 100.0 100.0 100.0 100.0 100.0 100.0 100.0 100.0 100.0 100.0
United States 53.6 55.3 55.2 52.2 51.6 49.8 49.7 45.3 43.3 40.5 39.2 39.8
EU-15 29.3 29.2 28.0 29.4 30.2 30.7 31.6 35.0 33.9 36.9 37.2 36.7
Japan 2.1 2.7 2.1 2.6 1.8 2.6 2.4 2.4 2.8 2.9 2.8 2.7
East Asia-4 1.3 1.0 1.4 2.2 2.4 2.5 3.1 3.2 4.9 5.2 5.9 7.2
All other 13.7 11.8 13.3 13.6 14.0 14.3 13.2 14.1 15.0 14.6 14.9 13.7
Psychology
All publishing centers 100.0 100.0 100.0 100.0 100.0 100.0 100.0 100.0 100.0 100.0 100.0 100.0
United States 71.2 73.1 70.7 69.2 69.2 68.2 67.4 67.0 66.5 64.3 62.0 60.5
EU-15 15.2 15.2 17.5 17.5 17.8 18.3 18.5 19.9 20.3 22.0 23.7 25.2
Japan 0.5 0.2 0.3 0.2 0.4 0.4 0.6 0.5 0.5 0.4 0.5 0.7
East Asia-4 0.4 0.2 0.1 0.1 0.2 0.3 0.2 0.3 0.4 0.4 0.6 0.5
All other 12.8 11.4 11.5 12.9 12.4 12.9 13.2 12.3 12.4 12.8 13.2 13.1
Social sciences
All publishing centers 100.0 100.0 100.0 100.0 100.0 100.0 100.0 100.0 100.0 100.0 100.0 100.0
United States 76.7 77.4 74.2 72.0 69.4 69.3 66.5 66.7 65.3 64.9 63.4 61.5
EU-15 12.8 12.9 15.1 17.5 19.8 20.2 22.2 21.8 23.8 24.2 25.7 26.5
Japan 0.6 0.5 0.6 0.4 0.4 0.3 0.2 0.4 0.4 0.3 0.3 0.4
East Asia-4 0.3 0.4 0.5 0.4 0.5 0.8 0.8 1.0 1.2 1.2 1.5 1.6
All other 9.6 8.8 9.7 9.7 9.9 9.5 10.2 10.0 9.3 9.5 9.1 10.0
S&E = science and engineering; EU = European Union.
NOTES: Citations are references to scientific articles in journals covered by Science Citation Index (SCI) and Social Sciences Citation Index (SSCI). Top 10% of cited articles
based on a 3-year period with a 2-year lag (e.g., for 2003, top 10% cited articles are articles published in 1999–2001 that were among the top 10% in citations in articles published
in 2003). Actual number of articles in top 10% is ordinarily less than 10% because articles with same frequency of citation that exceed top 10% are not included. Articles on
fractional-count basis, i.e., for articles with collaborating institutions from multiple publishing centers, each publishing center receives fractional credit on basis of proportion of its
participating institutions. "All fields" includes health sciences and professional fields. Biology includes agricultural sciences. Engineering/technology includes computer sciences.
East Asia-4 includes China, Singapore, South Korea, and Taiwan. China includes Hong Kong.
SOURCES: Thomson ISI, SCI and SSCI, http://www.isinet.com/products/citation/; ipIQ, Inc.; and National Science Foundation, Division of Science Resources Statistics, special
tabulations.
52

APPENDIX TABLE 8. World share of highly influential S&E articles (fractional counts) of major S&E publishing centers, by field: 1992–2003
(Percent distribution)
Field and publishing center 1992 1993 1994 1995 1996 1997 1998 1999 2000 2001 2002 2003
All fields
All publishing centers 100.0 100.0 100.0 100.0 100.0 100.0 100.0 100.0 100.0 100.0 100.0 100.0
United States 58.5 58.0 58.2 57.3 56.2 55.2 54.8 54.0 52.8 51.1 50.5 50.3
EU-15 26.2 26.7 26.8 27.1 28.0 28.8 29.0 29.4 29.8 30.9 31.1 30.7
Japan 5.3 5.3 5.2 5.2 5.2 5.2 5.2 5.4 5.7 6.0 5.9 6.0
East Asia-4 0.3 0.3 0.3 0.4 0.4 0.5 0.5 0.7 0.9 1.1 1.5 1.9
All other 9.8 9.7 9.5 10.0 10.1 10.4 10.4 10.5 10.8 10.9 11.0 11.0
Clinical medicine
All publishing centers 100.0 100.0 100.0 100.0 100.0 100.0 100.0 100.0 100.0 100.0 100.0 100.0
United States 58.2 58.2 58.3 57.5 56.1 55.8 55.3 54.6 53.4 52.1 51.6 51.5
EU-15 27.7 28.0 27.9 28.2 29.1 29.8 30.2 30.2 30.7 31.8 32.1 31.8
Japan 4.1 4.2 4.4 4.5 4.6 4.5 4.4 4.6 4.8 5.1 4.9 4.8
East Asia-4 0.2 0.3 0.3 0.4 0.4 0.4 0.4 0.6 0.6 0.7 0.9 1.2
All other 9.8 9.3 9.1 9.4 9.7 9.5 9.8 10.0 10.5 10.3 10.5 10.7
Biomedical research
All publishing centers 100.0 100.0 100.0 100.0 100.0 100.0 100.0 100.0 100.0 100.0 100.0 100.0
United States 64.9 64.2 63.7 63.5 63.2 62.5 63.1 61.7 62.1 59.5 59.4 58.8
EU-15 22.8 23.2 23.9 23.5 23.7 24.2 24.0 24.7 24.0 25.9 25.7 25.9
Japan 4.9 4.9 4.8 4.7 4.7 4.8 4.5 4.8 5.2 5.5 5.4 5.8
East Asia-4 0.1 0.1 0.1 0.2 0.2 0.2 0.3 0.3 0.4 0.5 0.7 0.8
All other 7.4 7.5 7.6 8.1 8.1 8.4 8.2 8.5 8.3 8.7 8.8 8.7
Biology
All publishing centers 100.0 100.0 100.0 100.0 100.0 100.0 100.0 100.0 100.0 100.0 100.0 100.0
United States 47.7 47.8 49.0 47.5 46.8 43.5 42.0 41.0 40.4 38.5 39.7 39.0
EU-15 27.2 28.3 27.5 29.3 30.5 32.5 34.1 34.8 35.7 36.7 37.1 36.3
Japan 4.1 3.8 4.3 3.9 3.8 4.1 4.0 4.5 4.1 4.5 4.3 4.6
East Asia-4 0.4 0.4 0.3 0.3 0.4 0.4 0.7 0.9 1.0 1.1 1.2 1.2
All other 20.6 19.7 18.9 19.0 18.5 19.5 19.2 18.8 18.8 19.2 17.7 18.9
Chemistry
All publishing centers 100.0 100.0 100.0 100.0 100.0 100.0 100.0 100.0 100.0 100.0 100.0 100.0
United States 51.6 54.9 52.6 52.0 50.0 47.4 46.3 44.3 46.4 43.7 43.0 42.3
EU-15 28.0 27.3 28.0 28.0 29.1 31.1 31.2 31.9 30.5 31.8 31.7 31.5
Japan 8.7 7.9 8.1 8.4 7.9 8.3 9.0 8.7 8.8 9.1 8.8 8.9
East Asia-4 0.9 0.7 0.9 0.9 1.3 1.5 1.7 2.4 2.3 2.9 3.7 5.0
All other 10.8 9.2 10.4 10.8 11.7 11.7 11.8 12.7 11.9 12.6 12.7 12.3
Physics
All publishing centers 100.0 100.0 100.0 100.0 100.0 100.0 100.0 100.0 100.0 100.0 100.0 100.0
United States 51.9 51.9 49.8 48.5 46.1 42.4 41.5 39.8 37.7 36.5 37.1 34.9
EU-15 28.9 28.8 30.6 31.8 33.0 34.0 34.8 36.2 37.3 37.0 36.3 35.7
Japan 7.9 8.0 7.4 7.5 7.7 8.2 8.1 8.9 9.2 10.0 9.5 10.9
East Asia-4 0.5 0.7 0.6 0.9 1.0 1.3 1.7 2.0 2.5 2.8 3.5 4.9
All other 10.8 10.5 11.5 11.4 12.1 14.2 13.9 13.1 13.4 13.7 13.6 13.7
Earth/space sciences
All publishing centers 100.0 100.0 100.0 100.0 100.0 100.0 100.0 100.0 100.0 100.0 100.0 100.0
United States 60.0 59.1 59.5 61.6 59.7 56.4 55.8 54.9 53.1 52.1 50.8 49.3
EU-15 22.9 24.8 24.4 23.2 25.0 28.9 28.1 28.9 30.0 31.8 32.1 32.8
Japan 2.3 2.1 1.7 1.5 1.9 1.9 2.4 2.5 3.1 2.8 2.5 3.2
East Asia-4 0.2 0.3 0.2 0.4 0.4 0.4 0.3 0.4 0.6 0.6 1.1 1.5
All other 14.6 13.8 14.1 13.3 13.0 12.3 13.3 13.3 13.2 12.7 13.5 13.3
Engineering/technology
All publishing centers 100.0 100.0 100.0 100.0 100.0 100.0 100.0 100.0 100.0 100.0 100.0 100.0
United States 55.3 54.6 53.2 51.1 46.9 45.4 44.9 41.1 40.7 38.5 36.6 35.7
EU-15 23.7 24.4 23.7 25.8 27.6 28.4 27.4 30.1 29.8 30.6 29.3 28.9
Japan 9.8 9.2 9.7 9.5 10.3 9.8 10.9 10.5 10.9 11.1 11.7 11.5
East Asia-4 1.4 2.1 2.2 2.3 3.1 3.6 4.2 5.0 5.9 6.4 8.7 10.3
All other 9.9 9.7 11.3 11.3 12.1 12.7 12.5 13.3 12.7 13.4 13.7 13.6
53
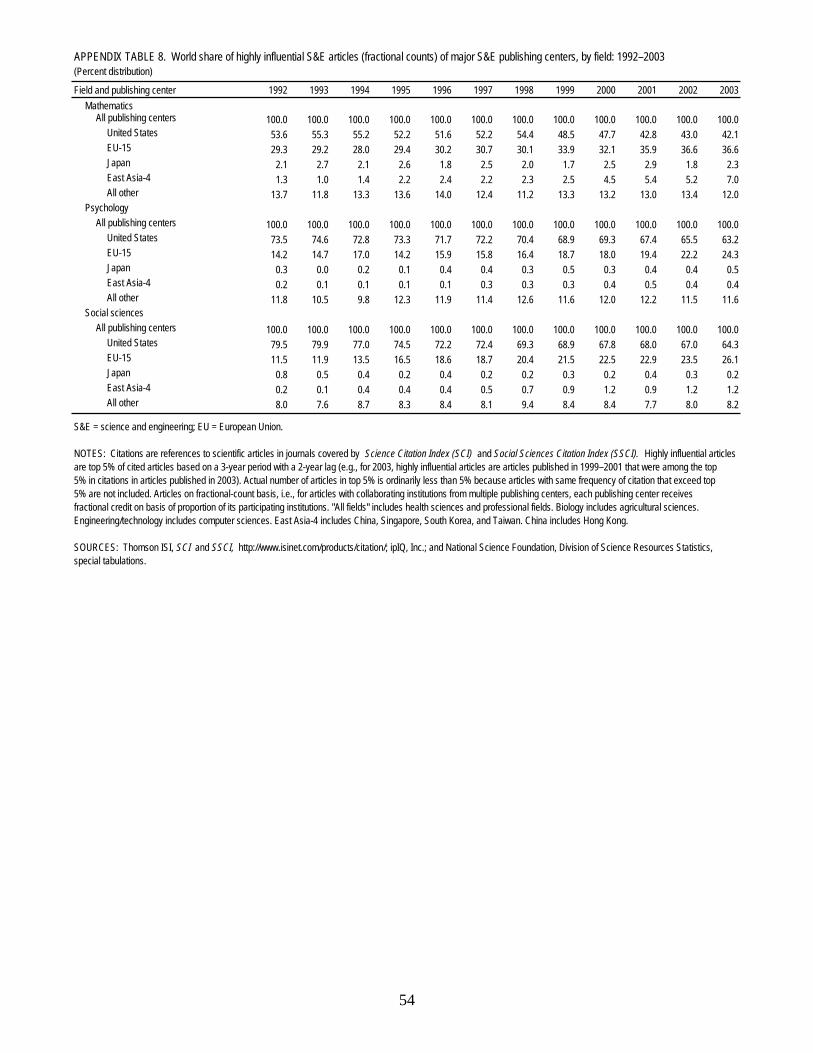
APPENDIX TABLE 8. World share of highly influential S&E articles (fractional counts) of major S&E publishing centers, by field: 1992–2003
(Percent distribution)
Field and publishing center 1992 1993 1994 1995 1996 1997 1998 1999 2000 2001 2002 2003
MathematicsAll publishing centers 100.0 100.0 100.0 100.0 100.0 100.0 100.0 100.0 100.0 100.0 100.0 100.0
United States 53.6 55.3 55.2 52.2 51.6 52.2 54.4 48.5 47.7 42.8 43.0 42.1
EU-15 29.3 29.2 28.0 29.4 30.2 30.7 30.1 33.9 32.1 35.9 36.6 36.6
Japan 2.1 2.7 2.1 2.6 1.8 2.5 2.0 1.7 2.5 2.9 1.8 2.3
East Asia-4 1.3 1.0 1.4 2.2 2.4 2.2 2.3 2.5 4.5 5.4 5.2 7.0
All other 13.7 11.8 13.3 13.6 14.0 12.4 11.2 13.3 13.2 13.0 13.4 12.0
Psychology
All publishing centers 100.0 100.0 100.0 100.0 100.0 100.0 100.0 100.0 100.0 100.0 100.0 100.0
United States 73.5 74.6 72.8 73.3 71.7 72.2 70.4 68.9 69.3 67.4 65.5 63.2
EU-15 14.2 14.7 17.0 14.2 15.9 15.8 16.4 18.7 18.0 19.4 22.2 24.3
Japan 0.3 0.0 0.2 0.1 0.4 0.4 0.3 0.5 0.3 0.4 0.4 0.5
East Asia-4 0.2 0.1 0.1 0.1 0.1 0.3 0.3 0.3 0.4 0.5 0.4 0.4
All other 11.8 10.5 9.8 12.3 11.9 11.4 12.6 11.6 12.0 12.2 11.5 11.6
Social sciences
All publishing centers 100.0 100.0 100.0 100.0 100.0 100.0 100.0 100.0 100.0 100.0 100.0 100.0
United States 79.5 79.9 77.0 74.5 72.2 72.4 69.3 68.9 67.8 68.0 67.0 64.3
EU-15 11.5 11.9 13.5 16.5 18.6 18.7 20.4 21.5 22.5 22.9 23.5 26.1
Japan 0.8 0.5 0.4 0.2 0.4 0.2 0.2 0.3 0.2 0.4 0.3 0.2
East Asia-4 0.2 0.1 0.4 0.4 0.4 0.5 0.7 0.9 1.2 0.9 1.2 1.2
All other 8.0 7.6 8.7 8.3 8.4 8.1 9.4 8.4 8.4 7.7 8.0 8.2
S&E = science and engineering; EU = European Union.
NOTES: Citations are references to scientific articles in journals covered by Science Citation Index (SCI) and Social Sciences Citation Index (SSCI). Highly influential articles
are top 5% of cited articles based on a 3-year period with a 2-year lag (e.g., for 2003, highly influential articles are articles published in 1999–2001 that were among the top
5% in citations in articles published in 2003). Actual number of articles in top 5% is ordinarily less than 5% because articles with same frequency of citation that exceed top
5% are not included. Articles on fractional-count basis, i.e., for articles with collaborating institutions from multiple publishing centers, each publishing center receives
fractional credit on basis of proportion of its participating institutions. "All fields" includes health sciences and professional fields. Biology includes agricultural sciences.
Engineering/technology includes computer sciences. East Asia-4 includes China, Singapore, South Korea, and Taiwan. China includes Hong Kong.
SOURCES: Thomson ISI, SCI and SSCI, http://www.isinet.com/products/citation/; ipIQ, Inc.; and National Science Foundation, Division of Science Resources Statistics,
special tabulations.
54

APPENDIX TABLE 9. World share of highly influential S&E articles (whole counts) of major S&E publishing centers, by field: 1992–2003
(Percent)
Field and publishing center 1992 1993 1994 1995 1996 1997 1998 1999 2000 2001 2002 2003
All fieldsUnited States 62.8 62.5 63.2 62.7 62.0 61.2 61.3 60.8 59.9 58.5 58.1 58.0
EU-15 30.1 31.0 31.5 32.1 33.5 34.7 35.3 36.1 36.8 38.2 38.4 38.2
Japan 6.0 6.1 6.1 6.2 6.3 6.4 6.5 6.8 7.2 7.6 7.5 7.7
East Asia-4 0.4 0.5 0.5 0.7 0.7 0.8 0.9 1.2 1.4 1.6 2.2 2.7
Clinical medicine
United States 62.1 62.2 62.7 62.2 61.2 61.4 61.2 61.0 60.2 59.1 58.9 59.2
EU-15 31.4 31.7 31.9 32.5 34.0 35.0 35.9 36.3 37.2 38.5 39.1 39.0
Japan 4.7 4.8 5.2 5.5 5.6 5.5 5.6 5.8 6.0 6.3 6.3 6.2
East Asia-4 0.3 0.4 0.5 0.6 0.6 0.6 0.6 0.9 0.9 1.2 1.5 1.8
Biomedical research
United States 69.7 69.4 69.4 69.7 69.8 69.4 70.3 69.2 69.9 67.9 68.1 67.7
EU-15 27.2 27.9 29.0 29.2 29.9 30.7 30.7 31.9 31.5 33.9 33.8 34.3
Japan 5.7 5.9 6.0 5.9 6.0 6.2 6.1 6.5 7.2 7.4 7.4 8.1
East Asia-4 0.2 0.2 0.2 0.3 0.4 0.4 0.6 0.7 0.9 1.0 1.3 1.4
Biology
United States 51.0 51.4 52.5 51.4 50.9 47.7 46.5 46.2 45.7 43.8 45.5 44.9
EU-15 30.1 31.2 31.3 33.5 34.7 36.9 38.8 40.0 41.4 42.7 43.3 42.4
Japan 4.5 4.2 4.9 4.4 4.3 4.7 4.6 5.3 5.0 5.4 5.2 5.5
East Asia-4 0.6 0.5 0.5 0.6 0.7 0.6 1.0 1.2 1.4 1.7 1.8 1.8
Chemistry
United States 51.2 53.7 51.5 51.0 48.4 45.5 44.9 43.0 44.1 41.5 41.5 41.0
EU-15 31.6 31.6 33.0 33.2 35.4 37.7 37.8 39.3 38.2 39.5 38.9 38.2
Japan 9.9 9.6 9.7 9.8 9.6 10.0 10.6 10.2 10.9 11.2 10.8 10.7
East Asia-4 1.1 1.0 1.3 1.3 1.8 2.0 2.3 3.2 3.3 4.0 5.1 6.7
Physics
United States 57.6 58.0 56.7 55.9 53.9 50.6 50.0 48.4 46.4 45.4 45.9 43.4
EU-15 34.2 35.2 37.9 39.5 41.3 42.9 44.1 45.8 47.5 47.5 46.4 45.5
Japan 8.8 9.0 8.7 9.1 9.5 10.2 10.3 11.2 11.8 12.8 12.2 13.4
East Asia-4 0.9 1.0 1.0 1.6 1.9 2.5 2.9 3.3 3.9 4.4 5.3 6.9
Earth/space sciences
United States 68.4 67.4 73.5 75.0 76.5 75.1 74.9 73.8 71.6 71.5 71.0 71.8
EU-15 31.2 33.3 32.9 33.4 33.2 38.3 39.0 44.5 45.4 47.2 48.2 50.7
Japan 3.7 4.0 2.4 2.8 2.2 3.2 3.7 4.9 5.9 4.0 4.3 4.8
East Asia-4 0.2 1.0 0.5 0.6 0.3 0.4 0.9 0.7 1.0 0.7 0.7 1.9
Engineering/technology
United States 58.3 57.7 56.6 54.6 50.9 49.4 49.3 45.5 45.5 43.3 41.8 40.5
EU-15 26.3 27.0 26.5 28.9 31.1 32.3 31.3 34.5 34.4 35.4 34.5 33.9
Japan 10.5 9.9 10.5 10.2 11.2 10.8 12.4 11.9 12.5 12.7 13.4 12.9
East Asia-4 1.8 2.6 2.8 3.0 3.8 4.3 5.4 6.2 7.2 7.7 10.0 11.6
Mathematics
United States 60.3 62.9 62.5 61.6 60.7 60.7 62.9 55.9 56.2 52.6 52.0 51.7
EU-15 35.3 35.3 34.7 37.4 37.7 38.3 37.7 42.3 41.1 45.0 45.0 45.8
Japan 2.8 3.3 2.5 3.4 2.3 3.0 2.5 2.4 3.0 3.4 2.3 3.0
East Asia-4 1.7 1.5 1.9 3.0 3.3 2.7 3.2 3.4 5.6 7.1 7.6 9.4
Psychology
United States 76.4 77.6 75.5 76.4 75.0 75.7 74.8 73.7 74.2 72.3 70.3 68.0
EU-15 16.3 16.7 18.8 16.1 18.4 18.7 19.3 22.1 21.5 23.1 25.7 28.3
Japan 0.4 0.1 0.4 0.1 0.7 0.7 0.5 0.7 0.7 0.9 0.8 1.0
East Asia-4 0.3 0.2 0.2 0.1 0.2 0.5 0.5 0.6 0.7 1.0 0.7 0.8
55

APPENDIX TABLE 9. World share of highly influential S&E articles (whole counts) of major S&E publishing centers, by field: 1992–2003
(Percent)
Field and publishing center 1992 1993 1994 1995 1996 1997 1998 1999 2000 2001 2002 2003
Social sciences
United States 83.0 83.3 81.4 78.7 76.7 76.8 74.1 73.7 72.2 72.7 71.7 69.1
EU-15 13.4 13.7 16.1 19.2 21.3 21.5 23.4 24.7 25.2 26.3 27.1 30.0
Japan 0.9 0.8 0.8 0.5 0.5 0.4 0.3 0.5 0.5 0.7 0.4 0.3
East Asia-4 0.4 0.2 0.8 0.7 0.8 0.9 1.1 1.3 1.7 1.4 1.6 1.6
S&E = science and engineering; EU = European Union.
NOTES: Citations are references to scientific articles in journals covered by Science Citation Index (SCI) and Social Sciences Citation Index (SSCI). Highly influential
articles are top 5% of cited articles based on a 3-year period with a 2-year lag (e.g., for 2003, highly influential articles are articles published in 1999–2001 that were
among the top 5% in citations in articles published in 2003). Actual number of articles in top 5% is ordinarily less than 5% because articles with same frequency of citation
that exceed top 5% are not included. Articles on whole-count basis, i.e., for articles with collaborating institutions from multiple publishing centers, each publishing center
receives one count for its participation, regardless of the number of its participating institutions. Shares may add to more than 100% because articles with institutional
authors from multiple publishing centers are counted once for each publishing center. "All fields" includes health sciences and professional fields. Biology includes
agricultural sciences. Engineering/technology includes computer sciences. East Asia-4 includes China, Singapore, South Korea, and Taiwan. China includes Hong Kong.
SOURCES: Thomson ISI, SCI and SSCI, http://www.isinet.com/products/citation/; ipIQ, Inc.; and National Science Foundation, Division of Science Resources Statistics,
special tabulations.
56
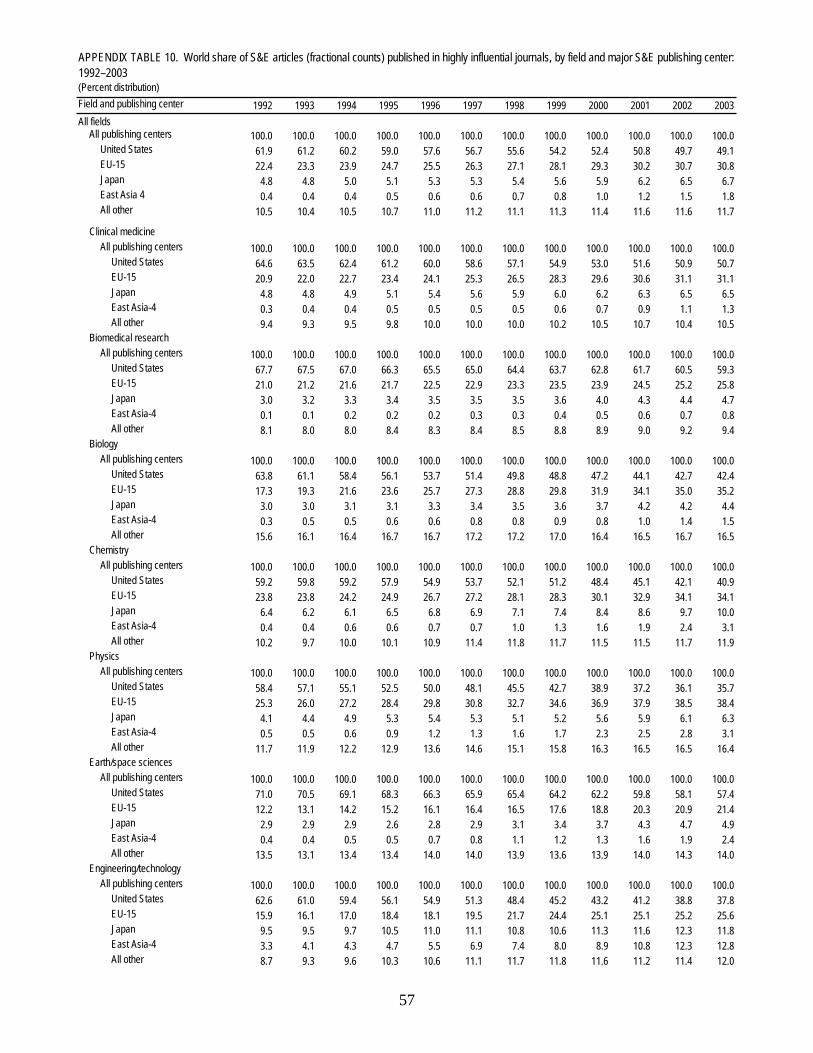
(Percent distribution)
Field and publishing center 1992 1993 1994 1995 1996 1997 1998 1999 2000 2001 2002 2003
All fieldsAll publishing centers 100.0 100.0 100.0 100.0 100.0 100.0 100.0 100.0 100.0 100.0 100.0 100.0
United States 61.9 61.2 60.2 59.0 57.6 56.7 55.6 54.2 52.4 50.8 49.7 49.1
EU-15 22.4 23.3 23.9 24.7 25.5 26.3 27.1 28.1 29.3 30.2 30.7 30.8
Japan 4.8 4.8 5.0 5.1 5.3 5.3 5.4 5.6 5.9 6.2 6.5 6.7
East Asia 4 0.4 0.4 0.4 0.5 0.6 0.6 0.7 0.8 1.0 1.2 1.5 1.8
All other 10.5 10.4 10.5 10.7 11.0 11.2 11.1 11.3 11.4 11.6 11.6 11.7
Clinical medicine
All publishing centers 100.0 100.0 100.0 100.0 100.0 100.0 100.0 100.0 100.0 100.0 100.0 100.0
United States 64.6 63.5 62.4 61.2 60.0 58.6 57.1 54.9 53.0 51.6 50.9 50.7
EU-15 20.9 22.0 22.7 23.4 24.1 25.3 26.5 28.3 29.6 30.6 31.1 31.1
Japan 4.8 4.8 4.9 5.1 5.4 5.6 5.9 6.0 6.2 6.3 6.5 6.5
East Asia-4 0.3 0.4 0.4 0.5 0.5 0.5 0.5 0.6 0.7 0.9 1.1 1.3
All other 9.4 9.3 9.5 9.8 10.0 10.0 10.0 10.2 10.5 10.7 10.4 10.5
Biomedical research
All publishing centers 100.0 100.0 100.0 100.0 100.0 100.0 100.0 100.0 100.0 100.0 100.0 100.0
United States 67.7 67.5 67.0 66.3 65.5 65.0 64.4 63.7 62.8 61.7 60.5 59.3
EU-15 21.0 21.2 21.6 21.7 22.5 22.9 23.3 23.5 23.9 24.5 25.2 25.8
Japan 3.0 3.2 3.3 3.4 3.5 3.5 3.5 3.6 4.0 4.3 4.4 4.7
East Asia-4 0.1 0.1 0.2 0.2 0.2 0.3 0.3 0.4 0.5 0.6 0.7 0.8
All other 8.1 8.0 8.0 8.4 8.3 8.4 8.5 8.8 8.9 9.0 9.2 9.4
Biology
All publishing centers 100.0 100.0 100.0 100.0 100.0 100.0 100.0 100.0 100.0 100.0 100.0 100.0
United States 63.8 61.1 58.4 56.1 53.7 51.4 49.8 48.8 47.2 44.1 42.7 42.4
EU-15 17.3 19.3 21.6 23.6 25.7 27.3 28.8 29.8 31.9 34.1 35.0 35.2
Japan 3.0 3.0 3.1 3.1 3.3 3.4 3.5 3.6 3.7 4.2 4.2 4.4
East Asia-4 0.3 0.5 0.5 0.6 0.6 0.8 0.8 0.9 0.8 1.0 1.4 1.5
All other 15.6 16.1 16.4 16.7 16.7 17.2 17.2 17.0 16.4 16.5 16.7 16.5
Chemistry
All publishing centers 100.0 100.0 100.0 100.0 100.0 100.0 100.0 100.0 100.0 100.0 100.0 100.0
United States 59.2 59.8 59.2 57.9 54.9 53.7 52.1 51.2 48.4 45.1 42.1 40.9
EU-15 23.8 23.8 24.2 24.9 26.7 27.2 28.1 28.3 30.1 32.9 34.1 34.1
Japan 6.4 6.2 6.1 6.5 6.8 6.9 7.1 7.4 8.4 8.6 9.7 10.0
East Asia-4 0.4 0.4 0.6 0.6 0.7 0.7 1.0 1.3 1.6 1.9 2.4 3.1
All other 10.2 9.7 10.0 10.1 10.9 11.4 11.8 11.7 11.5 11.5 11.7 11.9
Physics
All publishing centers 100.0 100.0 100.0 100.0 100.0 100.0 100.0 100.0 100.0 100.0 100.0 100.0
United States 58.4 57.1 55.1 52.5 50.0 48.1 45.5 42.7 38.9 37.2 36.1 35.7
EU-15 25.3 26.0 27.2 28.4 29.8 30.8 32.7 34.6 36.9 37.9 38.5 38.4
Japan 4.1 4.4 4.9 5.3 5.4 5.3 5.1 5.2 5.6 5.9 6.1 6.3
East Asia-4 0.5 0.5 0.6 0.9 1.2 1.3 1.6 1.7 2.3 2.5 2.8 3.1
All other 11.7 11.9 12.2 12.9 13.6 14.6 15.1 15.8 16.3 16.5 16.5 16.4
Earth/space sciences
All publishing centers 100.0 100.0 100.0 100.0 100.0 100.0 100.0 100.0 100.0 100.0 100.0 100.0
United States 71.0 70.5 69.1 68.3 66.3 65.9 65.4 64.2 62.2 59.8 58.1 57.4
EU-15 12.2 13.1 14.2 15.2 16.1 16.4 16.5 17.6 18.8 20.3 20.9 21.4
Japan 2.9 2.9 2.9 2.6 2.8 2.9 3.1 3.4 3.7 4.3 4.7 4.9
East Asia-4 0.4 0.4 0.5 0.5 0.7 0.8 1.1 1.2 1.3 1.6 1.9 2.4
All other 13.5 13.1 13.4 13.4 14.0 14.0 13.9 13.6 13.9 14.0 14.3 14.0
Engineering/technology
All publishing centers 100.0 100.0 100.0 100.0 100.0 100.0 100.0 100.0 100.0 100.0 100.0 100.0
United States 62.6 61.0 59.4 56.1 54.9 51.3 48.4 45.2 43.2 41.2 38.8 37.8
EU-15 15.9 16.1 17.0 18.4 18.1 19.5 21.7 24.4 25.1 25.1 25.2 25.6
Japan 9.5 9.5 9.7 10.5 11.0 11.1 10.8 10.6 11.3 11.6 12.3 11.8
East Asia-4 3.3 4.1 4.3 4.7 5.5 6.9 7.4 8.0 8.9 10.8 12.3 12.8
All other 8.7 9.3 9.6 10.3 10.6 11.1 11.7 11.8 11.6 11.2 11.4 12.0
APPENDIX TABLE 10. World share of S&E articles (fractional counts) published in highly influential journals, by field and major S&E publishing center:
1992–2003
57
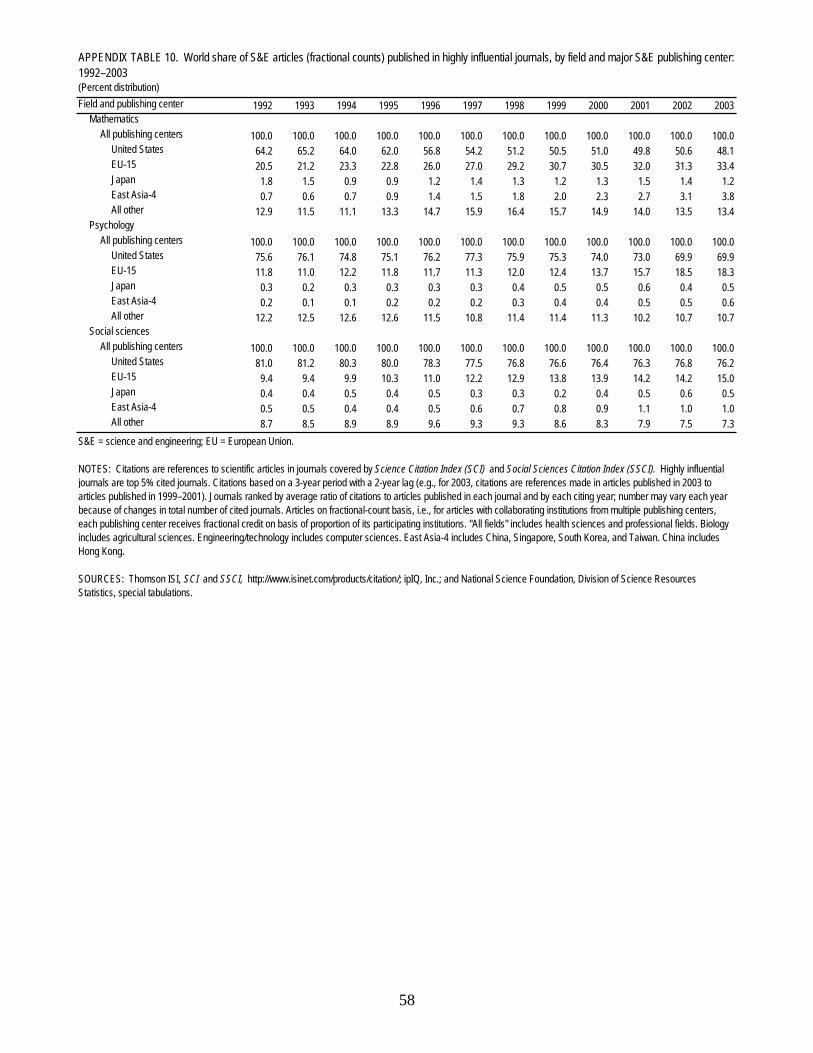
(Percent distribution)
Field and publishing center 1992 1993 1994 1995 1996 1997 1998 1999 2000 2001 2002 2003
APPENDIX TABLE 10. World share of S&E articles (fractional counts) published in highly influential journals, by field and major S&E publishing center:
1992–2003
Mathematics
All publishing centers 100.0 100.0 100.0 100.0 100.0 100.0 100.0 100.0 100.0 100.0 100.0 100.0
United States 64.2 65.2 64.0 62.0 56.8 54.2 51.2 50.5 51.0 49.8 50.6 48.1
EU-15 20.5 21.2 23.3 22.8 26.0 27.0 29.2 30.7 30.5 32.0 31.3 33.4
Japan 1.8 1.5 0.9 0.9 1.2 1.4 1.3 1.2 1.3 1.5 1.4 1.2
East Asia-4 0.7 0.6 0.7 0.9 1.4 1.5 1.8 2.0 2.3 2.7 3.1 3.8
All other 12.9 11.5 11.1 13.3 14.7 15.9 16.4 15.7 14.9 14.0 13.5 13.4
Psychology
All publishing centers 100.0 100.0 100.0 100.0 100.0 100.0 100.0 100.0 100.0 100.0 100.0 100.0
United States 75.6 76.1 74.8 75.1 76.2 77.3 75.9 75.3 74.0 73.0 69.9 69.9
EU-15 11.8 11.0 12.2 11.8 11.7 11.3 12.0 12.4 13.7 15.7 18.5 18.3
Japan 0.3 0.2 0.3 0.3 0.3 0.3 0.4 0.5 0.5 0.6 0.4 0.5
East Asia-4 0.2 0.1 0.1 0.2 0.2 0.2 0.3 0.4 0.4 0.5 0.5 0.6
All other 12.2 12.5 12.6 12.6 11.5 10.8 11.4 11.4 11.3 10.2 10.7 10.7
Social sciences
All publishing centers 100.0 100.0 100.0 100.0 100.0 100.0 100.0 100.0 100.0 100.0 100.0 100.0
United States 81.0 81.2 80.3 80.0 78.3 77.5 76.8 76.6 76.4 76.3 76.8 76.2
EU-15 9.4 9.4 9.9 10.3 11.0 12.2 12.9 13.8 13.9 14.2 14.2 15.0
Japan 0.4 0.4 0.5 0.4 0.5 0.3 0.3 0.2 0.4 0.5 0.6 0.5
East Asia-4 0.5 0.5 0.4 0.4 0.5 0.6 0.7 0.8 0.9 1.1 1.0 1.0
All other 8.7 8.5 8.9 8.9 9.6 9.3 9.3 8.6 8.3 7.9 7.5 7.3
S&E = science and engineering; EU = European Union.
NOTES: Citations are references to scientific articles in journals covered by Science Citation Index (SCI) and Social Sciences Citation Index (SSCI). Highly influential
journals are top 5% cited journals. Citations based on a 3-year period with a 2-year lag (e.g., for 2003, citations are references made in articles published in 2003 to
articles published in 1999–2001). Journals ranked by average ratio of citations to articles published in each journal and by each citing year; number may vary each year
because of changes in total number of cited journals. Articles on fractional-count basis, i.e., for articles with collaborating institutions from multiple publishing centers,
each publishing center receives fractional credit on basis of proportion of its participating institutions. "All fields" includes health sciences and professional fields. Biology
includes agricultural sciences. Engineering/technology includes computer sciences. East Asia-4 includes China, Singapore, South Korea, and Taiwan. China includes
Hong Kong.
SOURCES: Thomson ISI, SCI and SSCI, http://www.isinet.com/products/citation/; ipIQ, Inc.; and National Science Foundation, Division of Science Resources
Statistics, special tabulations.
58

(Percent)
Publishing center and field 1992 1993 1994 1995 1996 1997 1998 1999 2000 2001 2002 2003
United States
All fields 7.8 7.7 7.8 7.8 7.8 7.8 7.9 8.0 8.0 7.9 8.0 8.1
Clinical medicine 7.4 7.4 7.5 7.4 7.3 7.4 7.4 7.4 7.5 7.4 7.5 7.5
Biomedical research 8.4 8.3 8.1 8.1 8.0 8.0 8.1 8.0 8.2 8.0 8.1 8.0
Biology 6.6 6.6 6.9 6.9 7.0 6.7 6.7 6.8 6.9 6.8 7.1 7.0
Chemistry 10.8 11.3 10.7 10.5 10.0 9.5 9.7 9.4 10.0 9.6 9.8 9.9
Physics 9.0 9.1 8.9 8.8 8.8 8.4 8.7 8.8 8.6 8.6 8.9 8.6
Earth/space sciences 7.6 7.6 7.7 7.9 7.8 7.4 7.5 7.5 7.5 7.5 7.5 7.5
Engineering/technology 5.8 5.7 6.1 5.8 5.3 5.3 5.4 5.6 5.9 6.1 6.5 6.7
Mathematics 6.7 6.9 7.0 6.7 6.9 7.2 7.9 7.4 7.6 7.2 7.4 7.7
Psychology 6.1 6.2 6.1 6.1 6.1 6.3 6.2 6.1 6.2 6.1 6.1 5.9
Social sciences 7.2 7.2 7.1 6.9 6.8 7.0 6.8 6.9 6.9 7.0 7.0 6.8
EU-15
All fields 4.5 4.6 4.5 4.5 4.5 4.5 4.5 4.5 4.5 4.7 4.7 4.7
Clinical medicine 4.0 4.0 4.0 4.0 4.1 4.1 4.1 4.1 4.1 4.3 4.3 4.3
Biomedical research 3.8 3.9 3.9 3.8 3.7 3.7 3.7 3.8 3.6 3.9 3.9 4.0
Biology 5.2 5.4 5.2 5.4 5.4 5.6 5.7 5.7 5.7 5.8 5.9 5.8
Chemistry 4.8 4.8 4.8 4.8 4.9 5.1 5.1 5.2 5.0 5.2 5.3 5.3
Physics 5.1 5.1 5.3 5.4 5.4 5.4 5.5 5.6 5.8 5.7 5.6 5.6
Earth/space sciences 4.2 4.5 4.4 4.1 4.3 4.8 4.5 4.5 4.5 4.7 4.7 4.9
Engineering/technology 3.8 3.8 4.0 4.1 4.2 4.2 4.1 4.6 4.6 4.8 4.8 4.8
Mathematics 4.9 4.9 4.6 4.7 4.6 4.5 4.4 4.8 4.5 4.9 5.0 5.0
Psychology 3.6 3.7 4.2 3.4 3.7 3.6 3.6 4.0 3.7 3.9 4.4 4.7
Social sciences 2.6 2.7 3.0 3.5 3.8 3.7 3.9 4.0 4.0 4.0 4.0 4.4
Japan
All fields 3.6 3.5 3.4 3.3 3.2 3.2 3.1 3.2 3.3 3.4 3.4 3.4
Clinical medicine 3.0 3.0 3.0 2.9 2.9 2.8 2.6 2.7 2.7 2.8 2.7 2.7
Biomedical research 3.3 3.2 3.1 2.9 2.9 2.9 2.8 2.9 3.1 3.2 3.1 3.4
Biology 3.1 2.7 3.1 2.7 2.5 2.7 2.6 3.0 2.7 2.9 2.8 3.0
Chemistry 4.5 4.2 4.2 4.2 4.1 4.2 4.5 4.2 4.4 4.5 4.3 4.3
Physics 3.9 3.9 3.5 3.5 3.5 3.7 3.6 3.8 3.8 4.1 3.9 4.3
Earth/space sciences 3.3 3.1 2.4 2.2 2.6 2.6 3.1 3.3 3.8 3.3 2.8 3.4
Engineering/technology 3.4 3.1 3.6 3.4 3.7 3.5 3.8 3.8 4.0 4.2 4.7 4.8
Mathematics 2.4 3.1 2.6 3.3 2.4 3.4 2.6 2.2 2.9 3.3 2.0 2.3
Psychology 0.9 0.1 0.7 0.2 1.3 1.0 0.8 1.2 0.8 1.1 1.0 1.3
Social sciences 3.0 2.0 1.7 1.0 1.5 0.9 1.0 1.3 0.9 1.2 0.9 0.8
East Asia-4
All fields 0.8 0.9 0.8 0.8 0.8 0.8 0.8 1.0 1.0 1.1 1.4 1.6
Clinical medicine 1.0 1.1 1.4 1.4 1.3 1.2 1.0 1.4 1.2 1.5 1.7 1.9
Biomedical research 0.5 0.9 0.8 0.9 0.8 0.7 0.9 0.9 0.9 0.9 1.0 1.1
Biology 2.1 1.7 1.4 1.2 1.5 1.2 1.9 2.1 1.9 2.0 1.9 1.8
Chemistry 2.0 1.4 1.6 1.4 1.7 1.7 1.8 2.2 2.0 2.1 2.4 2.8
APPENDIX TABLE 11. Share of S&E article output classified as highly influential (fractional counts), by major S&E publishing center and field:
1992–2003
59

(Percent)
Publishing center and field 1992 1993 1994 1995 1996 1997 1998 1999 2000 2001 2002 2003
APPENDIX TABLE 11. Share of S&E article output classified as highly influential (fractional counts), by major S&E publishing center and field:
1992–2003
Physics 0.7 0.9 0.8 0.9 1.0 1.1 1.4 1.4 1.6 1.6 2.0 2.5
Earth/space sciences 0.7 0.9 0.6 1.2 1.2 1.2 0.8 0.8 0.9 0.9 1.5 1.7
Engineering/technology 1.2 1.6 1.7 1.5 1.8 1.9 2.0 2.3 2.4 2.5 3.3 3.6
Mathematics 2.0 1.5 1.8 2.5 2.6 2.3 2.3 2.1 3.4 3.8 3.4 4.3
Psychology 2.0 1.4 1.1 0.8 0.8 2.0 1.8 2.0 2.1 2.6 1.6 1.8
Social sciences 1.1 0.6 1.8 1.8 1.8 1.9 2.1 2.4 3.1 2.4 3.0 2.6
S&E = science and engineering; EU = European Union.
NOTES: Citations are references to scientific articles in journals covered by Science Citation Index (SCI) and Social Sciences Citation Index (SSCI). Highly influential
articles are top 5% of cited articles based on a 3-year period with a 2-year lag (e.g., for 2003, highly influential articles are articles published in 1999–2001 that were
among the top 5% in citations in articles published in 2003). Top 5% articles counts normalized to equal 5% of total articles. Actual number of articles in top 5% is
ordinarily less than 5% because articles with same frequency of citation that exceed top 5% are not included. Articles on fractional-count basis, i.e., for articles with
collaborating institutions from multiple publishing centers, each publishing center receives fractional credit on basis of proportion of its participating institutions. "All
fields" includes health sciences and professional fields. Biology includes agricultural sciences. Engineering/technology includes computer sciences. East Asia-4
includes China, Singapore, South Korea, and Taiwan. China includes Hong Kong.
SOURCES: Thomson ISI, SCI and SSCI, http://www.isinet.com/products/citation/; ipIQ, Inc.; and National Science Foundation, Division of Science Resources
Statistics, special tabulations.
60

APPENDIX TABLE 12. U.S. academic article output, by field: 1988–2003
Method of attribution and field 1988 1989 1990 1991 1992 1993 1994 1995 1996 1997 1998 1999 2000 2001 2002 2003
Fractional counts
All fields 127,382 134,746 138,018 139,387 143,570 142,318 143,897 146,479 147,020 144,632 145,190 145,503 144,166 147,798 144,865 156,602
Clinical medicine 38,017 40,072 40,808 41,123 42,334 41,904 42,989 43,598 43,325 43,488 43,562 43,648 42,296 43,799 41,954 45,596
Biomedical research 20,587 22,149 22,948 23,266 24,717 24,772 25,214 26,037 25,545 25,290 25,656 25,355 25,361 25,867 24,735 26,363
Biology 9,890 10,344 10,670 10,497 10,069 9,558 9,513 9,397 9,297 9,093 9,158 8,426 9,359 9,328 9,888 10,379
Chemistry 9,364 9,654 10,175 10,561 10,731 10,987 10,436 10,778 11,081 10,712 10,943 10,864 11,021 10,878 10,583 11,839
Physics 11,415 12,230 12,253 13,229 13,201 13,277 14,122 13,661 13,364 12,941 12,746 12,765 12,120 12,349 12,445 13,255
Earth/space sciences 5,204 5,477 5,704 5,762 5,990 6,401 6,533 7,045 7,183 6,917 6,781 7,316 7,110 7,449 7,051 8,556
Engineering/technology 6,799 7,101 7,864 7,635 8,749 8,177 8,553 8,691 8,294 8,050 8,153 8,649 8,201 9,111 9,111 9,932
Mathematics 3,529 3,696 2,996 3,113 3,261 3,149 3,093 2,953 3,033 2,830 3,210 3,265 3,450 3,393 3,306 3,524
Psychology 6,271 6,262 6,693 6,303 6,619 6,090 6,216 6,860 7,113 7,048 6,753 6,842 6,570 6,867 6,794 7,056
Social sciences 7,297 8,053 8,113 8,093 7,981 8,144 7,787 7,712 8,030 7,814 7,863 7,958 8,020 8,252 7,943 8,583
Whole counts
All fields 148,642 157,430 162,095 164,854 171,256 170,562 173,992 178,224 179,876 178,254 180,222 182,158 181,518 187,791 184,882 200,727
Clinical medicine 46,385 48,905 49,886 50,460 52,222 52,130 53,818 54,648 54,661 55,028 55,548 56,093 54,859 57,222 55,045 60,019
Biomedical research 23,938 25,837 26,926 27,608 29,550 29,622 30,512 31,714 31,181 31,038 31,886 31,709 31,749 32,733 31,430 33,585
Biology 11,153 11,731 12,116 11,999 11,652 11,135 11,127 11,121 11,010 10,880 11,056 10,374 11,576 11,630 12,409 13,184
Chemistry 10,433 10,820 11,465 12,007 12,266 12,591 12,135 12,582 12,998 12,655 12,943 12,957 13,194 13,108 12,807 14,260
Physics 13,914 14,884 15,128 16,576 16,882 17,078 18,186 17,884 17,783 17,474 17,347 17,596 16,937 17,418 17,578 18,806
Earth/space sciences 6,469 6,843 7,301 7,410 7,784 8,308 8,651 9,426 9,802 9,518 9,454 10,345 10,164 10,811 10,425 12,675
Engineering/technology 7,990 8,350 9,299 9,114 10,508 9,836 10,392 10,682 10,193 10,225 10,442 11,130 10,667 11,954 12,001 13,091
Mathematics 4,025 4,207 3,461 3,599 3,852 3,707 3,624 3,485 3,648 3,406 3,904 4,030 4,292 4,268 4,206 4,474
Psychology 6,807 6,806 7,247 6,861 7,203 6,667 6,797 7,532 7,915 7,831 7,521 7,662 7,357 7,725 7,654 8,022
Social sciences 7,853 8,614 8,736 8,684 8,645 8,828 8,510 8,437 8,841 8,608 8,612 8,716 8,813 9,119 8,828 9,581
NOTES: For articles with collaborating institutions, fractional counts assign the academic sector fractional credit on basis of proportion of its participating institutions, and whole counts assign the academic sector one credit for its
participation, regardless of the number of participating institutions. "All fields" includes health sciences and professional fields. Biology includes agricultural sciences. Engineering/technology includes computer sciences.
SOURCES: Thomson ISI, Science Citation Index and Social Sciences Citation Index, http://www.isinet.com/products/citation/; ipIQ, Inc.; and National Science Foundation, Division of Science Resources Statistics, special tabulations.
61

APPENDIX TABLE 13. U.S. article output (fractional counts), by field and sector: 1988–2003Field and sector 1988 1989 1990 1991 1992 1993 1994 1995 1996 1997 1998 1999 2000 2001 2002 2003
All fields
All sectors 177,662 187,224 191,559 194,015 198,864 197,397 199,769 202,887 201,798 197,531 197,890 198,524 196,221 200,870 195,792 211,233
Academic 127,382 134,746 138,018 139,387 143,570 142,318 143,897 146,479 147,020 144,632 145,190 145,503 144,166 147,798 144,865 156,602
Nonacademic 50,280 52,478 53,541 54,628 55,294 55,079 55,872 56,408 54,778 52,899 52,700 53,021 52,055 53,072 50,927 54,631
FFRDCs 4,855 5,017 5,053 5,094 5,012 4,731 5,116 5,396 5,110 5,173 5,049 5,161 4,990 5,174 4,806 5,660
Federal government 14,386 14,956 15,179 15,226 15,263 15,337 15,562 15,505 14,978 14,263 14,126 13,877 13,755 14,015 13,411 14,145
Joint 111 138 151 150 175 192 241 211 225 233 191 313 314 322 361 361
Private for profit 15,138 15,559 16,401 16,935 16,884 16,363 16,715 16,374 15,559 14,611 14,433 14,486 14,107 14,210 13,645 14,523
Private nonprofit 12,436 13,232 13,209 13,536 14,040 14,575 14,771 15,403 15,203 14,953 15,014 15,437 15,649 16,021 15,204 16,273
State/local government 2,105 2,194 2,128 2,075 2,108 2,028 2,074 1,986 1,929 1,878 1,920 1,896 1,828 1,933 1,890 1,901
Unknown 1,248 1,382 1,419 1,612 1,812 1,851 1,393 1,532 1,772 1,788 1,966 1,851 1,413 1,397 1,611 1,768
Clinical medicine
All sectors 55,016 58,133 58,850 59,488 61,097 61,312 62,610 63,367 63,057 62,676 63,077 63,190 61,745 63,709 60,785 65,933
Academic 38,017 40,072 40,808 41,123 42,334 41,904 42,989 43,598 43,325 43,488 43,562 43,648 42,296 43,799 41,954 45,596
Nonacademic 16,999 18,061 18,042 18,364 18,763 19,408 19,622 19,769 19,732 19,187 19,514 19,542 19,449 19,910 18,831 20,337
FFRDCs 227 211 225 218 224 217 262 250 265 234 241 214 199 182 184 189
Federal government 5,286 5,368 5,354 5,305 5,211 5,313 5,286 5,098 5,202 4,888 4,906 4,720 4,656 4,759 4,429 4,651
Joint 2 9 9 12 12 13 14 15 11 13 12 17 27 23 23 18
Private for profit 2,503 2,869 3,006 3,201 3,344 3,409 3,697 3,811 3,754 3,647 3,767 3,677 3,769 3,785 3,724 3,965
Private nonprofit 7,438 7,956 7,815 8,000 8,174 8,728 8,836 9,097 8,977 8,869 9,004 9,338 9,397 9,710 9,065 9,979
State/local government 1,099 1,102 1,067 1,017 1,057 967 1,011 912 852 874 876 861 842 889 767 826
Unknown 443 547 566 612 741 761 516 586 671 662 708 715 558 563 639 708
Biomedical research
All sectors 27,455 29,427 30,703 31,177 32,906 33,117 33,750 35,048 33,991 33,661 33,978 33,423 33,482 34,041 32,407 34,427
Academic 20,587 22,149 22,948 23,266 24,717 24,772 25,214 26,037 25,545 25,290 25,656 25,355 25,361 25,867 24,735 26,363
Nonacademic 6,869 7,278 7,755 7,911 8,189 8,345 8,536 9,011 8,445 8,372 8,322 8,068 8,121 8,174 7,672 8,064
FFRDCs 424 419 451 516 468 440 487 560 506 544 479 465 442 454 460 467
Federal government 2,456 2,653 2,645 2,615 2,683 2,786 2,775 2,787 2,654 2,539 2,572 2,408 2,477 2,477 2,330 2,452
Joint 2 3 8 4 8 5 5 6 6 3 7 7 8 22 16 26
Private for profit 1,545 1,587 1,905 2,008 2,050 2,128 2,217 2,313 2,075 2,033 1,990 2,079 1,973 1,952 1,797 1,924
Private nonprofit 2,105 2,269 2,360 2,390 2,579 2,571 2,729 2,963 2,856 2,866 2,871 2,758 2,862 2,927 2,740 2,843
State/local government 266 267 285 274 272 289 237 266 248 244 243 231 250 238 216 222
Unknown 70 80 100 104 129 125 85 116 102 141 160 120 108 105 113 131
Biology
All sectors 12,862 13,544 14,028 13,898 13,366 12,671 12,845 12,664 12,310 12,027 12,126 11,271 12,496 12,499 13,122 13,855
Academic 9,890 10,344 10,670 10,497 10,069 9,558 9,513 9,397 9,297 9,093 9,158 8,426 9,359 9,328 9,888 10,379
Nonacademic 2,972 3,201 3,358 3,401 3,297 3,113 3,332 3,267 3,013 2,935 2,967 2,845 3,137 3,171 3,234 3,475
FFRDCs 103 99 96 64 73 72 83 79 103 83 68 52 78 61 58 68
Federal government 1,816 1,923 2,042 2,036 1,919 1,818 1,952 1,917 1,724 1,696 1,698 1,615 1,779 1,712 1,781 1,935
Joint 0 0 2 1 0 1 1 1 * 0 2 1 7 7 6 7
Private for profit 377 396 467 479 452 446 545 535 441 405 390 386 456 480 468 476
Private nonprofit 437 484 461 492 507 459 449 437 406 440 449 467 507 536 552 612
State/local government 185 222 210 210 221 205 225 222 234 221 252 215 237 290 268 277
62
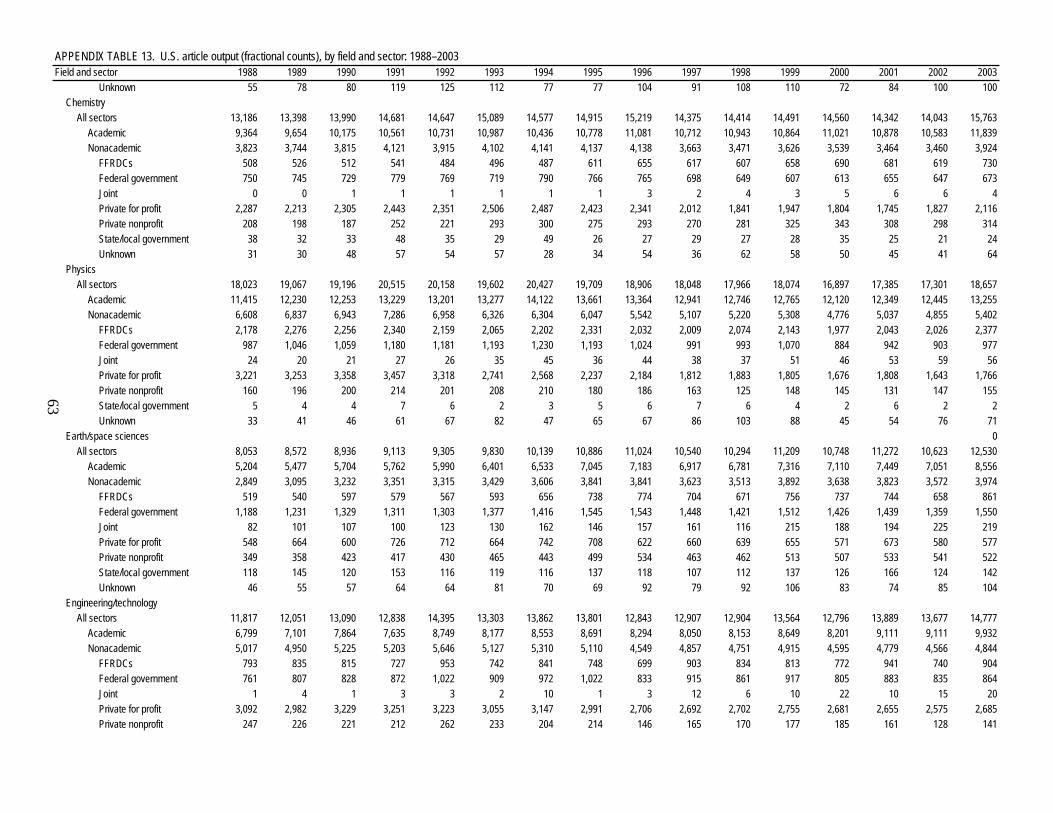
APPENDIX TABLE 13. U.S. article output (fractional counts), by field and sector: 1988–2003Field and sector 1988 1989 1990 1991 1992 1993 1994 1995 1996 1997 1998 1999 2000 2001 2002 2003
Unknown 55 78 80 119 125 112 77 77 104 91 108 110 72 84 100 100
Chemistry
All sectors 13,186 13,398 13,990 14,681 14,647 15,089 14,577 14,915 15,219 14,375 14,414 14,491 14,560 14,342 14,043 15,763
Academic 9,364 9,654 10,175 10,561 10,731 10,987 10,436 10,778 11,081 10,712 10,943 10,864 11,021 10,878 10,583 11,839
Nonacademic 3,823 3,744 3,815 4,121 3,915 4,102 4,141 4,137 4,138 3,663 3,471 3,626 3,539 3,464 3,460 3,924
FFRDCs 508 526 512 541 484 496 487 611 655 617 607 658 690 681 619 730
Federal government 750 745 729 779 769 719 790 766 765 698 649 607 613 655 647 673
Joint 0 0 1 1 1 1 1 1 3 2 4 3 5 6 6 4
Private for profit 2,287 2,213 2,305 2,443 2,351 2,506 2,487 2,423 2,341 2,012 1,841 1,947 1,804 1,745 1,827 2,116
Private nonprofit 208 198 187 252 221 293 300 275 293 270 281 325 343 308 298 314
State/local government 38 32 33 48 35 29 49 26 27 29 27 28 35 25 21 24
Unknown 31 30 48 57 54 57 28 34 54 36 62 58 50 45 41 64
Physics
All sectors 18,023 19,067 19,196 20,515 20,158 19,602 20,427 19,709 18,906 18,048 17,966 18,074 16,897 17,385 17,301 18,657
Academic 11,415 12,230 12,253 13,229 13,201 13,277 14,122 13,661 13,364 12,941 12,746 12,765 12,120 12,349 12,445 13,255
Nonacademic 6,608 6,837 6,943 7,286 6,958 6,326 6,304 6,047 5,542 5,107 5,220 5,308 4,776 5,037 4,855 5,402
FFRDCs 2,178 2,276 2,256 2,340 2,159 2,065 2,202 2,331 2,032 2,009 2,074 2,143 1,977 2,043 2,026 2,377
Federal government 987 1,046 1,059 1,180 1,181 1,193 1,230 1,193 1,024 991 993 1,070 884 942 903 977
Joint 24 20 21 27 26 35 45 36 44 38 37 51 46 53 59 56
Private for profit 3,221 3,253 3,358 3,457 3,318 2,741 2,568 2,237 2,184 1,812 1,883 1,805 1,676 1,808 1,643 1,766
Private nonprofit 160 196 200 214 201 208 210 180 186 163 125 148 145 131 147 155
State/local government 5 4 4 7 6 2 3 5 6 7 6 4 2 6 2 2
Unknown 33 41 46 61 67 82 47 65 67 86 103 88 45 54 76 71
Earth/space sciences 0
All sectors 8,053 8,572 8,936 9,113 9,305 9,830 10,139 10,886 11,024 10,540 10,294 11,209 10,748 11,272 10,623 12,530
Academic 5,204 5,477 5,704 5,762 5,990 6,401 6,533 7,045 7,183 6,917 6,781 7,316 7,110 7,449 7,051 8,556
Nonacademic 2,849 3,095 3,232 3,351 3,315 3,429 3,606 3,841 3,841 3,623 3,513 3,892 3,638 3,823 3,572 3,974
FFRDCs 519 540 597 579 567 593 656 738 774 704 671 756 737 744 658 861
Federal government 1,188 1,231 1,329 1,311 1,303 1,377 1,416 1,545 1,543 1,448 1,421 1,512 1,426 1,439 1,359 1,550
Joint 82 101 107 100 123 130 162 146 157 161 116 215 188 194 225 219
Private for profit 548 664 600 726 712 664 742 708 622 660 639 655 571 673 580 577
Private nonprofit 349 358 423 417 430 465 443 499 534 463 462 513 507 533 541 522
State/local government 118 145 120 153 116 119 116 137 118 107 112 137 126 166 124 142
Unknown 46 55 57 64 64 81 70 69 92 79 92 106 83 74 85 104
Engineering/technology
All sectors 11,817 12,051 13,090 12,838 14,395 13,303 13,862 13,801 12,843 12,907 12,904 13,564 12,796 13,889 13,677 14,777
Academic 6,799 7,101 7,864 7,635 8,749 8,177 8,553 8,691 8,294 8,050 8,153 8,649 8,201 9,111 9,111 9,932
Nonacademic 5,017 4,950 5,225 5,203 5,646 5,127 5,310 5,110 4,549 4,857 4,751 4,915 4,595 4,779 4,566 4,844
FFRDCs 793 835 815 727 953 742 841 748 699 903 834 813 772 941 740 904
Federal government 761 807 828 872 1,022 909 972 1,022 833 915 861 917 805 883 835 864
Joint 1 4 1 3 3 2 10 1 3 12 6 10 22 10 15 20
Private for profit 3,092 2,982 3,229 3,251 3,223 3,055 3,147 2,991 2,706 2,692 2,702 2,755 2,681 2,655 2,575 2,685
Private nonprofit 247 226 221 212 262 233 204 214 146 165 170 177 185 161 128 141
63

APPENDIX TABLE 13. U.S. article output (fractional counts), by field and sector: 1988–2003Field and sector 1988 1989 1990 1991 1992 1993 1994 1995 1996 1997 1998 1999 2000 2001 2002 2003
State/local government 34 22 32 22 36 33 36 42 29 36 31 92 29 28 160 91
Unknown 91 73 100 118 147 153 99 92 134 134 149 152 100 100 112 140
Mathematics
All sectors 3,880 3,990 3,304 3,382 3,538 3,453 3,346 3,190 3,272 3,051 3,483 3,561 3,758 3,657 3,556 3,760
Academic 3,529 3,696 2,996 3,113 3,261 3,149 3,093 2,953 3,033 2,830 3,210 3,265 3,450 3,393 3,306 3,524
Nonacademic 350 294 308 270 277 304 253 237 240 221 273 296 308 264 250 236
FFRDCs 51 53 39 46 39 48 44 32 41 41 41 38 67 35 37 39
Federal government 91 68 84 67 53 78 51 56 51 45 55 68 59 48 54 47
Joint 0 * 1 0 1 0 1 0 0 0 * 1 * 2 * 1
Private for profit 161 132 132 108 140 129 113 104 100 89 126 126 120 124 112 106
Private nonprofit 36 30 41 38 40 40 32 36 35 37 42 46 50 45 37 28
State/local government 2 2 1 2 1 3 4 1 4 3 2 5 2 1 1 1
Unknown 9 9 10 9 5 6 8 8 9 6 7 11 10 9 10 14
Psychology
All sectors 7,171 7,088 7,587 7,194 7,626 6,986 7,184 7,830 8,258 8,130 7,736 7,806 7,499 7,809 7,691 7,892
Academic 6,271 6,262 6,693 6,303 6,619 6,090 6,216 6,860 7,113 7,048 6,753 6,842 6,570 6,867 6,794 7,056
Nonacademic 900 826 895 890 1,006 896 968 971 1,144 1,081 984 965 930 942 896 835
FFRDCs 1 6 5 6 3 3 5 5 * 2 4 2 1 1 3 1
Federal government 206 174 214 216 222 192 217 224 279 246 225 241 236 220 217 218
Joint 0 0 0 0 * 0 0 1 0 1 1 2 1 1 2 3
Private for profit 150 117 128 134 174 164 174 169 189 168 143 162 156 172 139 121
Private nonprofit 287 304 312 300 329 296 300 309 387 369 345 344 348 370 352 332
State/local government 94 99 97 93 99 98 118 111 118 118 106 90 75 69 65 58
Unknown 161 127 139 141 180 144 154 151 171 178 159 126 114 110 118 102
Social sciences
All sectors 8,738 9,551 9,651 9,595 9,521 9,690 9,275 9,150 9,425 9,163 9,086 9,171 9,149 9,384 9,040 9,764
Academic 7,297 8,053 8,113 8,093 7,981 8,144 7,787 7,712 8,030 7,814 7,863 7,958 8,020 8,252 7,943 8,583
Nonacademic 1,441 1,498 1,539 1,503 1,540 1,546 1,489 1,438 1,395 1,349 1,223 1,213 1,129 1,132 1,097 1,181
FFRDCs 36 31 44 42 33 38 41 32 29 26 25 16 20 28 14 16
Federal government 435 505 487 474 503 503 486 461 404 363 322 340 344 330 357 332
Joint 0 1 * 0 1 0 * * 0 0 * 0 1 2 1 1
Private for profit 275 246 295 250 254 231 201 207 233 250 191 191 171 160 124 135
Private nonprofit 544 559 566 594 622 625 622 603 594 563 538 534 502 512 495 565
State/local government 55 63 55 48 45 61 67 49 46 58 45 43 38 38 35 42
Unknown 95 94 91 93 83 89 71 86 89 89 102 90 54 62 71 89
* = less than .5.
FFRDC = federally funded research and development center.
NOTES: Articles on fractional-count basis, i.e., for articles with collaborating institutions, each sector receives fractional credit on basis of proportion of its participating institutions. "All fields" includes health sciences and professional fields.
Biology includes agricultural sciences. Engineering/technology includes computer sciences.
SOURCES: Thomson ISI, Science Citation Index and Social Sciences Citation Index, http://www.isinet.com/products/citation/; ipIQ, Inc.; and National Science Foundation, Division of Science Resources Statistics, special tabulations.
64
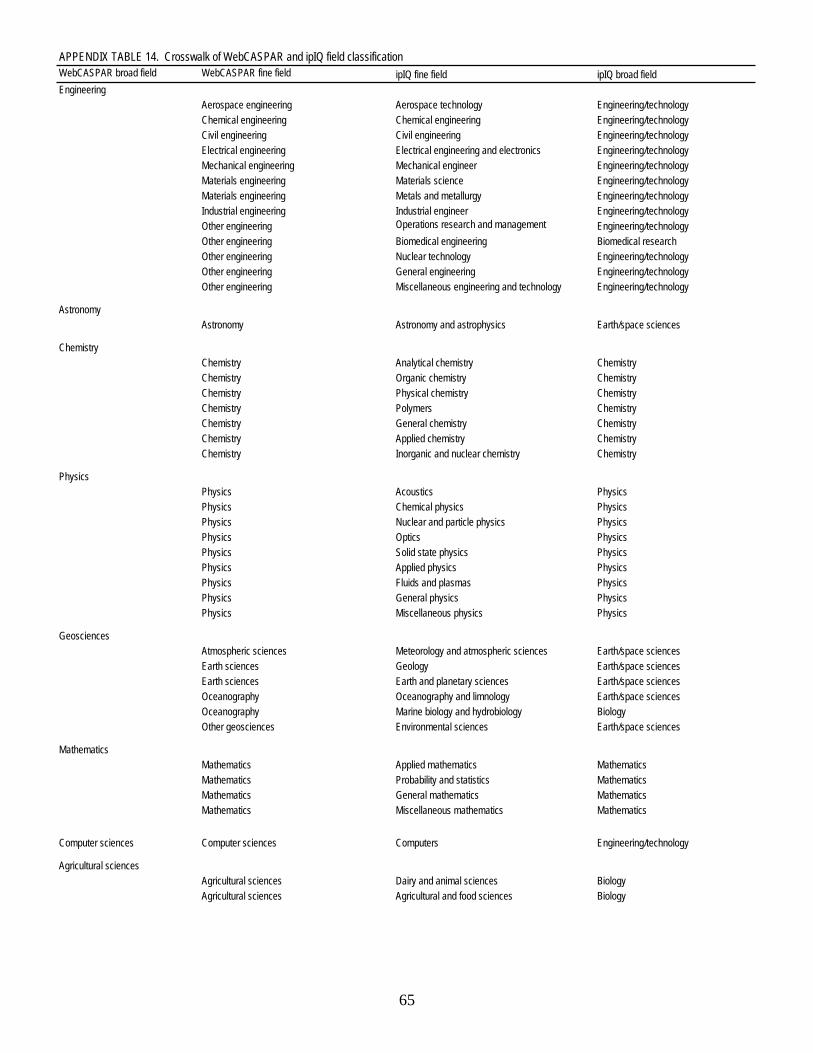
APPENDIX TABLE 14. Crosswalk of WebCASPAR and ipIQ field classification
WebCASPAR broad field WebCASPAR fine field ipIQ fine field ipIQ broad field
Engineering
Aerospace engineering Aerospace technology Engineering/technology
Chemical engineering Chemical engineering Engineering/technology
Civil engineering Civil engineering Engineering/technology
Electrical engineering Electrical engineering and electronics Engineering/technology
Mechanical engineering Mechanical engineer Engineering/technology
Materials engineering Materials science Engineering/technology
Materials engineering Metals and metallurgy Engineering/technology
Industrial engineering Industrial engineer Engineering/technology
Other engineering Operations research and management Engineering/technology
Other engineering Biomedical engineering Biomedical research
Other engineering Nuclear technology Engineering/technology
Other engineering General engineering Engineering/technology
Other engineering Miscellaneous engineering and technology Engineering/technology
Astronomy
Astronomy Astronomy and astrophysics Earth/space sciences
Chemistry
Chemistry Analytical chemistry Chemistry
Chemistry Organic chemistry Chemistry
Chemistry Physical chemistry Chemistry
Chemistry Polymers Chemistry
Chemistry General chemistry Chemistry
Chemistry Applied chemistry Chemistry
Chemistry Inorganic and nuclear chemistry Chemistry
Physics
Physics Acoustics Physics
Physics Chemical physics Physics
Physics Nuclear and particle physics Physics
Physics Optics Physics
Physics Solid state physics Physics
Physics Applied physics Physics
Physics Fluids and plasmas Physics
Physics General physics Physics
Physics Miscellaneous physics Physics
Geosciences
Atmospheric sciences Meteorology and atmospheric sciences Earth/space sciences
Earth sciences Geology Earth/space sciences
Earth sciences Earth and planetary sciences Earth/space sciences
Oceanography Oceanography and limnology Earth/space sciences
Oceanography Marine biology and hydrobiology Biology
Other geosciences Environmental sciences Earth/space sciences
Mathematics
Mathematics Applied mathematics Mathematics
Mathematics Probability and statistics Mathematics
Mathematics General mathematics Mathematics
Mathematics Miscellaneous mathematics Mathematics
Computer sciences Computer sciences Computers Engineering/technology
Agricultural sciences
Agricultural sciences Dairy and animal sciences Biology
Agricultural sciences Agricultural and food sciences Biology
65

APPENDIX TABLE 14. Crosswalk of WebCASPAR and ipIQ field classification
WebCASPAR broad field WebCASPAR fine field ipIQ fine field ipIQ broad field
Biological sciences
Biological sciences General biomedical research Biomedical research
Biological sciences Miscellaneous biomedical research Biomedical research
Biological sciences Biophysics Biomedical research
Biological sciences Botany Biology
Biological sciences Anatomy and morphology Biomedical research
Biological sciences Cell biology, cytology, and histology Biomedical research
Biological sciences Ecology Biology
Biological sciences Entomology Biology
Biological sciences Immunology Clinical medicine
Biological sciences Microbiology Biomedical research
Biological sciences Nutrition and dietetics Biomedical research
Biological sciences Parasitology Biomedical research
Biological sciences Genetics and heredity Biomedical research
Biological sciences Pathology Clinical medicine
Biological sciences Pharmacology Clinical medicine
Biological sciences Physiology Biomedical research
Biological sciences General zoology Biology
Biological sciences Miscellaneous zoology Biology
Biological sciences General biology Biology
Biological sciences Miscellaneous biology Biology
Biological sciences Biochemistry and molecular biology Biomedical research
Biological sciences Virology Biomedical research
Medical sciences
Medical sciences Endocrinology Clinical medicine
Medical sciences Neurology and neurosurgery Clinical medicine
Medical sciences Dentistry Clinical medicine
Medical sciences Environmental and occupational health Clinical medicine
Medical sciences Public health Health sciences
Medical sciences Surgery Clinical medicine
Medical sciences General and Internal medicine Clinical medicine
Medical sciences Ophthalmology Clinical medicine
Medical sciences Pharmacy Clinical medicine
Medical sciences Veterinary medicine Clinical medicine
Medical sciences Miscellaneous clinical medicine Clinical medicine
Medical sciences Anesthesiology Clinical medicine
Medical sciences Cardiovascular system Clinical medicine
Medical sciences Cancer Clinical medicine
Medical sciences Gastroenterology Clinical medicine
Medical sciences Hematology Clinical medicine
Medical sciences Obstetrics and gynecology Clinical medicine
Medical sciences Otorhinolaryngology Clinical medicine
Medical sciences Pediatrics Clinical medicine
Medical sciences Psychiatry Clinical medicine
Medical sciences Radiology and nuclear medicine Clinical medicine
Medical sciences Dermatology and venereal disease Clinical medicine
Medical sciences Orthopedics Clinical medicine
Medical sciences Arthritis and rheumatism Clinical medicine
Medical sciences Respiratory system Clinical medicine
Medical sciences Urology Clinical medicine
Medical sciences Nephrology Clinical medicine
Medical sciences Allergy Clinical medicine
Medical sciences Fertility Clinical medicine
Medical sciences Geriatrics Clinical medicine
Medical sciences Embryology Biomedical research
Medical sciences Tropical medicine Clinical medicine
Medical sciences Addictive diseases Clinical medicine
Medical sciences Microscopy Biomedical research
66

APPENDIX TABLE 14. Crosswalk of WebCASPAR and ipIQ field classification
WebCASPAR broad field WebCASPAR fine field ipIQ fine field ipIQ broad field
Other life sciences
Other life sciences Speech/language pathology and audiology Health sciences
Other life sciences Nursing Health sciences
Other life sciences Rehabilitation Health sciences
Other life sciences Health policy and services Health sciences
Psychology
Psychology Clinical psychology Psychology
Psychology Behavioral and comparative psychology Psychology
Psychology Developmental and child psychology Psychology
Psychology Experimental psychology Psychology
Psychology Human factors Psychology
Psychology Social psychology Psychology
Psychology General psychology Psychology
Psychology Miscellaneous psychology Psychology
Psychology Psychoanalysis Psychology
Social sciences
Economics Economics Social sciences
Political science and public administration International relations Social sciences
Political science and public administration Political science and public administration Social sciences
Sociology Demography Social sciences
Sociology Sociology Social sciences
Anthropology Anthropology and archaeology Social sciences
Area and ethnic studies Area studies Social sciences
Other social sciences Criminology Social sciences
Other social sciences Geography and regional sciences Social sciences
Other social sciences Planning and urban studies Social sciences
Other social sciences General social sciences Social sciences
Other social sciences Miscellaneous social sciences Social sciences
Other social sciences Science studies Social sciences
Other social sciences Gerontology and aging Health sciences
Other social sciences Social studies of medicine Social sciences
Professional fields
Non-science education Education Professional fields
Business and management Management and business Professional fields
Communication and librarianship Communication Professional fields
Communication and librarianship Information and library science Professional fields
Law Law Professional fields
Social service professions Social work Professional fields
Other nonsciences or unknown disciplines Miscellaneous professional fields Professional fields
SOURCES: ipIQ, Inc., and National Science Foundation, Division of Science Resources Statistics, Integrated Science and Engineering Resources Data System ( WebCASPAR)
database system, http://caspar.nsf.gov.
67

APPENDIX TABLE 15. S&E article output ( fractional counts) of top 200 research universities, by Carnegie institution type and administrative control of institution: 1988–2001
Institution type and administrative
control 1988 1989 1990 1991 1992 1993 1994 1995 1996 1997 1998 1999 2000 2001
All top 200 111,442 117,562 120,430 121,813 125,745 124,427 126,965 128,884 128,972 127,084 127,719 127,778 126,591 130,230
Research I 87,974 92,639 94,774 95,427 98,351 97,360 99,225 100,828 100,745 99,344 99,598 99,799 98,610 101,316
Research II 10,118 10,399 10,596 11,053 11,353 11,070 11,425 11,232 11,078 10,941 10,981 11,049 11,114 11,504
Doctorate granting I 2,343 2,463 2,542 2,645 2,726 2,656 2,723 2,687 2,787 2,640 2,691 2,665 2,761 2,814
Doctorate granting II 2,780 3,191 3,276 3,392 3,498 3,521 3,580 3,673 3,754 3,790 3,962 3,926 3,799 3,824
Masters and liberal arts 307 337 350 379 393 404 407 425 470 429 444 439 450 441
Engineering 39 45 33 35 55 52 50 44 42 43 42 57 56 49
Medical 7,774 8,361 8,722 8,750 9,229 9,209 9,390 9,804 9,921 9,735 9,804 9,649 9,602 10,070
Other Carnegie 59 80 81 92 86 93 69 90 75 69 75 58 59 64
Not classified 48 47 55 39 55 62 97 98 98 92 123 136 139 148
Private 34,657 36,414 36,861 37,472 38,861 38,897 39,930 40,589 41,027 40,793 40,988 41,495 40,989 42,404
Research I 28,357 29,739 30,136 30,330 31,507 31,318 32,232 32,882 33,350 33,220 33,313 34,013 33,461 34,669
Research II 2,597 2,553 2,559 2,716 2,759 2,735 2,837 2,721 2,682 2,612 2,618 2,622 2,650 2,812
Doctorate granting I 452 529 529 541 571 588 604 604 653 616 596 596 639 609
Doctorate granting II 799 983 980 1,084 1,049 1,149 1,246 1,233 1,251 1,256 1,348 1,234 1,117 1,115
Masters and liberal arts 65 67 65 75 82 65 75 83 75 66 73 82 67 58
Medical 2,388 2,542 2,592 2,727 2,893 3,044 2,937 3,065 3,015 3,023 3,039 2,948 3,056 3,141
Public 76,785 81,148 83,569 84,341 86,883 85,530 86,983 88,239 87,892 86,233 86,665 86,202 85,534 87,748
Research I 59,618 62,900 64,638 65,097 66,844 66,043 66,993 67,946 67,395 66,124 66,285 65,786 65,149 66,647
Research II 7,521 7,846 8,038 8,337 8,594 8,335 8,588 8,511 8,396 8,330 8,362 8,427 8,464 8,693
Doctorate granting I 1,892 1,934 2,014 2,104 2,155 2,068 2,119 2,083 2,135 2,024 2,096 2,069 2,122 2,205
Doctorate granting II 1,982 2,208 2,295 2,308 2,448 2,372 2,334 2,440 2,503 2,534 2,614 2,692 2,683 2,709
Masters and liberal arts 242 270 284 304 311 340 331 342 395 363 371 357 383 383
Engineering 39 45 33 35 55 52 50 44 42 43 42 57 56 49
Medical 5,386 5,819 6,130 6,023 6,336 6,166 6,453 6,739 6,907 6,712 6,764 6,701 6,547 6,929
Other Carnegie 59 80 81 92 86 93 69 90 75 69 75 58 59 64
Not classified 48 47 55 39 55 62 45 42 45 35 56 56 71 70
S&E = science and engineering.
NOTES: Articles on fractional-count basis, i.e., for articles with collaborating institutions, each institution type receives fractional credit on basis of proportion of its participating institutions. Institutions designated by 1994 Carnegie
classification code. For information on these institutional categories, see Carnegie Foundation for the Advancement of Teaching, A Classification of Institutions of Higher Education, Princeton University Press ( 1994) . Top 200 research
universities based on total R&D expenditures during the 1988–2001 period.
SOURCES: Thomson ISI, Science Citation Index and Social Sciences Citation Index, http://www.isinet.com/products/citation; ipIQ, Inc.; and National Science Foundation, Division of Science Resources Statistics, special tabulations.
68
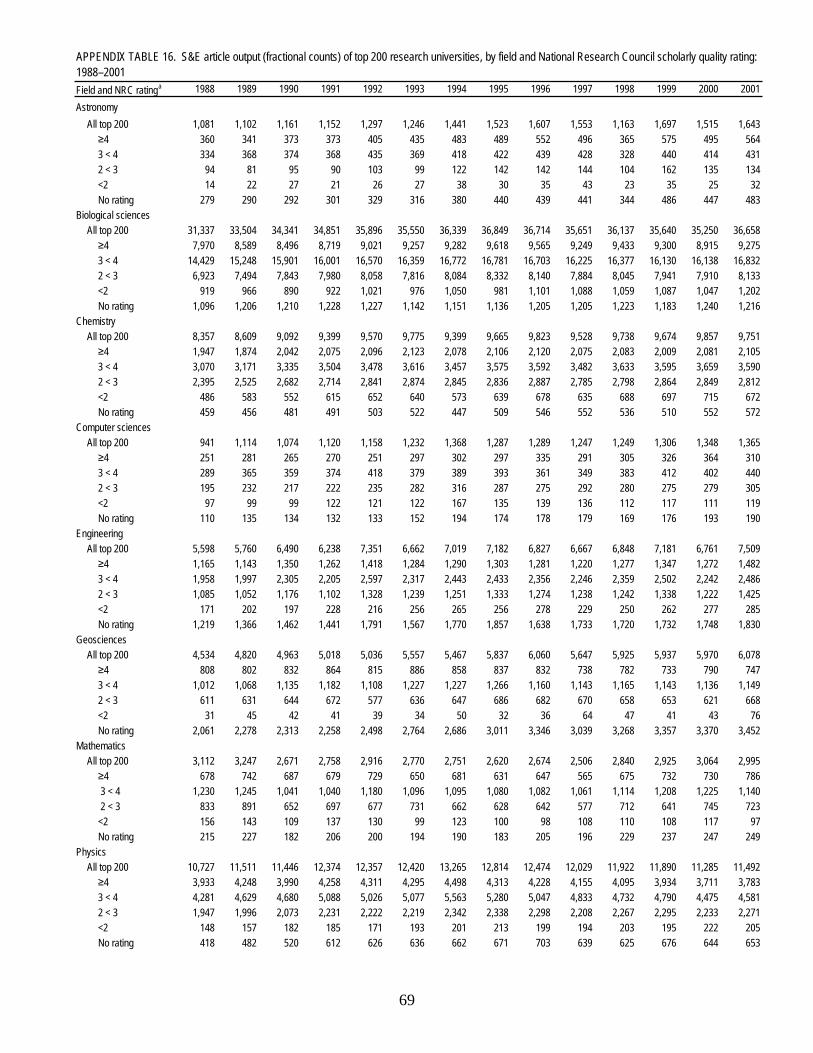
Field and NRC ratinga 1988 1989 1990 1991 1992 1993 1994 1995 1996 1997 1998 1999 2000 2001
Astronomy
All top 200 1,081 1,102 1,161 1,152 1,297 1,246 1,441 1,523 1,607 1,553 1,163 1,697 1,515 1,643
4 360 341 373 373 405 435 483 489 552 496 365 575 495 564
3 < 4 334 368 374 368 435 369 418 422 439 428 328 440 414 431
2 < 3 94 81 95 90 103 99 122 142 142 144 104 162 135 134
<2 14 22 27 21 26 27 38 30 35 43 23 35 25 32
No rating 279 290 292 301 329 316 380 440 439 441 344 486 447 483
Biological sciences
All top 200 31,337 33,504 34,341 34,851 35,896 35,550 36,339 36,849 36,714 35,651 36,137 35,640 35,250 36,658
4 7,970 8,589 8,496 8,719 9,021 9,257 9,282 9,618 9,565 9,249 9,433 9,300 8,915 9,275
3 < 4 14,429 15,248 15,901 16,001 16,570 16,359 16,772 16,781 16,703 16,225 16,377 16,130 16,138 16,832
2 < 3 6,923 7,494 7,843 7,980 8,058 7,816 8,084 8,332 8,140 7,884 8,045 7,941 7,910 8,133
<2 919 966 890 922 1,021 976 1,050 981 1,101 1,088 1,059 1,087 1,047 1,202
No rating 1,096 1,206 1,210 1,228 1,227 1,142 1,151 1,136 1,205 1,205 1,223 1,183 1,240 1,216
Chemistry
All top 200 8,357 8,609 9,092 9,399 9,570 9,775 9,399 9,665 9,823 9,528 9,738 9,674 9,857 9,751
4 1,947 1,874 2,042 2,075 2,096 2,123 2,078 2,106 2,120 2,075 2,083 2,009 2,081 2,105
3 < 4 3,070 3,171 3,335 3,504 3,478 3,616 3,457 3,575 3,592 3,482 3,633 3,595 3,659 3,590
2 < 3 2,395 2,525 2,682 2,714 2,841 2,874 2,845 2,836 2,887 2,785 2,798 2,864 2,849 2,812
<2 486 583 552 615 652 640 573 639 678 635 688 697 715 672
No rating 459 456 481 491 503 522 447 509 546 552 536 510 552 572
Computer sciences
All top 200 941 1,114 1,074 1,120 1,158 1,232 1,368 1,287 1,289 1,247 1,249 1,306 1,348 1,365
4 251 281 265 270 251 297 302 297 335 291 305 326 364 310
3 < 4 289 365 359 374 418 379 389 393 361 349 383 412 402 440
2 < 3 195 232 217 222 235 282 316 287 275 292 280 275 279 305
<2 97 99 99 122 121 122 167 135 139 136 112 117 111 119
No rating 110 135 134 132 133 152 194 174 178 179 169 176 193 190
Engineering
All top 200 5,598 5,760 6,490 6,238 7,351 6,662 7,019 7,182 6,827 6,667 6,848 7,181 6,761 7,509
4 1,165 1,143 1,350 1,262 1,418 1,284 1,290 1,303 1,281 1,220 1,277 1,347 1,272 1,482
3 < 4 1,958 1,997 2,305 2,205 2,597 2,317 2,443 2,433 2,356 2,246 2,359 2,502 2,242 2,486
2 < 3 1,085 1,052 1,176 1,102 1,328 1,239 1,251 1,333 1,274 1,238 1,242 1,338 1,222 1,425
<2 171 202 197 228 216 256 265 256 278 229 250 262 277 285
No rating 1,219 1,366 1,462 1,441 1,791 1,567 1,770 1,857 1,638 1,733 1,720 1,732 1,748 1,830
Geosciences
All top 200 4,534 4,820 4,963 5,018 5,036 5,557 5,467 5,837 6,060 5,647 5,925 5,937 5,970 6,078
4 808 802 832 864 815 886 858 837 832 738 782 733 790 747
3 < 4 1,012 1,068 1,135 1,182 1,108 1,227 1,227 1,266 1,160 1,143 1,165 1,143 1,136 1,149
2 < 3 611 631 644 672 577 636 647 686 682 670 658 653 621 668
<2 31 45 42 41 39 34 50 32 36 64 47 41 43 76
No rating 2,061 2,278 2,313 2,258 2,498 2,764 2,686 3,011 3,346 3,039 3,268 3,357 3,370 3,452
Mathematics
All top 200 3,112 3,247 2,671 2,758 2,916 2,770 2,751 2,620 2,674 2,506 2,840 2,925 3,064 2,995
4 678 742 687 679 729 650 681 631 647 565 675 732 730 786
3 < 4 1,230 1,245 1,041 1,040 1,180 1,096 1,095 1,080 1,082 1,061 1,114 1,208 1,225 1,140
2 < 3 833 891 652 697 677 731 662 628 642 577 712 641 745 723
<2 156 143 109 137 130 99 123 100 98 108 110 108 117 97
No rating 215 227 182 206 200 194 190 183 205 196 229 237 247 249
Physics
All top 200 10,727 11,511 11,446 12,374 12,357 12,420 13,265 12,814 12,474 12,029 11,922 11,890 11,285 11,492
4 3,933 4,248 3,990 4,258 4,311 4,295 4,498 4,313 4,228 4,155 4,095 3,934 3,711 3,783
3 < 4 4,281 4,629 4,680 5,088 5,026 5,077 5,563 5,280 5,047 4,833 4,732 4,790 4,475 4,581
2 < 3 1,947 1,996 2,073 2,231 2,222 2,219 2,342 2,338 2,298 2,208 2,267 2,295 2,233 2,271
<2 148 157 182 185 171 193 201 213 199 194 203 195 222 205
No rating 418 482 520 612 626 636 662 671 703 639 625 676 644 653
APPENDIX TABLE 16. S&E article output (fractional counts) of top 200 research universities, by field and National Research Council scholarly quality rating:
1988–2001
69
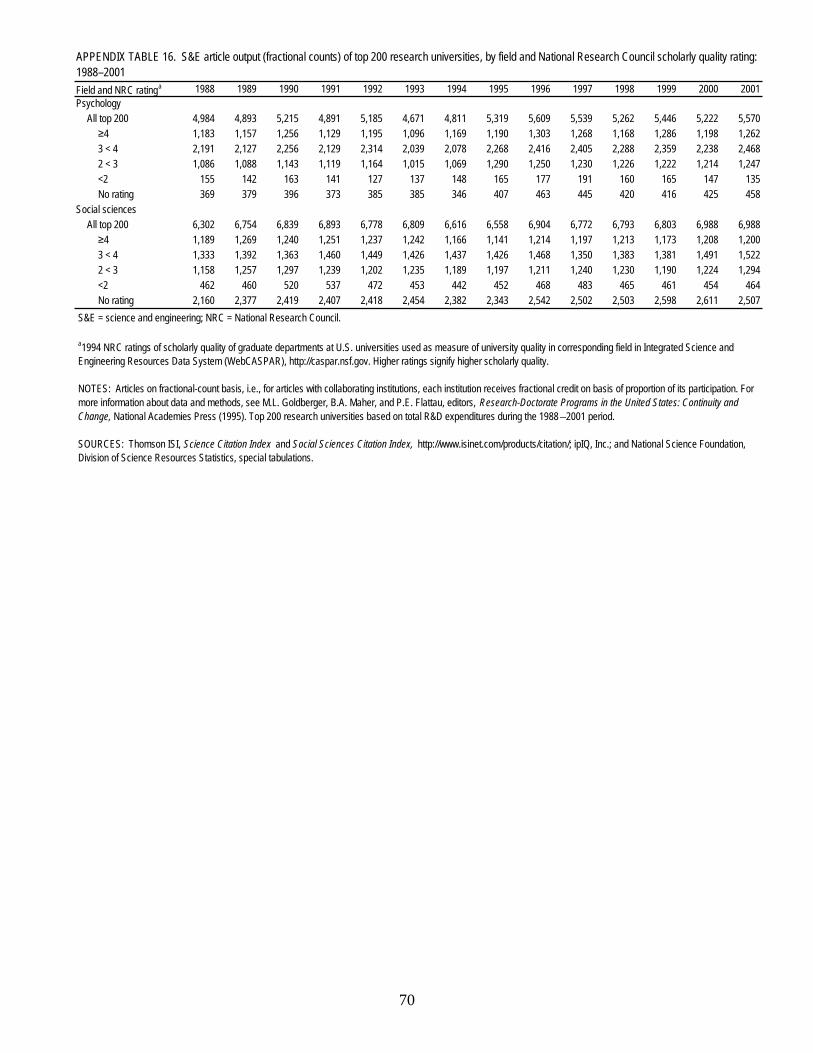
Field and NRC ratinga 1988 1989 1990 1991 1992 1993 1994 1995 1996 1997 1998 1999 2000 2001
APPENDIX TABLE 16. S&E article output (fractional counts) of top 200 research universities, by field and National Research Council scholarly quality rating:
1988–2001
Psychology
All top 200 4,984 4,893 5,215 4,891 5,185 4,671 4,811 5,319 5,609 5,539 5,262 5,446 5,222 5,570
4 1,183 1,157 1,256 1,129 1,195 1,096 1,169 1,190 1,303 1,268 1,168 1,286 1,198 1,262
3 < 4 2,191 2,127 2,256 2,129 2,314 2,039 2,078 2,268 2,416 2,405 2,288 2,359 2,238 2,468
2 < 3 1,086 1,088 1,143 1,119 1,164 1,015 1,069 1,290 1,250 1,230 1,226 1,222 1,214 1,247
<2 155 142 163 141 127 137 148 165 177 191 160 165 147 135
No rating 369 379 396 373 385 385 346 407 463 445 420 416 425 458
Social sciences
All top 200 6,302 6,754 6,839 6,893 6,778 6,809 6,616 6,558 6,904 6,772 6,793 6,803 6,988 6,988
4 1,189 1,269 1,240 1,251 1,237 1,242 1,166 1,141 1,214 1,197 1,213 1,173 1,208 1,200
3 < 4 1,333 1,392 1,363 1,460 1,449 1,426 1,437 1,426 1,468 1,350 1,383 1,381 1,491 1,522
2 < 3 1,158 1,257 1,297 1,239 1,202 1,235 1,189 1,197 1,211 1,240 1,230 1,190 1,224 1,294
<2 462 460 520 537 472 453 442 452 468 483 465 461 454 464
No rating 2,160 2,377 2,419 2,407 2,418 2,454 2,382 2,343 2,542 2,502 2,503 2,598 2,611 2,507
S&E = science and engineering; NRC = National Research Council.
a1994 NRC ratings of scholarly quality of graduate departments at U.S. universities used as measure of university quality in corresponding field in Integrated Science and
Engineering Resources Data System (WebCASPAR), http://caspar.nsf.gov. Higher ratings signify higher scholarly quality.
NOTES: Articles on fractional-count basis, i.e., for articles with collaborating institutions, each institution receives fractional credit on basis of proportion of its participation. For
more information about data and methods, see M.L. Goldberger, B.A. Maher, and P.E. Flattau, editors, Research-Doctorate Programs in the United States: Continuity and
Change, National Academies Press (1995). Top 200 research universities based on total R&D expenditures during the 1988 –2001 period.
SOURCES: Thomson ISI, Science Citation Index and Social Sciences Citation Index, http://www.isinet.com/products/citation/; ipIQ, Inc.; and National Science Foundation,
Division of Science Resources Statistics, special tabulations.
70

(Percent)
Academic institution 1988–2001 1992–2001 1988–2001 1992–2001 1988–2001 1992–2001
C. R. Drew U. of Medicine & Science 1,199 367 37 127 1 1
George Mason U. 758 176 59 6 1 1
U. TX El Paso 729 116 13 -21 1 1
ND State U. 651 88 -1 -14 1 2
U. MD Baltimore County 646 289 36 0 1 1
U. Central FL 601 187 164 22 1 1
GA State U. 567 289 82 44 1 1
U. LA Lafayette 530 197 44 18 1 1
Medical U. SC 457 266 47 46 1 1
NJ Institute of Technology 431 109 266 71 1 1
U. AR for Medical Sciences 427 227 51 42 1 1
Medical C. GA 426 144 -8 -20 1 1
Boston C. 401 196 106 32 1 1
U. MT 390 230 64 89 1 1
Loyola U. Chicago 346 23 51 10 1 4
C. of William & Mary 346 90 41 48 1 2
U. PR Medical Sciences Campus 333 31 -27 -17 1 4
U. South FL 325 150 23 -5 1 1
U. NE Medical Center 313 92 18 -16 1 2
OR Health & Science U. 310 152 86 21 1 1
U. NH 298 160 21 -4 1 1
Eastern VA Medical School 297 134 -11 -27 1 1
Emory U. 289 134 92 50 1 1
U. of Medicine and Dentistry NJ 286 92 24 1 1 2
U. MS, all campuses 281 147 45 27 1 1
U. ME 269 176 10 -3 1 1
Thomas Jefferson U. 267 115 61 18 1 1
U. NV Las Vegas 267 103 258 99 1 2
U. Memphis 259 142 10 2 1 1
SUNY Albany 257 96 -20 -18 1 2
Baylor C. of Medicine 257 127 38 16 1 1
Mount Sinai School of Medicine 256 134 42 10 1 1
Rush U. 254 168 23 29 1 1
U. Pittsburgh 254 122 27 5 1 1
IN U. 253 121 26 7 1 1
U. SC 249 104 20 19 1 2
Wayne State U. 248 117 44 13 1 1
U. MD Baltimore 247 138 50 35 1 1
Washington U. in St Louis 245 139 39 4 1 1
Old Dominion U. 240 127 25 1 1 1
Wright State U. 235 91 7 -17 1 2
Saint Louis U. 234 63 16 -2 1 3
U. NV Reno 231 58 65 18 1 3
U. CA Los Angeles 231 156 8 -3 1 1
Duke U. 229 99 32 13 1 2
U. NM 228 115 20 0 1 1
MS State U. 226 123 43 5 1 1
U. FL 225 148 2 -8 1 1
Wake Forest U. 222 97 41 21 2 2
U. Cincinnati 219 114 5 -6 2 1
APPENDIX TABLE 17. Growth in R&D and article output (fractional counts) of top 200 research universities, by R&D quartile: 1988–2001 and 1992–2001
R&D growth Article growth R&D quartile
71

(Percent)
Academic institution 1988–2001 1992–2001 1988–2001 1992–2001 1988–2001 1992–2001
APPENDIX TABLE 17. Growth in R&D and article output (fractional counts) of top 200 research universities, by R&D quartile: 1988–2001 and 1992–2001
R&D growth Article growth R&D quartile
U. Louisville 218 319 26 7 2 1
U. TX Southwestern Medical Center Dallas 216 117 36 -3 2 1
George Washington U. 214 88 -4 1 2 2
U. Akron 213 50 32 0 2 3
U. TX Medical Branch Galveston 211 78 31 8 2 2
U. WA 209 88 28 15 2 2
Vanderbilt U. 208 95 27 24 2 2
U. IL Chicago 207 128 6 20 2 1
U. KY 207 130 30 5 2 1
Dartmouth C. 207 103 78 37 2 2
U. KS 203 109 12 0 2 1
San Diego State U. 201 90 0 4 2 2
AZ State U. 201 71 20 6 2 3
U. CA Irvine 199 101 15 -6 2 2
U. OK 197 61 22 1 2 3
U. PA 195 111 31 27 2 1
U. TX Health Science Center San Antonio 190 77 6 -7 2 2
U. CA Santa Cruz 190 76 46 10 2 2
Northeastern U. 190 117 22 -7 2 1
U. MD Center for Environmental Science 189 97 3 12 2 2
U. CO 185 107 26 14 2 1
U. TX Health Science Center Houston 184 102 43 36 2 2
U. NC Chapel Hill 184 88 29 11 2 2
Boston U. 180 106 39 33 2 1
U. CA Davis 180 107 16 1 2 1
U. AR, main campus 179 75 45 8 2 2
U. CA San Diego 178 97 31 13 2 2
MT State U. Bozeman 176 102 16 4 2 2
U. AL Birmingham 172 97 52 21 2 2
U. CA San Francisco 172 77 4 -7 2 2
CO State U. 171 50 7 5 2 3
NC State U. 171 109 12 -5 2 1
U. IA 170 89 2 -2 2 2
Clark Atlanta U. 169 50 47 101 2 3
Johns Hopkins U. 168 90 39 19 2 2
CO School of Mines 168 85 90 72 2 2
Naval Postgraduate School 164 100 8 -26 2 2
U. MO Columbia 163 80 28 7 2 2
U. UT 161 82 -1 4 2 2
U. NE Lincoln 159 72 25 7 2 3
U. Notre Dame 158 103 52 45 2 2
Case Western Reserve U. 156 67 19 0 2 3
Ohio State U. 153 92 12 2 2 2
Medical C. WI 152 92 9 -10 2 2
Northwestern U. 151 82 30 14 2 2
Clemson U. 151 60 25 13 2 3
OH U. 150 83 67 53 2 2
U. CA Santa Barbara 150 76 19 -8 2 2
WV U. 148 36 10 -4 3 4
U. HI Manoa 144 96 10 -10 3 2
72

(Percent)
Academic institution 1988–2001 1992–2001 1988–2001 1992–2001 1988–2001 1992–2001
APPENDIX TABLE 17. Growth in R&D and article output (fractional counts) of top 200 research universities, by R&D quartile: 1988–2001 and 1992–2001
R&D growth Article growth R&D quartile
PA State U. 143 65 35 13 3 3
U. DE 142 58 32 14 3 3
VA Polytech Institute and State U. 140 65 -23 -31 3 3
U. MI 140 53 23 5 3 3
U. CA Berkeley 139 57 4 -3 3 3
TX Tech U. 138 90 32 31 3 2
U. MA 137 78 19 -4 3 2
U. AZ 136 65 10 -4 3 3
U. AL Huntsville 135 37 22 8 3 4
LA State U., all campuses 134 77 -5 -4 3 2
Tulane U. 134 38 32 16 3 4
CA Institute of Technology 132 92 5 5 3 2
VA Commonwealth U. 131 43 7 -7 3 4
SD State U. 129 55 19 12 3 3
MI State U. 129 87 5 -3 3 2
U. TX Arlington 128 26 -22 -20 3 4
U. Southern CA 127 75 -3 -12 3 2
Rice U. 126 45 25 3 3 4
City U. NY 125 58 -6 -8 3 3
Rutgers the State U. NJ 125 46 27 3 3 4
San Jose State U. 125 24 -10 -24 3 4
FL State U. 125 127 39 12 3 1
U. ID 124 53 22 -15 3 3
U. WI Madison 123 71 -3 -6 3 3
Georgetown U. 122 53 41 -4 3 3
U. AK Fairbanks 121 62 23 18 3 3
Brown U. 121 65 20 8 3 3
Columbia U. in the City of NY 120 78 29 16 3 2
U. North TX 120 73 25 10 3 3
KS State U. 118 63 10 3 3 3
U. Miami 117 48 21 -4 3 3
SUNY C. of Environmental Science and Forestry 116 51 -8 -26 3 3
Purdue U. 115 82 -12 -17 3 2
GA Institute of Technology 114 70 99 64 3 3
SUNY Buffalo 113 45 -5 -15 3 4
SUNY Binghamton 113 48 8 -16 3 3
Southern IL U. Carbondale 113 54 -18 -21 3 3
Rockefeller U. 112 94 -31 -12 3 2
SUNY Stony Brook 112 70 -5 -3 3 3
WA State U. 110 27 7 4 3 4
U. AL 109 47 45 14 3 3
MI Tech U. 107 63 7 14 3 3
IA State U. 107 35 15 10 3 4
U. Rochester 105 67 -9 -12 3 3
U. VT 105 53 21 -2 3 3
UT State U. 105 35 3 -8 3 4
TX A&M U. 104 52 18 0 3 3
U. WY 104 38 1 -12 3 4
Auburn U. 102 59 0 -16 4 3
Desert Research Institute 101 44 295 60 4 4
73

(Percent)
Academic institution 1988–2001 1992–2001 1988–2001 1992–2001 1988–2001 1992–2001
APPENDIX TABLE 17. Growth in R&D and article output (fractional counts) of top 200 research universities, by R&D quartile: 1988–2001 and 1992–2001
R&D growth Article growth R&D quartile
U. VA 101 36 24 3 4 4
U. OR 99 22 -3 -17 4 4
Brandeis U. 98 50 -20 -21 4 3
Yale U. 98 52 10 -3 4 3
U. IL Urbana-Champaign 98 55 -8 -8 4 3
U. GA 98 65 0 -5 4 3
FL A&M U. 98 7 152 116 4 4
U. MD College Park 97 22 13 0 4 4
U. Chicago 97 64 1 -8 4 3
Yeshiva U. 97 70 17 -5 4 3
U. MN 96 46 12 -9 4 4
Harvard U. 95 47 37 20 4 3
Tufts U. 95 74 39 23 4 3
Princeton U. 94 59 20 14 4 3
U. Houston 92 15 7 1 4 4
U. WI Milwaukee 89 27 -3 -10 4 4
NY U. 89 56 37 24 4 3
U. CT 83 33 21 6 4 4
Howard U. 79 72 -23 -19 4 3
U. CA Riverside 78 64 8 -10 4 3
NY Medical C. 76 45 -6 -21 4 4
Brigham Young U. 75 32 52 37 4 4
Stanford U. 74 31 13 7 4 4
OR State U. 73 43 -9 -7 4 4
Drexel U. 73 19 -25 -28 4 4
SUNY Health Sciences Center Brooklyn 72 31 -14 -28 4 4
U. TX Austin 71 29 -4 -17 4 4
Cornell U. 63 48 -11 -13 4 3
MA Institute of Technology 61 30 2 1 4 4
OK State U. 56 27 19 10 4 4
U. TN System 55 23 12 -10 4 4
Carnegie Mellon U. 54 31 -3 4 4 4
U. MO Rolla 53 84 31 10 4 2
Temple U. 47 12 1 -4 4 4
Uniformed Services U. of the Health Sciences 45 -17 -29 -26 4 4
U. TX Dallas 43 21 1 -25 4 4
NM State U. 43 4 15 -1 4 4
U. RI 41 24 -8 -21 4 4
NM Institute of Mining and Technology 39 13 26 -10 4 4
MCP Hahnemann U. 36 -26 -15 -46 4 4
U. Dayton 31 1 -9 -29 4 4
Syracuse U. 26 32 -25 -14 4 4
U. ND 25 8 45 26 4 4
Rensselaer Polytechnic Institute 23 -11 -17 -15 4 4
Lehigh U. 7 -9 8 -6 4 4
74

(Percent)
Academic institution 1988–2001 1992–2001 1988–2001 1992–2001 1988–2001 1992–2001
APPENDIX TABLE 17. Growth in R&D and article output (fractional counts) of top 200 research universities, by R&D quartile: 1988–2001 and 1992–2001
R&D growth Article growth R&D quartile
SUNY Upstate Medical U. -30 33 -16 -21 4 4
U. PR Mayaguez -31 -26 41 44 4 4
Eastern KY U. NA NA 66 5 NA NA
FL International U. NA NA 154 33 NA NA
U. MD Biotech Institute NA NA NA NA NA NA
NA = not available; either R&D data or article data not reported until after 1992.
R&D = research and development.
SOURCES: Thomson ISI, Science Citation Index and Social Sciences Citation Index, http://www.isinet.com/products/citation/; ipIQ, Inc.; and National Science Foundation,
Division of Science Resources Statistics, Integrated Science and Engineering Resources Data System (WebCASPAR), http://caspar.nsf.gov, special tabulations.
NOTES: Articles on fractional-count basis, i.e., for articles with collaborating institutions, each institution receives fractional credit on basis of proportion of its participation.
Quartiles based on constant dollar R&D growth during periods 1988–2001 and 1992–2001. Universities are listed in descending order of R&D growth during 1988–2001 period.
Top 200 research universities based on total R&D expenditures during the 1988–2001 period.
75

APPENDIX TABLE 18. S&E article output of top 200 research universities, by field: 1988–2001
Method of attribution and field 1988 1989 1990 1991 1992 1993 1994 1995 1996 1997 1998 1999 2000 2001
Fractional counts
All fields 116,952 123,461 126,425 127,814 131,780 130,423 132,504 134,625 134,938 132,444 133,165 133,383 132,245 135,745
Agricultural sciences 2,930 2,968 3,098 3,188 2,736 2,780 2,698 2,517 2,402 2,530 2,448 1,971 2,546 2,173
Astronomy 1,081 1,102 1,161 1,152 1,297 1,246 1,441 1,523 1,607 1,553 1,163 1,697 1,515 1,643
Biological sciences 31,337 33,504 34,341 34,851 35,896 35,550 36,339 36,849 36,714 35,651 36,137 35,640 35,250 36,658
Chemistry 8,357 8,609 9,092 9,399 9,570 9,775 9,399 9,665 9,823 9,528 9,738 9,674 9,857 9,751
Computer sciences 941 1,114 1,074 1,120 1,158 1,232 1,368 1,287 1,289 1,247 1,249 1,306 1,348 1,365
Engineering 5,797 5,939 6,682 6,408 7,560 6,837 7,189 7,321 6,981 6,791 6,956 7,333 6,913 7,656
Geosciences 4,534 4,820 4,963 5,018 5,036 5,557 5,467 5,837 6,060 5,647 5,925 5,937 5,970 6,078
Mathematics 3,112 3,247 2,671 2,758 2,916 2,770 2,751 2,620 2,674 2,506 2,840 2,925 3,064 2,995
Medical sciences 30,444 32,119 32,844 32,733 34,306 33,679 34,467 35,391 34,916 35,651 35,613 35,638 35,002 36,094
Physics 10,727 11,511 11,446 12,374 12,357 12,420 13,265 12,814 12,474 12,029 11,922 11,890 11,285 11,492
Psychology 4,984 4,893 5,215 4,891 5,185 4,671 4,811 5,319 5,609 5,539 5,262 5,446 5,222 5,570
Social sciences 6,302 6,754 6,839 6,893 6,778 6,809 6,616 6,558 6,904 6,772 6,793 6,803 6,988 6,988
Whole counts
All fields 138,876 146,874 151,271 154,021 160,193 159,393 163,304 167,157 168,615 166,881 169,005 170,844 170,475 176,562
Agricultural sciences 3,365 3,424 3,572 3,683 3,204 3,260 3,194 3,005 2,880 3,064 2,998 2,460 3,194 2,748
Astronomy 1,481 1,537 1,655 1,689 1,889 1,870 2,205 2,324 2,514 2,466 1,913 2,785 2,570 2,849
Biological sciences 36,903 39,681 40,966 41,900 43,607 43,360 44,728 45,792 45,741 44,704 45,720 45,588 45,254 47,401
Chemistry 9,439 9,765 10,391 10,871 11,111 11,387 11,069 11,439 11,709 11,437 11,722 11,705 11,983 11,958
Computer sciences 1,116 1,314 1,239 1,353 1,406 1,497 1,696 1,629 1,648 1,667 1,706 1,765 1,800 1,872
Engineering 6,879 7,065 8,010 7,753 9,151 8,310 8,797 9,059 8,623 8,636 8,920 9,455 9,016 10,106
Geosciences 5,548 5,902 6,207 6,270 6,407 7,035 7,018 7,624 7,979 7,567 8,095 8,151 8,284 8,528
Mathematics 3,634 3,797 3,158 3,272 3,527 3,350 3,318 3,197 3,311 3,109 3,562 3,717 3,918 3,903
Medical sciences 37,377 39,404 40,309 40,344 42,450 42,006 43,277 44,432 44,147 45,217 45,616 46,028 45,622 47,445
Physics 13,216 14,168 14,320 15,715 15,999 16,182 17,303 17,004 16,853 16,522 16,457 16,669 16,058 16,467
Psychology 5,684 5,621 5,955 5,618 5,954 5,428 5,578 6,222 6,627 6,539 6,249 6,491 6,202 6,652
Social sciences 7,049 7,502 7,653 7,679 7,657 7,693 7,536 7,520 7,936 7,801 7,775 7,769 8,048 8,117
S&E = science and engineering.
NOTES: For articles with collaborating institutions, fractional counts assign each participating institution fractional credit on basis of proportion of its participation, and whole counts assign the combined group of top
200 research universities one credit for its participation, regardless of the number of participating institutions. "All fields " includes health sciences and professional fields. Top 200 research universities based on total
R&D expenditures during the 1988–2001 period.
SOURCES: Thomson ISI, Science Citation Index and Social Sciences Citation Index, http://www.isinet.com/products/citation/; ipIQ, Inc.; and National Science Foundation, Division of Science Resources Statistics,
special tabulations.
76

APPENDIX TABLE 19. Ratio of fractional to whole counts of S&E articles for top 200 research universities, by institution: 1988–2001
Academic institution 1988 1989 1990 1991 1992 1993 1994 1995 1996 1997 1998 1999 2000 2001
AZ State U. 0.77 0.75 0.75 0.72 0.71 0.72 0.70 0.70 0.67 0.66 0.64 0.65 0.63 0.64
Auburn U. 0.79 0.77 0.77 0.76 0.78 0.75 0.76 0.74 0.71 0.73 0.71 0.69 0.68 0.65
Baylor C. of Medicine 0.68 0.67 0.66 0.65 0.64 0.64 0.61 0.61 0.61 0.61 0.58 0.59 0.57 0.57
Boston C. 0.76 0.73 0.68 0.69 0.65 0.70 0.62 0.62 0.67 0.68 0.63 0.59 0.59 0.59
Boston U. 0.64 0.63 0.63 0.65 0.60 0.59 0.60 0.61 0.60 0.57 0.57 0.59 0.55 0.55
Brandeis U. 0.79 0.74 0.73 0.72 0.68 0.67 0.65 0.65 0.67 0.63 0.64 0.65 0.68 0.64
Brigham Young U. 0.78 0.75 0.72 0.70 0.71 0.72 0.69 0.71 0.69 0.69 0.66 0.67 0.67 0.65
Brown U. 0.65 0.65 0.64 0.64 0.62 0.63 0.63 0.61 0.59 0.60 0.56 0.58 0.56 0.53
CA Institute of Technology 0.72 0.72 0.70 0.69 0.69 0.67 0.65 0.67 0.64 0.63 0.63 0.60 0.55 0.55
Carnegie Mellon U. 0.74 0.72 0.74 0.71 0.69 0.67 0.67 0.69 0.67 0.65 0.64 0.64 0.58 0.56
Case Western Reserve U. 0.70 0.70 0.71 0.70 0.68 0.68 0.67 0.63 0.63 0.63 0.62 0.61 0.60 0.57
C. R. Drew U. of Medicine & Science 0.60 0.56 0.51 0.55 0.51 0.51 0.46 0.55 0.41 0.50 0.45 0.46 0.44 0.44
City U. NY 0.72 0.72 0.71 0.73 0.70 0.70 0.70 0.70 0.69 0.70 0.66 0.65 0.67 0.66
Clark Atlanta U. 0.78 0.82 0.73 0.67 0.73 0.60 0.76 0.65 0.66 0.60 0.61 0.64 0.68 0.60
Clemson U. 0.79 0.74 0.75 0.77 0.74 0.74 0.74 0.71 0.69 0.68 0.68 0.69 0.67 0.67
C. of William & Mary 0.68 0.59 0.64 0.64 0.66 0.63 0.62 0.62 0.62 0.58 0.58 0.60 0.60 0.59
CO School of Mines 0.80 0.75 0.64 0.73 0.68 0.73 0.63 0.71 0.60 0.63 0.62 0.57 0.64 0.61
CO State U. 0.78 0.73 0.75 0.74 0.72 0.70 0.70 0.73 0.68 0.68 0.66 0.65 0.65 0.64
Columbia U. in the City of NY 0.70 0.70 0.68 0.67 0.66 0.65 0.63 0.64 0.63 0.60 0.60 0.61 0.59 0.57
Cornell U. 0.75 0.76 0.74 0.72 0.71 0.70 0.70 0.70 0.66 0.66 0.64 0.64 0.63 0.62
Dartmouth C. 0.71 0.75 0.70 0.71 0.67 0.67 0.65 0.63 0.66 0.64 0.63 0.63 0.61 0.61
Desert Research Institute 0.59 0.81 0.53 0.56 0.60 0.67 0.46 0.54 0.48 0.36 0.54 0.49 0.46 0.45
Drexel U. 0.66 0.70 0.67 0.66 0.64 0.67 0.63 0.67 0.58 0.62 0.59 0.57 0.55 0.51
Duke U. 0.74 0.74 0.73 0.71 0.69 0.68 0.66 0.65 0.64 0.67 0.64 0.63 0.62 0.61
Eastern KY U. 0.66 0.76 0.73 0.70 0.66 0.59 0.70 0.74 0.69 0.63 0.77 0.63 0.66 0.69
Eastern VA Medical School 0.73 0.72 0.71 0.65 0.66 0.63 0.60 0.63 0.55 0.54 0.62 0.50 0.56 0.56
Emory U. 0.72 0.72 0.71 0.68 0.68 0.66 0.64 0.63 0.63 0.62 0.61 0.60 0.60 0.59
FL A&M U. 0.89 0.72 0.73 0.66 0.65 0.64 0.67 0.71 0.63 0.61 0.65 0.60 0.57 0.57
FL International U. 0.71 0.70 0.68 0.71 0.72 0.70 0.68 0.69 0.68 0.71 0.64 0.67 0.61 0.57
FL State U. 0.75 0.75 0.71 0.75 0.70 0.67 0.68 0.65 0.62 0.61 0.62 0.62 0.59 0.60
George Mason U. 0.68 0.71 0.65 0.66 0.69 0.62 0.65 0.62 0.59 0.61 0.59 0.54 0.56 0.58
George Washington U. 0.65 0.62 0.61 0.60 0.60 0.58 0.60 0.57 0.56 0.58 0.59 0.53 0.52 0.51
Georgetown U. 0.66 0.66 0.64 0.62 0.64 0.64 0.64 0.61 0.61 0.60 0.62 0.61 0.60 0.58
GA Institute of Technology 0.74 0.75 0.74 0.74 0.72 0.72 0.74 0.71 0.69 0.69 0.69 0.68 0.68 0.66
GA State U. 0.72 0.73 0.71 0.70 0.67 0.67 0.70 0.65 0.66 0.64 0.62 0.65 0.63 0.62
Harvard U. 0.61 0.61 0.60 0.60 0.58 0.58 0.57 0.57 0.55 0.55 0.55 0.54 0.54 0.53
Howard U. 0.75 0.72 0.70 0.70 0.65 0.68 0.68 0.61 0.63 0.61 0.56 0.56 0.54 0.54
IN U. 0.74 0.73 0.72 0.72 0.72 0.68 0.66 0.68 0.65 0.63 0.63 0.64 0.61 0.60
IA State U. 0.78 0.78 0.78 0.76 0.75 0.74 0.73 0.71 0.70 0.64 0.65 0.65 0.62 0.62
Johns Hopkins U. 0.74 0.73 0.72 0.71 0.69 0.68 0.67 0.64 0.66 0.63 0.63 0.62 0.61 0.59
KS State U. 0.80 0.77 0.78 0.78 0.77 0.74 0.74 0.72 0.71 0.68 0.69 0.68 0.69 0.66
Lehigh U. 0.80 0.76 0.79 0.79 0.77 0.76 0.73 0.77 0.79 0.73 0.71 0.73 0.69 0.71
LA State U., all campuses 0.77 0.77 0.74 0.74 0.74 0.72 0.73 0.72 0.70 0.68 0.69 0.64 0.63 0.62
77

APPENDIX TABLE 19. Ratio of fractional to whole counts of S&E articles for top 200 research universities, by institution: 1988–2001
Academic institution 1988 1989 1990 1991 1992 1993 1994 1995 1996 1997 1998 1999 2000 2001
Loyola U. Chicago 0.63 0.70 0.67 0.68 0.67 0.67 0.66 0.64 0.67 0.67 0.64 0.63 0.61 0.63
MA Institute of Technology 0.73 0.72 0.68 0.69 0.67 0.67 0.65 0.64 0.65 0.63 0.62 0.61 0.60 0.59
Medical C. GA 0.74 0.74 0.76 0.73 0.74 0.71 0.67 0.66 0.64 0.66 0.66 0.72 0.64 0.66
MCP Hahnemann U. 0.66 0.69 0.69 0.69 0.65 0.66 0.65 0.65 0.61 0.60 0.59 0.55 0.51 0.48
Medical C. WI 0.70 0.69 0.68 0.69 0.64 0.67 0.66 0.65 0.66 0.63 0.66 0.63 0.60 0.61
Medical U. SC 0.73 0.73 0.73 0.69 0.70 0.70 0.66 0.69 0.69 0.66 0.64 0.65 0.62 0.62
MI State U. 0.79 0.77 0.78 0.78 0.74 0.74 0.72 0.70 0.69 0.68 0.66 0.67 0.64 0.65
MI Technical U. 0.73 0.73 0.77 0.73 0.71 0.67 0.75 0.67 0.66 0.70 0.67 0.61 0.61 0.63
MS State U. 0.73 0.72 0.75 0.69 0.75 0.68 0.74 0.67 0.70 0.70 0.70 0.65 0.66 0.61
MT State U. Bozeman 0.73 0.76 0.76 0.74 0.71 0.70 0.70 0.64 0.69 0.65 0.63 0.65 0.64 0.62
Mount Sinai School of Medicine 0.68 0.68 0.67 0.68 0.67 0.66 0.64 0.64 0.63 0.62 0.63 0.62 0.59 0.59
Naval Postgraduate School 0.73 0.72 0.77 0.75 0.75 0.76 0.73 0.71 0.67 0.65 0.64 0.61 0.56 0.63
NJ Institute of Technology 0.61 0.64 0.70 0.63 0.68 0.69 0.73 0.69 0.66 0.60 0.62 0.68 0.65 0.63
NM Institute of Mining and Technology 0.66 0.69 0.63 0.62 0.71 0.65 0.71 0.62 0.55 0.55 0.55 0.56 0.59 0.58
NM State U. 0.76 0.72 0.74 0.68 0.70 0.67 0.65 0.65 0.59 0.62 0.60 0.58 0.59 0.58
NY Medical C. 0.71 0.67 0.69 0.68 0.66 0.62 0.63 0.63 0.64 0.61 0.62 0.61 0.61 0.58
NY U. 0.69 0.70 0.70 0.65 0.66 0.67 0.66 0.64 0.64 0.63 0.62 0.60 0.60 0.60
NC State U. 0.78 0.77 0.77 0.75 0.76 0.74 0.73 0.70 0.70 0.69 0.67 0.67 0.66 0.65
ND State U. 0.75 0.77 0.78 0.77 0.80 0.72 0.73 0.73 0.77 0.78 0.75 0.71 0.68 0.68
Northeastern U. 0.69 0.69 0.67 0.71 0.67 0.66 0.65 0.64 0.61 0.59 0.62 0.56 0.57 0.56
Northwestern U. 0.72 0.71 0.70 0.71 0.70 0.68 0.69 0.66 0.64 0.64 0.63 0.63 0.64 0.62
OH State U. 0.78 0.76 0.76 0.75 0.74 0.75 0.72 0.73 0.71 0.69 0.68 0.67 0.64 0.63
OH U. 0.76 0.75 0.71 0.73 0.71 0.71 0.68 0.63 0.68 0.68 0.64 0.65 0.63 0.62
OK State U. 0.73 0.73 0.78 0.73 0.74 0.75 0.74 0.72 0.71 0.67 0.69 0.71 0.70 0.69
Old Dominion U. 0.71 0.70 0.74 0.72 0.71 0.72 0.68 0.60 0.63 0.60 0.59 0.58 0.52 0.58
OR Health & Science U. 0.70 0.70 0.68 0.64 0.65 0.63 0.60 0.59 0.60 0.61 0.61 0.60 0.59 0.56
OR State U. 0.75 0.75 0.73 0.74 0.73 0.73 0.72 0.72 0.70 0.67 0.65 0.66 0.67 0.59
PA State U. 0.78 0.79 0.77 0.76 0.75 0.73 0.74 0.72 0.72 0.69 0.69 0.69 0.67 0.64
Princeton U. 0.72 0.73 0.70 0.69 0.68 0.69 0.67 0.66 0.65 0.66 0.67 0.65 0.61 0.58
Purdue U. 0.78 0.77 0.77 0.75 0.73 0.72 0.72 0.71 0.73 0.70 0.69 0.70 0.65 0.64
Rensselaer Polytechnic Institute 0.77 0.74 0.73 0.74 0.73 0.75 0.71 0.72 0.71 0.70 0.66 0.66 0.64 0.63
Rice U. 0.74 0.75 0.70 0.69 0.72 0.71 0.69 0.67 0.65 0.61 0.66 0.61 0.59 0.61
Rockefeller U. 0.69 0.69 0.68 0.67 0.63 0.62 0.60 0.58 0.61 0.60 0.54 0.57 0.52 0.52
Rush U. 0.68 0.66 0.64 0.65 0.60 0.64 0.62 0.60 0.59 0.56 0.59 0.59 0.58 0.56
Rutgers the State U. NJ 0.75 0.72 0.71 0.72 0.70 0.67 0.69 0.68 0.69 0.67 0.65 0.65 0.62 0.60
Saint Louis U. 0.74 0.67 0.69 0.72 0.69 0.66 0.66 0.63 0.63 0.60 0.59 0.61 0.60 0.58
San Diego State U. 0.71 0.69 0.68 0.66 0.62 0.64 0.61 0.57 0.59 0.59 0.59 0.56 0.53 0.55
San Jose State U. 0.66 0.68 0.61 0.60 0.61 0.65 0.59 0.63 0.56 0.54 0.51 0.56 0.57 0.58
SD State U. 0.78 0.76 0.72 0.77 0.68 0.68 0.73 0.66 0.66 0.69 0.66 0.62 0.63 0.67
Southern IL U. Carbondale 0.77 0.77 0.79 0.73 0.76 0.72 0.73 0.74 0.73 0.72 0.71 0.69 0.67 0.62
Stanford U. 0.73 0.71 0.71 0.69 0.69 0.67 0.67 0.66 0.64 0.63 0.63 0.62 0.62 0.61
SUNY Albany 0.70 0.68 0.67 0.67 0.61 0.59 0.62 0.60 0.58 0.58 0.55 0.57 0.53 0.54
SUNY Binghamton 0.80 0.79 0.78 0.79 0.78 0.81 0.75 0.77 0.75 0.76 0.77 0.70 0.67 0.70
78

APPENDIX TABLE 19. Ratio of fractional to whole counts of S&E articles for top 200 research universities, by institution: 1988–2001
Academic institution 1988 1989 1990 1991 1992 1993 1994 1995 1996 1997 1998 1999 2000 2001
SUNY Buffalo 0.73 0.73 0.73 0.74 0.71 0.73 0.69 0.72 0.70 0.67 0.68 0.68 0.67 0.67
SUNY C. of Environmental Science and Forestry 0.76 0.71 0.74 0.77 0.79 0.77 0.68 0.77 0.67 0.75 0.62 0.65 0.62 0.58
SUNY Health Sciences Center Brooklyn 0.66 0.68 0.70 0.70 0.72 0.72 0.64 0.63 0.62 0.65 0.66 0.62 0.58 0.59
SUNY Stony Brook 0.69 0.70 0.70 0.69 0.67 0.65 0.67 0.65 0.65 0.62 0.64 0.62 0.61 0.60
SUNY Upstate Medical U. 0.72 0.65 0.69 0.67 0.62 0.63 0.65 0.62 0.66 0.63 0.63 0.62 0.67 0.60
Syracuse U. 0.77 0.76 0.69 0.69 0.68 0.69 0.65 0.64 0.61 0.61 0.60 0.64 0.59 0.59
Temple U. 0.71 0.71 0.70 0.67 0.67 0.66 0.66 0.64 0.65 0.65 0.64 0.65 0.64 0.62
TX A&M U. 0.80 0.77 0.76 0.76 0.74 0.74 0.73 0.73 0.71 0.71 0.68 0.66 0.65 0.65
TX Tech U. 0.76 0.78 0.80 0.74 0.74 0.74 0.72 0.71 0.70 0.68 0.67 0.65 0.64 0.62
Thomas Jefferson U. 0.74 0.74 0.73 0.70 0.67 0.70 0.66 0.64 0.65 0.62 0.61 0.60 0.59 0.59
Tufts U. 0.63 0.63 0.61 0.61 0.60 0.65 0.65 0.65 0.63 0.63 0.61 0.61 0.58 0.58
Tulane U. 0.70 0.67 0.66 0.70 0.67 0.65 0.65 0.65 0.66 0.64 0.61 0.62 0.61 0.59
Uniformed Services U. of the Health Sciences 0.57 0.55 0.53 0.55 0.55 0.50 0.51 0.48 0.48 0.46 0.44 0.48 0.45 0.43
U. Akron 0.79 0.78 0.78 0.79 0.77 0.75 0.76 0.74 0.74 0.74 0.74 0.75 0.73 0.72
U. AL 0.71 0.70 0.73 0.67 0.72 0.72 0.72 0.67 0.70 0.69 0.71 0.65 0.57 0.64
U. AL Birmingham 0.73 0.71 0.71 0.69 0.70 0.68 0.66 0.65 0.62 0.62 0.62 0.62 0.62 0.61
U. AL Huntsville 0.67 0.66 0.69 0.64 0.70 0.64 0.65 0.61 0.53 0.51 0.49 0.45 0.50 0.50
U. AK Fairbanks 0.75 0.72 0.73 0.65 0.69 0.69 0.66 0.66 0.64 0.62 0.59 0.61 0.56 0.57
U. AZ 0.73 0.74 0.72 0.71 0.71 0.69 0.68 0.67 0.66 0.66 0.63 0.62 0.61 0.60
U. AR for Medical Sciences 0.65 0.64 0.62 0.61 0.60 0.63 0.58 0.56 0.60 0.61 0.60 0.61 0.57 0.55
U. AR, main campus 0.78 0.75 0.74 0.73 0.75 0.74 0.75 0.75 0.67 0.69 0.70 0.71 0.68 0.71
U. CA Berkeley 0.72 0.71 0.69 0.68 0.67 0.66 0.66 0.64 0.63 0.61 0.62 0.61 0.58 0.57
U. CA Davis 0.77 0.75 0.76 0.73 0.71 0.72 0.71 0.69 0.69 0.67 0.66 0.64 0.65 0.62
U. CA Irvine 0.74 0.73 0.71 0.68 0.68 0.67 0.67 0.66 0.66 0.65 0.64 0.61 0.63 0.61
U. CA Los Angeles 0.73 0.72 0.72 0.70 0.69 0.68 0.67 0.67 0.65 0.64 0.63 0.62 0.61 0.61
U. CA Riverside 0.78 0.78 0.76 0.75 0.74 0.72 0.75 0.68 0.67 0.66 0.65 0.65 0.64 0.61
U. CA San Diego 0.70 0.68 0.68 0.67 0.66 0.65 0.65 0.65 0.63 0.62 0.62 0.60 0.59 0.57
U. CA San Francisco 0.72 0.71 0.70 0.71 0.69 0.69 0.68 0.67 0.65 0.65 0.63 0.63 0.60 0.58
U. CA Santa Barbara 0.74 0.75 0.73 0.72 0.71 0.70 0.68 0.66 0.65 0.66 0.64 0.65 0.61 0.60
U. CA Santa Cruz 0.67 0.69 0.65 0.62 0.65 0.65 0.64 0.63 0.59 0.60 0.60 0.58 0.54 0.51
U. Central FL 0.75 0.75 0.77 0.73 0.70 0.68 0.66 0.66 0.65 0.65 0.64 0.65 0.65 0.61
U. Chicago 0.74 0.72 0.72 0.73 0.71 0.69 0.68 0.67 0.67 0.65 0.66 0.66 0.62 0.61
U. Cincinnati 0.74 0.73 0.73 0.71 0.70 0.70 0.68 0.66 0.63 0.65 0.63 0.63 0.62 0.58
U. CO 0.71 0.69 0.68 0.67 0.66 0.64 0.64 0.63 0.62 0.62 0.61 0.59 0.58 0.58
U. CT 0.73 0.71 0.72 0.71 0.72 0.70 0.69 0.68 0.68 0.66 0.66 0.67 0.63 0.64
U. Dayton 0.69 0.68 0.76 0.67 0.65 0.63 0.64 0.65 0.62 0.62 0.59 0.58 0.57 0.50
U. DE 0.74 0.77 0.73 0.73 0.70 0.71 0.69 0.69 0.67 0.65 0.65 0.65 0.62 0.63
U. FL 0.79 0.77 0.76 0.76 0.74 0.75 0.72 0.71 0.70 0.69 0.69 0.67 0.66 0.65
U. GA 0.77 0.75 0.76 0.74 0.74 0.73 0.74 0.73 0.70 0.71 0.71 0.68 0.66 0.65
U. HI Manoa 0.71 0.70 0.69 0.69 0.68 0.66 0.64 0.63 0.59 0.61 0.57 0.54 0.55 0.53
U. Houston 0.75 0.72 0.74 0.73 0.74 0.70 0.70 0.70 0.69 0.67 0.64 0.64 0.63 0.63
U. ID 0.75 0.76 0.74 0.71 0.78 0.71 0.71 0.69 0.68 0.67 0.67 0.66 0.66 0.61
U. IL Chicago 0.72 0.71 0.69 0.67 0.68 0.68 0.66 0.65 0.63 0.63 0.60 0.63 0.61 0.60
79

APPENDIX TABLE 19. Ratio of fractional to whole counts of S&E articles for top 200 research universities, by institution: 1988–2001
Academic institution 1988 1989 1990 1991 1992 1993 1994 1995 1996 1997 1998 1999 2000 2001
U. IL Urbana-Champaign 0.77 0.74 0.74 0.74 0.71 0.69 0.68 0.67 0.67 0.65 0.67 0.66 0.65 0.64
U. IA 0.76 0.77 0.76 0.75 0.72 0.73 0.70 0.69 0.70 0.70 0.68 0.68 0.65 0.64
U. KS 0.71 0.72 0.74 0.72 0.69 0.69 0.69 0.68 0.68 0.66 0.66 0.66 0.62 0.63
U. KY 0.77 0.75 0.76 0.76 0.72 0.73 0.73 0.74 0.71 0.72 0.69 0.70 0.67 0.66
U. LA at Lafayette 0.75 0.75 0.73 0.78 0.75 0.77 0.78 0.74 0.73 0.65 0.75 0.76 0.70 0.66
U. Louisville 0.78 0.76 0.75 0.75 0.74 0.70 0.69 0.70 0.70 0.67 0.69 0.66 0.64 0.62
U. ME 0.73 0.76 0.74 0.74 0.70 0.73 0.70 0.71 0.72 0.69 0.66 0.62 0.66 0.62
U. MD Baltimore 0.70 0.71 0.66 0.66 0.62 0.65 0.65 0.62 0.61 0.60 0.61 0.61 0.55 0.56
U. MD Baltimore County 0.72 0.72 0.68 0.67 0.65 0.67 0.70 0.66 0.66 0.63 0.60 0.60 0.60 0.54
U. MD Biotechnology Institute na na na na na na 0.47 0.49 0.44 0.41 0.44 0.45 0.43 0.45
U. MD Center for Environmental Science 0.60 0.64 0.63 0.64 0.62 0.66 0.60 0.59 0.58 0.53 0.61 0.60 0.62 0.57
U. MD College Park 0.70 0.69 0.69 0.68 0.65 0.64 0.61 0.60 0.60 0.58 0.59 0.58 0.56 0.56
U. MA 0.75 0.76 0.73 0.73 0.74 0.72 0.70 0.67 0.67 0.63 0.64 0.64 0.64 0.63
U. of Medicine and Dentistry NJ 0.69 0.69 0.69 0.70 0.71 0.69 0.67 0.67 0.67 0.66 0.63 0.63 0.62 0.60
U. Memphis 0.74 0.72 0.70 0.68 0.67 0.68 0.66 0.64 0.67 0.65 0.66 0.63 0.59 0.58
U. Miami 0.71 0.72 0.71 0.71 0.68 0.67 0.65 0.62 0.65 0.61 0.63 0.61 0.62 0.60
U. MI 0.76 0.75 0.75 0.74 0.73 0.72 0.71 0.68 0.68 0.67 0.66 0.66 0.63 0.63
U. MN 0.74 0.73 0.73 0.73 0.71 0.70 0.70 0.69 0.67 0.66 0.65 0.64 0.63 0.62
U. MS, all campuses 0.72 0.71 0.72 0.71 0.69 0.69 0.68 0.67 0.67 0.65 0.68 0.67 0.66 0.65
U. MO Columbia 0.74 0.73 0.76 0.73 0.74 0.73 0.74 0.73 0.70 0.71 0.70 0.69 0.68 0.67
U. MO Rolla 0.75 0.74 0.79 0.75 0.76 0.77 0.74 0.65 0.68 0.68 0.67 0.68 0.63 0.64
U. MT 0.79 0.73 0.76 0.67 0.66 0.65 0.75 0.62 0.65 0.64 0.68 0.62 0.64 0.68
U. NE Lincoln 0.77 0.75 0.74 0.73 0.72 0.74 0.75 0.71 0.72 0.69 0.70 0.70 0.66 0.65
U. NE Medical Center 0.75 0.74 0.73 0.73 0.71 0.68 0.68 0.68 0.68 0.65 0.63 0.62 0.60 0.59
U. NV Las Vegas 0.73 0.71 0.82 0.69 0.65 0.69 0.70 0.64 0.69 0.63 0.61 0.60 0.61 0.64
U. NV Reno 0.72 0.73 0.76 0.72 0.72 0.70 0.71 0.69 0.68 0.65 0.65 0.67 0.68 0.63
U. NH 0.70 0.72 0.70 0.69 0.65 0.64 0.59 0.64 0.60 0.57 0.54 0.58 0.56 0.52
U. NM 0.70 0.70 0.66 0.67 0.64 0.66 0.63 0.62 0.62 0.61 0.59 0.59 0.58 0.58
U. NC Chapel Hill 0.74 0.74 0.74 0.73 0.70 0.70 0.68 0.68 0.68 0.66 0.64 0.65 0.62 0.60
U. ND 0.69 0.73 0.69 0.69 0.70 0.76 0.74 0.70 0.67 0.64 0.66 0.60 0.59 0.63
U. North TX 0.78 0.72 0.70 0.71 0.71 0.72 0.73 0.72 0.67 0.67 0.68 0.69 0.67 0.65
U. Notre Dame 0.76 0.74 0.75 0.72 0.73 0.72 0.68 0.68 0.69 0.67 0.67 0.67 0.63 0.59
U. OK 0.72 0.72 0.71 0.68 0.68 0.66 0.64 0.66 0.63 0.63 0.63 0.62 0.60 0.58
U. OR 0.78 0.76 0.73 0.73 0.71 0.71 0.69 0.66 0.64 0.63 0.64 0.63 0.59 0.59
U. PA 0.70 0.70 0.68 0.68 0.67 0.67 0.67 0.65 0.64 0.64 0.64 0.64 0.62 0.61
U. Pittsburgh 0.73 0.74 0.72 0.72 0.71 0.70 0.68 0.68 0.69 0.69 0.66 0.66 0.63 0.59
U. PR Mayaguez 0.65 0.69 0.68 0.56 0.65 0.42 0.48 0.58 0.63 0.68 0.58 0.59 0.49 0.57
U. PR Medical Sciences Campus 0.69 0.68 0.69 0.64 0.67 0.59 0.58 0.61 0.58 0.50 0.52 0.50 0.56 0.50
U. RI 0.72 0.69 0.68 0.72 0.70 0.67 0.68 0.63 0.62 0.63 0.64 0.63 0.60 0.62
U. Rochester 0.77 0.73 0.76 0.74 0.71 0.68 0.70 0.70 0.67 0.69 0.68 0.68 0.62 0.60
U. SC 0.70 0.70 0.71 0.72 0.71 0.73 0.68 0.66 0.67 0.68 0.64 0.65 0.63 0.60
U. Southern CA 0.72 0.74 0.73 0.72 0.70 0.70 0.68 0.68 0.66 0.65 0.63 0.63 0.62 0.60
80

APPENDIX TABLE 19. Ratio of fractional to whole counts of S&E articles for top 200 research universities, by institution: 1988–2001
Academic institution 1988 1989 1990 1991 1992 1993 1994 1995 1996 1997 1998 1999 2000 2001
U. South FL 0.71 0.68 0.69 0.70 0.71 0.67 0.68 0.68 0.64 0.65 0.64 0.64 0.63 0.62
U. TN System 0.65 0.67 0.66 0.65 0.64 0.62 0.61 0.62 0.60 0.60 0.60 0.58 0.57 0.55
U. TX Arlington 0.78 0.78 0.74 0.71 0.73 0.71 0.70 0.73 0.72 0.71 0.69 0.71 0.59 0.57
U. TX Austin 0.77 0.77 0.76 0.74 0.75 0.73 0.72 0.71 0.69 0.69 0.69 0.68 0.65 0.63
U. TX Dallas 0.72 0.73 0.67 0.70 0.68 0.68 0.62 0.67 0.59 0.60 0.60 0.61 0.57 0.50
U. TX El Paso 0.71 0.70 0.72 0.72 0.72 0.74 0.67 0.71 0.67 0.69 0.67 0.64 0.64 0.57
U. TX Health Science Center Houston 0.75 0.76 0.73 0.73 0.70 0.71 0.71 0.69 0.67 0.66 0.66 0.64 0.63 0.62
U. TX Health Science Center San Antonio 0.68 0.69 0.67 0.68 0.65 0.65 0.61 0.63 0.63 0.63 0.56 0.60 0.58 0.56
U. TX Medical Branch Galveston 0.75 0.78 0.76 0.75 0.73 0.72 0.72 0.73 0.71 0.70 0.70 0.68 0.67 0.64
U. TX Southwestern Medical Center Dallas 0.75 0.72 0.74 0.75 0.68 0.69 0.71 0.69 0.66 0.65 0.65 0.65 0.62 0.61
U. UT 0.77 0.73 0.73 0.72 0.71 0.70 0.67 0.67 0.64 0.65 0.64 0.63 0.64 0.63
U. VA 0.79 0.77 0.77 0.76 0.74 0.72 0.71 0.69 0.70 0.68 0.68 0.66 0.66 0.63
U. VT 0.74 0.75 0.77 0.75 0.73 0.71 0.71 0.69 0.67 0.66 0.65 0.67 0.66 0.65
U. WA 0.72 0.72 0.70 0.69 0.69 0.67 0.66 0.65 0.64 0.64 0.63 0.63 0.60 0.60
U. WI Madison 0.78 0.77 0.77 0.74 0.74 0.74 0.73 0.71 0.70 0.70 0.68 0.67 0.65 0.63
U. WI Milwaukee 0.74 0.75 0.75 0.77 0.71 0.72 0.74 0.71 0.72 0.71 0.70 0.67 0.68 0.66
U. WY 0.71 0.71 0.68 0.71 0.71 0.71 0.72 0.70 0.68 0.66 0.64 0.64 0.65 0.60
Utah State U. 0.72 0.74 0.71 0.70 0.71 0.70 0.69 0.69 0.71 0.72 0.65 0.67 0.63 0.66
Vanderbilt U. 0.74 0.73 0.73 0.71 0.69 0.66 0.65 0.65 0.67 0.64 0.62 0.62 0.60 0.59
VA Commonwealth U. 0.76 0.76 0.73 0.73 0.75 0.71 0.70 0.71 0.68 0.68 0.67 0.65 0.66 0.64
VA Polytech Institute and State U. 0.78 0.78 0.78 0.77 0.76 0.79 0.73 0.71 0.70 0.70 0.69 0.66 0.63 0.60
Wake Forest U. 0.77 0.83 0.77 0.76 0.71 0.71 0.70 0.69 0.66 0.67 0.64 0.66 0.63 0.60
WA State U. 0.79 0.76 0.76 0.74 0.73 0.73 0.72 0.71 0.71 0.68 0.67 0.66 0.65 0.66
Washington U. St Louis 0.77 0.76 0.74 0.73 0.72 0.70 0.69 0.70 0.70 0.69 0.66 0.66 0.62 0.63
Wayne State U. 0.70 0.70 0.71 0.70 0.70 0.68 0.68 0.66 0.66 0.62 0.64 0.64 0.62 0.60
WV U. 0.74 0.74 0.72 0.73 0.71 0.76 0.72 0.71 0.70 0.73 0.70 0.69 0.68 0.66
Wright State U. 0.69 0.70 0.72 0.66 0.68 0.72 0.69 0.64 0.64 0.64 0.66 0.59 0.65 0.62
Yale U. 0.74 0.74 0.71 0.73 0.71 0.71 0.68 0.68 0.66 0.67 0.67 0.64 0.63 0.61
Yeshiva U. 0.68 0.66 0.67 0.66 0.67 0.65 0.65 0.64 0.64 0.61 0.63 0.60 0.57 0.59
S&E = science and engineering.
SOURCES: Thomson ISI, Science Citation Index and Social Sciences Citation Index, http://www.isinet.com/products/citation; ipIQ, Inc.; and National Science Foundation, Division of Science Resources Statistics, special tabulations.
NOTES: For articles with collaborating institutions, fractional counts assign each participating institution fractional credit on basis of proportion of its participation, and whole counts assign each participating institution one credit for its
participation. Ratio measures collaboration trends, where a lower ratio signifies more collaboration. Top 200 research universities based on total R&D expenditures during the 1988 –2001 period.
81
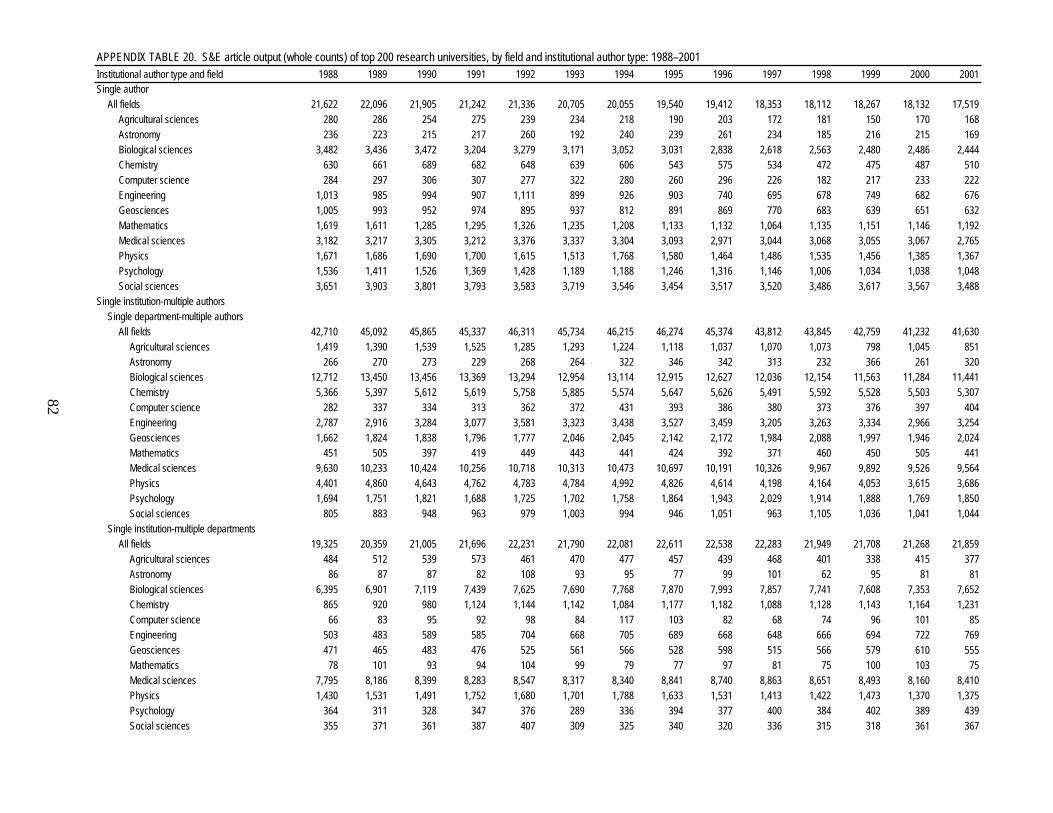
APPENDIX TABLE 20. S&E article output (whole counts) of top 200 research universities, by field and institutional author type: 1988–2001
Institutional author type and field 1988 1989 1990 1991 1992 1993 1994 1995 1996 1997 1998 1999 2000 2001
Single author
All fields 21,622 22,096 21,905 21,242 21,336 20,705 20,055 19,540 19,412 18,353 18,112 18,267 18,132 17,519
Agricultural sciences 280 286 254 275 239 234 218 190 203 172 181 150 170 168
Astronomy 236 223 215 217 260 192 240 239 261 234 185 216 215 169
Biological sciences 3,482 3,436 3,472 3,204 3,279 3,171 3,052 3,031 2,838 2,618 2,563 2,480 2,486 2,444
Chemistry 630 661 689 682 648 639 606 543 575 534 472 475 487 510
Computer science 284 297 306 307 277 322 280 260 296 226 182 217 233 222
Engineering 1,013 985 994 907 1,111 899 926 903 740 695 678 749 682 676
Geosciences 1,005 993 952 974 895 937 812 891 869 770 683 639 651 632
Mathematics 1,619 1,611 1,285 1,295 1,326 1,235 1,208 1,133 1,132 1,064 1,135 1,151 1,146 1,192
Medical sciences 3,182 3,217 3,305 3,212 3,376 3,337 3,304 3,093 2,971 3,044 3,068 3,055 3,067 2,765
Physics 1,671 1,686 1,690 1,700 1,615 1,513 1,768 1,580 1,464 1,486 1,535 1,456 1,385 1,367
Psychology 1,536 1,411 1,526 1,369 1,428 1,189 1,188 1,246 1,316 1,146 1,006 1,034 1,038 1,048
Social sciences 3,651 3,903 3,801 3,793 3,583 3,719 3,546 3,454 3,517 3,520 3,486 3,617 3,567 3,488
Single institution-multiple authors
Single department-multiple authors
All fields 42,710 45,092 45,865 45,337 46,311 45,734 46,215 46,274 45,374 43,812 43,845 42,759 41,232 41,630
Agricultural sciences 1,419 1,390 1,539 1,525 1,285 1,293 1,224 1,118 1,037 1,070 1,073 798 1,045 851
Astronomy 266 270 273 229 268 264 322 346 342 313 232 366 261 320
Biological sciences 12,712 13,450 13,456 13,369 13,294 12,954 13,114 12,915 12,627 12,036 12,154 11,563 11,284 11,441
Chemistry 5,366 5,397 5,612 5,619 5,758 5,885 5,574 5,647 5,626 5,491 5,592 5,528 5,503 5,307
Computer science 282 337 334 313 362 372 431 393 386 380 373 376 397 404
Engineering 2,787 2,916 3,284 3,077 3,581 3,323 3,438 3,527 3,459 3,205 3,263 3,334 2,966 3,254
Geosciences 1,662 1,824 1,838 1,796 1,777 2,046 2,045 2,142 2,172 1,984 2,088 1,997 1,946 2,024
Mathematics 451 505 397 419 449 443 441 424 392 371 460 450 505 441
Medical sciences 9,630 10,233 10,424 10,256 10,718 10,313 10,473 10,697 10,191 10,326 9,967 9,892 9,526 9,564
Physics 4,401 4,860 4,643 4,762 4,783 4,784 4,992 4,826 4,614 4,198 4,164 4,053 3,615 3,686
Psychology 1,694 1,751 1,821 1,688 1,725 1,702 1,758 1,864 1,943 2,029 1,914 1,888 1,769 1,850
Social sciences 805 883 948 963 979 1,003 994 946 1,051 963 1,105 1,036 1,041 1,044
Single institution-multiple departments
All fields 19,325 20,359 21,005 21,696 22,231 21,790 22,081 22,611 22,538 22,283 21,949 21,708 21,268 21,859
Agricultural sciences 484 512 539 573 461 470 477 457 439 468 401 338 415 377
Astronomy 86 87 87 82 108 93 95 77 99 101 62 95 81 81
Biological sciences 6,395 6,901 7,119 7,439 7,625 7,690 7,768 7,870 7,993 7,857 7,741 7,608 7,353 7,652
Chemistry 865 920 980 1,124 1,144 1,142 1,084 1,177 1,182 1,088 1,128 1,143 1,164 1,231
Computer science 66 83 95 92 98 84 117 103 82 68 74 96 101 85
Engineering 503 483 589 585 704 668 705 689 668 648 666 694 722 769
Geosciences 471 465 483 476 525 561 566 528 598 515 566 579 610 555
Mathematics 78 101 93 94 104 99 79 77 97 81 75 100 103 75
Medical sciences 7,795 8,186 8,399 8,283 8,547 8,317 8,340 8,841 8,740 8,863 8,651 8,493 8,160 8,410
Physics 1,430 1,531 1,491 1,752 1,680 1,701 1,788 1,633 1,531 1,413 1,422 1,473 1,370 1,375
Psychology 364 311 328 347 376 289 336 394 377 400 384 402 389 439
Social sciences 355 371 361 387 407 309 325 340 320 336 315 318 361 367
82

APPENDIX TABLE 20. S&E article output (whole counts) of top 200 research universities, by field and institutional author type: 1988–2001
Institutional author type and field 1988 1989 1990 1991 1992 1993 1994 1995 1996 1997 1998 1999 2000 2001
Multiple institutions
More than one top 200 institution
All fields 11,122 12,086 12,486 13,033 13,474 13,397 13,892 14,230 14,840 14,592 14,840 15,038 15,527 16,413
Agricultural sciences 299 302 264 292 265 281 269 242 239 257 238 191 279 220
Astronomy 133 145 154 164 160 169 172 198 173 196 114 202 164 192
Biological sciences 2,923 3,170 3,360 3,486 3,698 3,687 3,886 3,912 4,161 4,079 4,191 4,173 4,371 4,684
Chemistry 450 523 556 549 531 583 548 602 677 632 713 659 757 728
Computer science 139 193 166 169 175 181 204 200 174 168 185 174 184 190
Engineering 447 460 514 513 623 541 602 569 552 510 515 613 616 739
Geosciences 439 513 525 569 568 613 617 650 715 632 678 733 717 695
Mathematics 454 489 409 430 459 419 463 426 428 403 477 478 499 439
Medical sciences 2,680 2,901 3,013 3,090 3,233 3,186 3,414 3,506 3,582 3,687 3,790 3,873 3,804 4,183
Physics 865 912 911 1,039 998 1,037 1,101 1,123 1,132 1,101 1,067 989 1,022 1,031
Psychology 672 669 763 722 838 701 723 862 897 893 897 1,019 957 1,079
Social sciences 723 831 878 941 906 880 833 861 994 926 895 862 969 966
Top 200 institution(s) and other U.S.
institution(s)
All fields 29,753 31,160 32,483 33,067 34,666 34,423 35,595 37,048 37,276 37,224 37,515 38,098 37,814 39,218
Agricultural sciences 619 610 644 653 627 596 609 628 564 675 627 548 689 599
Astronomy 370 383 427 424 438 467 510 541 550 538 367 540 520 559
Biological sciences 7,319 8,204 8,452 8,806 9,392 9,130 9,708 10,163 9,916 9,773 9,883 9,923 9,731 10,225
Chemistry 1,101 1,141 1,272 1,472 1,446 1,486 1,533 1,635 1,689 1,635 1,636 1,634 1,731 1,621
Computer science 181 230 197 275 262 296 327 317 337 419 420 448 424 446
Engineering 1,380 1,355 1,656 1,618 1,941 1,679 1,851 1,932 1,798 2,031 2,095 2,154 2,039 2,265
Geosciences 1,201 1,213 1,433 1,372 1,462 1,621 1,647 1,887 1,871 1,926 2,108 2,187 2,142 2,232
Mathematics 285 308 281 289 284 319 294 306 303 270 325 304 356 354
Medical sciences 11,356 11,713 11,810 11,711 12,146 12,206 12,539 12,715 12,775 12,747 13,053 13,188 13,081 13,715
Physics 2,536 2,587 2,755 2,971 3,072 2,986 3,000 2,977 3,022 2,937 2,728 2,922 2,706 2,728
Psychology 1,113 1,131 1,165 1,137 1,182 1,145 1,153 1,329 1,519 1,450 1,400 1,450 1,399 1,444
Social sciences 990 957 1,024 982 1,066 1,037 1,057 1,124 1,165 1,169 1,141 1,053 1,208 1,219
Top 200 institution(s) and foreign institution(s)
All fields 11,832 13,242 14,283 15,946 17,762 18,392 20,021 21,495 22,703 23,786 25,391 27,020 28,126 30,545
Agricultural sciences 234 286 293 328 294 341 333 320 347 374 402 369 517 451
Astronomy 274 291 323 370 440 447 531 560 652 637 601 800 797 923
Biological sciences 3,335 3,702 4,132 4,498 4,994 5,238 5,622 6,098 6,342 6,455 7,053 7,502 7,595 8,307
Chemistry 925 1,019 1,143 1,280 1,415 1,471 1,513 1,584 1,692 1,799 1,907 1,957 2,061 2,182
Computer science 143 144 116 169 183 196 287 300 321 345 379 371 386 430
Engineering 665 757 874 918 1,012 1,021 1,098 1,218 1,208 1,309 1,453 1,615 1,674 2,026
Geosciences 627 721 770 869 949 966 1,038 1,179 1,299 1,304 1,419 1,520 1,665 1,778
Mathematics 715 752 657 701 852 776 783 784 915 864 1,033 1,151 1,232 1,297
Medical sciences 2,051 2,404 2,546 2,850 3,299 3,406 3,758 4,085 4,254 4,663 5,123 5,465 5,653 6,239
Physics 1,862 2,085 2,244 2,798 3,008 3,160 3,632 3,774 3,910 4,152 4,231 4,407 4,578 4,742
Psychology 258 306 309 311 346 339 360 462 481 541 540 601 554 664
83
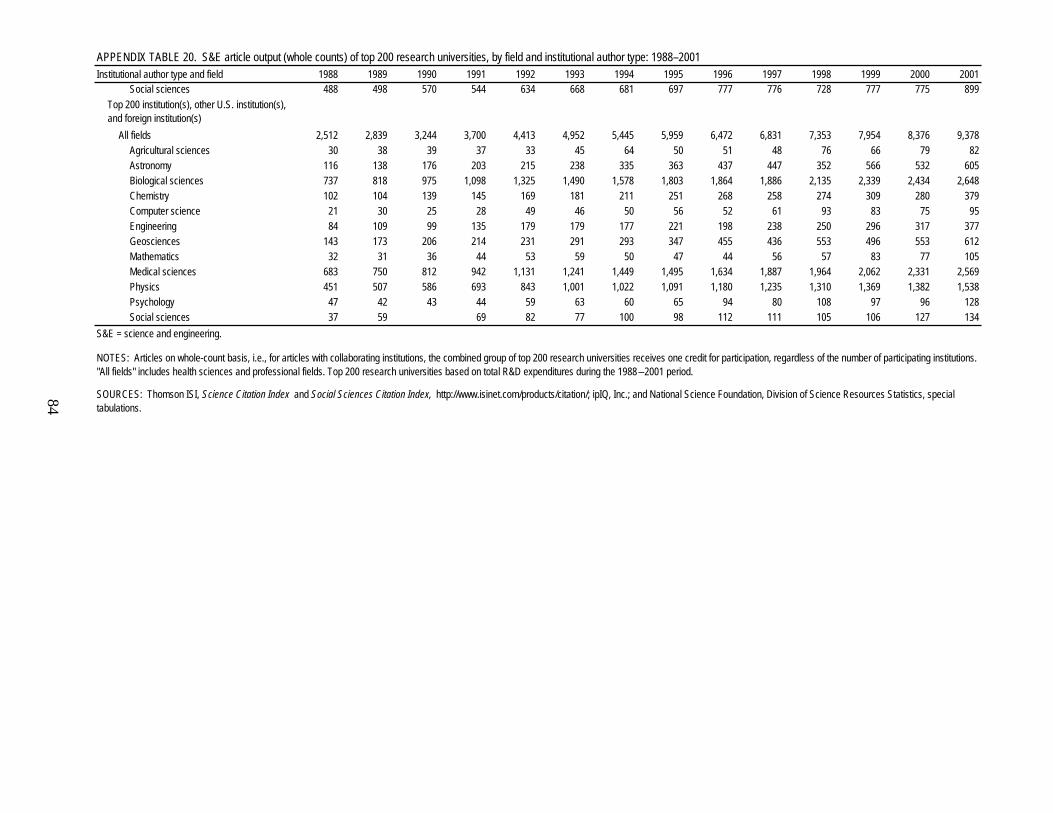
APPENDIX TABLE 20. S&E article output (whole counts) of top 200 research universities, by field and institutional author type: 1988–2001
Institutional author type and field 1988 1989 1990 1991 1992 1993 1994 1995 1996 1997 1998 1999 2000 2001
Social sciences 488 498 570 544 634 668 681 697 777 776 728 777 775 899
Top 200 institution(s), other U.S. institution(s),
and foreign institution(s)
All fields 2,512 2,839 3,244 3,700 4,413 4,952 5,445 5,959 6,472 6,831 7,353 7,954 8,376 9,378
Agricultural sciences 30 38 39 37 33 45 64 50 51 48 76 66 79 82
Astronomy 116 138 176 203 215 238 335 363 437 447 352 566 532 605
Biological sciences 737 818 975 1,098 1,325 1,490 1,578 1,803 1,864 1,886 2,135 2,339 2,434 2,648
Chemistry 102 104 139 145 169 181 211 251 268 258 274 309 280 379
Computer science 21 30 25 28 49 46 50 56 52 61 93 83 75 95
Engineering 84 109 99 135 179 179 177 221 198 238 250 296 317 377
Geosciences 143 173 206 214 231 291 293 347 455 436 553 496 553 612
Mathematics 32 31 36 44 53 59 50 47 44 56 57 83 77 105
Medical sciences 683 750 812 942 1,131 1,241 1,449 1,495 1,634 1,887 1,964 2,062 2,331 2,569
Physics 451 507 586 693 843 1,001 1,022 1,091 1,180 1,235 1,310 1,369 1,382 1,538
Psychology 47 42 43 44 59 63 60 65 94 80 108 97 96 128
Social sciences 37 59 69 82 77 100 98 112 111 105 106 127 134
S&E = science and engineering.
SOURCES: Thomson ISI, Science Citation Index and Social Sciences Citation Index, http://www.isinet.com/products/citation/; ipIQ, Inc.; and National Science Foundation, Division of Science Resources Statistics, special
tabulations.
NOTES: Articles on whole-count basis, i.e., for articles with collaborating institutions, the combined group of top 200 research universities receives one credit for participation, regardless of the number of participating institutions.
"All fields" includes health sciences and professional fields. Top 200 research universities based on total R&D expenditures during the 1988–2001 period.
84