changing cropping patterns and it's implications …...patterns and it's implications on...
TRANSCRIPT
1
CHANGING CROPPING PATTERNS AND
IT'S IMPLICATIONS ON HOUSEHOLD
FOOD SECURITY AND NUTRITION
Major Project Thesis
Submitted by
SUNAYANA SAJITH
For the partial fulfillment of the
Degree of Master of Science in CLIMATE SCIENCE AND POLICY
Submitted to Department of Energy and Environment
TERI University
May 2017
2
DECLARATION
This is to certify that the work that forms the basis of this project “CHANGING
CROPPING PATTERNS AND IT'S IMPLICATIONS ON HOUSEHOLD FOOD
SECURITY AND NUTRITION” is an original work carried out by me and has not
been submitted anywhere else for the award of any degree.
I certify that all sources of information and data are fully acknowledged in the project
thesis.
SUNAYANA SAJITH
Date: 19th May 2017
3
CERTIFICATE
This is to certify that SUNAYANA SAJITH has carried out her major project in
partial fulfillment of the requirement for the degree of Master of Science in
CLIMATE SCIENCE AND POLICY on the topic “CHANGING CROPPING
PATTERNS AND IT'S IMPLICATIONS ON HOUSEHOLD FOOD SECURITY
AND NUTRITION” during January 2017 to May 2017. The project was carried out at
the ASHOKA TRUST FOR RESEARCH IN ECOLOGY AND THE
ENVIRONMENT, BENGALURU.
The thesis embodies the original work of the candidate to the best of our knowledge.
Date: 14th May 2017
Dr. Shrinivas Badiger Ms. Fawzia Tarannum
(External Supervisor) (Internal Supervisor)
Fellow Lecturer and Coordinator
ATREE, Bengaluru Department of Regional Water Studies
TERI University, New Delhi
Dr Suresh Jain
Professor & Head
Department of Energy and Environment
TERI University
New Delhi
4
ACKNOWLEDGEMENT
I would like to thank my external supervisor, Dr. Shrinivas Badiger for his constant
support throughout my internship at ATREE. Since day one he has taken active
interest in my progress. His constant mentorship has kept me from wandering off my
topic, and build my knowledge in the field of agriculture and water. Apart from my
thesis work the wide range of talks organized at ATREE aided my knowledge in
multiple disciplines. Dr. Badiger took a keen interest in my plans for the future and
encouraged me to achieve them. He rendered motivation which pushed me to strive
for the best.
Ms. Divya Solomon has been an integral part in shaping this project and making it
what it is. Right from the application process until submission of the thesis Divya has
been more than just a mentor. Despite her busy schedule, she took time out to look
into my application and interview me when she was half way across the globe. Once I
started my internship she sat me down to explain the project and help me carve out a
niche in it and make it my thesis. I owe all that I’ve achieved in these four months to
Ms. Divya.
Though our interactions were reduced to mails, Ms. Fawzia Tarranum is the best
supervisor I could get. Ms. Fawzia’s knowledge on livelihoods and water was
instrumental in guiding me through my thesis. When fieldwork was at its toughest she
would send refreshing motivational words to keep me going and tell me that I’m on
the right track.
The opportunity of doing a master’s thesis has immensely contributed to my learning
curve, which would not have been possible without TERI University. ATREE has a
wonderful atmosphere, which helps curate budding ideas. It is an excellent place for a
student to start their career. I would like to thank Dr. Jagdish Krishnaswamy and Dr.
Milind Bunyan who have reviewed my worth and given their valuable comments on
it. I would like to thank Ms. Madhavi for coordinating everything.
Mr. Sayan, Mr Venkat and Ms. Ulka thank you for all your valuable suggestions
during my presentation at ATREE. Fieldwork would have been impossible without
my translator Mr. Vivek. I will be indebted to Mr. Sendil and Family who graciously
volunteered to house me for a week during the survey in their village,
Rangampalayam. The ever-reliable auto driver Mr. Mahindran eased the tension of
commuting to new villages. He was ever present to even drive me to the bus stop at
5
12 midnight to catch a bus to Bangalore and saw to that I felt safe even at that
ungodly hour on a deserted highway.
Lastly, but never the least I would like to thank Dr. Venkat and Mr. Kumaran who
made life at Bhavanisagar field station a wonderful experience and saw to the smooth
functioning of work. I would also like to thank Shashank, Devika, Ketan and Ruchie
for always being there when I needed a friendly face. Devika took my mind off the
intensive fieldwork with hearty conversations and giving me company to bing watch
Friends TV series. Finally, I would like to thank my parents who have patiently sat
through all my ranting and put up with my zombie like behavior when I refuse to eat
and sleep so that I could meet deadlines. If it weren’t for their constant support this
thesis wouldn’t have taken shape. I would like to thank my brother Aditya for asking
me to take a chill pill whenever I told him about the deadlines and workload. My
furry siblings, Coochipoo and Rene where always beside me, quite literally, slept on
my bed and made sure these four months with them were bliss.
Thank you all.
6
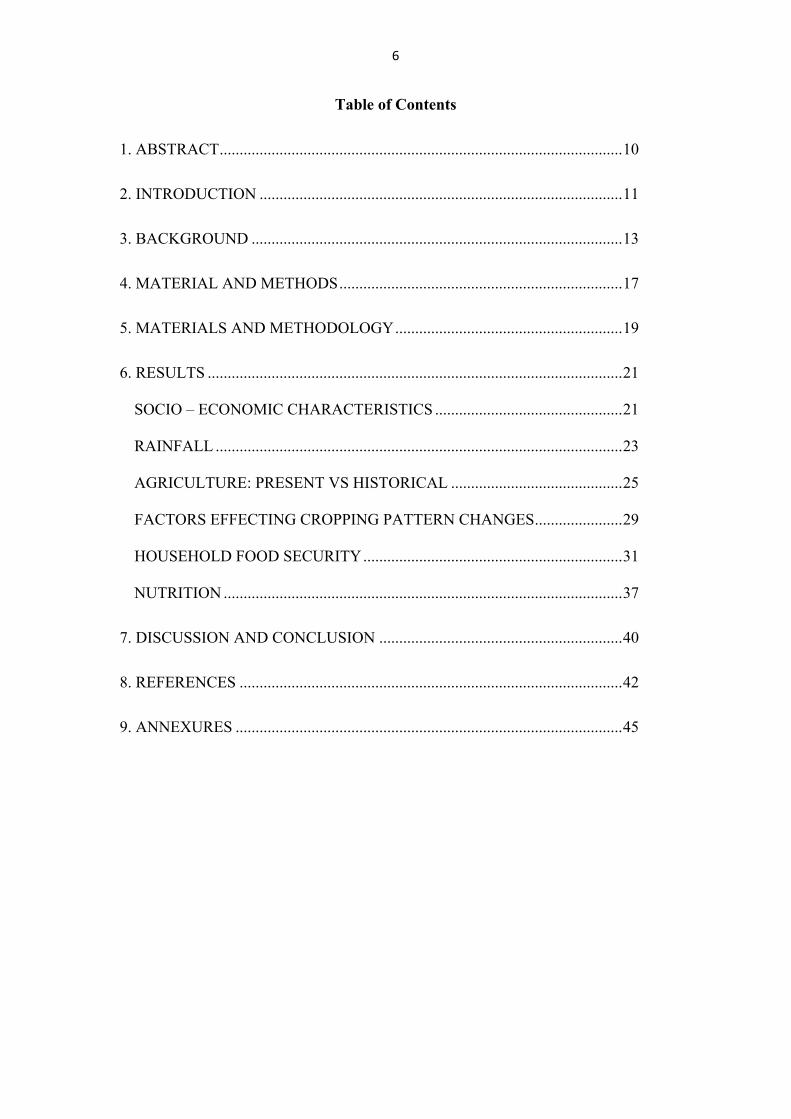
Table of Contents
1. ABSTRACT ..................................................................................................... 10
2. INTRODUCTION ........................................................................................... 11
3. BACKGROUND ............................................................................................. 13
4. MATERIAL AND METHODS ....................................................................... 17
5. MATERIALS AND METHODOLOGY ......................................................... 19
6. RESULTS ........................................................................................................ 21
SOCIO – ECONOMIC CHARACTERISTICS ............................................... 21
RAINFALL ...................................................................................................... 23
AGRICULTURE: PRESENT VS HISTORICAL ........................................... 25
FACTORS EFFECTING CROPPING PATTERN CHANGES ...................... 29
HOUSEHOLD FOOD SECURITY ................................................................. 31
NUTRITION .................................................................................................... 37
7. DISCUSSION AND CONCLUSION ............................................................. 40
8. REFERENCES ................................................................................................ 42
9. ANNEXURES ................................................................................................. 45
7
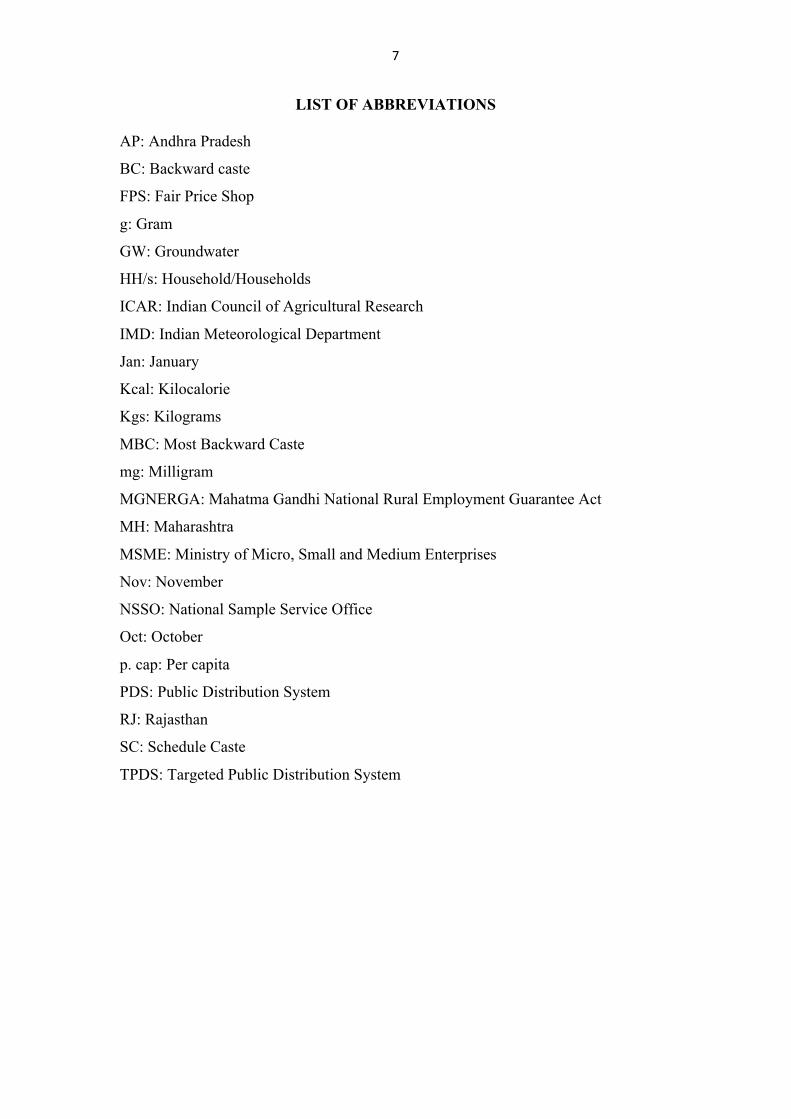
LIST OF ABBREVIATIONS AP: Andhra Pradesh
BC: Backward caste
FPS: Fair Price Shop
g: Gram
GW: Groundwater
HH/s: Household/Households
ICAR: Indian Council of Agricultural Research
IMD: Indian Meteorological Department
Jan: January
Kcal: Kilocalorie
Kgs: Kilograms
MBC: Most Backward Caste
mg: Milligram
MGNERGA: Mahatma Gandhi National Rural Employment Guarantee Act
MH: Maharashtra
MSME: Ministry of Micro, Small and Medium Enterprises
Nov: November
NSSO: National Sample Service Office
Oct: October
p. cap: Per capita
PDS: Public Distribution System
RJ: Rajasthan
SC: Schedule Caste
TPDS: Targeted Public Distribution System
8
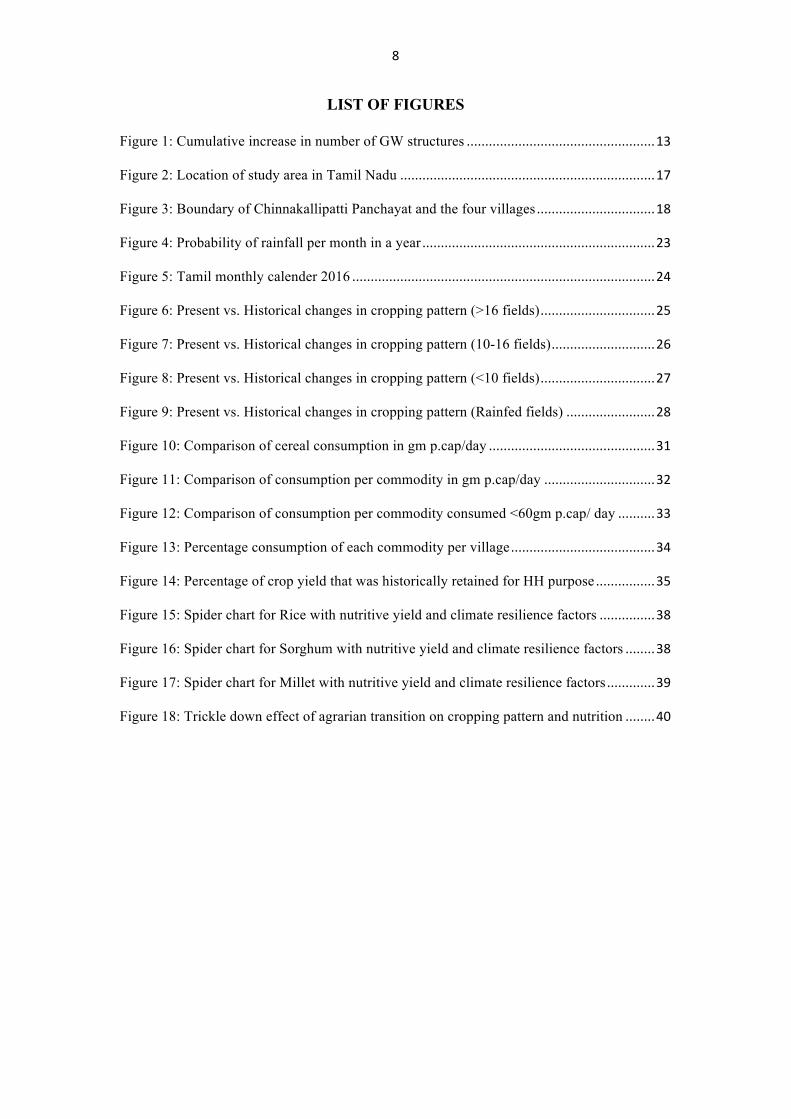
LIST OF FIGURES Figure 1: Cumulative increase in number of GW structures...................................................13
Figure 2: Location of study area in Tamil Nadu.....................................................................17
Figure 3: Boundary of Chinnakallipatti Panchayat and the four villages................................18
Figure 4: Probability of rainfall per month in a year...............................................................23
Figure 5: Tamil monthly calender 2016..................................................................................24
Figure 6: Present vs. Historical changes in cropping pattern (>16 fields)...............................25
Figure 7: Present vs. Historical changes in cropping pattern (10-16 fields)............................26
Figure 8: Present vs. Historical changes in cropping pattern (<10 fields)...............................27
Figure 9: Present vs. Historical changes in cropping pattern (Rainfed fields)........................28
Figure 10: Comparison of cereal consumption in gm p.cap/day.............................................31
Figure 11: Comparison of consumption per commodity in gm p.cap/day..............................32
Figure 12: Comparison of consumption per commodity consumed <60gm p.cap/ day..........33
Figure 13: Percentage consumption of each commodity per village.......................................34
Figure 14: Percentage of crop yield that was historically retained for HH purpose................35
Figure 15: Spider chart for Rice with nutritive yield and climate resilience factors...............38
Figure 16: Spider chart for Sorghum with nutritive yield and climate resilience factors........38
Figure 17: Spider chart for Millet with nutritive yield and climate resilience factors.............39
Figure 18: Trickle down effect of agrarian transition on cropping pattern and nutrition........40

9
LIST OF TABLES Table 1: Demographics of the villages....................................................................................18
Table 2: Farmer classification in Shanmugapuram village.....................................................21
Table 3: Farmer classification for Rangampalayam village....................................................21
Table 4: Farmer classification for Chinnakallipatti village.....................................................22
Table 5: Farmer classification for Pallarpalayam village........................................................22
Table 6: Nutritional content of cereals per 100g of dry weight...............................................37

10
1. ABSTRACT
Agriculture plays a pivotal role in Tamil Nadu. More than 40% of the population of
Tamil Nadu is dependent on agriculture for their livelihood. Although the state
reports one of the highest agricultural productivity rates, this performance is not
consistent, fluctuating growth rate has been characteristic to Tamil Nadu, as the
frequency of droughts have increased over the years. Two consecutive years, 2014-15
and 2015-16 have seen rainfall deficit, which enhanced the drought conditions.
Agriculture in the state is dependent on groundwater or rain and increasing drought
conditions make farmer livelihood a challenge.
Lower Bhavani has had a 60% deficit in rainfall l in the previous year. My study
focuses on the drivers of this shifting systems and the implications on rural HH
nutrition. My study focuses on Chinnakallipatti Panchayat in Coimbatore District,
which cultivates Tobacco, Banana, Groundnut and Marigold, which is a recent trend.
This change has been driven by multiple endogenous and exogenous factors. Dietary
patterns in this region have shifted due to various developmental policies such as
White Revolution and Targeted Public Distribution System. Using qualitative and
quantitative methods including HH surveys I explore the linkages between these
changing cropping pattern and nutrition.
My study indicates that there has been a significant change in dietary composition;
primary cereals have shifted from millets to rice and dairy products have been
included in the diet. Cropping pattern has a weighted influence on HH nutritional
status. Farmers have shifted from subsistence farming to high value commercial
farming in the hope for a ‘bumper crop’, which is a solution to all their problems.
Given India’s focus on nutrition security it has become imperative to understand the
impacts of the agricultural transition on HH diets. My study provides empirical
evidence to suggest nutrition is being compromised as a result of commercial
farming.
Key words: Cropping pattern, Nutrition, Agrarian transition, Food security,
Livelihood
11
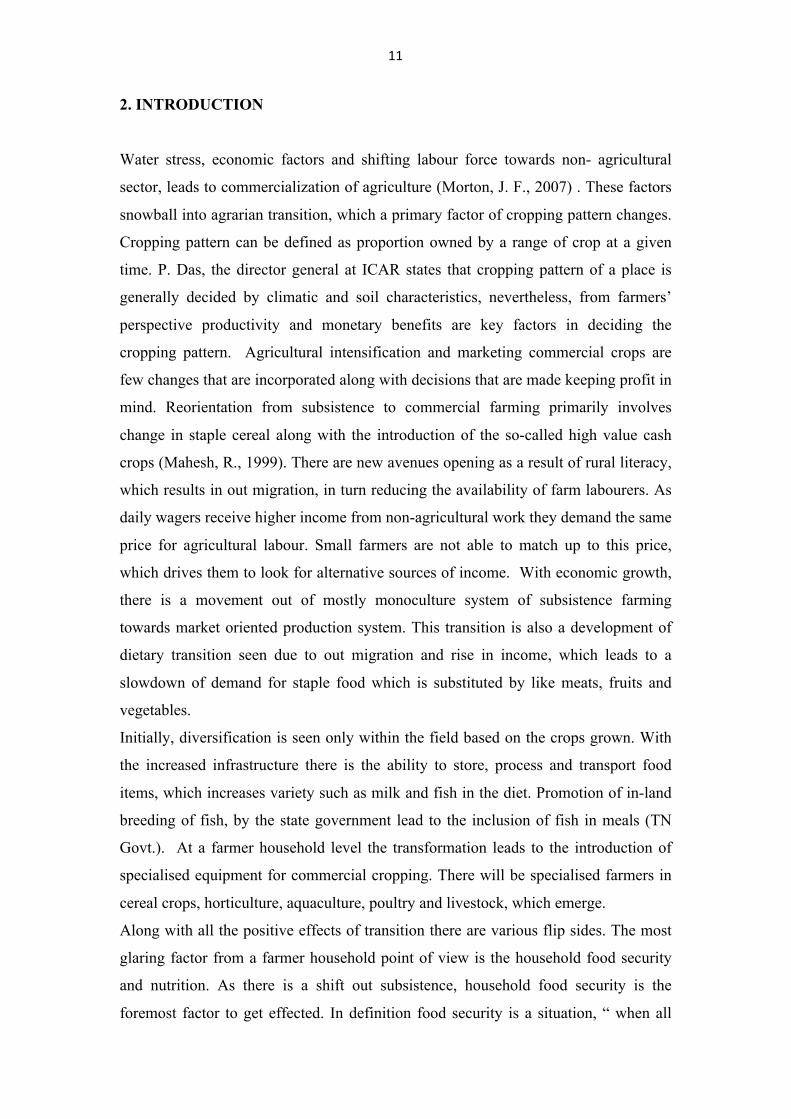
2. INTRODUCTION
Water stress, economic factors and shifting labour force towards non- agricultural
sector, leads to commercialization of agriculture (Morton, J. F., 2007) . These factors
snowball into agrarian transition, which a primary factor of cropping pattern changes.
Cropping pattern can be defined as proportion owned by a range of crop at a given
time. P. Das, the director general at ICAR states that cropping pattern of a place is
generally decided by climatic and soil characteristics, nevertheless, from farmers’
perspective productivity and monetary benefits are key factors in deciding the
cropping pattern. Agricultural intensification and marketing commercial crops are
few changes that are incorporated along with decisions that are made keeping profit in
mind. Reorientation from subsistence to commercial farming primarily involves
change in staple cereal along with the introduction of the so-called high value cash
crops (Mahesh, R., 1999). There are new avenues opening as a result of rural literacy,
which results in out migration, in turn reducing the availability of farm labourers. As
daily wagers receive higher income from non-agricultural work they demand the same
price for agricultural labour. Small farmers are not able to match up to this price,
which drives them to look for alternative sources of income. With economic growth,
there is a movement out of mostly monoculture system of subsistence farming
towards market oriented production system. This transition is also a development of
dietary transition seen due to out migration and rise in income, which leads to a
slowdown of demand for staple food which is substituted by like meats, fruits and
vegetables.
Initially, diversification is seen only within the field based on the crops grown. With
the increased infrastructure there is the ability to store, process and transport food
items, which increases variety such as milk and fish in the diet. Promotion of in-land
breeding of fish, by the state government lead to the inclusion of fish in meals (TN
Govt.). At a farmer household level the transformation leads to the introduction of
specialised equipment for commercial cropping. There will be specialised farmers in
cereal crops, horticulture, aquaculture, poultry and livestock, which emerge.
Along with all the positive effects of transition there are various flip sides. The most
glaring factor from a farmer household point of view is the household food security
and nutrition. As there is a shift out subsistence, household food security is the
foremost factor to get effected. In definition food security is a situation, “ when all

12
people at all times have physical and economic access to sufficient, safe and nutrition
food that’s meets their dietary needs and food preferences for an active and healthy
life”. This concept is based on the cycle of availability, access, use of food and
stability. This cycle is mostly relevant to non-farmer households. When looked at
from a farmer household point of view it is seen that this cycle is no longer valid as it
collapses due to lack of availability of primary cereal. The farmer no longer grows
staple cereals or vegetables, instead grows commercial crops. These crops are sold
and the funds received from it are used to buy food commodities. If there is a crop
failure this source of funding collapses and they resort to loans. This type of
dependency on profit made from farming to buy food grains can result in poverty
nutrition trap. Studies show that this is a serious issue, which steals the farmer of his
livelihood, which results in a negative spiraling effect, which may be one of the
reasons of farmer suicide.
This study strives to understand the variables that have contributed to the shift in crop
production in the Lower Bhavani Region. What these shifts were? What is the
temporal scale of this shift? And, lastly how factors such as environmental, socio-
economic, institutional and behavioral has led to cropping pattern changes. The study
also aims to understand the interrelation between cropping pattern and household food
security. It tries to investigate if the change seen in the dietary pattern of a farmer
household is related to the crops grown on the field. Has the shift from subsistence
agriculture, unintentionally altered the nutrition of a household, is a question this
study aims to answer.

13
3. BACKGROUND
The eastern tract of the Western Ghats is known for its semi-arid climate. As it lies in
the rain shadow region it receives minimal rainfall (IMD). The natural vegetation in
this region has also adapted to the unreliable rainfall patterns and shows
characteristics of semi-deciduous forests. The major sources of water in this region
are the rain-fed rivers. This region of the eastern tract of Western Ghats comprise of
Karnataka, western Tamil Nadu and Andhra Pradesh, and central Maharashtra. In this
study we will be focusing on the Lower Bhavani basin of Tamil Nadu.
Moyar and Bhavani are two rivers, which are major sources of surface water. The
minor irrigation report data tells us that the groundwater is the major contributor of
water. Ground water is sourced through various structures such as dugwells, shallow
tubewell and deep tubewell. The Figure 1 represents the cumulative increase in
number of groundwater structures since 1982 up till 2006.
Figure 1: Cumulative increase in number of GW structures
0
5000
10000
15000
20000
25000
30000
35000
40000
45000
Num
berofstructures
Years
Dugwell
DeepTubewell
ShallowTubewell
1982198619901994199820022006
14
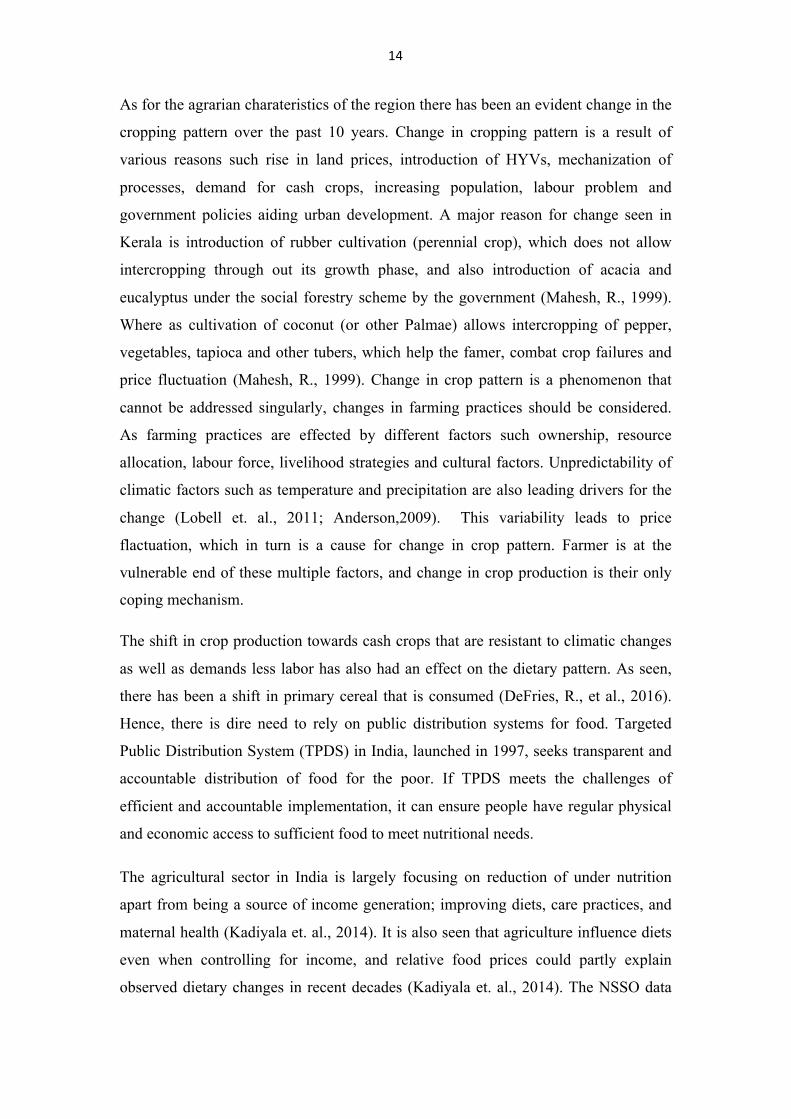
As for the agrarian charateristics of the region there has been an evident change in the
cropping pattern over the past 10 years. Change in cropping pattern is a result of
various reasons such rise in land prices, introduction of HYVs, mechanization of
processes, demand for cash crops, increasing population, labour problem and
government policies aiding urban development. A major reason for change seen in
Kerala is introduction of rubber cultivation (perennial crop), which does not allow
intercropping through out its growth phase, and also introduction of acacia and
eucalyptus under the social forestry scheme by the government (Mahesh, R., 1999).
Where as cultivation of coconut (or other Palmae) allows intercropping of pepper,
vegetables, tapioca and other tubers, which help the famer, combat crop failures and
price fluctuation (Mahesh, R., 1999). Change in crop pattern is a phenomenon that
cannot be addressed singularly, changes in farming practices should be considered.
As farming practices are effected by different factors such ownership, resource
allocation, labour force, livelihood strategies and cultural factors. Unpredictability of
climatic factors such as temperature and precipitation are also leading drivers for the
change (Lobell et. al., 2011; Anderson,2009). This variability leads to price
flactuation, which in turn is a cause for change in crop pattern. Farmer is at the
vulnerable end of these multiple factors, and change in crop production is their only
coping mechanism.
The shift in crop production towards cash crops that are resistant to climatic changes
as well as demands less labor has also had an effect on the dietary pattern. As seen,
there has been a shift in primary cereal that is consumed (DeFries, R., et al., 2016).
Hence, there is dire need to rely on public distribution systems for food. Targeted
Public Distribution System (TPDS) in India, launched in 1997, seeks transparent and
accountable distribution of food for the poor. If TPDS meets the challenges of
efficient and accountable implementation, it can ensure people have regular physical
and economic access to sufficient food to meet nutritional needs.
The agricultural sector in India is largely focusing on reduction of under nutrition
apart from being a source of income generation; improving diets, care practices, and
maternal health (Kadiyala et. al., 2014). It is also seen that agriculture influence diets
even when controlling for income, and relative food prices could partly explain
observed dietary changes in recent decades (Kadiyala et. al., 2014). The NSSO data
15
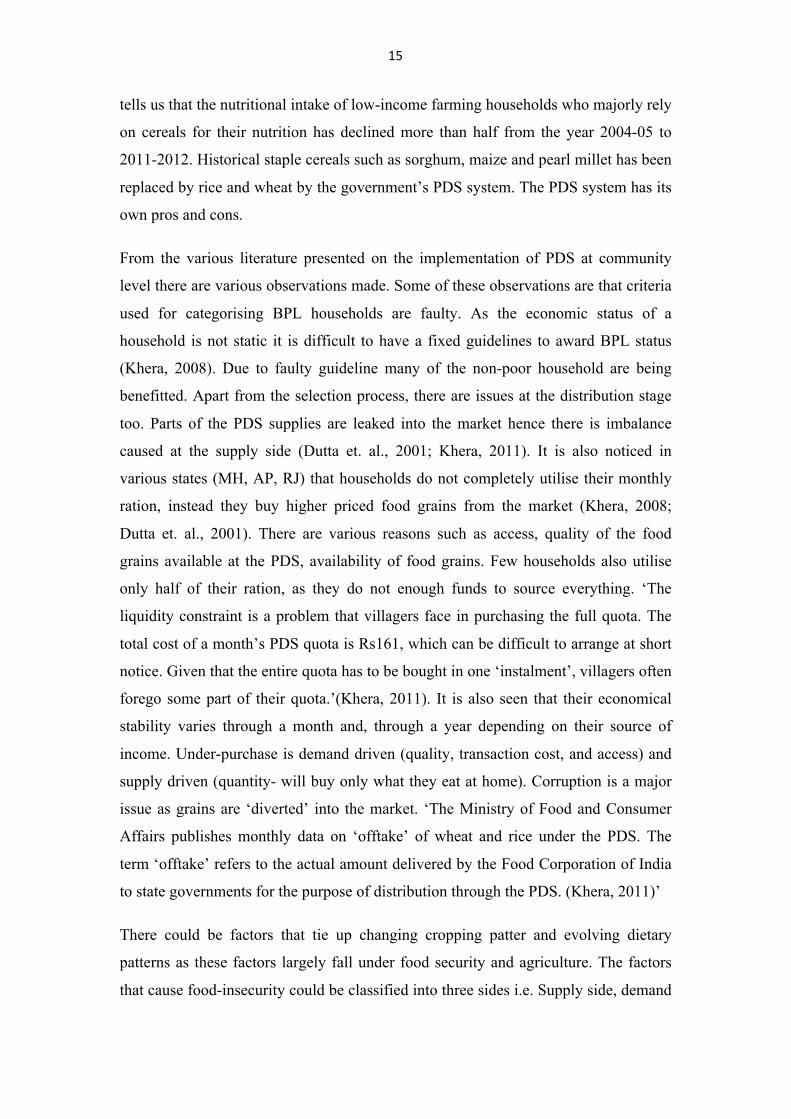
tells us that the nutritional intake of low-income farming households who majorly rely
on cereals for their nutrition has declined more than half from the year 2004-05 to
2011-2012. Historical staple cereals such as sorghum, maize and pearl millet has been
replaced by rice and wheat by the government’s PDS system. The PDS system has its
own pros and cons.
From the various literature presented on the implementation of PDS at community
level there are various observations made. Some of these observations are that criteria
used for categorising BPL households are faulty. As the economic status of a
household is not static it is difficult to have a fixed guidelines to award BPL status
(Khera, 2008). Due to faulty guideline many of the non-poor household are being
benefitted. Apart from the selection process, there are issues at the distribution stage
too. Parts of the PDS supplies are leaked into the market hence there is imbalance
caused at the supply side (Dutta et. al., 2001; Khera, 2011). It is also noticed in
various states (MH, AP, RJ) that households do not completely utilise their monthly
ration, instead they buy higher priced food grains from the market (Khera, 2008;
Dutta et. al., 2001). There are various reasons such as access, quality of the food
grains available at the PDS, availability of food grains. Few households also utilise
only half of their ration, as they do not enough funds to source everything. ‘The
liquidity constraint is a problem that villagers face in purchasing the full quota. The
total cost of a month’s PDS quota is Rs161, which can be difficult to arrange at short
notice. Given that the entire quota has to be bought in one ‘instalment’, villagers often
forego some part of their quota.’(Khera, 2011). It is also seen that their economical
stability varies through a month and, through a year depending on their source of
income. Under-purchase is demand driven (quality, transaction cost, and access) and
supply driven (quantity- will buy only what they eat at home). Corruption is a major
issue as grains are ‘diverted’ into the market. ‘The Ministry of Food and Consumer
Affairs publishes monthly data on ‘offtake’ of wheat and rice under the PDS. The
term ‘offtake’ refers to the actual amount delivered by the Food Corporation of India
to state governments for the purpose of distribution through the PDS. (Khera, 2011)’
There could be factors that tie up changing cropping patter and evolving dietary
patterns as these factors largely fall under food security and agriculture. The factors
that cause food-insecurity could be classified into three sides i.e. Supply side, demand
16
side and market side as Grote et.al. put it. Under each of these categories there are
various causes leading to food insecurity such a shortage of land and water, poor
technologies and low productivity, poor workforce (education, health), climate
change, natural disasters, degradation of fish resources, loss of biodiversity. As for the
demand side the causality could be population growth and urbanization, changing
diets and food quality, bioenergy. Lastly, the market side factors could be lack of
secure property rights, inefficient food marketing system, food wastage and losses,
volatile food prices. (Grote, 2014)
17
4. MATERIAL AND METHODS
AIM
To understand the effect of cropping pattern changes on farmer household food
security and nutrition.
OBJECTIVE
1. To understand the variables that have contributed to the shift in crop
production in the Lower Bhavani Region.
2. To understand household food security and nutritional changes over two
decades.
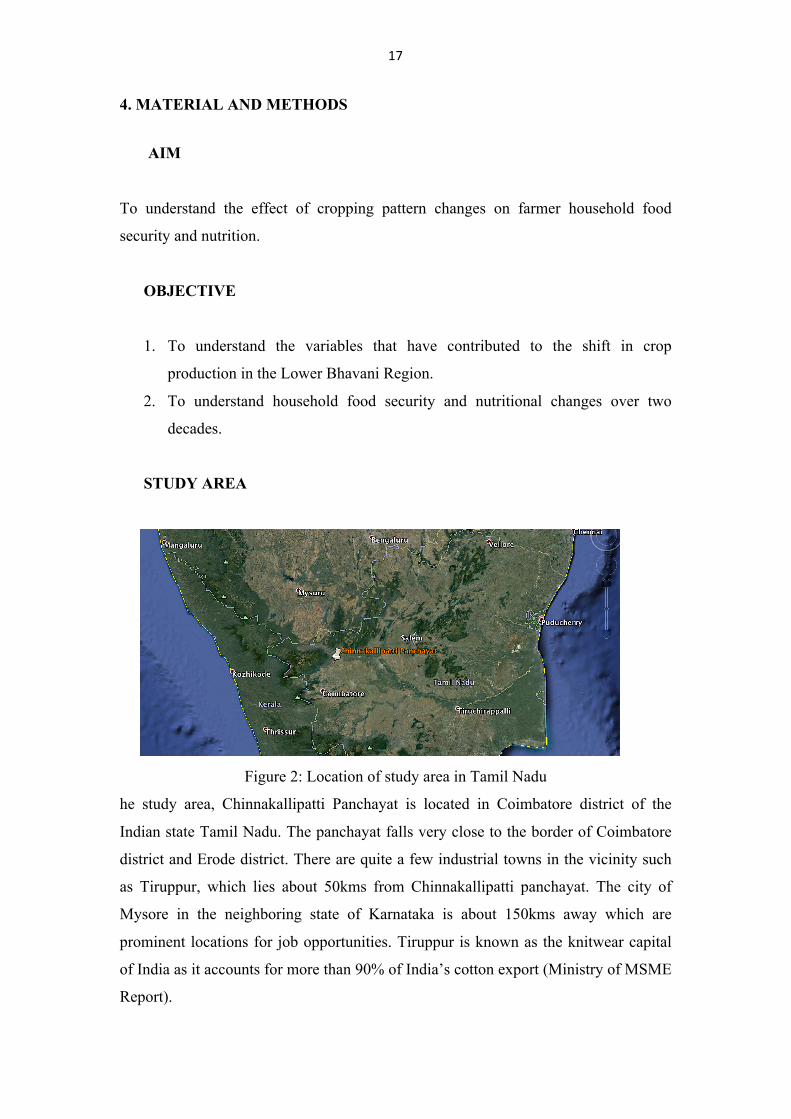
STUDY AREA
Figure 2: Location of study area in Tamil Nadu
he study area, Chinnakallipatti Panchayat is located in Coimbatore district of the
Indian state Tamil Nadu. The panchayat falls very close to the border of Coimbatore
district and Erode district. There are quite a few industrial towns in the vicinity such
as Tiruppur, which lies about 50kms from Chinnakallipatti panchayat. The city of
Mysore in the neighboring state of Karnataka is about 150kms away which are
prominent locations for job opportunities. Tiruppur is known as the knitwear capital
of India as it accounts for more than 90% of India’s cotton export (Ministry of MSME
Report).
18
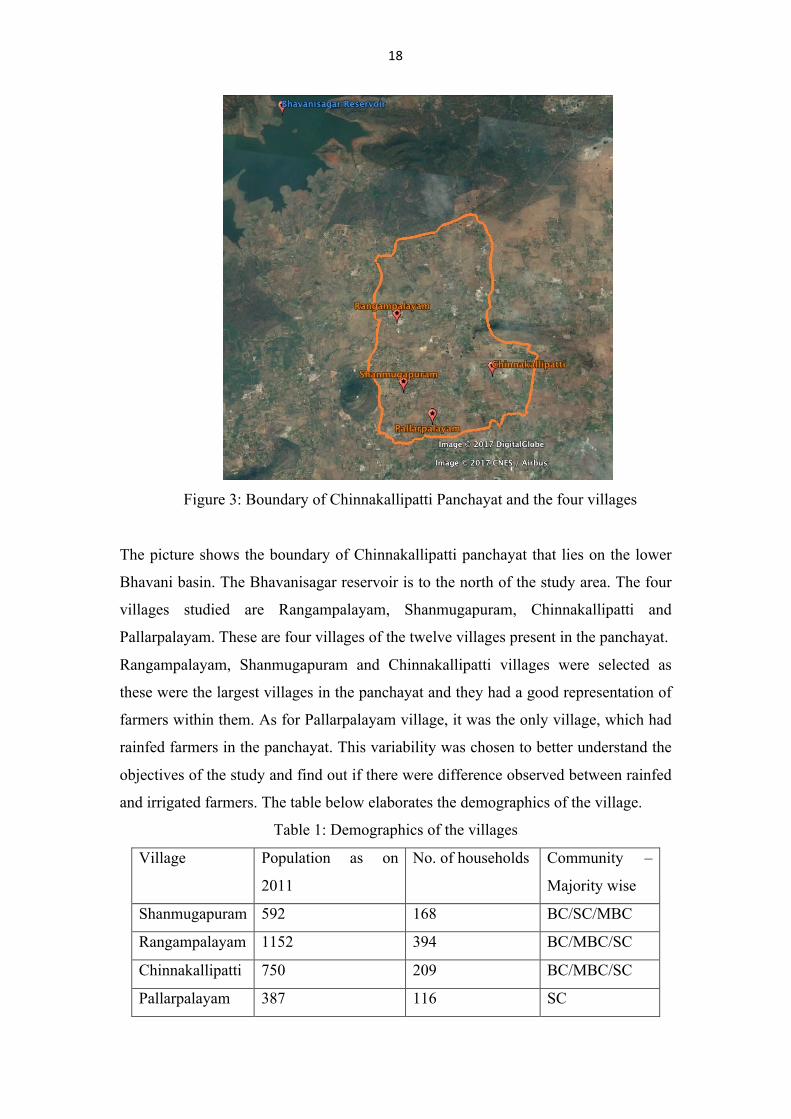
Figure 3: Boundary of Chinnakallipatti Panchayat and the four villages
The picture shows the boundary of Chinnakallipatti panchayat that lies on the lower
Bhavani basin. The Bhavanisagar reservoir is to the north of the study area. The four
villages studied are Rangampalayam, Shanmugapuram, Chinnakallipatti and
Pallarpalayam. These are four villages of the twelve villages present in the panchayat.
Rangampalayam, Shanmugapuram and Chinnakallipatti villages were selected as
these were the largest villages in the panchayat and they had a good representation of
farmers within them. As for Pallarpalayam village, it was the only village, which had
rainfed farmers in the panchayat. This variability was chosen to better understand the
objectives of the study and find out if there were difference observed between rainfed
and irrigated farmers. The table below elaborates the demographics of the village.
Table 1: Demographics of the villages
Village Population as on
2011
No. of households Community –
Majority wise
Shanmugapuram 592 168 BC/SC/MBC
Rangampalayam 1152 394 BC/MBC/SC
Chinnakallipatti 750 209 BC/MBC/SC
Pallarpalayam 387 116 SC

19
5. MATERIALS AND METHODOLOGY
This is field study based analysis on variables that led to cropping pattern and the
effect of this change on household nutrition and food security of farmers over two
decades.
1. To understand the variables that have contributed to the shift in crop
production in the Lower Bhavani Region.
• Vulnerability of the region was understood from the previous studies
done in the area
• Similar studies in croppin pattern, agriculture and crop production in
semi-arid regions were studied to build a background.
• Developmental policies and state governance and their respective
effects on agriculture was also studied
• A concept note was summerised for the study from a mind map of all
the literature
• A semi-structured questionnaire was developed from the concept note
• A field recci of three days was conducted and the questionnairs were
tested on farmers houshold and on key-informants.
• Changes were made to the questionnaire to better suit the study area
• Two sets of questionnairs were formulated, one for farmer housholds
and anther for key-informants such as PDS in-charges, Government
primary health center, Balwadi and Government primary school.
• Over a period of one month 50HH interviews and 5 key informant
interviews were conducted
• For analysis all the interviews were transalted from Tamil to English
and transcribed
• An excel sheet was created to analyse HH details and nutritional intake
• Case-study based analysis is chosen as this helps us understand the
minute reasons behind a change given the socio-economic difference
within the population of the panchayat
20
2. To understand household food security and nutritional changes over two
decades.
• Food security, dietary patterns and nutrition based studies in India or in
south-east Asia were studied
• TPDS and mid day meal scheme in Tamil Nadu and various other
states in India were understood in great detail
• Based on the literature and the three day field recci a detailed
questionnaire was formulated to understand the present dietary intake
of a family in a month, their average expenditure on food and their
historical diet.
• Historical details were collected based on recollection method which is
one of the short commings of the study
• An excel sheet was created to analyse the data and calculate the
calorific value every commodity consumed to reach the average
calorific intake per capita
• Calorific intake of every village is compared to the national average
reported by the Center for Policy Studies.
• A comparitive analysis of primary cereals is done to understand which
cereal is best for conssumption in the study region.
A total of 50 HH were sampled and 5 key informant interviews were conducted. The
four villages Rangampalayam, Shanmugapuram, Chinnakallipatti and Pallarpalayam
were selected by purposive sampling based on previous study conducted in the region.
In each of the villages snowball sampling was conducted to gather baseline data. An
average of eight to fifteen villages were sampled in each of the villages until a
saturation of information was achieved. For the analysis of the data case-study based
analysis is chosen as this helps bring out the minor details of socio-economic
differentiation of the population and their stories on cropping pattern and food
security.

21
6. RESULTS
1. To understand the variables that have contributed to the shift in crop
production in the Lower Bhavani Region.
SOCIO – ECONOMIC CHARACTERISTICS
Out of the 15 HHs interviewed in Shanmugapuram village, eight households belonged
to the Vettur Gounder caste, which belongs to the sub-category of MBC. The rest
seven HHs belonged to Gounder caste, which lie in BC category. If the farmer HHs
were to be categorized based on their land holding size, it would be seen as shown in
the table below.
Table 2: Farmer classification in Shanmugapuram village
Small Farmers (0-2 acres) 4 HHs
Medium Farmers (3-6 acres) 9 HHs
Large Farmers (>7 acres) 2 HHs
As seen, the above data is a representation of the village and from this we can derive
that 60% of the population are farmer households. Few of them are small farmers; in
such cases they were medium farmers who sold their land, as they could not continue
farming due to the losses incurred from crop failure or in some cases the future
generation choses to out-migrate in search of alternative livelihood. There were two
households, which were larger farmers. One of them was HH of political influence
and the other farmer had 7acres of rainfed land, which meant it was juxtaposition land
(govt. lands given to the farmers) and only 1acre was irrigated farmland. This is the
case in most of the other villages as well.
From the interviews conducted in Rangampalayam village we see that eight
households belonged to MBC category and their caste were Kurmba. The remaining
seven households were BC who belonged to Chettiyar, Kurmba Gounder or
Vokkaliga Gounder caste. As for the farmer categories they resembled
Shunmugapuram village.
Table 3: Farmer classification for Rangampalayam village
Small Farmers (0-2 acres) 4 HH
Medium Farmers (3-6 acres) 10 HH
Large Farmers (>7 acres) 1 HH
22
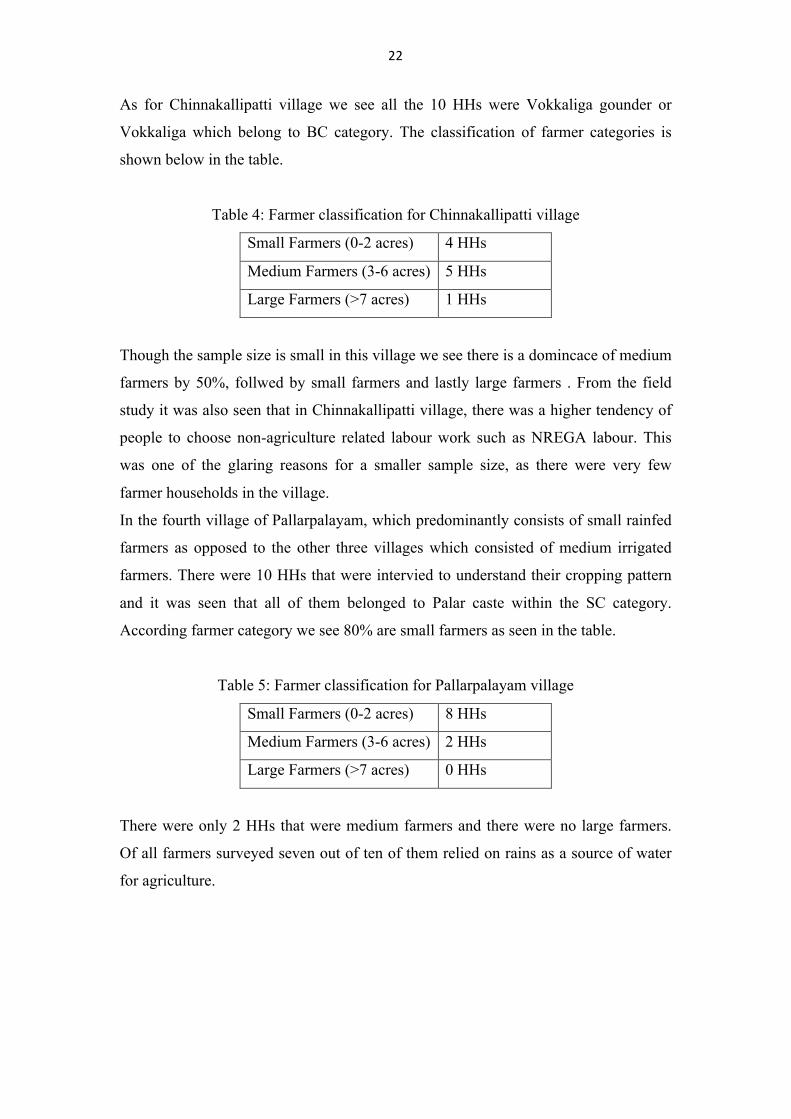
As for Chinnakallipatti village we see all the 10 HHs were Vokkaliga gounder or
Vokkaliga which belong to BC category. The classification of farmer categories is
shown below in the table.
Table 4: Farmer classification for Chinnakallipatti village
Small Farmers (0-2 acres) 4 HHs
Medium Farmers (3-6 acres) 5 HHs
Large Farmers (>7 acres) 1 HHs
Though the sample size is small in this village we see there is a domincace of medium
farmers by 50%, follwed by small farmers and lastly large farmers . From the field
study it was also seen that in Chinnakallipatti village, there was a higher tendency of
people to choose non-agriculture related labour work such as NREGA labour. This
was one of the glaring reasons for a smaller sample size, as there were very few
farmer households in the village.
In the fourth village of Pallarpalayam, which predominantly consists of small rainfed
farmers as opposed to the other three villages which consisted of medium irrigated
farmers. There were 10 HHs that were intervied to understand their cropping pattern
and it was seen that all of them belonged to Palar caste within the SC category.
According farmer category we see 80% are small farmers as seen in the table.
Table 5: Farmer classification for Pallarpalayam village
Small Farmers (0-2 acres) 8 HHs
Medium Farmers (3-6 acres) 2 HHs
Large Farmers (>7 acres) 0 HHs
There were only 2 HHs that were medium farmers and there were no large farmers.
Of all farmers surveyed seven out of ten of them relied on rains as a source of water
for agriculture.

23
RAINFALL
The rainfall distribution in a year estimated from the interviews is illustrated below.
Figure 4: Probability of rainfall per month in a year
The graph tells us which are the driest months and which are the wettest months as
these are the months which receive no rainfall and the months which receive rainfall
respectively. The green bar represents the dry months. The driest period is from 16th
April to 15th May, which has a probability of 80%. The blue line represents the wet
period, which can also be described as the months during which the probability of
rainfall is the highest. The months, which are most likely to receive rainfall are 16th
October to 31st October have 100% probability, while 1st Nov to 15th Nov has 90%
probability. The graph also tells us that the study area receives return monsoons also
know as north-east monsoons which are from October to December according to
IMD.

24
There are 24 points on the graph as opposed to 12 because every month is divided
into two equal halves, as the respondents knew rainfall pattern according to the Tamil
calendar. When the Tamil calendar was converted to the English calendar it looked
like the picture given below.
Figure 5: Tamil monthly calendar 2016
25
AGRICULTURE: PRESENT VS HISTORICAL
IRRIGATED FARMS
The medium-scale, irrigated-farm villages namely, Shanmugapuram, Rangampalayam
and Chinnakallipatti are combined to study the evolution in cropping pattern. There
are more than 20 different crops that were grown in these villages over a period of
time. Due to various reasons there has been a rise in cultivation of certain crops while
the rest didn’t stand the test of time.
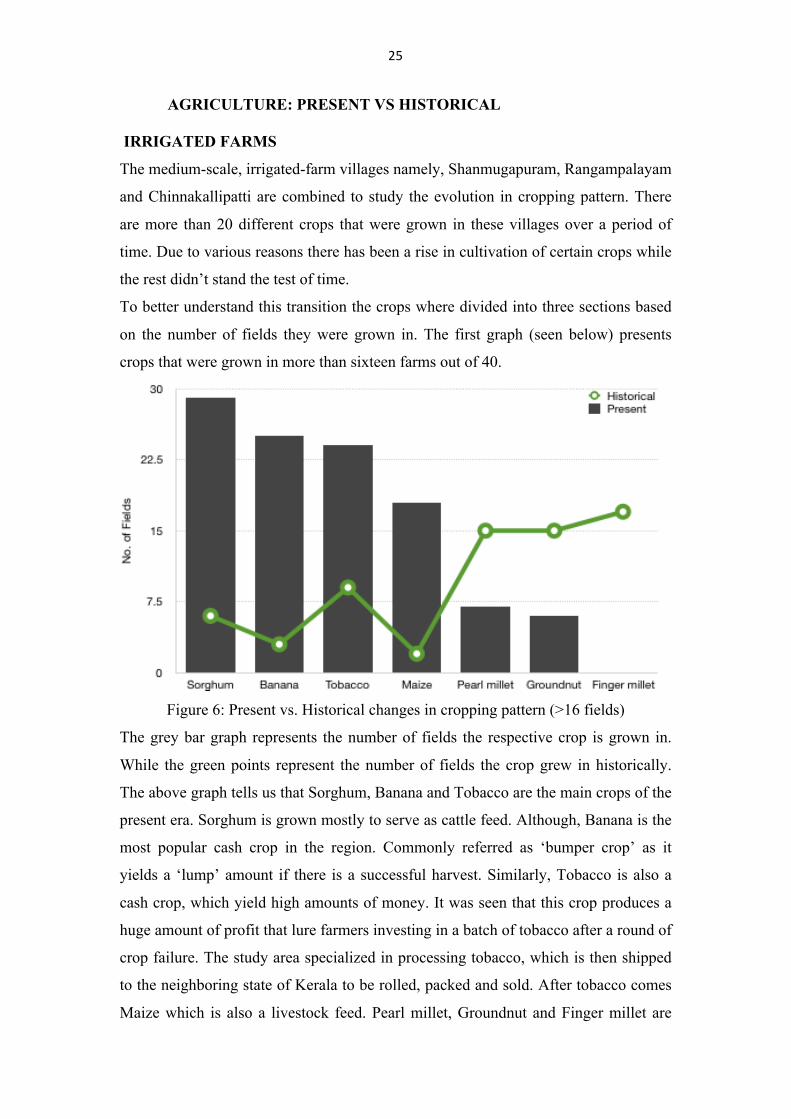
To better understand this transition the crops where divided into three sections based
on the number of fields they were grown in. The first graph (seen below) presents
crops that were grown in more than sixteen farms out of 40.
Figure 6: Present vs. Historical changes in cropping pattern (>16 fields)
The grey bar graph represents the number of fields the respective crop is grown in.
While the green points represent the number of fields the crop grew in historically.
The above graph tells us that Sorghum, Banana and Tobacco are the main crops of the
present era. Sorghum is grown mostly to serve as cattle feed. Although, Banana is the
most popular cash crop in the region. Commonly referred as ‘bumper crop’ as it
yields a ‘lump’ amount if there is a successful harvest. Similarly, Tobacco is also a
cash crop, which yield high amounts of money. It was seen that this crop produces a
huge amount of profit that lure farmers investing in a batch of tobacco after a round of
crop failure. The study area specialized in processing tobacco, which is then shipped
to the neighboring state of Kerala to be rolled, packed and sold. After tobacco comes
Maize which is also a livestock feed. Pearl millet, Groundnut and Finger millet are
26
majorly historical crops. From this trend it’s clearly understood that historical trends
showed subsistence farming. Though millets are supposed to be the best crops to in
semi-arid conditions farmers in Chinnakallipatti panchayat prefer to invest in Banana
for its economical value. Farmer’s retained more than half their produce if they had a
very large case. Most of them only sold when there was excess, which means that
they mostly grew crops for personal consumption not at commercial scale.
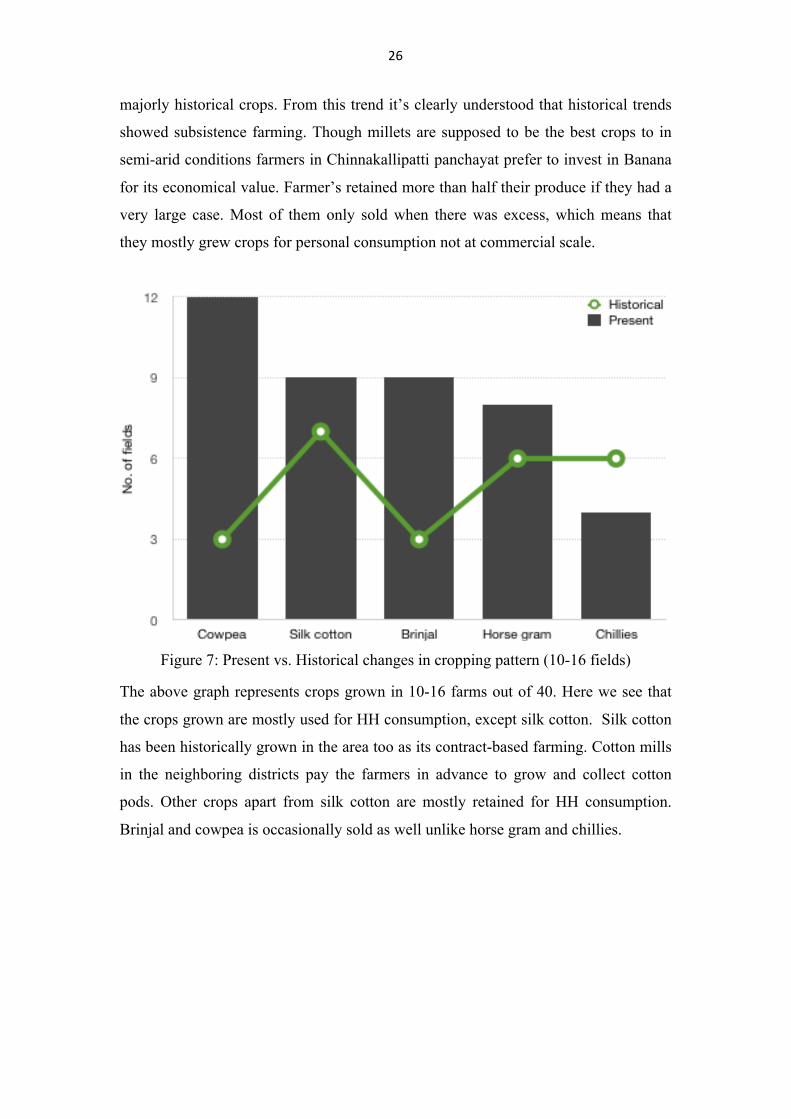
Figure 7: Present vs. Historical changes in cropping pattern (10-16 fields)
The above graph represents crops grown in 10-16 farms out of 40. Here we see that
the crops grown are mostly used for HH consumption, except silk cotton. Silk cotton
has been historically grown in the area too as its contract-based farming. Cotton mills
in the neighboring districts pay the farmers in advance to grow and collect cotton
pods. Other crops apart from silk cotton are mostly retained for HH consumption.
Brinjal and cowpea is occasionally sold as well unlike horse gram and chillies.

27
The graph below represents crops that were grown in less than 10farms out of 40.
Here green gram and jasmine is the highest grown present crop. Green gram is partly
used for HH needs and the excess is sold while there was a boom in jasmine
production in the region as there were fragrance industries that were set up in
neighboring towns which set up a demand. Here we see that majority of the historical
crops are not grown presently. Only the growth of green gram and onion has
increased over time. It is surprising to see that 4 out of 10 farms grew paddy
historically in such a semi-arid region. Sesame and sunflower was also grown
historically to extract oil. It is no longer grown, as the process is labour intensive.
Figure 8: Present vs. Historical changes in cropping pattern (<10 fields)
28
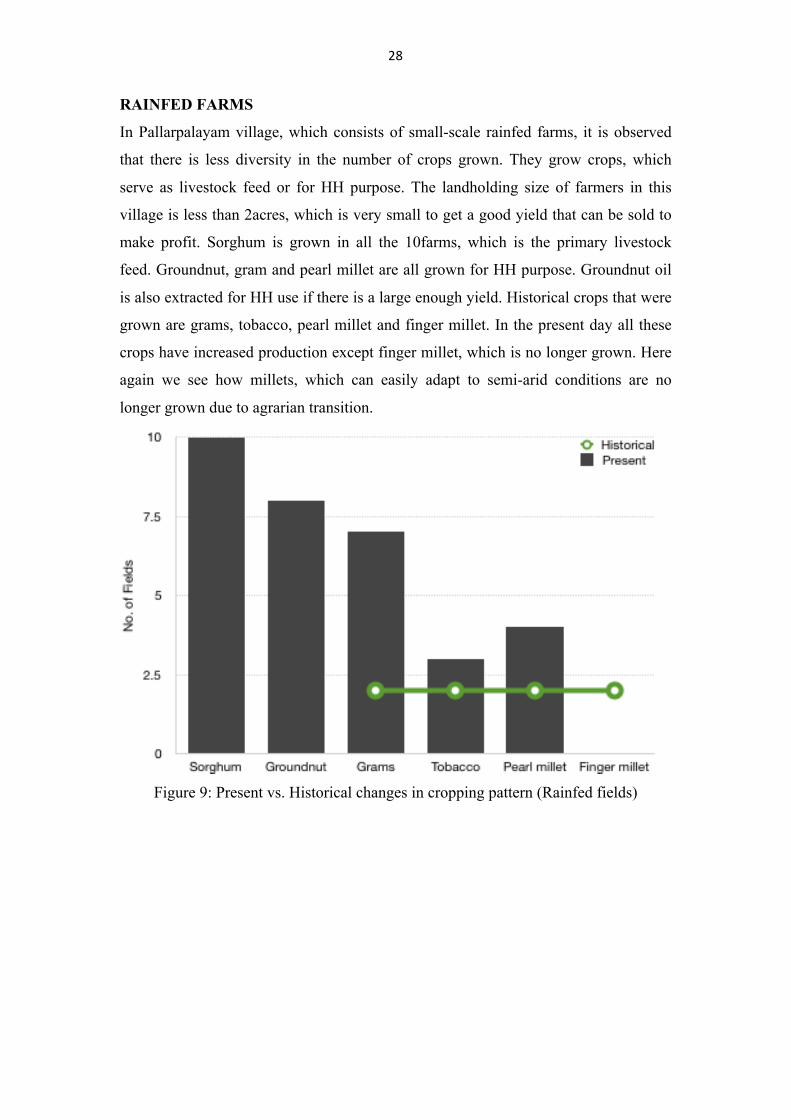
RAINFED FARMS
In Pallarpalayam village, which consists of small-scale rainfed farms, it is observed
that there is less diversity in the number of crops grown. They grow crops, which
serve as livestock feed or for HH purpose. The landholding size of farmers in this
village is less than 2acres, which is very small to get a good yield that can be sold to
make profit. Sorghum is grown in all the 10farms, which is the primary livestock
feed. Groundnut, gram and pearl millet are all grown for HH purpose. Groundnut oil
is also extracted for HH use if there is a large enough yield. Historical crops that were
grown are grams, tobacco, pearl millet and finger millet. In the present day all these
crops have increased production except finger millet, which is no longer grown. Here
again we see how millets, which can easily adapt to semi-arid conditions are no
longer grown due to agrarian transition.
Figure 9: Present vs. Historical changes in cropping pattern (Rainfed fields)

29
FACTORS EFFECTING CROPPING PATTERN CHANGES
From the study conducted we see that there are a few very prominent factors that
effect cropping patterns in the study region. In the all the villages studied the most
prominent factor, which leads to changes in cropping pattern, is water stress with a
weightage of 44% and 50% respectively in irrigated and rainfed fields. Water stress is
a resultant of many factors such as irregular rainfall, recurring drought years, lowered
levels of groundwater due to over extraction or lack of technology in the field of
efficient irrigation techniques. Crop raiding is the next factor that follows with a
weightage of 24% and 21% in irrigated and rainfed fields respectively. The animals
that are involved in crop raiding are wild bore, peacock and elephants in order of their
frequency of occurrence. The fields that lie closer to the forest boundary on the west
are the most threatened, so are the HHs that lie on the periphery areas of a village, as
they are sparsely populated regions. To protect the fields from crop raiding farmers
invest in solar powered fences, bust cracker or flares. They also form 4-5 family
groups and take turns to stay guard through the night. Few of the farmers also
understood that their fields were the only source of food for the animals and they
accepted this interference.
The next key factor is labour related problems. Growing millets and paddy were
labour intensive right from sowing to harvesting right until post harvesting period. A
lot of time and money was invested towards a successful yield, they whole HH would
be dedicated to agriculture. This is not the scenario any more; farmers have to rely on
labour from outside their family as newer generation look for other sources of
livelihood other than agriculture. The factor of rising labour charges as non-
30
agricultural labour work pays more than agricultural labour is another aspect. People
demand equal pay, which cannot be afforded by all farmers. The other factors that
effect cropping patter changes are over-time work and economic factors. Over-time
work would consist of staying up through the night to keep the crops safe from crop
raiding. Also, water was let into the fields from the canal at ungodly hours for which
farmers had to stay awake through the night. If they missed their turn, they would
have to wait for a whole week until they could water the fields. Economic factors
were only seen in irrigated farmer HHs as they were the ones who would invest a lot
more into agriculture. As there was a decrease in demand for millets they had to
switch to cash crops to make the cut.

31
2. To understand household food security and nutritional changes over two
decades.
HOUSEHOLD FOOD SECURITY
PRESENT DAY
Finding a trend in the consumption pattern is not straightforward. With the figures
given below we are trying to do a comparative study between the national average
consumption of various commodities to the per commodity consumption per village.
In this comparative analysis we can understand which commodity is given preference
for specific reasons. There are three figures for comparative analysis as certain
commodities were consumed higher than the rest per person per day.
The first figure is a representation of cereals consumed. We see that more or less all
the villages consume 400 gm p.cap/day while the national average is at 455 gm
p.cap/day. This consumption is completely attributed to the PDS system as 12kgs of
rice is given for free to a person per month. For HH with one adult and a child the
PDS provides 14kgs, for 2 adults it is 16kgs and for 2 adults and on child it is 18kgs.
Anything more than that is provided a standard of 20kgs, which is absolutely free.
Hence, its also see that the largest portion of their calorific intake is from rice.
Figure 10: Comparison of cereal consumption in gm p.cap/day
32
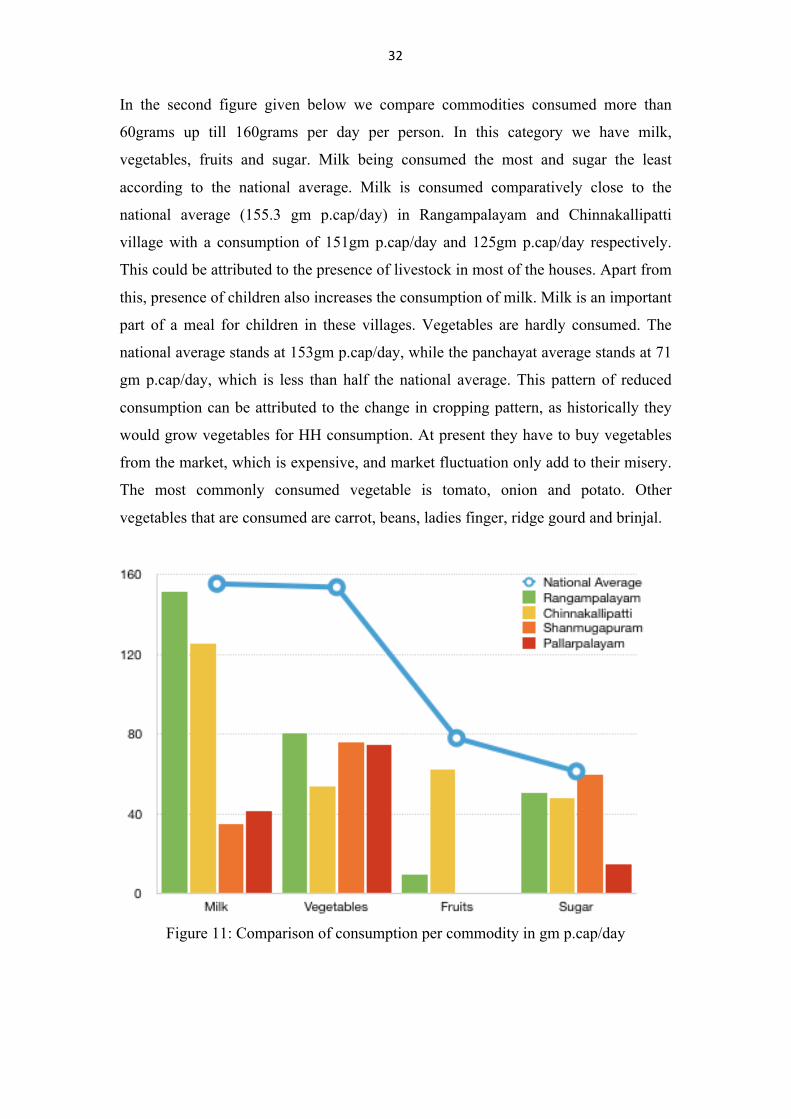
In the second figure given below we compare commodities consumed more than
60grams up till 160grams per day per person. In this category we have milk,
vegetables, fruits and sugar. Milk being consumed the most and sugar the least
according to the national average. Milk is consumed comparatively close to the
national average (155.3 gm p.cap/day) in Rangampalayam and Chinnakallipatti
village with a consumption of 151gm p.cap/day and 125gm p.cap/day respectively.
This could be attributed to the presence of livestock in most of the houses. Apart from
this, presence of children also increases the consumption of milk. Milk is an important
part of a meal for children in these villages. Vegetables are hardly consumed. The
national average stands at 153gm p.cap/day, while the panchayat average stands at 71
gm p.cap/day, which is less than half the national average. This pattern of reduced
consumption can be attributed to the change in cropping pattern, as historically they
would grow vegetables for HH consumption. At present they have to buy vegetables
from the market, which is expensive, and market fluctuation only add to their misery.
The most commonly consumed vegetable is tomato, onion and potato. Other
vegetables that are consumed are carrot, beans, ladies finger, ridge gourd and brinjal.
Figure 11: Comparison of consumption per commodity in gm p.cap/day
33
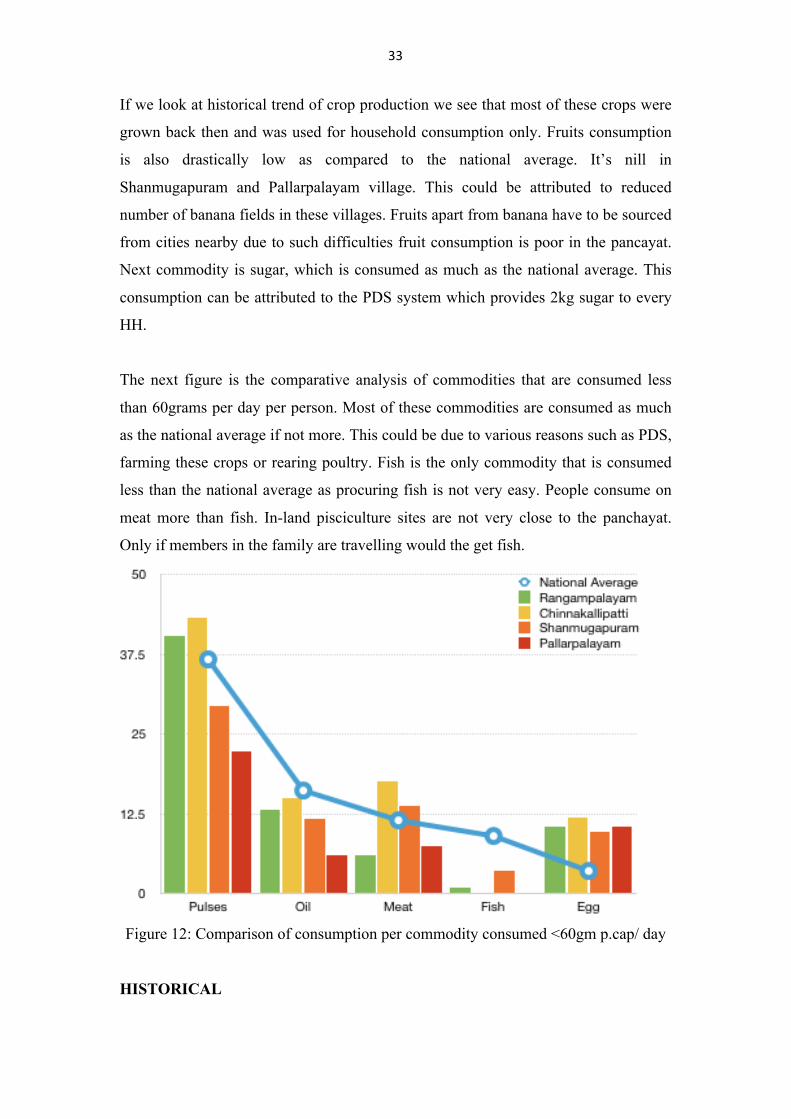
If we look at historical trend of crop production we see that most of these crops were
grown back then and was used for household consumption only. Fruits consumption
is also drastically low as compared to the national average. It’s nill in
Shanmugapuram and Pallarpalayam village. This could be attributed to reduced
number of banana fields in these villages. Fruits apart from banana have to be sourced
from cities nearby due to such difficulties fruit consumption is poor in the pancayat.
Next commodity is sugar, which is consumed as much as the national average. This
consumption can be attributed to the PDS system which provides 2kg sugar to every
HH.
The next figure is the comparative analysis of commodities that are consumed less
than 60grams per day per person. Most of these commodities are consumed as much
as the national average if not more. This could be due to various reasons such as PDS,
farming these crops or rearing poultry. Fish is the only commodity that is consumed
less than the national average as procuring fish is not very easy. People consume on
meat more than fish. In-land pisciculture sites are not very close to the panchayat.
Only if members in the family are travelling would the get fish.
Figure 12: Comparison of consumption per commodity consumed <60gm p.cap/ day
HISTORICAL

34
The figure below is a representation of the percentage consumption of each
commodity per village. Millets in this figure consists of an aggregate of al the four
millets finger millet, pearl millet, little millet and foxtail millet. Grams is an average
of green gram, red gram, horse gram and cowpea, while fruits is a combination of
banana and guava. On an average Rangampalayam village seems to consume all the
commodities the highest, this could be a result of the presence of large farmers in the
region historically. These values are collected by recollection method which is not
very reliable, but gives us a general idea of the changes in primary cereal. It is also
seen that there is fewer variety in the historical diet but it’s mostly dependent on the
crops that are grown by the farmer. Subsistence farming was the only option two
decades ago. It is also seen that there was no dairy products or meat and fish included
in the diet. This figuer of consumption can be triangulated with historical cropping
pattern to varify its authenticity.
Historically livestock was used to aid the farmer on the field to plough and various
other tasks like transportation. Milk from the livestock was not considered. It is only
after green revolution came about did mechanisation of the fields take place. After
this shift the focus on livestock for milk was considered and white revolution aided
the introduction of Jersey cow which yielded higher quantity of milk which could be
retained for HH purpose as well as sold. This is how we also see in the first objective
that farmers have shifted to completely livestock based livelihoods.
Figure 13: Percentage consumption of each commodity per village
35
It should also be noted that since farmes followed subsistence farming their income
was minimal hence they could not source commodities apart from what they grew.
There was PDS system from which they received commodities such as sugar, oil,
kerosene and various other things. Apart from PDS and field grown crops these HH
maintained a kitchen garden or a pacth in the field to grow greens or vegetabels that
are essential for the HH.
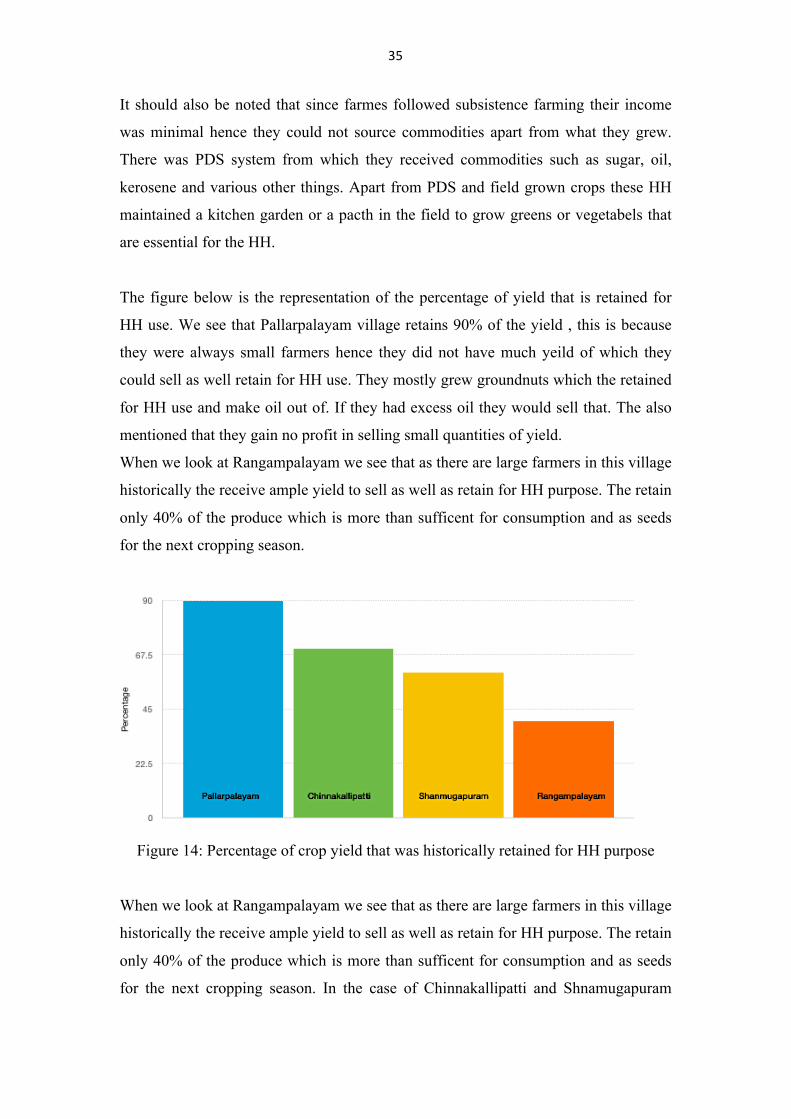
The figure below is the representation of the percentage of yield that is retained for
HH use. We see that Pallarpalayam village retains 90% of the yield , this is because
they were always small farmers hence they did not have much yeild of which they
could sell as well retain for HH use. They mostly grew groundnuts which the retained
for HH use and make oil out of. If they had excess oil they would sell that. The also
mentioned that they gain no profit in selling small quantities of yield.
When we look at Rangampalayam we see that as there are large farmers in this village
historically the receive ample yield to sell as well as retain for HH purpose. The retain
only 40% of the produce which is more than sufficent for consumption and as seeds
for the next cropping season.
Figure 14: Percentage of crop yield that was historically retained for HH purpose
When we look at Rangampalayam we see that as there are large farmers in this village
historically the receive ample yield to sell as well as retain for HH purpose. The retain
only 40% of the produce which is more than sufficent for consumption and as seeds
for the next cropping season. In the case of Chinnakallipatti and Shnamugapuram
36
village they retain 70% and 60% respectively which is a perfect example of a medium
scale farmer which sells and retains almost the same amount of the yield.
PDS AND HOME GROWN COMMODITIES
The Public Distribution System supplies rice (raw and par boiled), sugar, palm oil,
black gram, red gram, tea leaves, wheat and, kerosene only to HH that do not have
gas stoves. There are three PDS shops in the panchayat which are located in
Shanmugapuram, Chinnakallipatti and Rangampalayam village each. The supplies to
a PDS is sourced from the Taluk office which is over-looked by the Taluk supply
officer. The elaborate functioning of the Fair Price Shop (FPS) and the various types
of cards can be better understood from the PDS interview transcript in the annexure.
From the interviews it is also understood that Finger millet was the primary cereal
that was supplied two decades ago. It was later replaced by rice as there was changes
in supply as well as demand. As seen from the first objective there is drop in
cultivation of Finger millet and other millets which was replaced by Banana and
Tobacco.
Now that we have seen what farmers have grown on field and how much the retain
for personal consumption along with commodities that they receive from PDS system,
lets look at home grown crops. Vegetables, greens and certain fruits are plants that are
commonly grown in the kitchen garden or a small plot delineated for such purpose.
These plants are mostly grown during months which receive rains. Most commonly
grown plants are tomato, brinjal, ladies finger, cow pea, green gram, guava, coconut
and various Amaranthus sp. which serve as greens.
37
NUTRITION
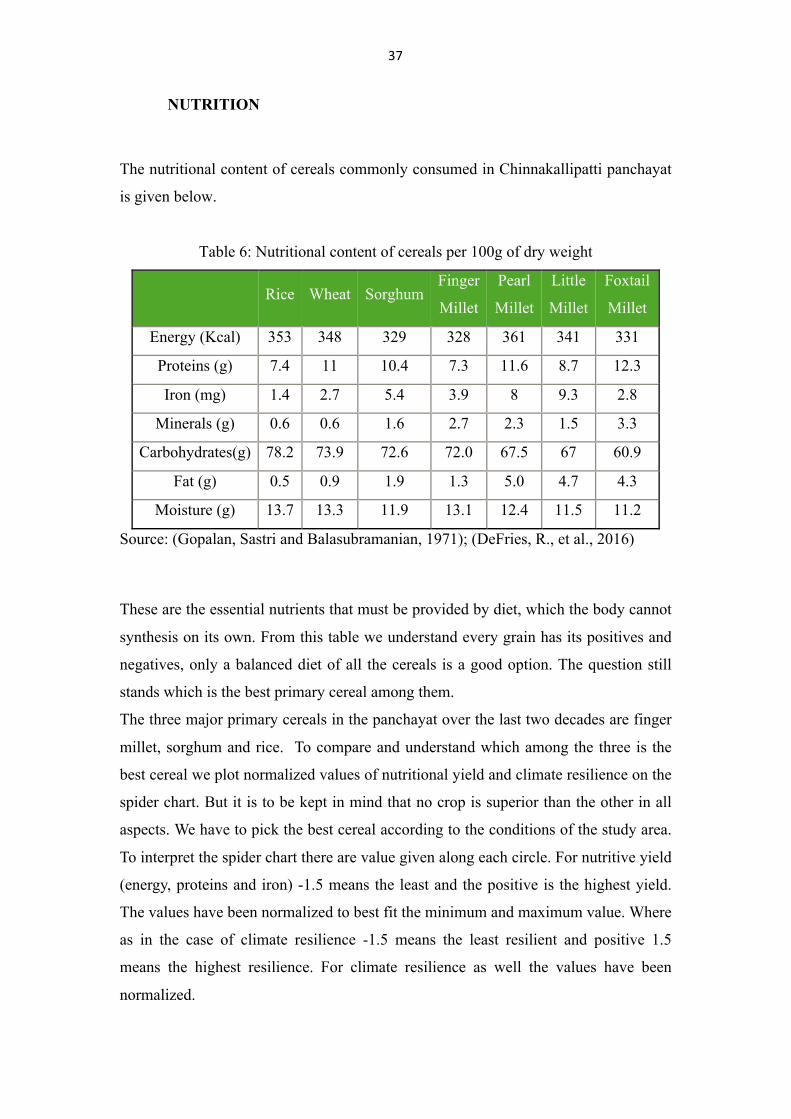
The nutritional content of cereals commonly consumed in Chinnakallipatti panchayat
is given below.
Table 6: Nutritional content of cereals per 100g of dry weight
Rice Wheat Sorghum Finger
Millet
Pearl
Millet
Little
Millet
Foxtail
Millet
Energy (Kcal) 353 348 329 328 361 341 331
Proteins (g) 7.4 11 10.4 7.3 11.6 8.7 12.3
Iron (mg) 1.4 2.7 5.4 3.9 8 9.3 2.8
Minerals (g) 0.6 0.6 1.6 2.7 2.3 1.5 3.3
Carbohydrates(g) 78.2 73.9 72.6 72.0 67.5 67 60.9
Fat (g) 0.5 0.9 1.9 1.3 5.0 4.7 4.3
Moisture (g) 13.7 13.3 11.9 13.1 12.4 11.5 11.2
Source: (Gopalan, Sastri and Balasubramanian, 1971); (DeFries, R., et al., 2016)
These are the essential nutrients that must be provided by diet, which the body cannot
synthesis on its own. From this table we understand every grain has its positives and
negatives, only a balanced diet of all the cereals is a good option. The question still
stands which is the best primary cereal among them.
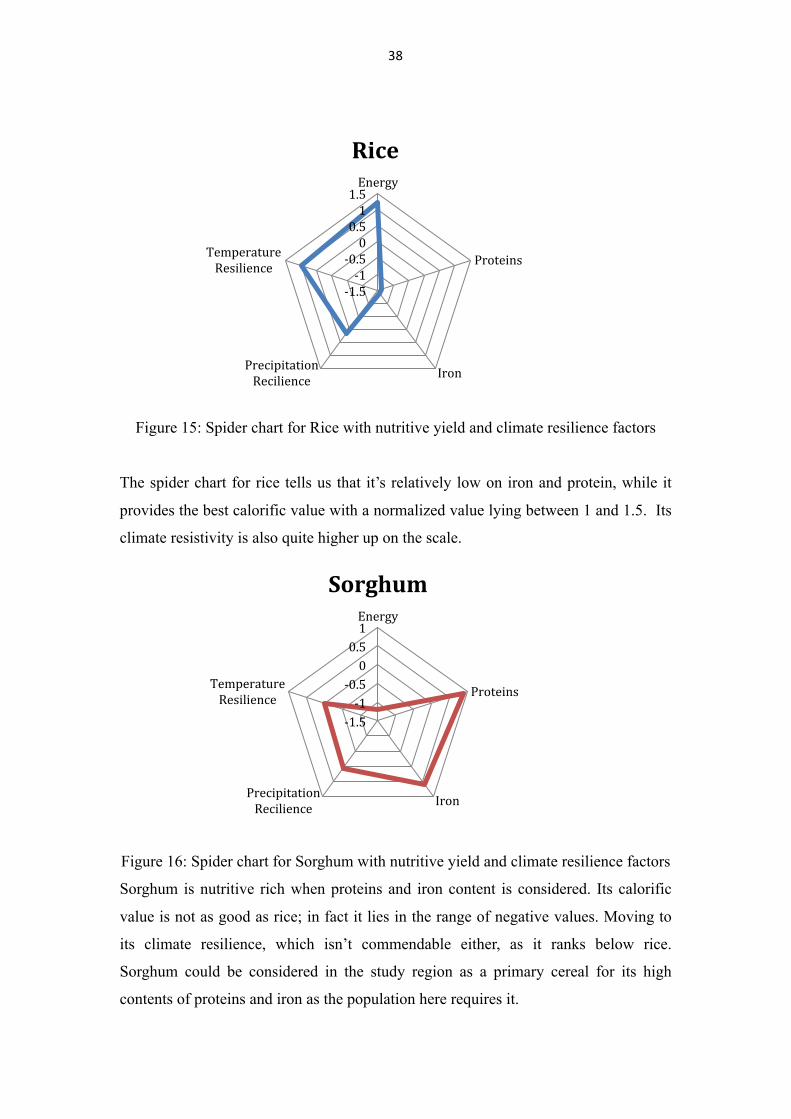
The three major primary cereals in the panchayat over the last two decades are finger
millet, sorghum and rice. To compare and understand which among the three is the
best cereal we plot normalized values of nutritional yield and climate resilience on the
spider chart. But it is to be kept in mind that no crop is superior than the other in all
aspects. We have to pick the best cereal according to the conditions of the study area.
To interpret the spider chart there are value given along each circle. For nutritive yield
(energy, proteins and iron) -1.5 means the least and the positive is the highest yield.
The values have been normalized to best fit the minimum and maximum value. Where
as in the case of climate resilience -1.5 means the least resilient and positive 1.5
means the highest resilience. For climate resilience as well the values have been
normalized.
38
Figure 15: Spider chart for Rice with nutritive yield and climate resilience factors
The spider chart for rice tells us that it’s relatively low on iron and protein, while it
provides the best calorific value with a normalized value lying between 1 and 1.5. Its
climate resistivity is also quite higher up on the scale.
Figure 16: Spider chart for Sorghum with nutritive yield and climate resilience factors
Sorghum is nutritive rich when proteins and iron content is considered. Its calorific
value is not as good as rice; in fact it lies in the range of negative values. Moving to
its climate resilience, which isn’t commendable either, as it ranks below rice.
Sorghum could be considered in the study region as a primary cereal for its high
contents of proteins and iron as the population here requires it.
-1.5-1
-0.50
0.51
1.5Energy
Proteins
IronPrecipitationRecilience
TemperatureResilience
Rice
-1.5-1
-0.50
0.51Energy
Proteins
IronPrecipitationRecilience
TemperatureResilience
Sorghum
39
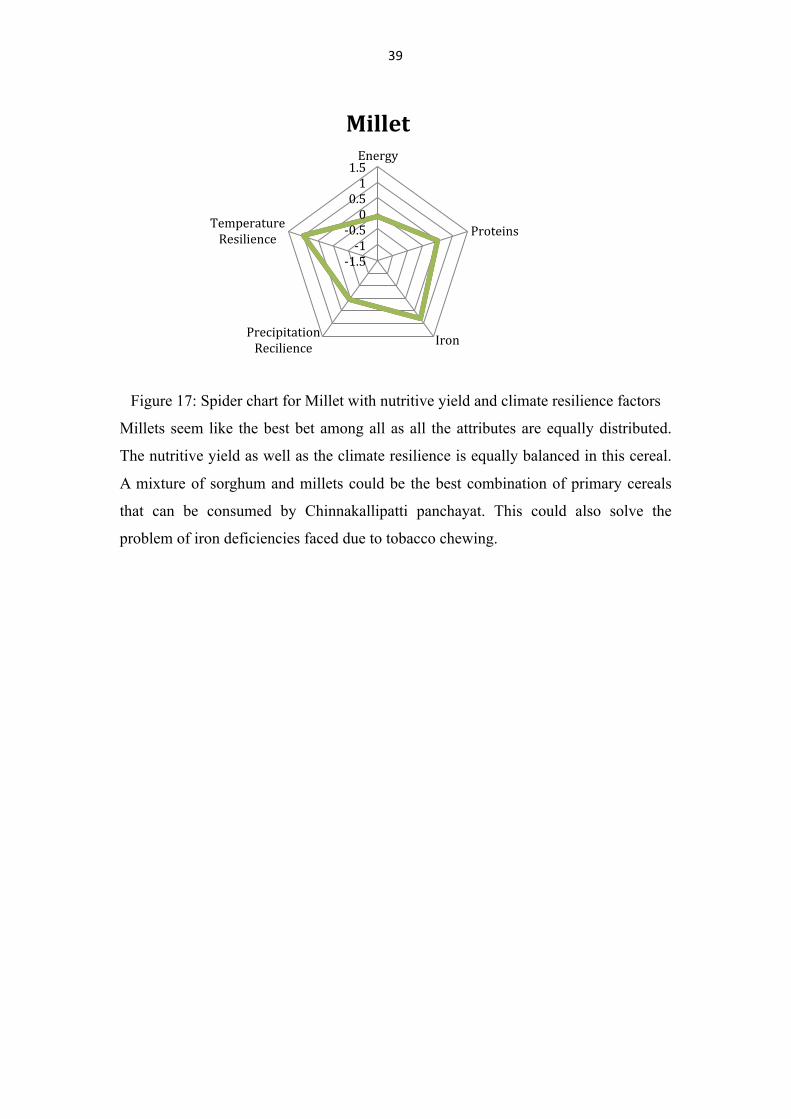
Figure 17: Spider chart for Millet with nutritive yield and climate resilience factors
Millets seem like the best bet among all as all the attributes are equally distributed.
The nutritive yield as well as the climate resilience is equally balanced in this cereal.
A mixture of sorghum and millets could be the best combination of primary cereals
that can be consumed by Chinnakallipatti panchayat. This could also solve the
problem of iron deficiencies faced due to tobacco chewing.
-1.5-1
-0.50
0.51
1.5Energy
Proteins
IronPrecipitationRecilience
TemperatureResilience
Millet
40
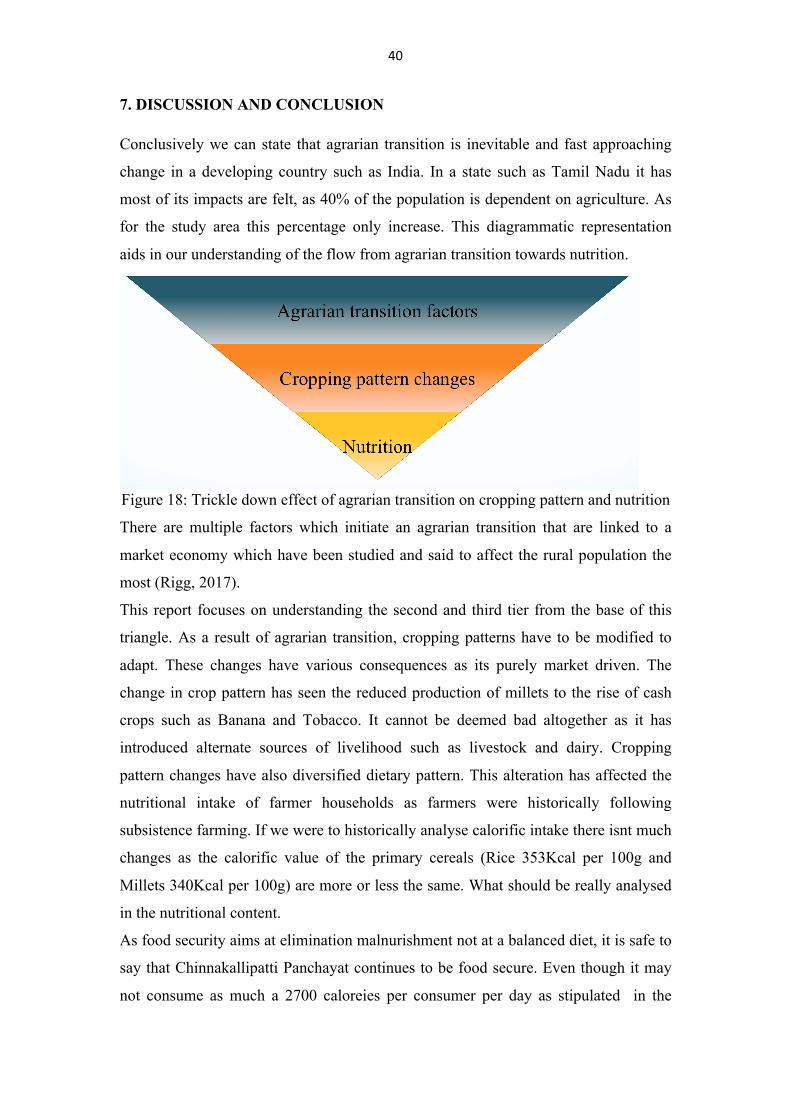
7. DISCUSSION AND CONCLUSION Conclusively we can state that agrarian transition is inevitable and fast approaching
change in a developing country such as India. In a state such as Tamil Nadu it has
most of its impacts are felt, as 40% of the population is dependent on agriculture. As
for the study area this percentage only increase. This diagrammatic representation
aids in our understanding of the flow from agrarian transition towards nutrition.
Figure 18: Trickle down effect of agrarian transition on cropping pattern and nutrition
There are multiple factors which initiate an agrarian transition that are linked to a
market economy which have been studied and said to affect the rural population the
most (Rigg, 2017).
This report focuses on understanding the second and third tier from the base of this
triangle. As a result of agrarian transition, cropping patterns have to be modified to
adapt. These changes have various consequences as its purely market driven. The
change in crop pattern has seen the reduced production of millets to the rise of cash
crops such as Banana and Tobacco. It cannot be deemed bad altogether as it has
introduced alternate sources of livelihood such as livestock and dairy. Cropping
pattern changes have also diversified dietary pattern. This alteration has affected the
nutritional intake of farmer households as farmers were historically following
subsistence farming. If we were to historically analyse calorific intake there isnt much
changes as the calorific value of the primary cereals (Rice 353Kcal per 100g and
Millets 340Kcal per 100g) are more or less the same. What should be really analysed
in the nutritional content.
As food security aims at elimination malnurishment not at a balanced diet, it is safe to
say that Chinnakallipatti Panchayat continues to be food secure. Even though it may
not consume as much a 2700 caloreies per consumer per day as stipulated in the

41
Nutritional intake in India report from the 26th round of NSS. The village in the
panchayat consume almost as much as the national average for calorific intake. The
study probe beyound food security, it divulges into nutrition. Comparitive analysis
between primary cereals based on their nutiritional yield and climate resilience it is
seen that millets are the best for the study region.
Data for the historical dietary patterns were collected by recollection method which is
a major limitation of the study. Secondary data was not procured to triangulate the
data and verify the primary data. Multiple other effects of cropping pattern apart from
food security and nutrition are yet to be studied, which could be a way forward. A gap
in the study could be attributed to the connection of agrarian transition to cropping
pattern. The scope in further research lies in the analysis of nutritional data collected
from Balwadies and district offices.

42
8. REFERENCES Ahluwalia, D., 1993. Public distribution of food in India: Coverage, targeting
and leakages. Food Policy, 18(1), pp.33-54.
Altieri, M.A., 2004. Linking ecologists and traditional farmers in the search for
sustainable agriculture. Frontiers in Ecology and the Environment, 2(1), pp.35-
42.
Anderson, K., 2009. Asia's role in stabilizing food and agricultural prices.
Bouis, H.E. and Haddad, L.J., 1990. Agricultural commercialization, nutrition,
and the rural poor.
Chand, R., Prasanna, P.L. and Singh, A., 2011. Farm size and productivity:
Understanding the strengths of smallholders and improving their livelihoods.
Economic and Political Weekly, pp.5-11.
DeFries, R., Mondal, P., Singh, D., Agrawal, I., Fanzo, J., Remans, R. and
Wood, S. (2016). Synergies and trade-offs for sustainable agriculture:
Nutritional yields and climate-resilience for cereal crops in Central
India. Global Food Security, 11, pp.44-53.
Harriss-White, B. and Janakarajan, S., 1997. From green revolution to rural
industrial revolution in South India. Economic and Political Weekly, pp.1469-
1477.
Sankar, T.J. and Prabakaran, R., 2012. Forecasting milk production in Tamilnadu.
International Multidisciplinary Research Journal, 2(1).
Janakarajan, S. and Moench, M., 2006. Are wells a potential threat to farmers'
well-being? Case of deteriorating groundwater irrigation in Tamil Nadu.
Economic and Political Weekly, pp.3977-3987.
Gulati, A., 1989. Input subsidies in Indian agriculture: a statewise analysis.
Economic and Political Weekly, pp.A57-A65.
Harriss-White, B., 2004. Nutrition and its politics in Tamil Nadu. South Asia
Research, 24(1), pp.51-71.
Shekar, M. (1991). The Tamil Nadu Integrated Nutrition Project: A Review of the
Project with special emphasis on the Monitoring and Information System. CFNPP
Publications Department.
43
Dutta, B. and Ramaswami, B., 2001. Targeting and efficiency in the public
distribution system: Case of Andhra Pradesh and Maharashtra. Economic and
Political Weekly, pp.1524-1532.
Grote, U. (2014). Can we improve global food security? A socio-economic and
political perspective. Food Security, 6(2), pp.187-200.
Hebert, J.R., Gupta, P.C., Mehta, H. and Ebbeling, C.B., 2000. Sources of
variability in dietary intake in two distinct regions of rural India: implications
for nutrition study design and interpretation. European journal of clinical
nutrition, 54(6), p.479.
Jha, R., Bhattacharyya, S. and Gaiha, R., 2011. Social safety nets and nutrient
deprivation: An analysis of the National Rural Employment Guarantee Program
and the Public Distribution System in India. Journal of Asian Economics, 22(2),
pp.189-201.
Jha, R., Gaiha, R. and Sharma, A., 2009. Calorie and micronutrient deprivation
and poverty nutrition traps in rural India. World Development, 37(5), pp.982-
991.
Kattumuri, R., 2011. Food security and the targeted public distribution system
in India.
Khera, R., 2008. Access to the targeted public distribution system: a case study
in Rajasthan. Economic and Political Weekly, pp.51-56.
Khera, R., 2011. India's public distribution system: utilisation and impact.
Journal of Development Studies, 47(7), pp.1038-1060.
Khera, R., 2011. Revival of the public distribution system: evidence and
explanations. Economic and Political Weekly, 46(44-45), pp.36-50.
Kochar, A., 2005. Can targeted food programs improve nutrition? An empirical
analysis of India’s public distribution system. Economic development and
cultural change, 54(1), pp.203-235.
Mooij, J., 1999. Food Policy in india: the importance of electoral politics in
policy implementation. Journal of International Development, 11(4), p.625.
Morton, J.F., 2007. The impact of climate change on smallholder and
subsistence agriculture. Proceedings of the national academy of sciences,
104(50), pp.19680-19685.
Ogunlela, Y.I. and Mukhtar, A.A., 2009. Gender issues in agriculture and rural
44
development in Nigeria: The role of women. Humanity & social sciences
Journal, 4(1), pp.19-30.
Ramaswami, B. and Balakrishnan, P., 2002. Food prices and the efficiency of
public intervention: the case of the public distribution system in India. Food
policy, 27(5), pp.419-436.
Schelling, E., Daoud, S., Daugla, D.M., Diallo, P., Tanner, M. and Zinsstag, J.,
2005. Morbidity and nutrition patterns of three nomadic pastoralist communities
of Chad. Acta tropica, 95(1), pp.16-25.
Tarozzi, A., 2005. The Indian Public Distribution System as provider of food
security: Evidence from child nutrition in Andhra Pradesh. European Economic
Review, 49(5), pp.1305-1330.
Popkin, B.M., 1993. Nutritional patterns and transitions. Population and development
review,pp.138-157
Popkin, B.M., 1994. The nutrition transition in low-income countries: an emerging
crisis. Nutrition reviews, 52(9), pp.285-298.
Subramanian, S.V. and Smith, G.D., 2006. Patterns, distribution, and determinants
of under-and overnutrition: a population-based study of women in India. The
American journal of clinical nutrition, 84(3), pp.633-640.
Kadiyala, S., Harris, J., Headey, D., Yosef, S. and Gillespie, S., 2014. Agriculture
and nutrition in India: mapping evidence to pathways. Annals of the New York
Academy of Sciences, 1331(1), pp.43-56.
Unni, J., 1983. Changes in the Cropping Pattern in Kerala: Some Evidence on
Substitution of Coconut for Rice, 1960-61 to 1978-79. Economic and Political
Weekly, pp.A100-A107.
Sood, A., Choudhury, B.U., Ray, S.S., Jalota, S.K., Sharma, P.K. and Panigrahy,
S., 2009. Impact of cropping pattern changes on the exploitation of water
resources: A remote sensing and GIS approach. Journal of the Indian Society of
Remote Sensing, 37(3), pp.483-491.
Sangwan, S.S., 1985. Dynamics of cropping pattern in Haryana: a supply response
analysis. The developing economies, 23(2), pp.173-186.
HUANG, J., Ridoutt, B.G., XU, C.C., ZHANG, H.L. and Fu, C.H.E.N., 2012.
Cropping pattern modifications change water resource demands in the Beijing
metropolitan area. Journal of Integrative Agriculture, 11(11), pp.1914-1923.

45
Mahesh, R., 1999. Causes and consequences of change in cropping pattern: A
location-specific study.
Panigrahy, S., Ray, S.S., Sood, A., Patel, L.B., Sharma, P.K. and Parihar, J.S.,
2004. Analysis of cropping pattern changes in Bathinda district, Punjab. Journal of
the Indian Society of Remote Sensing, 32(2), pp.209-216.
Lobell, D.B., Schlenker, W. and Costa-Roberts, J., 2011. Climate trends and global
crop production since 1980. Science, 333(6042), pp.616-620.
Fischer, G., Shah, M., Tubiello, F.N. and Van Velhuizen, H., 2005. Socio-
economic and climate change impacts on agriculture: an integrated assessment,
1990–2080. Philosophical Transactions of the Royal Society B: Biological
Sciences, 360(1463), pp.2067-2083.
Joshi, P.K., Gulati, A., Birthal, P.S. and Tewari, L., 2004. Agriculture
diversification in South Asia: patterns, determinants and policy implications.
Economic and Political Weekly, pp.2457-2467.
Gisselquist, R.A.R., Sachs, J.D. and Director, H.I.I.D., 1999. GEOGRAPHY AND
AGRICULTURAL PRODUCTIVITY IN INDIA: IMPLICATIONS FOR TAMIL
NADU.
Kumar, A. and Jain, R., 2013. Growth and Instability in Agricultural Productivity:
A District Level Analysis. Agricultural Economics Research Review, 26(2013).
Bajaj, J. (1994). Archived Articles. [online] Cpsindia.org. Available at:
http://cpsindia.org/index.php/art/123-articles-by-jk-bajaj-and-md-srinivas/food-
consumption-in-india-and-the-world [Accessed 13 May 2017].
En.wikipedia.org. (2017). Tamil Nadu. [online] Available at:
https://en.wikipedia.org/wiki/Tamil_Nadu [Accessed 17 Apr. 2017].
Gopalan, C., Sastri, B. and Balasubramanian, S. (1971). Nutritive Value of Indian
Foods. 1st ed. Hyderabad: National Institute of Nutrition (ICMR).
Government of Tamil Nadu (2017). Policy note of Agriculture Department- 2016-
2017. Chennai: Agricultural Department.
National Institute of Nutrition (2011). DIETARY GUIDELINES FOR INDIANS -A
Manual. Hyderabad.
Nddb.org. (2017). Operation Flood | nddb.coop. [online] Available at:
http://www.nddb.org/about/genesis/flood [Accessed 18 Apr. 2017].
Nihfw.org. (2014). (Beta version)National Institute of Health & Family Welfare.
[online] Available at:

46
http://www.nihfw.org/NationalHealthProgramme/MID_DAYMEAL.html [Accessed
18 Apr. 2017].
Profit.ndtv.com. (2017). Rajan report: Odisha, Bihar least developed; Goa, Kerala on
top - NDTV. [online] Available at: http://profit.ndtv.com/news/economy/article-rajan-
report-odisha-bihar-least-developed-goa-kerala-on-top-327723 [Accessed 17 Apr.
2017].
Sebby, Kathryn, " e Green Revolution of the 1960's and Its Impact on Small Farmers in India" (2010). Environmental Studies Undergraduate Student eses. Paper 10.
Pingali, P. and Rosegrant, M. (1995). Agricultural commercialization and diversification: processes and policies. Food Policy, 20(3), pp.171-185.
47
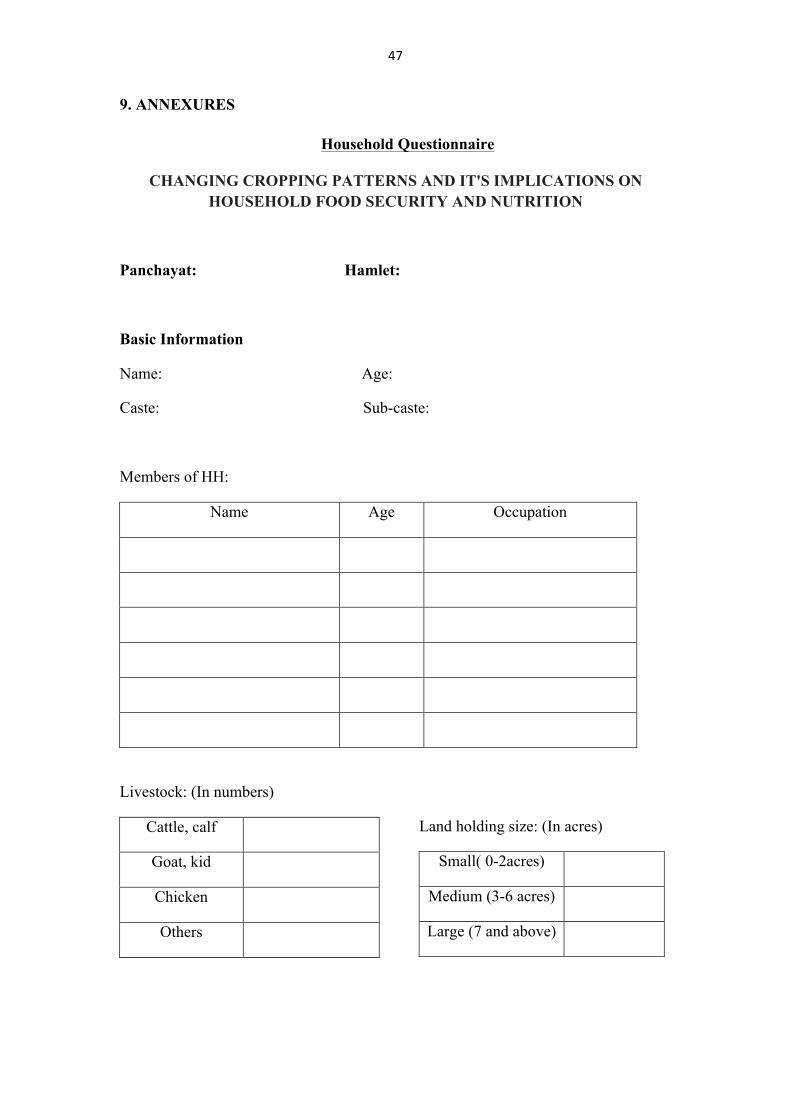
9. ANNEXURES
Household Questionnaire
CHANGING CROPPING PATTERNS AND IT'S IMPLICATIONS ON HOUSEHOLD FOOD SECURITY AND NUTRITION
Panchayat: Hamlet:
Basic Information
Name: Age:
Caste: Sub-caste:
Members of HH:
Name Age Occupation
Livestock: (In numbers)
Cattle, calf
Goat, kid
Chicken
Others
Land holding size: (In acres)
Small( 0-2acres)
Medium (3-6 acres)
Large (7 and above)
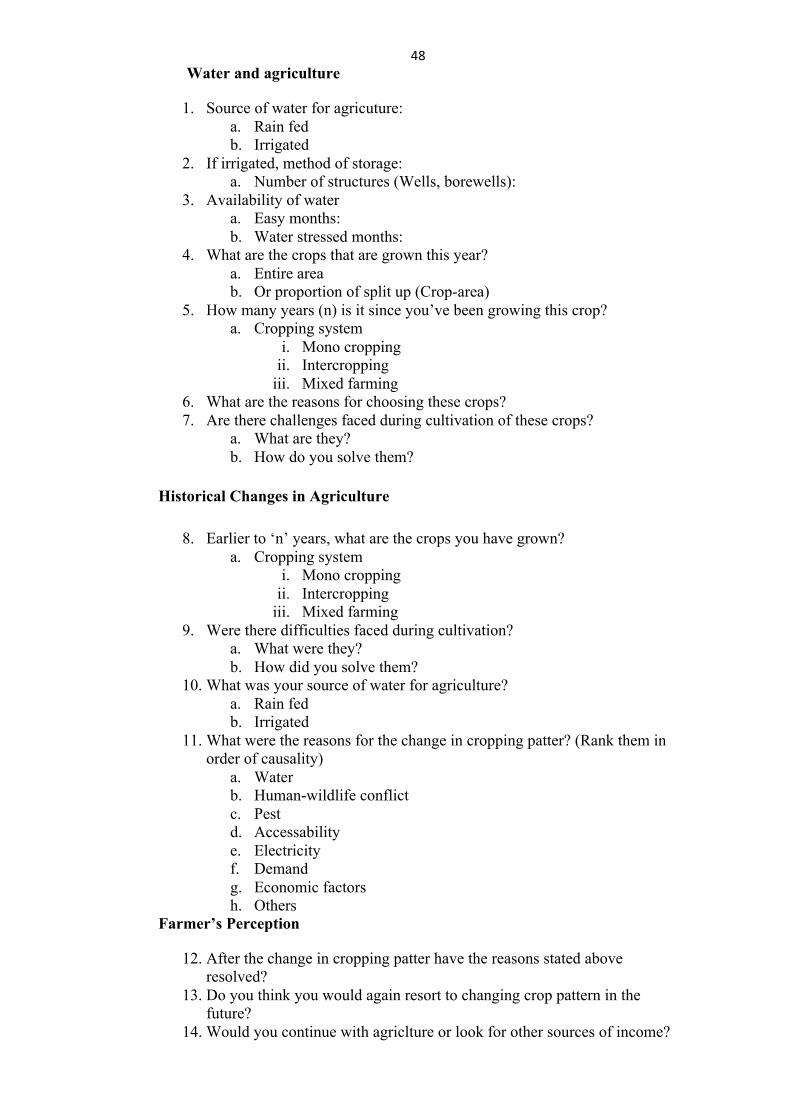
48Water and agriculture
1. Source of water for agricuture: a. Rain fed b. Irrigated
2. If irrigated, method of storage: a. Number of structures (Wells, borewells):
3. Availability of water a. Easy months: b. Water stressed months:
4. What are the crops that are grown this year? a. Entire area b. Or proportion of split up (Crop-area)
5. How many years (n) is it since you’ve been growing this crop? a. Cropping system
i. Mono cropping ii. Intercropping
iii. Mixed farming 6. What are the reasons for choosing these crops? 7. Are there challenges faced during cultivation of these crops?
a. What are they? b. How do you solve them?
Historical Changes in Agriculture
8. Earlier to ‘n’ years, what are the crops you have grown? a. Cropping system
i. Mono cropping ii. Intercropping
iii. Mixed farming 9. Were there difficulties faced during cultivation?
a. What were they? b. How did you solve them?
10. What was your source of water for agriculture? a. Rain fed b. Irrigated
11. What were the reasons for the change in cropping patter? (Rank them in order of causality)
a. Water b. Human-wildlife conflict c. Pest d. Accessability e. Electricity f. Demand g. Economic factors h. Others
Farmer’s Perception
12. After the change in cropping patter have the reasons stated above resolved?
13. Do you think you would again resort to changing crop pattern in the future?
14. Would you continue with agriclture or look for other sources of income?
49Dietary Patterns
Preferebly addressed to the women in the house
15. Can you recall and tell me what were the things you did since you got up in the morning. (Focus mostly on food consumption)
a. When did you cook? b. What did you cook? c. How many meals do you have on an average day? d. (If there are school going children) Are they provided mid-day
meals? i. Can you brielfy out-line the constitents of the meal?
e. If field labourers, are they provided with meals? i. Can you brielfy out-line the constitents of the meal?
f. To the lady of the house, do you eat first? Who follows?
16. Detail out the ingredients used in a week for a consumption Commodity Type Quantity (In
Kgs) Price (In Rs.)
Rice
Dal
Oil
Condiments (salt, sugar,
masala)
Pickle
Vegetables
Greens
Dairy Products
Beverages (tea, coffee)
Meat
Sweets
Others
17. What is total weekly expenditure on ration?
50 18. From where do you source all these commodities?
a. List of commodities FPS Non-FPS
18. Why do you buy commodities from non-FPSs? 19. Do you use what you grow on the field?
a. Do you grow essential crops for the HH in the field? b. If so, what are they?
20. Do you have a kitchen garden? a. What crops do you grown? b. How often do you grow?
i. All round the year ii. Only during few month – which ones and why?
c. How often do you get harvest? If they have livestock
21. Do you milk the cow? a. How much milk is sourced per day? b. How much of it do you retain for HH purposes? c. Do you make curds or other products from the milk? (In a week)
22. Do you source your meat from the livestock? a. During harsh months or leaner months
Historical Dietary Pattern
23. What did your diet consist of before the change in crop pattern? a. What were the cereals? b. Did you consume greens then? What were they? c. Dal? Dairy products? Fruits? Beverages?
24. Did you utilise part of the produce for HH purposes? a. What is the proportion?
25. Do you think there is a link between food habits and your crop pattern? Explain.
PDS 26. When did you have access to PDS? 27. Do you think PDS has led to dietary pattern changes?
a. Explain the changes, if any. 28. Has availability of commodities from non-FPS led to the change in diet? 29. What is the reason for choosing non-FPS shops for monthly ration?
51
B. Key informant interview Questionnaire
PDS Questionnaire
1. How does PDS work?
2. Who allots the produce to various FPS? What are the commodities
given?
3. What are the commodities that have been allotted this month and what
are their quantities?
4. Is there a variation in allotment during certain months? (Difficult months
such as summer)
5. What does the FPS in-charge do incase of a shortage of commodities in a
month? Is it first-come, first-serve or does the shop in charge ration it?
6. How many people avail of the services on an average in a month? Apart
from Rice (free commodity) what do they buy?
7. On which days of the month does the FPS open?
8. What is the determining factor for the number of FPSs in a panchayat?
9. Have you eliminated any bogus cardholders?
10. Do you have transgender family cardholders in your ward?
11. What are the various types of cards given to the people? What are the
criteria for classification? What are the benefits of each card?
12. What is the scale of supply for each commodity per person?
13. Do/Have you distribute/distributed pongal gift hampers? (Was part of
2014-15 report)
14. Do you supply bulk rice to Mosques for the preparation of ‘Kanji’
(Broth) during the holy month of Ramzan?
15. Do you receive any complaints?
a. On an average how many in a month? (If any)
b. What do you do about it?
c. Have the problems been addressed
52
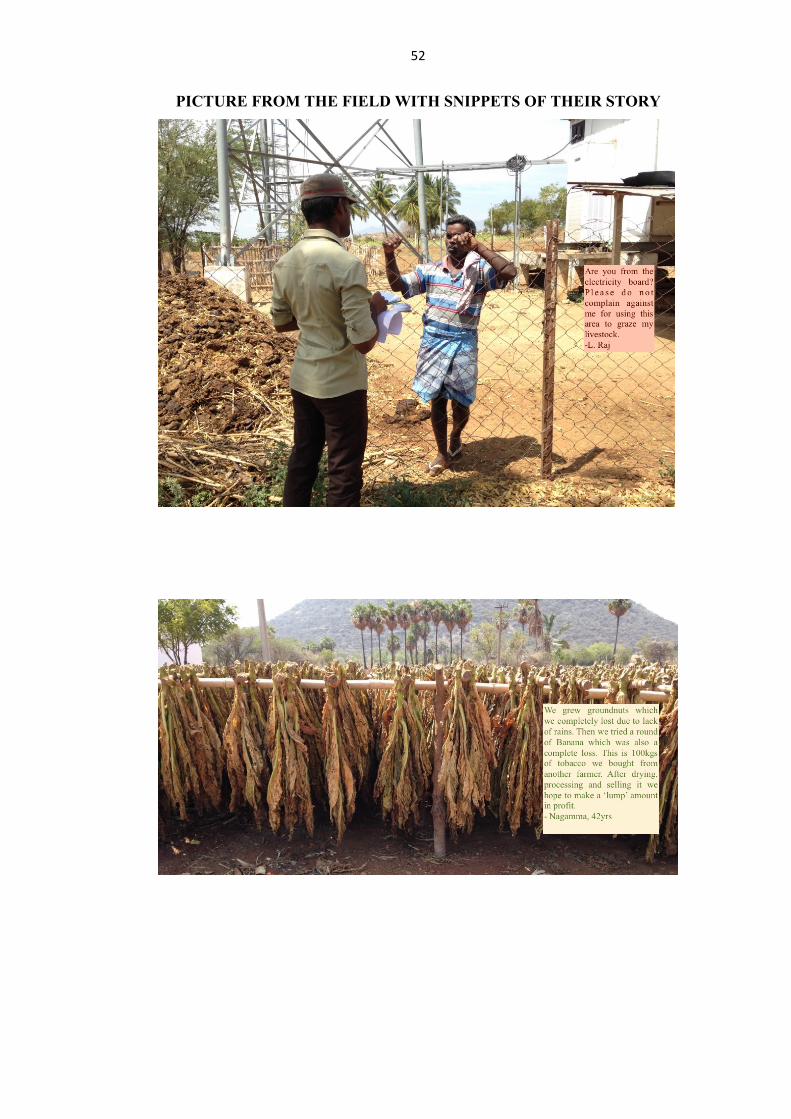
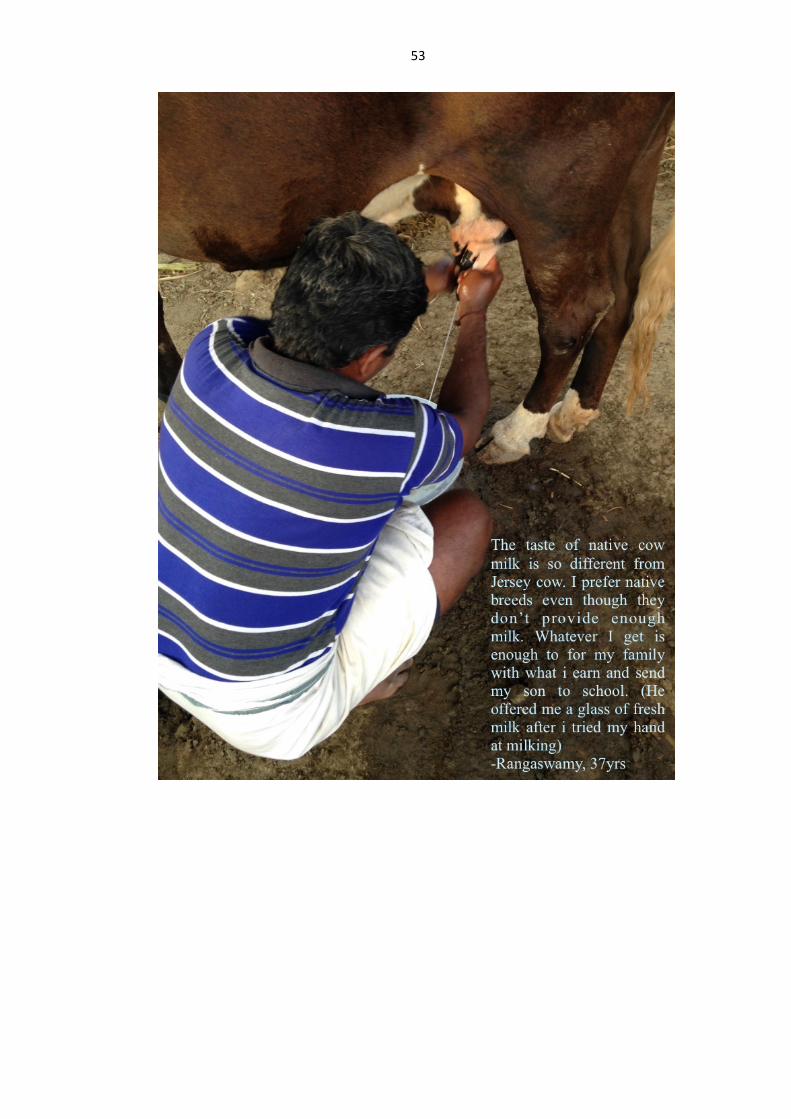
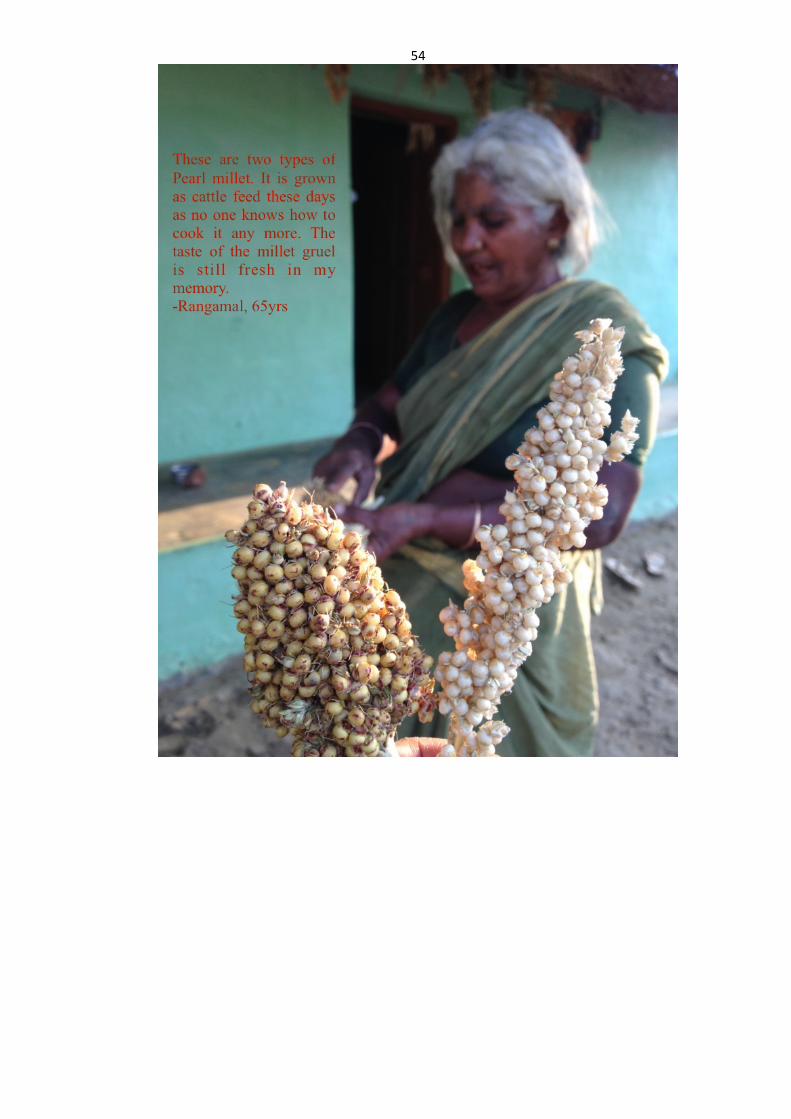
PICTURE FROM THE FIELD WITH SNIPPETS OF THEIR STORY
53
54

55Key Informant Interview: PDS
(Transcript of the conversation between the PDS in-charge and me)
Q.How does PDS work?
PDS in-charge: With the help of state government through cooperative banks.
Q. Who allots the produce to various FPS? What are the commodities given?
PDS in-charge: The taluk office is in charge of supply. TSO is the head, taluk supply officer.
Q. What are the commodities that have been allotted this month and what are their quantities?
PDS in-charge: Par boiled rice and raw rice, wheat, palm oil, dal, tea, kerosene.
Q. How much do they give?
PDS in-charge: It depends on the type of cardholders. There are various types of cardholders like AAY, which is for people who are below poverty line. Then there is rice card. Then there is sugar card where they get 2kgs for 4 people, and 1.5kgs for 3 people but they don’t get rice.
Q. What were the commodities you got in the month of feb?
PDS in-charge: I got sugar 800kgs, Par-boiled rice and raw rice 6500kg, AAY rice 2100kg, palm oil-300lts, Dal – 300kgs, wheat- 800kg, kerosene -800kg and tea-50pc of 100gm each. We also get Maida (refined flour) but its not subsidized.
Q. What were the things you got this month?
PDS in-charge: Sugar, par-boiled rice, AAY rice, and kerosene.
Q. Did you get palm oil?
PDS in-charge: No, we didn’t get it since tender has not been taken. Every month a tender is taken to allot the commodities.
Q. What is OAP and APR?
PDS in-charge: OAP is a type of card for aged people. APR card is for people without family who are widows. APR card holders get 10kg rice.
Q. Is there a variation in allotment during certain months? (Difficult months such as summer)
PDS in-charge: There is nothing like that it all depends on the stalk in the godown (storage) and the tender.
Q. What do you (PDS in-charge) do incase of a shortage of commodities in a month? Is it first-come, first-serve or does the shop in charge ration it?
PDS in-charge: It’s first come first serve and then the following month he gives it to people who didn’t get it the previous month.
Q. How many people avail of the services on an average in a month? Apart from Rice (free commodity) what do they buy?
56PDS in-charge: There are a total of 510 cardholders. Everyone buys everything, there is no one who only takes rice.
Q. On which days of the month does the FPS open?
PDS in-charge: Last two Sundays of a month the shop is closed. In a day its open from 9:00am to 6:00pm. Lunch break is from 1:00pm tp 2:00pm.
Q. What is the determining factor for the number of FPSs in a panchayat?
PDS in-charge: There are 3 shops in this panchayat. One in Rangampalyam, Chinnakallipatti and Shanmugapuram.
Q. Have you eliminated any bogus cardholders?
PDS in-charge: Yes, we have shifted a lot of cards and cancelled it when people are shifting.
Q. Do you have transgender family cardholders in your ward?
PDS in-charge: There is no one in this village.
Q. What are the various types of cards given to the people? What are the criteria for classification? What are the benefits of each card?
PDS in-charge: AAY, OAP, APR and sugar card. Is there a khakhi card? There is no kakhi card in this village.
Q. What is the scale of supply for each commodity per person?
PDS in-charge: They have to totally spend Rs180 for buying all the commodities which includes kerosene.
Q. Do/Have you distribute/distributed pongal gift hampers? (Was part of 2014-15 report)
PDS in-charge: Yes, they have given. Rasins, cashew nut, cardamom, sugar, sugar care was given this year if not like last year Rs100 is given.
Q. Do you supply bulk rice to Mosques for the preparation of ‘Kanji’ (Broth) during the holy month of Ramzan?
PDS in-charge: There is no mosque here.
Q.Do you receive any complaints?
PDS in-charge: Yes, we do. We inform the taluk office. They complain of commodities not available.
Q. What is this quantity per person?
PDS in-charge: For one person we give 12kg, 1.5people 14kgs, 2people 16kgs, 2.5 people 18kgs and 3 and above is 20kgs. For the AAY card its 35kgs.