changing demographics of college admissions patrick frazier senior assistant director of admissions...
TRANSCRIPT

Changing demographics of college admissionsPatrick FrazierSenior Assistant Director of AdmissionsWestern Carolina University

Overview
• Demographics• Ethnic demographics• High school graduates• Competitive changes• Student control• Uncertain times
WHAT DOES “CHANGING DEMOGRAPHICS” MEAN TO YOU?

Types of Demographics• Ethnicity• Gender• Age• Nationality• Education level
• High school graduate• Community college graduate• Some amount of higher education credits• No degree

CHANGING ETHNIC DEMOGRAPHIC
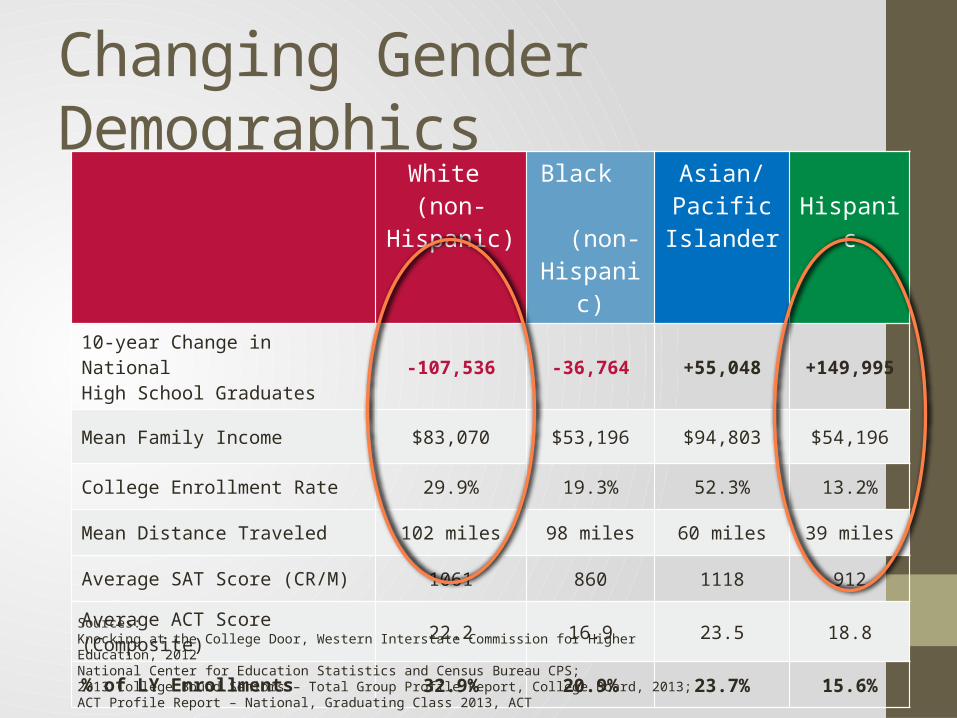
Changing Gender Demographics
White (non-
Hispanic)
Black (non-
Hispanic)
Asian/ Pacific
IslanderHispanic
10-year Change in National High School Graduates -107,536 -36,764 +55,048 +149,995
Mean Family Income $83,070 $53,196 $94,803 $54,196
College Enrollment Rate 29.9% 19.3% 52.3% 13.2%
Mean Distance Traveled 102 miles 98 miles 60 miles 39 miles
Average SAT Score (CR/M) 1061 860 1118 912
Average ACT Score (Composite) 22.2 16.9 23.5 18.8
% of LY Enrollments 32.9% 20.9% 23.7% 15.6%
Sources: Knocking at the College Door, Western Interstate Commission for Higher Education, 2012National Center for Education Statistics and Census Bureau CPS; 2013 College Bound Seniors – Total Group Profile Report, College Board, 2013;ACT Profile Report – National, Graduating Class 2013, ACT
What will future changes look like?• Will the current trends continue?• Have you noticed these trends on your
campus?• Missing ethnic group/classification?
• Multi-racial

New Student Diversity at WCU
2004 2005 2006 2007 2008 2009 2010 2011 2012 2013 20140
20
40
60
80
100
120
140
African American Hispanic Native American Multi-racial

HIGH SCHOOL GRADUATES

North Carolina high school graduates20
13
2014
2015
2016
2017
2018
2019
2020
2021
2022
2023
2024
2025
2026
2027
50,000
60,000
70,000
80,000
90,000
100,000
110,000
Academic Year
Gra
duat
es

How well do you know the trends?• Why was there a dramatic drop in 2021?• How far in advance are you looking at
graduation projections in your state?• Are the projections the same in every
state?• What happens when you look at the
graduation rates based on geographic regions?
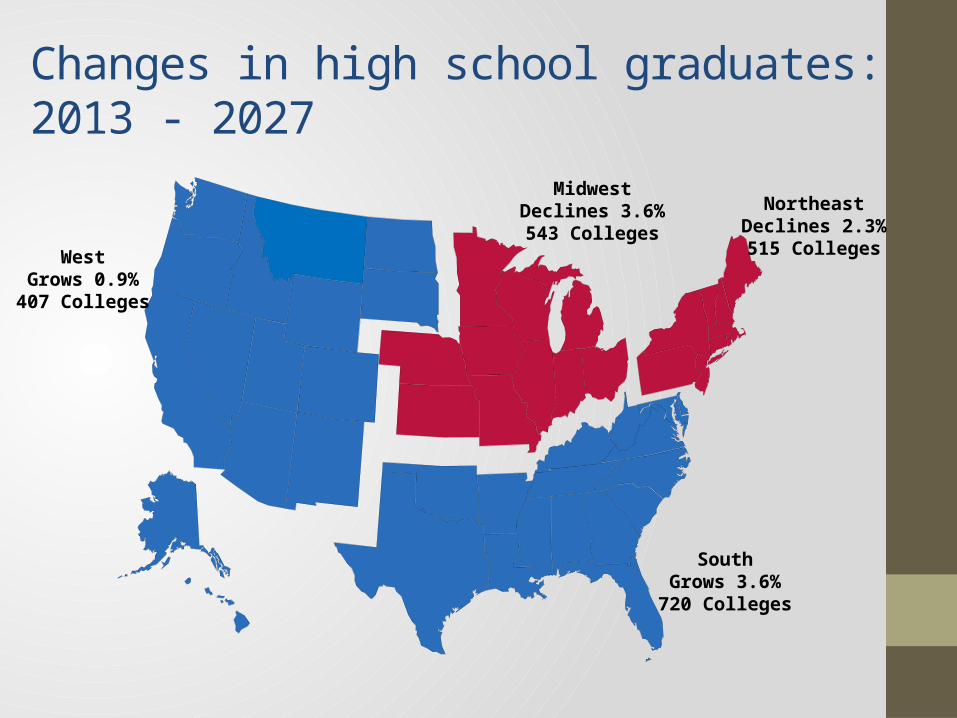
Changes in high school graduates: 2013 - 2027
SouthGrows 3.6%720 Colleges
WestGrows 0.9%407 Colleges
MidwestDeclines 3.6%543 Colleges
NortheastDeclines 2.3%515 Colleges

COMPETITIVE CHANGES

What data are you using?
• Number of suspects• Number of prospects• Applications• Accepted students• Enrolled students

Fall 2014 WCU Entering Class
• Enrolled: 1,745
• Admitted: 6,638
• Applications: 15,398
• Prospects: 55,001
• Suspects: 256,390

STUDENT CONTROL

Student Application Buyers Market
2006 2008 2010 2012
18% 15% 14% 13%
43%40%
38% 37%
40%45%
49% 50%
Number of Applications Submitted
5+
2-4
1
Source: Higher Education Research Institute, UCLA ,The American Freshman, National Norms
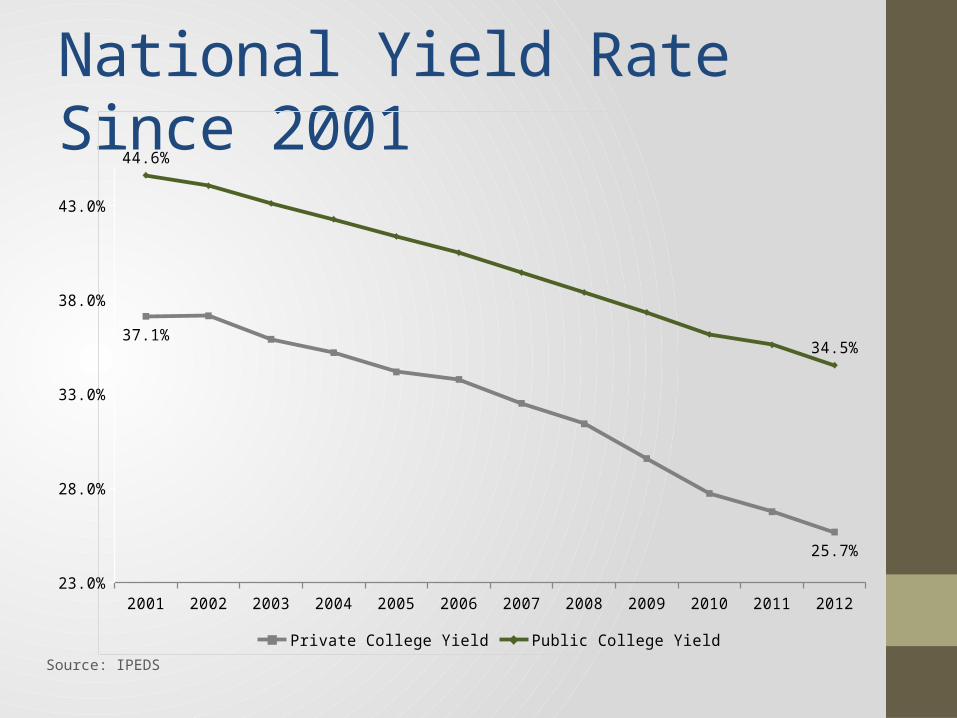
National Yield Rate Since 2001
Source: IPEDS
2001 2002 2003 2004 2005 2006 2007 2008 2009 2010 2011 201223.0%
28.0%
33.0%
38.0%
43.0%
37.1%
25.7%
44.6%
34.5%
Private College Yield Public College Yield

UNCERTAIN TIMES
Changes occur without warning• Student preferences• Influx of new demographics of students• Loss of demographics of students• Services available for various
demographics• Unexpected changes in the number of
available students

QUESTIONS & COMMENTS