changing patterns of international migration from the
TRANSCRIPT
Conference on Migration and Competitiveness
in US and Japan
Changing Patterns of International
Migration from the aspects of competitiveness and with policy reform implications
after the great disasters in Japan
March 22, 2012 at UC Berkeley Yasushi Iguchi
School of Economics, Kwansei Gakuin University

Content
1 Introduction 2 Complex nature of disasters affecting migration
patterns 3 New development of regional economic integration
surrounding Japan 4 Demographic movement and labor market changes
affecting International Migration 5 Relationship between demographic or industrial
factors and International migration 6 New Case study: Local Development under
globalization, depopulation and migration 7 Concluding remarks Annex: Recent trends in migration Policy in Japan Selected references

1 Introduction
The conference on migration and competitiveness has been planed by Prof. Martin with strong support from Prof. Iguchi myself.
Regional, national and especially local economies are faced with growing risks of global competition and population movements in many cases with depopulation.
It is urgent to explore how to restore, maintain or reinforce
competitive positions at every level in the face of growing economic and political powers and new rules of the games of emerging economies (Remember the concept of “Beijing Consensus”) .
The Japan-US migration-comparative studies should not be
just repetition of superficial and rudimentary exchange of knowledge, but we should intend to create joint initiatives on in-depth studies related to migration and competitiveness.
Therefore, the objectives of this presentation are to examine present state of international migration in Japan taking into account of
1) drastically changing economic and demographic circumstances before and after March 11, 2011,
2) structural factors which have been motivating migration movements especially from local, sectoral and occupational standpoints and
3) focal points of policy discussions which might lead to reforms of migration policies in the future.
At the national level in Japan, with the exception of
the amendment of Immigration and Refugee Recognition Act in 2009 and its enforcement in July 2010 and July 2012, the changes in migration policy until March 2012 can be regarded as temporary or fine tunings.
At the same time, social integration policy has been
continuously evolving in some municipalities with their objective “multicultural coexistence” at the local level.
There are growing interactions between national and local levels in the framework of “emergency measures” since autumn 2008.
However, it is clear that migration policy in Japan lacks in political will especially at national levels.
Therefore, during this presentation, discussion will be
inclined to focus on local development strategies and its relation to migration.
I am sure that at local levels especially, the concept of
“migration and competitiveness” is one of the very concrete issues especially some sectors and occupations at local level. The detailed analysis is expected in the following presentation.
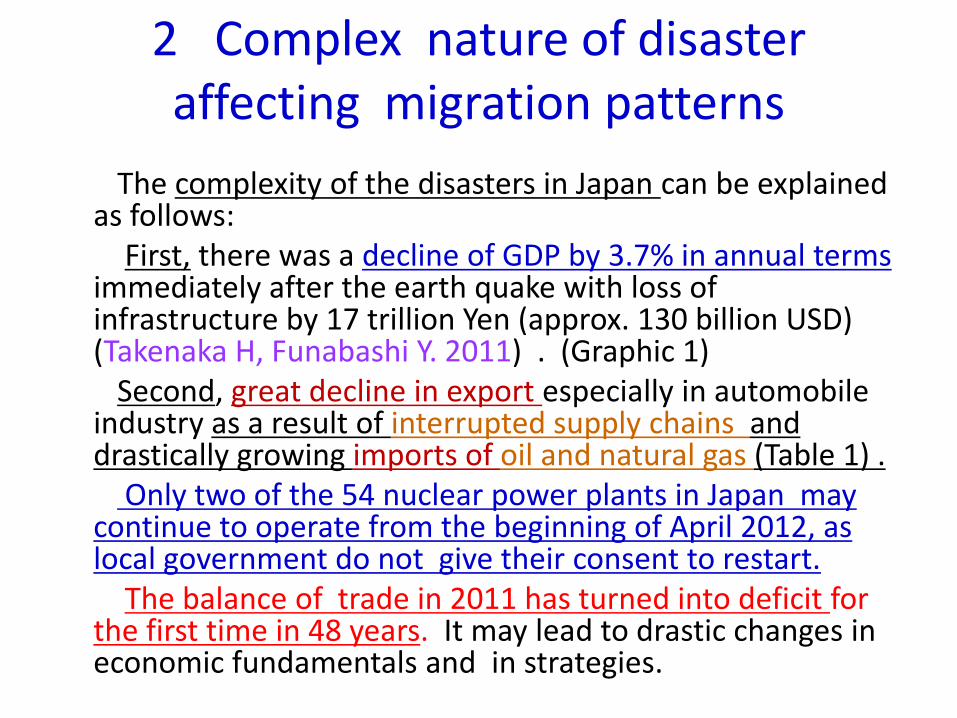
2 Complex nature of disaster affecting migration patterns
The complexity of the disasters in Japan can be explained
as follows: First, there was a decline of GDP by 3.7% in annual terms
immediately after the earth quake with loss of infrastructure by 17 trillion Yen (approx. 130 billion USD) (Takenaka H, Funabashi Y. 2011) . (Graphic 1)
Second, great decline in export especially in automobile industry as a result of interrupted supply chains and drastically growing imports of oil and natural gas (Table 1) .
Only two of the 54 nuclear power plants in Japan may continue to operate from the beginning of April 2012, as local government do not give their consent to restart.
The balance of trade in 2011 has turned into deficit for the first time in 48 years. It may lead to drastic changes in economic fundamentals and in strategies.

Source: Provided by BBC World News
Graphic 1

2009/ 1- 3.
-9.3 -2.2 0 -2.7 -0.8 0 -0.2 -3.6 -6.6 3.0
4- 6. -6.6 -0.4 -0.5 -2.4 -1.8 0.4 0.4 -2.3 -5.4 3.1
7- 9. -5.6 -0.3 -0.9 -2.4 -1.3 0.6 0.4 -1.9 -4.3 2.4
10-12. -0.5 1.2 -0.9 -1 -2.7 0.6 0.6 1.7 -0.8 2.5
2010/ 1- 3.
4.8 2.2 -0.6 -1.1 -0.2 0.4 0.6 3.3 4.0 -0.7
4- 6. 4.4 1.3 -0.2 0.3 0.6 0.6 -0.1 1.8 3.7 -1.9
7- 9. 5.5 1.6 0 0.6 1.5 0.4 0 1.3 2.9 -1.6
10-12. 3.1 0.8 0.2 0.3 1.1 0.3 -0.4 0.5 1.9 -1.3
2011/ 1- 3.
-0.3 -0.4 0.2 0.5 0 0.5 -0.8 -0.3 0.9 -1.2
4- 6. -1.7 -0.3 0.1 -0.2 -0.5 0.4 0.1 -1.3 -0.8 -0.5
7- 9. -0.5 0.3 0.2 -0.3 -0.5 0.4 0 -0.6 0.2 -0.8
10-12. -1.0 0.3 0.1 0.2 -0.8 0.3 0 -1.1 -0.3 -0.8
source: Cabinet Office
Table 1 GDP growth (Expenditure )
Consumption ofHouseholds
PrivateResidentialInvestment
Private Non-Resi.Investment
Private Inventories
Government Consumption
Public Investment
Goods & Services
Net Exports
Exports Imports

Third, there were growing threat of long-term radioactive effects on environment in the areas surrounding the Fukushima Daiichi Nuclear Plant. In addition, anxieties have been growing on safety of food produced especially in the Eastern part of Japan.
Fourth, after the disasters, the structure of industrial
fragmentation in East Asia is certainly changing, as a result of historically high evaluation of the Yen vis-à-vis Asian currencies (Especially important is the net effective exchange rate) . (Graphic 1)
Fifth, local development is becoming much more difficult as
a result of accelerating industrial relocation. Additional backgrounds are aging and shrinking population as well as
deflation since 1995. Our strong concern lies in the sectoral and demographic
development at the local level together with migration under the condition of regional integration and deflation.

. Graphic 1 Net Effective Exchange Rate of Yen (in pink) in comparison with Yen against US Dollar ( in blue)
Source: Bank of Japan
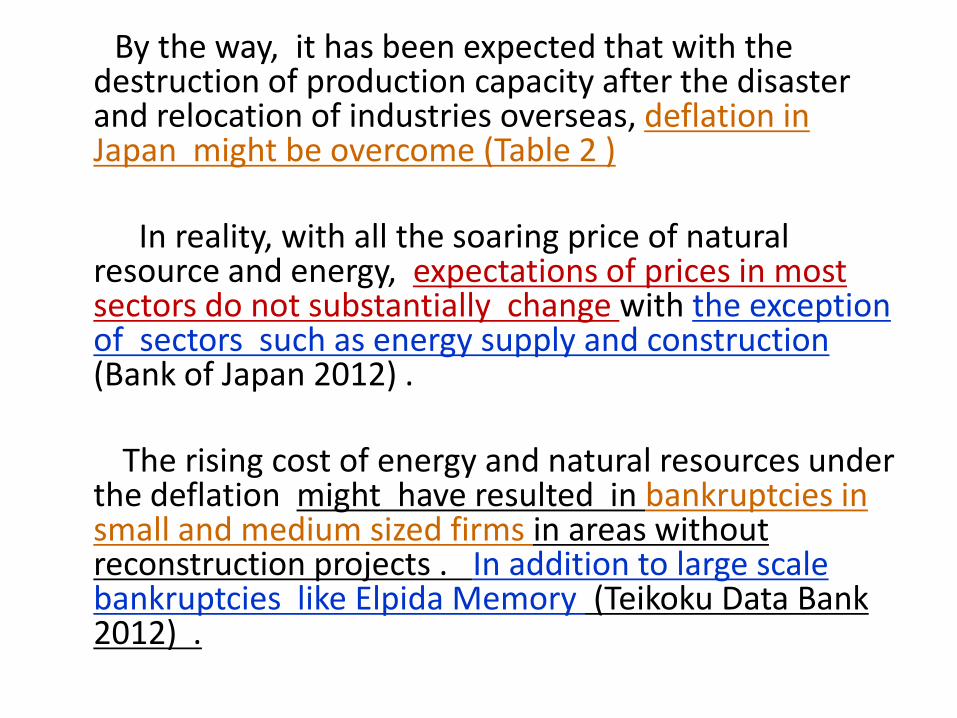
By the way, it has been expected that with the destruction of production capacity after the disaster and relocation of industries overseas, deflation in Japan might be overcome (Table 2 )
In reality, with all the soaring price of natural
resource and energy, expectations of prices in most sectors do not substantially change with the exception of sectors such as energy supply and construction (Bank of Japan 2012) .
The rising cost of energy and natural resources under
the deflation might have resulted in bankruptcies in small and medium sized firms in areas without reconstruction projects . In addition to large scale bankruptcies like Elpida Memory (Teikoku Data Bank 2012) .
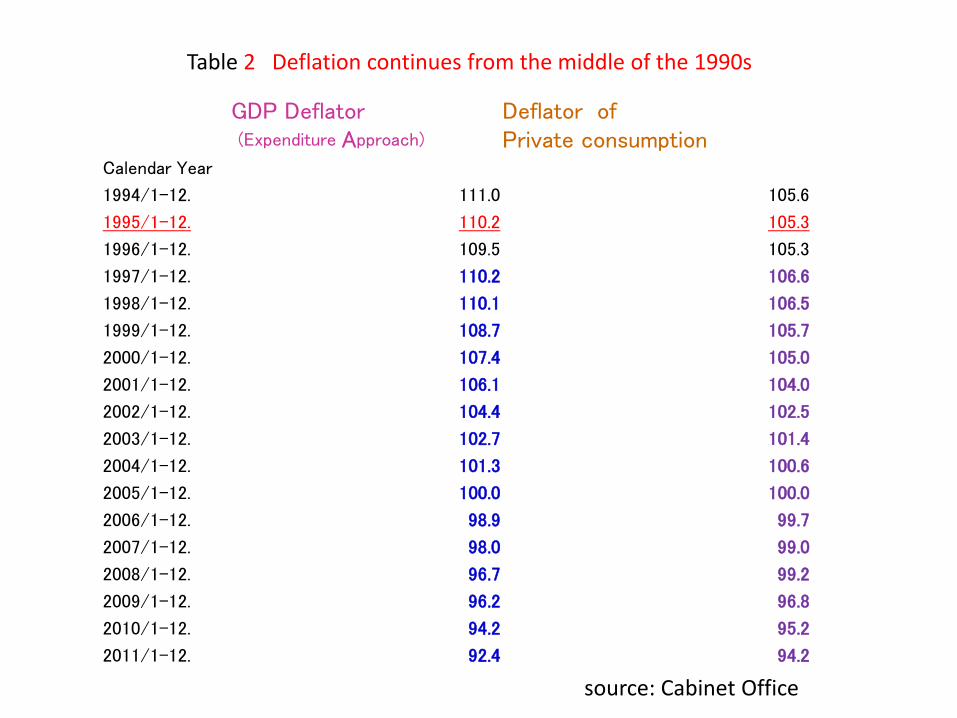
GDP Deflator (Expenditure Approach)
Deflator of Private consumption
Calendar Year
1994/1-12. 111.0 105.6
1995/1-12. 110.2 105.3
1996/1-12. 109.5 105.3
1997/1-12. 110.2 106.6
1998/1-12. 110.1 106.5
1999/1-12. 108.7 105.7
2000/1-12. 107.4 105.0
2001/1-12. 106.1 104.0
2002/1-12. 104.4 102.5
2003/1-12. 102.7 101.4
2004/1-12. 101.3 100.6
2005/1-12. 100.0 100.0
2006/1-12. 98.9 99.7
2007/1-12. 98.0 99.0
2008/1-12. 96.7 99.2
2009/1-12. 96.2 96.8
2010/1-12. 94.2 95.2
2011/1-12. 92.4 94.2
Table 2 Deflation continues from the middle of the 1990s
source: Cabinet Office

3 New development of regional economic integration
surrounding Japan
Nowadays, emerging markets are becoming leading economic powers, while developed countries are repeatedly damaged by economic crises. However, their economic integration is not based upon Art. 24 of GATT or Art 8 of GATS, but on the “endowment clause” in the interest of developing countries. In such FTAs, disciplines of economic integration are low in general terms: They are lacking in transparency , including discriminatory treatments and with no effective measures against infringement of intellectual property rights or with obligation of technology transfer when finishing joint-venture contracts.

Table 3 Free Trade Agreements in East Asia
Japan Korea China ASEAN India Australia NZ
Japan - × △ ◎* ◎ ○ -
Korea × - △ ◎※ ◎ △ △
China △ △ - ◎ ◎ ○ ○
ASEAN ◎* ◎※ ◎ ◎ ○ ○ /◎ ○ /◎
India ◎ ◎ △ ○ - - -
Australia ○ △ ○ ○ /◎ - ◎
NZ △ ○ ○ /◎ ◎ -
Source: Iguchi (2010)revised in December 2011
Note: ◎signed or taken effect ○under negotiation △ studying X negotiation suspended NZ means New Zealand. *includes clauses on movement of nurses and care workers in EPA between
Japan and Indonesia / Japan and the Philippines etc.

With such background, negotiations on economic integration is now intensifying in the case of Japan.
- Negotiation on EPA between EU and Japan started in autumn 2011 taking into consideration of TPP.
- Japan decided to join in negotiation on the TPP in
November 2011, with the objectives of establishing transparent and non-discriminatory rules in the Asia-Pacific region
- Experts submitted final report on the FTA between Japan, China and Korea and made a proposal to start negotiation in autumn 2012, which is strongly supported by China.

Promoting regional economic integration by bilateral or
multilaleral free trade agreements is of great strategic importance for Japan in addition to de facto integration.
One of the reasons is shrinking domestic markets with declining
population. Trade liberalization is necessary for maintaining growth momentum of Japan by securing growing markets especially in emerging economies.
However, the de jure regional economic integration in East Asia
has proven to be with serious problems as we already mentioned. The clauses of accepting candidates of qualified nurses and
certified care workers in the Economic Partnership Agreements between Japan and Indonesia or the Philippines are now under review , because the barriers to pass the national examination have been too high. The passing rate of national examination for candidates from Indonesia was only 4% in 2012.
4 Demographic movement and labor market changes
Although labor market as a whole seems to be improving after the earthquake in 2011, there are several structural changes which are reinforced by the disasters.
First, atypical employment is growing again and probably replacing regular employment further .
Second, there are high number of people who are not counted as labor force (inactive, 4.4 million), which is much larger than the unemployed (2.8 million).
At the same time, it is important to note that there are almost 0.9 million foreign labor force (and 2.1 million foreign population) in 2010 (Iguchi 2011, See Chapter 3 ) . The disasters resulted in some decline, but the stock number is so resilient.
We try to verify later that there are substantial volume of mismatches in the local labor markets which continuously requires migrant workers.

Employees (1) Regular employees (2) Non-regular employees (3) Changes of (2) Changes of (3) % of (3)/(1) Unemployed Involuntary unemployed Voluntary unemployed Non-labor force in total Non-labor force while wishing to work Foreign workers (estimated)
9-12 in 2010 1-3, 4-6, 7-9, 10-12 in 2011
Source: Labor Force Survey (with special questionnaires) Note: Numbers are in ten thousand or % . TITs mean Technical Intern Trainees [ ] excludes disaster stricken areas in Eastern part of Japan ※see in detail Table
94 (estimated at the end of 2010, including TITs ※)
Table 4 Recent Labor Market Development
Looking at population movement at the local levels, population decreased in every prefecture already in December 2010 (Graphic 2 and 3 )
When we divide this movement into natural and social increase (decrease) , natural decrease was observable in every prefecture as well (Graphic 3 and 4)
There are some prefectures with social increase of population especially in the Tokyo metropolitan areas, Aichi, Shiga, Osaka, Hyogo and Fukuoka.
Important is that in disaster-stricken areas, only Miyagi Prefecture (strictly speaking only Sendai City) , had been attracting people from neighboring regions after March 2011. This reflects population movement of youngsters.

Graphic 2 Rate of population decrease in 2010 ( Japanese )
Source: Made by the author in reliance on data from Ministry of Internal Affairs and Communication

Graphic 3 Changes of population in 2010 (absolute number of Japanese )
Source: Made by the author in reliance on data from Ministry of Internal Affairs and Communication

Graphic 4 Natural decrease of population in 2010 (absolute number of Japanese)
Source: Made by the author in reliance on data from Ministry of Internal Affairs and Communication

Graphic 5 Social increase or decrease of population in 2010 (absolute number of Japanese )
Source: Made by the author in reliance on data from Ministry of Internal Affairs and Communication
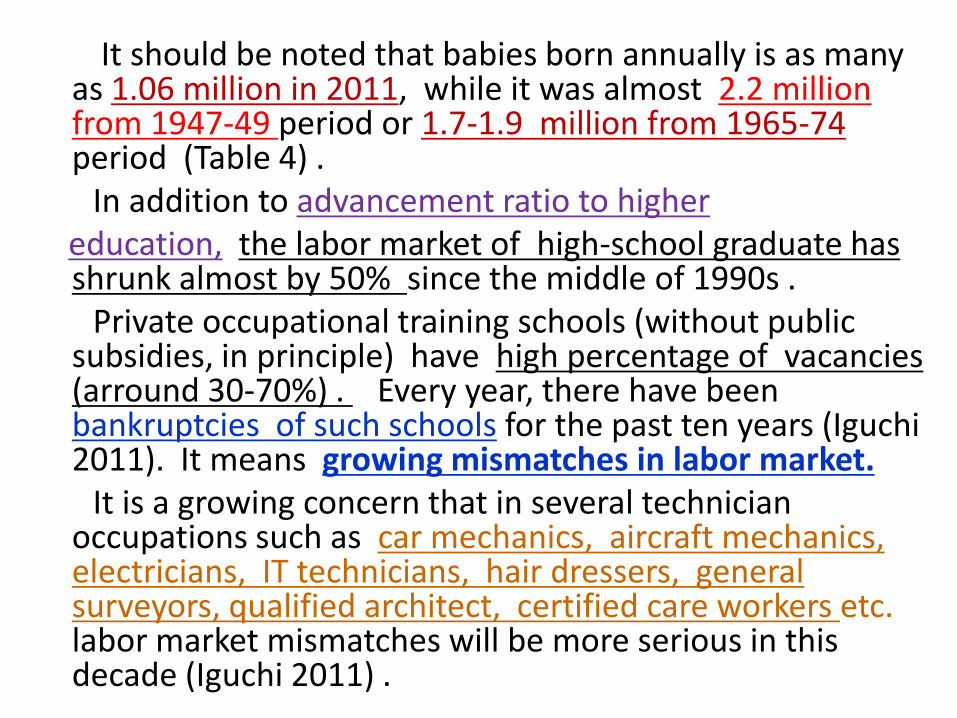
It should be noted that babies born annually is as many as 1.06 million in 2011, while it was almost 2.2 million from 1947-49 period or 1.7-1.9 million from 1965-74 period (Table 4) .
In addition to advancement ratio to higher education, the labor market of high-school graduate has
shrunk almost by 50% since the middle of 1990s . Private occupational training schools (without public
subsidies, in principle) have high percentage of vacancies (arround 30-70%) . Every year, there have been bankruptcies of such schools for the past ten years (Iguchi 2011). It means growing mismatches in labor market.
It is a growing concern that in several technician occupations such as car mechanics, aircraft mechanics, electricians, IT technicians, hair dressers, general surveyors, qualified architect, certified care workers etc. labor market mismatches will be more serious in this decade (Iguchi 2011) .

Table 4 Population Structure on Jan. 1, 2012 (Provisional estimates)
Total population (in ten thousand) Source :MHLW
Age groups
Both sexes Male Female
Total 12773 6214 6559 0 ~ 4 530 272 258 5 ~ 9 547 280 267
10 ~ 14 590 302 288 15 ~ 19 607 312 296 20 ~ 24 635 324 310 25 ~ 29 718 365 353
30 ~ 34 802 407 395 35 ~ 39 965 489 476 40 ~ 44 944 476 467 45 ~ 49 795 400 395 50 ~ 54 764 382 382 55 ~ 59 824 409 415 60 ~ 64 1060 520 540 65 ~ 69 787 377 410 70 ~ 74 727 337 389 75 ~ 79 616 269 347 80 ~ 84 450 177 274 85~ 413 117 296
0~14 1667 854 814 15~64 8113 4084 4029 65~ 2993 1276 1716 75~ 1479 562 916 0~14 (%) 13.1 13.7 12.4 15~64 (%) 63.5 65.7 61.4 65~(%) 23.4 20.5 26.2 75~(%) 11.6 9.0 14.0

5 Relationship between demographic or industrial factors and International migration
Now we should explore the relationship between demographic movement, labor market changes and international migration by econometric analysis.
Using local data, we can easily obtain such a result repeatedly that declining population of youngsters has been met with growing number of foreign labor and population at the local lebel especially by Technical Intern Trainees.
It does not make sense if one insists that foreign labor should not enter labor market while not many female and old aged are working.
Actually, when there are more Japanese Brazilians in a certain local areas, then labor force participation of female and elderly is also high in such areas (Table 6)

Table 6 Correlation of distribution between Japanese and
foreign inhabitants
Share of
Japanese
inhabitants
15~24
years old
Labor
force
from 50
years old
Employee
from 50
years old
Labor
force of
female
from 25
years old
Employee
from 25
years old
Foreign inhabitants 0.301**
0.040
0.619***
0.000
0.699***
0.000
0.021
0.887
0.321**
0.028
Special permanent residents 0.340**
0.019
0.100
0.504
0.360**
0.013
-0.364**
0.012
-0.094
0.532
Japanese Brazilians -0.054
0.718
0.686***
0.000
0.504***
0.000
0.410***
0.004
0.474***
0.001
Technical intern trainee -0.437***
0.002
0.217
0.142
-0.040
0.789
0.396***
0.006
0.215
0.146
Source:Iguchi and Shiho (2007)

2000 2002 2004 2006 2008 2010
Total 1,686,444 1,851,758 1,973,747 1,247,398 2,217,426 2,186,121
Temporary staying foreigners 1,028,839 1,137,983 1,195,162 2,084,919 1,305,065 1,221,926
Permanent residents 657,605 713775 778,585 837,521 912,361 964,195
Ordinary permanent
residents (new comer)
145,336 223,875 312,964 394,477 492,056 565,089
: Chinese 70,599 48,809 96,647 117,329 142,469 169,484
Brazilians 37,121 31,955 52,581 78,523 110,267 117,760
Filipino 32,796 20,933 47,407 60,225 75,806 92,754
Korean 31,203 9,062 42,967 47,629 53,106 58,082
Peruvian 13,975 7,496 20,401 25,132 29,976 32,416
Others 38,181 27,082 52,968 65,589 80,432 94,593
Special permanent
residents(old comer)※
512,269 489,900 465,619 443,044 420,305 399,106
Table 7 Increasing Permanent Residents (new comers)
according to registered foreigners in Japan
Source: Ministry of Justice

1990 1995 2000 2005 2007 2008 2009 2010
Status for the purpose of working 67,983 125,726 154,748 180,465 193,785 211,535 212,896
307235 (207227)
Highly skilled workers 43,823 64,672 89,552 180,465 193,785 172,600 172,900 167,838 With Foreigners ‘ specific skill 24,110 23,324 65,196 51,488 36,994 38,894 39,996 39,429 Technical Intern Trainees etc.
3,260 6,558 29,749 87,324 104,488 121,863 130,636 72374
(100,008) Pert-time worker as students 10,935 32,366 59,435 96,959 104,671 99,485 106,588 111,480 Worker of Japanese descent 71,803 193,748 220,458 239,259 241,325 229,569 202,101 178,031 Overstaying foreigner 106,497 284,744 233,187 193,745 149,785 113,072 91,778 78,488 Undesignated activities Unknown Unknown Unknown Unknown Unknown Unknown Unknown Unknown
Workers as permanent residents ― 17,412 39,154 113,899 143,184 160,212 173,696 183,990
Foreign workers ex. special permanent residents 260000+α 620000+α 750000+α 910,000+α 930,000+α
930,000+α 920,000+α
940,000 (86,000)+α
Registered foreigner
1,075,317 1,362,371 1,686,444 2,048,919 2,159,973 2,217,426
2,186,121
2,134,151
Table 8 Revised estimates of foreign workers from 1990 to 2010 in Japan (Estimated by Y. Iguchi)
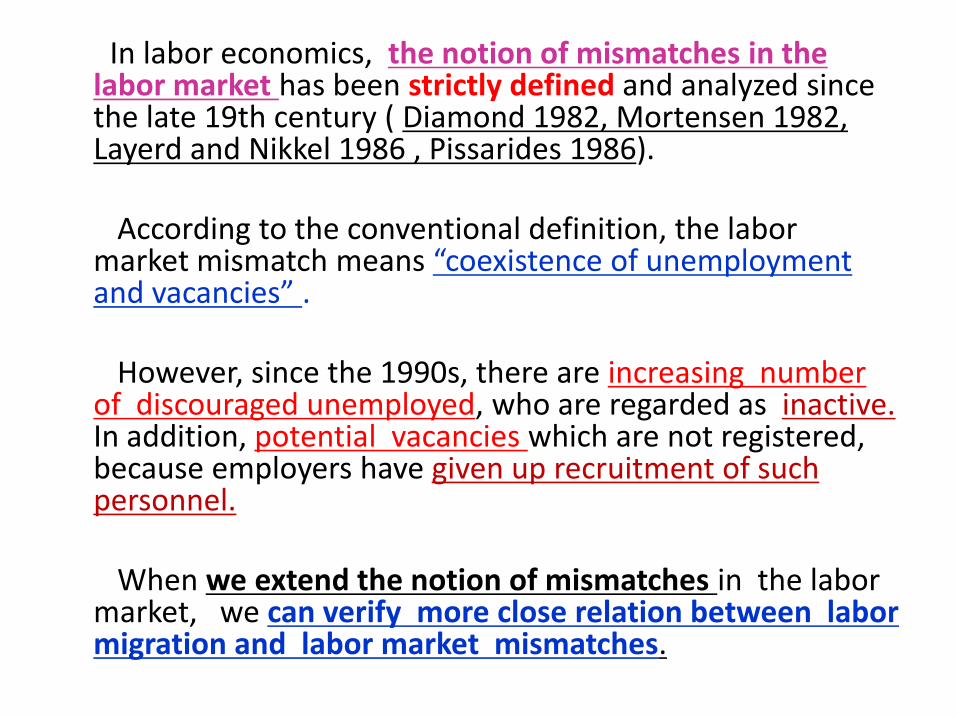
In labor economics, the notion of mismatches in the labor market has been strictly defined and analyzed since the late 19th century ( Diamond 1982, Mortensen 1982, Layerd and Nikkel 1986 , Pissarides 1986).
According to the conventional definition, the labor
market mismatch means “coexistence of unemployment and vacancies” .
However, since the 1990s, there are increasing number
of discouraged unemployed, who are regarded as inactive. In addition, potential vacancies which are not registered, because employers have given up recruitment of such personnel.
When we extend the notion of mismatches in the labor
market, we can verify more close relation between labor migration and labor market mismatches.

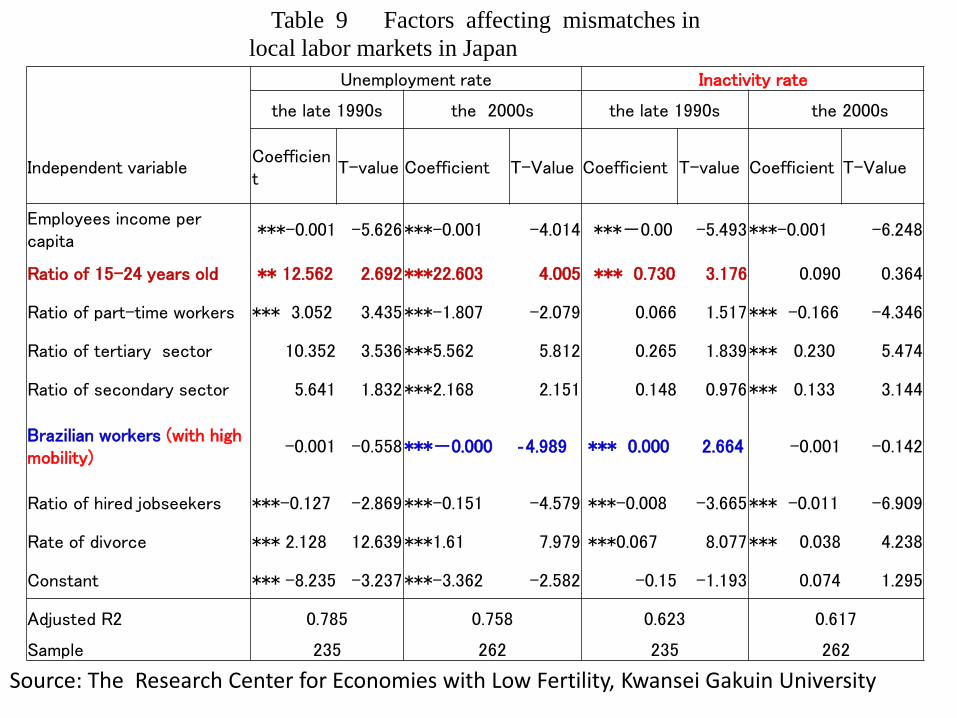
Based upon such empirical result, we can state that labor market mismatches can be mitigated by foreign labor in several ways.
1) Foreigners with high mobility with no occupational restrictions (Japanese Brazilians) may have reduced (mismatch) unemployment rate at the local level in the 2000s, but may have increased inactivity rate in the late 1990s. (Table 9)
2) Foreigners with no mobility in limited occupations
(Technical Interns) have reduced mismatches at the local level caused by higher advancement rate of high school graduates. (Table 10)
3) Foreigners with technology and knowledge and hiring
university graduates are in complementary relationship. It may mean mismatches at the enterprise level can be
mitigated by highly skilled migrants (Table 11).
Unemployment rate Inactivity rate
the late 1990s the 2000s the late 1990s the 2000s
Independent variable Coefficient
T-value Coefficient T-Value Coefficient T-value Coefficient T-Value
Employees income per capita
***-0.001 -5.626 ***-0.001 -4.014 ***-0.00 -5.493 ***-0.001 -6.248
Ratio of 15-24 years old ** 12.562 2.692 ***22.603 4.005 *** 0.730 3.176 0.090 0.364
Ratio of part-time workers *** 3.052 3.435 ***-1.807 -2.079 0.066 1.517 *** -0.166 -4.346
Ratio of tertiary sector 10.352 3.536 ***5.562 5.812 0.265 1.839 *** 0.230 5.474
Ratio of secondary sector 5.641 1.832 ***2.168 2.151 0.148 0.976 *** 0.133 3.144
Brazilian workers (with high mobility)
-0.001 -0.558 ***-0.000 ‐4.989 *** 0.000 2.664 -0.001 -0.142
Ratio of hired jobseekers ***-0.127 -2.869 ***-0.151 -4.579 ***-0.008 -3.665 *** -0.011 -6.909
Rate of divorce *** 2.128 12.639 ***1.61 7.979 ***0.067 8.077 *** 0.038 4.238
Constant *** -8.235 -3.237 ***-3.362 -2.582 -0.15 -1.193 0.074 1.295
Adjusted R2 0.785 0.758 0.623 0.617
Sample 235 262 235 262
Table 9 Factors affecting mismatches in
local labor markets in Japan
Source: The Research Center for Economies with Low Fertility, Kwansei Gakuin University

Technical Intern Trainees
(Rotation Principle without mobility)
Coefficient T-value
Deflator of GDP -9.428 -0.907
Productivity -34.338*** -3.204
New Hiring of High School
Graduates
0.295*** 10.801
Brazilian workers (subcontractor
dispatching) with high mobility
0.012*** 4.817
Advancement rate to universities 19.327*** 4.405
Constant 5633.438 0.561
Adjusted R2 0.059
Sample size (Year) 239 (2003~2007)
Table 10 Determinants of Technical Intern Trainees
in manufacturing sector in Japan
Source: Research Center for the Economies with Low Fertility, Kwansei Gakuin University

independent variables
Hiring graduates as regular staff
Coefficient Wald sugnificance odds ratio
size of establishment ***1.044 39.208 0.000 2.842
ratio of 45 years old and older ***-1.787 5.151 0.023 0.167
experience of employing foreign specialists *** 1.095 4.218 0.040 2.990
experience of employing low skilled foreigners *** 0.963 6.165 0.013 2.620
shortage of specialists and engineers * 0.186 3.747 0.053 1.205
shortage of service workers *** 0.272 6.187 0.013 1.312
shortage of technical workers ***0.737 35.068 0.000 2.090
hiring regular employees other than school leavers -0.062 0.059 0.808 0.940
hiring part-time workers ***-0.010 5.726 0.017 0.990
hiring dispatched workers -0.001 0.353 0.553 0.999
with subsidiary overseas 0.125 0.062 0.803 1.133
constant ***-2.465 36.126 0.000 0.085
sample 611
(-2) likelihood 440.151
Nagelkerke R square 0.476
Cox-Snell R square 0.357
χ square 5.52
Hosmer & Lemeshow test 0.701
Table 11 Factors affecting hiring graduates as regular staff in Japan (source Iguchi 2011)

In addition, in the case of the Great East Japan Earthquake, most of the foreigners got information through networking of foreign nationals and relied on information from their home countries (not from Japan) .
As a result, 530 thousand foreigners left (or evacuated from ) Japan within a month after the earthquake on 11 March 2011.
But, there were increasing returnees as time passed by. The registered foreign population declined slightly (from 2.09 in March to 2.07 million in December 2011 ) (Ministry of Justice 2011).
The changes varies according to nationalities: Largest decline in % was Brazilians, followed by Koreans, while Chinese , Filipinos showed no substantial changes.
In an emergency, dissemination of urgent information from local and national bodies to foreign citizens did not function . It also shows the difficulty of multicultural coexistence at local levels.

When we use population census in 2005, it is clear that in manufacturing, vietnamese and Brazilian are concentrated. In construction, Korean and Thai are strongly represented.
In restaurant and hotels Filipinos are extraordinary concentrated. (Table 12)
Looking at occupation, people from UK and US are mostly specialists, In manufacturing, Vietnamese and Brazilian are highly concentrated. In agriculture, Indonesian, Thai and Chinese are relatively concentrated, as a result of Technical Intern Traineeship programs. (Table 13) .
The effects of such migrant workers on competitiveness is difficult to figure out.
However t is important to identify factors and analyze them by sector or occupation. These geographical distribution should be also explored.

Total Agriculture
Construction
manufacturing
Information communication
Transport Retail and wholesale
Restaurant and hotel
medical care & welfare
education Other
services Others
Total 772,375 10,732 44,421 18,156 19,521 19,521 77,763 87,797 18,148 43,724 117,879 54,960
% 100 1.4 5.8 36.2 2.4 2.5 10.1 11.4 2.3 5.7 15.3 7.1
Korea 225,888 0.4 11.3 13.8 2.5 5.1 16.2 15.3 5.4 2.8 17.1 10
China 185,738 3.2 3.7 44.9 4.1 1.6 10.7 13.3 1.7 2.6 8.0 6.2
Philippines 64,185 1.9 5.0 36.5 0.5 1.5 7.4 24.5 0.8 1.3 15.3 5.2
Thailand 11,366 4.4 7.9 39.2 0.7 1.5 9.1 18.2 1.8 1.7 9.3 6.2
Indonesia 12,909 7.8 5.7 59.4 1.0 0.6 3.0 9.3 0.3 1.4 8.0 3.4
Vietnam 11,467 0.7 2.5 70.7 1.1 1.1 5.7 3.6 0.6 1.0 6.5 6.6
UK 7,319 0.3 0.7 4.4 4.2 0.8 4.5 2.5 0.8 61.2 11.8 8.9
USA 22,348 0.2 1.1 4.5 4.4 1 4.9 1.9 1.1 51.7 20.8 8.4
Brazil 140,830 0.3 2.0 63.8 0.2 1.4 2.5 0.9 0.6 0.7 23.8 3.8
Peru 22,552 0.3 3.4 66.6 0.3 2.0 4.0 1.5 0.3 0.6 14.5 6.6
Japanese 60,733,59
8 4.9 8.8 17.1 2.6 5.1 18.0 5.2 8.8 4.4 14.3 10.8
Table 12 Foreign workers according to sector
Source: Statistical Office, Ministry of Internal Affairs and Telecommunication, Population Census (2005)

Total Specialist
Manager Clerical
Sales Service Agricultural
Transport and communication
production
Others
Total 772,375 97,721 15,886 58,734 66,234 91,086 104,452 12,740 384,142 35,380
% 100 12.7 2.1 7.6 8.6 11.8 1.4 1.6 49.7 4.6
Korea 225,888 10.1 4.9 14.3 17.4 17.3 0.4 4.0 27.1 4.5
China 185,738 10.9 1.1 7.0 6.8 13.1 3.1 0.5 52.8 ※ 4.7
Philippines
64,185 10.2 0.2 3.1 4.0 20.3 1.7 0.5 55.2 4.8
Thailand 11,366 6.4 0.4 3.9 5.8 17.9 4.0 0.6 55.6 5.5
Indonesia 12,909 6.1 0.3 1.9 1.4 8.0 7.6 0.2 71.8 2.8
Vietnam 11,467 3.9 0.3 1.9 3.1 4.2 0.8 0.5 79.0 6.4
UK 7,319 75.3 2.3 8.6 5.0 2.7 0.3 0.2 3.4 2.2
USA 22,348 69.8 2.7 10.4 5.3 2.6 0.2 0.4 5.6 3.0
Brazil 140,830 2.0 0.2 1.8 1.3 2.1 0.3 1.0 87.8 3.5
Peru 22,552 1.4 0.1 1.4 1.9 2.8 0.3 1.1 84.7 6.3
Japanese 60,733,598 13.8 2.4 19.5 14.6 10.0 4.8 3.4 28.1 3.5
Source: Statistical Office, Ministry of Internal Affairs and Telecommunication, Population Census (2005)
Table 13 Foreign workers according to occupation

6 New Case study: Local Development under
globalization, depopulation and migration
There are several studies on the local development after the earthquake already undertaken in some disaster-stricken areas: Ishinomaki and Kesennuma in Miyagi Prefecture and Kamaishi, Miyako and Ofunato in Iwate Prefecture (for example Seki 2011).
Especially hit were Shipbuilding, Seafood and fisheries. Some of which are targeting at domestic markets.
Almost ten months after the disaster, the
government has finally started to pay subsidies for reconstructing industries.
It will take more time to reconstruct infrastructures for public transportation such as harbors and railways.

However, it was urgent for these industries to finance cash flows, even when they can succeed in getting subsidies from the government.
It is difficult for them to get additional loans from banks, as there would be “double loans” if they try to reconstruct factories and equipments.
Many companies get Employment Adjustment Subsidy of Employment Insurance to maintain employment.
Unemployed people get Unemployment allowances, which are now expiring.
It is also difficult for the local industries to offer enough employment for high school graduates at the end of March 2012, even if they want to work at home towns.
At the same time, local medical and welfare facilities lack in workforce, employees suffered from the disaster.
Many of the vacancies from local enterprises are fixed term and they are not accepted by unemployed.

From the disaster stricken areas, almost 40% of foreign technical trainees, who had been working in unheated seafood or textile sectors etc. left Japan. However, they are gradually coming back .
In the same areas, many Filipinos are estimated to remain as spouses of Japanese fishermen, farmers or entrepreneurs, or as single-mothers with children who have been educated in Japan.
In addition, Japanese-Brazilian workers are reportedly increasing in the sectors of construction and civil engineering for reconstruction works. Their families also live in Japan but far apart from the disaster-stricken areas.
The disaster-stricken areas will be also faced with growing mismatches in the labor markets, as the speed of reconstruction projects of companies and recovery of infrastructures are not well arranged and managed.

Source : Photo taken by the author in Ishinomaki City on February 9, 2012

Source: Broadcasted by NHK on February 9 , 2012

Source: Photo taken by the author in Kesennuma city on February 10, 2012

Source: Broadcasted by NHK on February 9 , 2012

7 Concluding remarks After the Great East Japan Earthquake, Japan’s economic
fundamentals and strategies should have to change.
What is more important is that in stead of export-led strategies, Japanese companies would be more actively investing in emerging markets.
Even under such changes of circumstances, migration-competitive nexus may be sometimes continuous, sometimes very much changeable.
In addition, we should pay attention to the extended notion of labor market mismatches. If we verify labor market mismatches can be mitigated by migrant labor, it might be complementary and enhance productivity.
Naturally, it is possible to directly verify relationship between productivity and employment of migrants.

When we look at local areas exposed to globalization and depopulation, gaps between different local areas are inevitably growing. Therefore, encouraging local development together with foreign inhabitants is of greater importance , if competitiveness is maintained.
Not only encouraging industrial accumulation , higher productivity , creation of employment and attraction of youngsters and mitigation of depopulation, but also integration policy for foreigners is required at local level.
In the coming decade, it is important for Japan to realize 1) higher-standard economic integration with emerging markets at the regional level, 2) institutional infrastructures for integrating migrants at the national level, and 3) initiatives for development should be encouraged and supported at the local level.

Annex Recent trends of migration policy in Japan *
1 Type of the Japanese system Basically, the Japanese immigration control system (applicable to
temporary migrants only) can be regarded as an Anglo-Saxon type, because it was established on the basis of U.S. immigration laws during the period of occupation by the U.S. Army after World War II.
The status of residence in the Japanese system is comparable with the visa status for non-immigrants in the U.S.
The immigration control laws and regulations have been supplemented by the Foreigner’s Registration Law, which originally aimed to control, as permanent residents, those Koreans who had lost their Japanese nationality upon the acceptance of the San Francisco Peace Treaty in 1952, which restored Japanese independence.
** Quoted from Iguchi (2011a) and added new developments.

2 Reform concept from lthe local level The Council on Regulatory Reform recommended that
municipalities, in cooperation with government agencies, strengthen policies for “multicultural coexistence.”
To attain this goal, the Anglo-Saxon system of migration policy
should be extended to incorporate functions found in the Continental European system (as implemented in Germany, the Netherlands, and France), which enables municipalities to take effective measures for “integration policy.”
This type of arrangement ensures that the rights of foreign
citizens are guaranteed and their obligations are fulfilled, which is a prerequisite for the success of “immigration policy.”
However, present Japanese immigration laws do not explicitly
stipulate social integration policy for foreigners. The law aims only at “fair control of foreigners”.

3 Basic government policy of accepting foreign workers The ex-Ministers of Labor have repeatedly made statements
in cabinet meetings and obtained “cabinet consent” on the ban on foreign labor since the late 1960s.
Although there were proposals to accept foreign workers, especially nurses, as trainees, while the government of Japan maintained the principle not to accept “foreign (unskilled) labor.”
The government revised the principle of accepting foreign
workers in about 1988 based upon the “cabinet decision” to instate the Economic Plan and the Basic Employment Measures Plan. It insisted that Japan should actively accept foreigners with knowledge and technology (formerly worded: as much as possible), while the acceptance of so-called unskilled labor should be carefully examined.

This principle created a dichotomy. Namely, there seemed to be only two categories of workers: “foreigners with knowledge and technology” and “the so-called unskilled labor.” However, the distinction between the two is not always clear and is sometimes confusing.
The rationale of Japan closing its labor market in principle to
unskilled foreigners has been explained as follows: 1) unskilled foreigners’ entry may be damaging to the labor market
of seniors; 2) they may create a “double structure” in the labor market,
hindering the improvement of working conditions and changes in industrial structure;
3) they may become easily unemployed during a recession; 4) they may entail more social costs (such as education, medical
care, welfare and housing, etc.); and 5) they may bring about “brain waste” and stress for foreigners
themselves (Iguchi, 1997).

4 Changes of administration in September 2009 From September 2009, there was a change of
administration from the coalition of Liberal Democratic Party and Komei Party to that mainly run by Democratic Party.
During this transition, the basic policy for accepting foreign workers is not decided by the Cabinet, but in the employment policy guideline of Ministry of Health, labor and Welfare and in the Immigration Control Plan of Ministry of Justice.
5 Amendment of the Immigration and Refugee Recognition Act Just before the change of administration, the
Immigration Control and Refugees Recognition Act and the Inhabitant’s Register Act were amended.
As a result, Aliens Registration Law will be abolished in July 2012.

From July 2012, Certificate of Alien Registration will be abolished and Certificate of Residence Status (provisional) will be introduced, so as to integrate foreign inhabitants into the Inhabitant’s Register within a digitalized network.
It should be noted that Reporting foreigner’s employment
to public employment office has become compulsory to employers when hiring or firing them as Employment Countermeasures Law was amended in October 2007.
This amendment was intentionally connected with the amendment of Immigration Control and Refugee Recognition Act in July 2009.
With the amendment of the laws, foreign trainees are be
treated as “workers” according to labor laws, when they are engaged in “on-the-job training” under the new law already from July 2010.
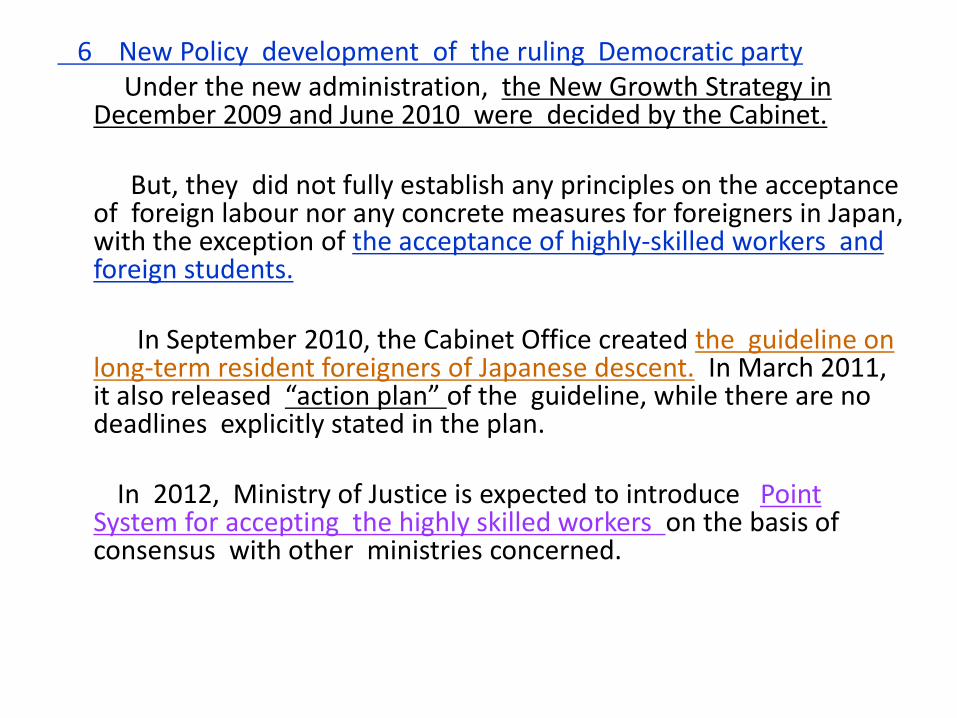
6 New Policy development of the ruling Democratic party Under the new administration, the New Growth Strategy in
December 2009 and June 2010 were decided by the Cabinet. But, they did not fully establish any principles on the acceptance
of foreign labour nor any concrete measures for foreigners in Japan, with the exception of the acceptance of highly-skilled workers and foreign students.
In September 2010, the Cabinet Office created the guideline on
long-term resident foreigners of Japanese descent. In March 2011, it also released “action plan” of the guideline, while there are no deadlines explicitly stated in the plan.
In 2012, Ministry of Justice is expected to introduce Point
System for accepting the highly skilled workers on the basis of consensus with other ministries concerned.

7 Emergency measures for foreigners During the time of world economic crisis, the “Emergency
employment measures” were introduced by the government and implemented at the local level.
Under the temporary budget, cooperation was established between public employment offices and municipalities to support loss of income and accommodation as well as recruitment of the dismissed foreigners.
For foreigners of Japanese descent, special allowance to subsidize their return to Latin American countries was introduced and implemented for the limited time period.
These budget also enabled municipalities to reinforce Japanese language courses for foreigners, training for employment of foreigners as well as supporting foreign children to change from foreigner’s schools to Japanese public schools etc.
Irrespective of requests by municipalities to institutionalize such
systems, some emergency measures are gradually eliminated or totally abolished in the fiscal year 2012.

Selected References ・ Bank of Japan (2012) Short-term Economic Outlook (Tankan) in February 2012
・ Iguchi Y (2012a) “Demographic Causes and Consequences of Asian Migration” paper
presented to the OECD-IDE Roundtable meeting on 17-19 January 2012
・ Iguchi Y (2012b) “Realizing new communities and more comprehensive migration policy
in Japan” Workshop on Migrants’ communities after the Disaster in March 2011, at
Sophia University on 18 February 2012
・ Iguchi Y (2012c) “The present economic crisis and its effects on economic integration as
well as its labor market outcomes in Japan -From comparative perspectives with Europe-
paper presented at Joint Workshop of Kwansei Gakuin University and the University of
Lille 1, on 5, March 2012, at University of Lille 1, France
・ Iguchi Y. (2011a) “What Role Do Low-Skilled Migrants Play in the Japanese Labor
Markets?”paper presented to the Workshop at University of California, San Diego in
September 2011
・Iguchi Y. (2011b) The Economics of Intergenerational Conflicts of Interests , Yachiyo
Shuppan (in Japanese)
・Japan International Training Cooperation Organization( 2011) Yearbook of JITCO 2011
・Seki M. (2011) The Great East Japan Earthquake and Revitalizing Local Industries, Shin
Hyoron (In Japanese)
・Takenaka H and Hunabashi Y. (ed) (2011) The lessons from the Great Disaster in Japan, Toyokeizai Shinpo Sha (In Japanese)
・Teikoku Data Bank (2012) “New Trends in Bankptrupcies” February 2012