changing the energy portfolio? an empirical evaluation of the renewable portfolio standard deborah...
TRANSCRIPT

Changing the Energy Portfolio? An Empirical Evaluation of the Renewable Portfolio Standard
Deborah Baker Brannan, Ph.D. CandidateUniversity of Colorado Boulder
30th USAEE/IAEE North American ConferenceOctober 10, 2011
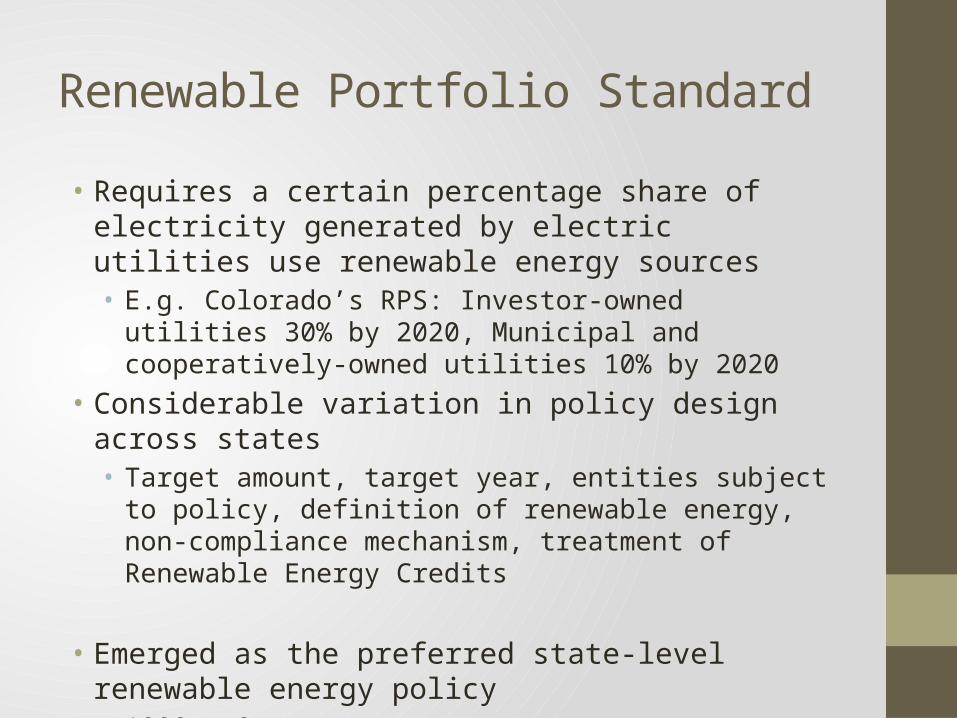
Renewable Portfolio Standard• Requires a certain percentage share of electricity generated
by electric utilities use renewable energy sources• E.g. Colorado’s RPS: Investor-owned utilities 30% by 2020,
Municipal and cooperatively-owned utilities 10% by 2020
• Considerable variation in policy design across states• Target amount, target year, entities subject to policy, definition
of renewable energy, non-compliance mechanism, treatment of Renewable Energy Credits
• Emerged as the preferred state-level renewable energy policy• 1998 – 3 states• 2011 – 29 states, DC (8 goals)

RPS Policies 2011 (DSIRE)

Motivation• RPS Objectives
1. Increase deployment of renewable energy2. Reduce pollution, improve national security, job creation, lower
electricity prices
• Most secondary benefits achieved through fossil fuel displacement• Secondary benefits vary with the type of fossil fuel that is displaced
• Displacement should differ – marginal cost, type of power plant• Ex Ante
• Coal unlikely to be displaced, Natural gas likely to be displaced
• Anecdotal evidence suggests this is not always the case• Natural gas manages intermittency• Limited available supply of natural gas

Research Questions
1. What is the relationship between the adoption of an RPS policy and electricity generation using renewable energy sources?
2. What is the relationship between the adoption of an RPS policy and electricity generation using natural gas? Coal?

Preview of Results• Strong and positive relationship between adoption of an
RPS and renewable generation
• Negative relationship between adoption of an RPS and both natural gas and coal

02
0000
400
006
0000
800
00R
enew
able
Gen
era
tion
, GW
h
1990 1995 2000 2005 2010Year
RPS States Non-RPS States
Renewable Generation
02
0000
400
006
0000
Ren
ewab
le G
ener
atio
n, G
Wh
1990 1995 2000 2005 2010Year
RPS States Non-RPS States
Renewable Generation (without CA)

700
000
800
000
900
000
100
0000
110
0000
Coa
l Ge
nera
tion,
GW
h
1990 1995 2000 2005 2010Year
RPS States Non-RPS States
Coal Generation
100
000
200
000
300
000
400
000
500
000
600
000
Nat
ura
l Ga
s G
ener
atio
n, G
Wh
1990 1995 2000 2005 2010Year
RPS States Non-RPS States
Natural Gas Generation

Difference of Means
RPS States (N=28) Non-RPS States (N=22) Difference Mean Std. Dev. Mean Std. Dev. Mean t-StatisticRenewable 1998 647857.3 650111.8 7369.182 486499.1 640488.1 0.99 2009 2683703 1114212 665559.8 833799.8 2018143 1.81 Natural Gas 1998 14070244 7757762 6240468 5805378 7829777 1.01 2009 21248820 9829285 14818715 7355564 6430105 0.65 Coal 1998 35731592 10382744 39683232 7769734 -3951638 -0.38 2009 34032328 9881143 36499960 7394370 -2467630 -0.25

Utility vs. Independent Power Producer
RPS States (N=28) Non-RPS States (N=22) Difference Mean Std. Dev. Mean Std. Dev. Mean t-StatisticNatural Gas, U 1998 7413738 5174174 4619901 3871997 2793837 0.54 2009 4907211 4587142 9625654 3432702 -4718443 -1.03 Coal, U 1998 34236580 10110503 38584348 7566008 -4347767 -0.43 2009 20505784 7760611 33996828 5807509 -13491045 -1.74 Natural Gas, IPP 1998 837676.6 598843 145563 448133.1 692113.6 1.16 2009 10793678 4036937 3242298 3020967 7551380 1.87 Coal, IPP 1998 344730.7 274858.6 267575.1 205685.3 77155.63 0.28 2009 12624900 5807984 1649363 4346297 10975538 1.89

Empirical Approach
Git is electricity generation
Mit are electricity market characteristics
Eit are political and environmental attitudes
Sit are socioeconomic characteristics
αi are state fixed effects, and γt are year fixed effects
• Specifications vary with type of energy resource• Renewable Energy (wind, solar, geothermal)• Natural Gas• Coal
ln(Git) = αi + γt + RPSβ it + Mμ it + Eθ it + Sδ it + εit

Endogeneity• Model assumes the RPS policy is exogenous• Ideal solution is an instrumental variable approach
• Unable to identify an instrument that is valid and excludable
• Assume the RPS policy is exogenous• Factors affecting the adoption of an RPS (Chandler 2009, Lyon
and Yin 2008, Huang et al. 2007)• State and year fixed effects• RPS policy variable is constructed as a binary variable

Data• Panel data
• 1998-2009, 50 states
• Data Sources• Electricity data
• Energy Information Administration (EIA)• RPS data
• Database of State Incentives for Renewables and Efficiency (DSIRE)• Electricity market characteristics
• EIA, Census• Political and environmental attitudes
• DSIRE, Conservative Ideology (Poole and Rosenthal), Environmental Protection Agency
• Socioeconomic factors• Bureau of Economic Analysis, Census

Renewable Energy Result
• Positive relationship between an RPS and electricity generated using renewable energy sources.
(1) (2) (3)RPS 1.941 1.885 2.309 (3.97)*** (3.82)*** (4.51)***Electricity Market Yes Yes YesSocioeconomic Yes YesEnvironmental and Political YesState, Year Fixed Effects Yes Yes YesObservations 600 600 600

Utility vs. Independent Power Producer
• Renewable generation primarily driven by IPPs• Evidence that utilities are owning and operating renewable
generation facilities
(1) (2) Utilities IPPRPS 0.889 1.736 (1.90)* (3.15)***Electricity Market Yes YesSocioeconomic Yes YesEnvironmental and Political Yes YesState, Year Fixed Effects Yes YesObservations 600 600

Renewable Energy Credits
• Implications for both primary and secondary objectives• E.g. Out-of-state REC purchases
• Important policy feature BUT no data
• Proxy for the size of the REC market • Percent of neighbors with an RPS• Wind development of other states in REC market (Bird et al.
2010)• Installed wind capacity as a percent of potential wind capacity

REC Market
• Expect states with an RPS generate less renewable energy in a growing REC market
• Empirical evidence suggests otherwise• Policy features to support in-state generation
(1) (2) (3) (4) Utilities IPPRPS 0.889 0.394 0.278 1.736 2.273 1.638 (1.90)* (0.75) (0.55) (3.15)*** (3.46)*** (2.77)***Prcnt Nghb with RPS, Lag -1.864 3.947 (1.98)** (2.81)*** RPSxPrcnt Nghb 1.692 -1.704 (1.73)* (1.20) Wind Development, Lag -1.216 -0.597 (4.12)*** (0.84)RPSxWind Development 1.038 0.031 (2.77)*** (0.04)Electricity Market Yes Yes Yes YesSocioeconomic Yes Yes Yes YesEnvironmental and Political Yes Yes Yes YesState, Year Fixed Effects Yes Yes Yes YesObservations 600 600 600 600
Natural Gas and Coal
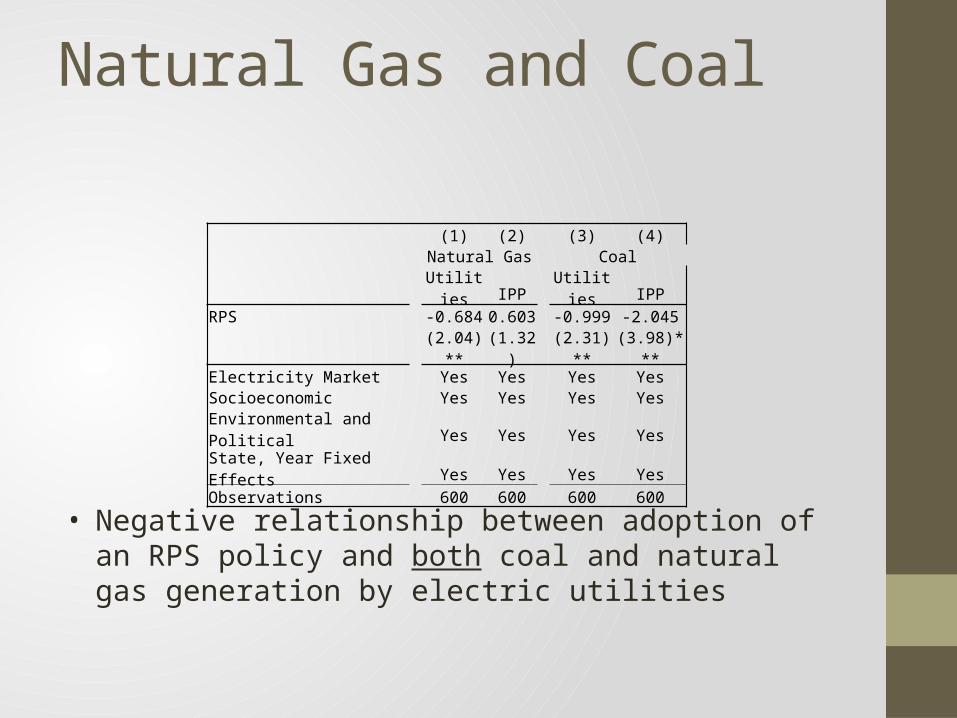
• Negative relationship between adoption of an RPS policy and both coal and natural gas generation by electric utilities
(1) (2) (3) (4) Natural Gas Coal Utilities IPP Utilities IPPRPS -0.684 0.603 -0.999 -2.045 (2.04)** (1.32) (2.31)** (3.98)***Electricity Market Yes Yes Yes YesSocioeconomic Yes Yes Yes YesEnvironmental and Political Yes Yes Yes YesState, Year Fixed Effects Yes Yes Yes YesObservations 600 600 600 600

Conclusions
• A positive relationship between RPS policy adoption and renewable generation, driven primarily by IPPs, persistent even in a growing REC market
• Evidence of coal and natural gas displacement
• Fossil fuel displacement will be state-specific and vary with the composition of energy portfolio, energy prices.• Research on displacement in particular RTO’s (e.g. Cullen
2011, Novan 2011)
• Inform policy makers on potential to achieve secondary benefits

Questions? Comments?
Contact Information:Deborah Baker Brannan