changing tides? what can transportation tell us about the ... · changing tides? what can...
TRANSCRIPT

Changing Tides? What Can Transportation Tell Us About the
Economy?
Kristen Monaco
Professor of Economics
California State University Long Beach
Presented to the Association of Government Accountants, LA Chapter
Outline of Talk
• Where Are We Now?
• Where Are We Headed?
• What Can Trade and Transportation Data Tell Us?

10000
10500
11000
11500
12000
12500
13000
13500
14000
00
I
00
II
00
III
00
IV
01
I
01
II
01
III
01
IV
02
I
02
II
02
III
02
IV
03
I
03
II
03
III
03
IV 04
I
04
II
04
IIII
04
IV 05
I
05
II
05
III
05
IV 06
I
06
II
06
III
06
IV 07
I
07
II
07
III
07
IV 08
I
08
II
08
III
08
IV 09
I
09
II
09
III
09
IV
10
I
10
II
10
III
10
IV 11
I
11
II
US GDP in Billions of 2000 Dollars (2000-2011)
unrevised
revised
Source: BEA
2
4
6
8
10
12
14
Jan
-90
Sep
-90
May
-91
Jan
-92
Sep
-92
May
-93
Jan
-94
Sep
-94
May
-95
Jan
-96
Sep
-96
May
-97
Jan
-98
Sep
-98
May
-99
Jan
-00
Sep
-00
May
-01
Jan
-02
Sep
-02
May
-03
Jan
-04
Sep
-04
May
-05
Jan
-06
Sep
-06
May
-07
Jan
-08
Sep
-08
May
-09
Jan
-10
Sep
-10
May
-11
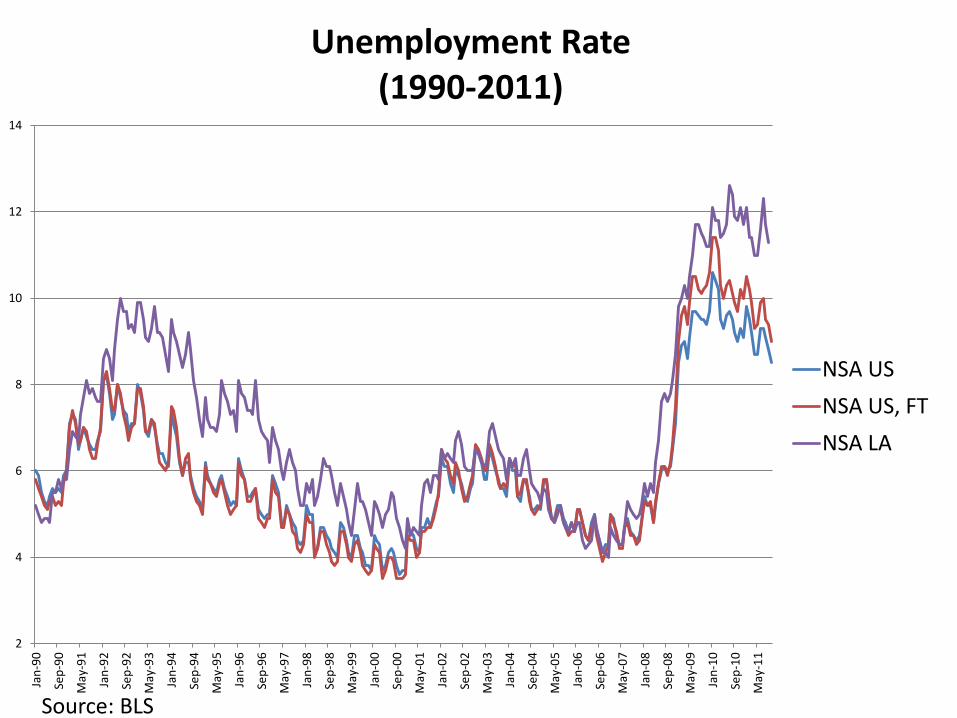
Unemployment Rate (1990-2011)
NSA US
NSA US, FT
NSA LA
Source: BLS

0
100
200
300
400
500
600
700
0
1
2
3
4
5
6
7
2006-Jan-07 2007-Jan-07 2008-Jan-07 2009-Jan-07 2010-Jan-07 2011-Jan-07
Tho
usa
nd
s
Mill
ion
s Unemployment Insurance Claims, US
(2007-2011)
Initial Claims Continued Claims
Source: Dept of Labor

0
20
40
60
80
100
120
140
0
100
200
300
400
500
600
700
800
900
1,000
1/6
/20
07
3/6
/20
07
5/6
/20
07
7/6
/20
07
9/6
/20
07
11
/6/2
00
7
1/6
/20
08
3/6
/20
08
5/6
/20
08
7/6
/20
08
9/6
/20
08
11
/6/2
00
8
1/6
/20
09
3/6
/20
09
5/6
/20
09
7/6
/20
09
9/6
/20
09
11
/6/2
00
9
1/6
/20
10
3/6
/20
10
5/6
/20
10
7/6
/20
10
9/6
/20
10
11
/6/2
01
0
1/6
/20
11
3/6
/20
11
5/6
/20
11
7/6
/20
11
9/6
/20
11
Tho
usa
nd
s
Tho
usa
nd
s Unemployment Insurance Claims, CA
(2007-2011)
Initial Claims Continued Claims
Source: Dept of Labor

200
400
600
800
1000
1200
1400
1600
Jan
-01
Ap
r-0
1
Jul-
01
Oct
-01
Jan
-02
Ap
r-0
2
Jul-
02
Oct
-02
Jan
-03
Ap
r-0
3
Jul-
03
Oct
-03
Jan
-04
Ap
r-0
4
Jul-
04
Oct
-04
Jan
-05
Ap
r-0
5
Jul-
05
Oct
-05
Jan
-06
Ap
r-0
6
Jul-
06
Oct
-06
Jan
-07
Ap
r-0
7
Jul-
07
Oct
-07
Jan
-08
Ap
r-0
8
Jul-
08
Oct
-08
Jan
-09
Ap
r-0
9
Jul-
09
Oct
-09
Jan
-10
Ap
r-1
0
Jul-
10
Oct
-10
Jan
-11
Ap
r-1
1
Jul-
11
Monthly Job Separations by Type (West Region, Nonfarm, thousands, 2001-2011)
New Hires
Layoffs&Discharges
Quits
Source: Dept of Labor, JOLTS data

0.0
10.0
20.0
30.0
40.0
50.0
60.0
70.0
80.0
90.0
100.0
Jan
-90
Au
g-9
0
Mar
-91
Oct
-91
May
-92
De
c-9
2
Jul-
93
Feb
-94
Sep
-94
Ap
r-9
5
No
v-9
5
Jun
-96
Jan
-97
Au
g-9
7
Mar
-98
Oct
-98
May
-99
De
c-9
9
Jul-
00
Feb
-01
Sep
-01
Ap
r-0
2
No
v-0
2
Jun
-03
Jan
-04
Au
g-0
4
Mar
-05
Oct
-05
May
-06
De
c-0
6
Jul-
07
Feb
-08
Sep
-08
Ap
r-0
9
No
v-0
9
Jun
-10
Jan
-11
Au
g-1
1
Unemployment by Duration, US (1990-2011)
27 weeks and Over
15-26 weeks
5-14 weeks
Less Than 5 Weeks
Source: CPS

-600
-400
-200
0
200
400
600
400
200
200
400
Jan-05 May-05 Sep-05 Jan-06 May-06 Sep-06 Jan-07 May-07 Sep-07 Jan-08 May-08 Sep-08 Jan-09 May-09 Sep-09 Jan-10 May-10 Sep-10 Jan-11
Change In Employment by Sector, US (2005-2011)
Goods Producing Service
Source: Current Employment Statistics

150.00
160.00
170.00
180.00
190.00
200.00
210.00
220.00
230.00
240.00
Jan
-00
May
-00
Sep
-00
Jan
-01
May
-01
Sep
-01
Jan
-02
May
-02
Sep
-02
Jan
-03
May
-03
Sep
-03
Jan
-04
May
-04
Sep
-04
Jan
-05
May
-05
Sep
-05
Jan
-06
May
-06
Sep
-06
Jan
-07
May
-07
Sep
-07
Jan
-08
May
-08
Sep
-08
Jan
-09
May
-09
Sep
-09
Jan
-10
May
-10
Sep
-10
Jan
-11
May
-11
Sep
-11
CPI-U (2000-2011)
All Items
All Items, Less Food, Shelter, and Energy
Source: BLS

0
1
2
3
4
5
6
7
8
9
10
20
00
-Jan
20
00
-May
20
00
-Sep
20
01
-Jan
20
01
-May
20
01
-Sep
20
02
-Jan
20
02
-May
20
02
-Sep
20
03
-Jan
20
03
-May
20
03
-Sep
20
04
-Jan
20
04
-May
20
04
-Sep
20
05
-Jan
20
05
-May
20
05
-Sep
20
06
-Jan
20
06
-May
20
06
-Sep
20
07
-Jan
20
07
-May
20
07
-Sep
20
08
-Jan
20
08
-May
20
08
-Sep
20
09
-Jan
20
09
-May
20
09
-Sep
20
10
-Jan
20
10
-May
20
10
-Sep
20
11
-Jan
20
11
-May
20
11
-Sep
Short Term Interest Rates (2000-2011)
Federal Funds (Effective)
Bank Prime Loan Rate
Source: FRED

0
1
2
3
4
5
6
7
8
9
20
00
-Jan
20
00
-May
20
00
-Sep
20
01
-Jan
20
01
-May
20
01
-Sep
20
02
-Jan
20
02
-May
20
02
-Sep
20
03
-Jan
20
03
-May
20
03
-Sep
20
04
-Jan
20
04
-May
20
04
-Sep
20
05
-Jan
20
05
-May
20
05
-Sep
20
06
-Jan
20
06
-May
20
06
-Sep
20
07
-Jan
20
07
-May
20
07
-Sep
20
08
-Jan
20
08
-May
20
08
-Sep
20
09
-Jan
20
09
-May
20
09
-Sep
20
10
-Jan
20
10
-May
20
10
-Sep
20
11
-Jan
20
11
-May
20
11
-Sep
Long Term Interest Rates (2000-2011)
10 Year Treasury
30 Year Fixed Mortgage
Source: FRED

Where are We Headed?

-8%
-6%
-4%
-2%
0%
2%
4%
6%
Contributors to Change in Real GDI (Y-Y, 2006-2011)
Corporate Profits
Net Interest&MiscPayments
Proprietor Income&RentalIncome
Taxes on Production andImports&Cons of FixedCapital
Compensation
HT: The Wilder View, Source: BEA

-30
-20
-10
0
10
20
30
Trends in Consumption: Pct Change from Prior Q (2005-2011)
Durables
Nondurables
Services
Source: BEA

-40
-30
-20
-10
0
10
20
30
40
Trends in Investment: Pct Change from Prior Q (2005-2011)
Structures
Equipment
Residential
Source: BEA

0
20
40
60
80
100
120
Jan
-00
May
-00
Sep
-00
Jan
-01
May
-01
Sep
-01
Jan
-02
May
-02
Sep
-02
Jan
-03
May
-03
Sep
-03
Jan
-04
May
-04
Sep
-04
Jan
-05
May
-05
Sep
-05
Jan
-06
May
-06
Sep
-06
Jan
-07
May
-07
Sep
-07
Jan
-08
May
-08
Sep
-08
Jan
-09
May
-09
Sep
-09
Jan
-10
May
-10
Sep
-10
Jan
-11
Consumer Sentiment, US (2000-2011)
Source: University of Michigan

20.0
25.0
30.0
35.0
40.0
45.0
50.0
55.0
60.0
65.0
Jan
-90
Au
g-9
0
Mar
-91
Oct
-91
May
-92
De
c-9
2
Jul-
93
Feb
-94
Sep
-94
Ap
r-9
5
No
v-9
5
Jun
-96
Jan
-97
Au
g-9
7
Mar
-98
Oct
-98
May
-99
De
c-9
9
Jul-
00
Feb
-01
Sep
-01
Ap
r-0
2
No
v-0
2
Jun
-03
Jan
-04
Au
g-0
4
Mar
-05
Oct
-05
May
-06
De
c-0
6
Jul-
07
Feb
-08
Sep
-08
Ap
r-0
9
No
v-0
9
Jun
-10
Jan
-11
Au
g-1
1
PMI (1990-2011)
Source: ISM

1
1.1
1.2
1.3
1.4
1.5
1.6
1.7
Jan
-00
Jun
-00
No
v-0
0
Ap
r-0
1
Sep
-01
Feb
-02
Jul-
02
De
c-0
2
May
-03
Oct
-03
Mar
-04
Au
g-0
4
Jan
-05
Jun
-05
No
v-0
5
Ap
r-0
6
Sep
-06
Feb
-07
Jul-
07
De
c-0
7
May
-08
Oct
-08
Mar
-09
Au
g-0
9
Jan
-10
Jun
-10
No
v-1
0
Ap
r-1
1
Sep
-11
Inventory to Sales Ratio (2000-2011)
All Business
Manufacturers
Retailers
Wholesalers
Source: US Census
50.00
100.00
150.00
200.00
250.00
300.00
Jan
uar
y 2
00
0
May
20
00
Sep
tem
be
r 2
00
0
Jan
uar
y 2
00
1
May
20
01
Sep
tem
be
r 2
00
1
Jan
uar
y 2
00
2
May
20
02
Sep
tem
be
r 2
00
2
Jan
uar
y 2
00
3
May
20
03
Sep
tem
be
r 2
00
3
Jan
uar
y 2
00
4
May
20
04
Sep
tem
be
r 2
00
4
Jan
uar
y 2
00
5
May
20
05
Sep
tem
be
r 2
00
5
Jan
uar
y 2
00
6
May
20
06
Sep
tem
be
r 2
00
6
Jan
uar
y 2
00
7
May
20
07
Sep
tem
be
r 2
00
7
Jan
uar
y 2
00
8
May
20
08
Sep
tem
be
r 2
00
8
Jan
uar
y 2
00
9
May
20
09
Sep
tem
be
r 2
00
9
Jan
uar
y 2
01
0
May
20
10
Sep
tem
be
r 2
01
0
Jan
uar
y 2
01
1
May
20
11
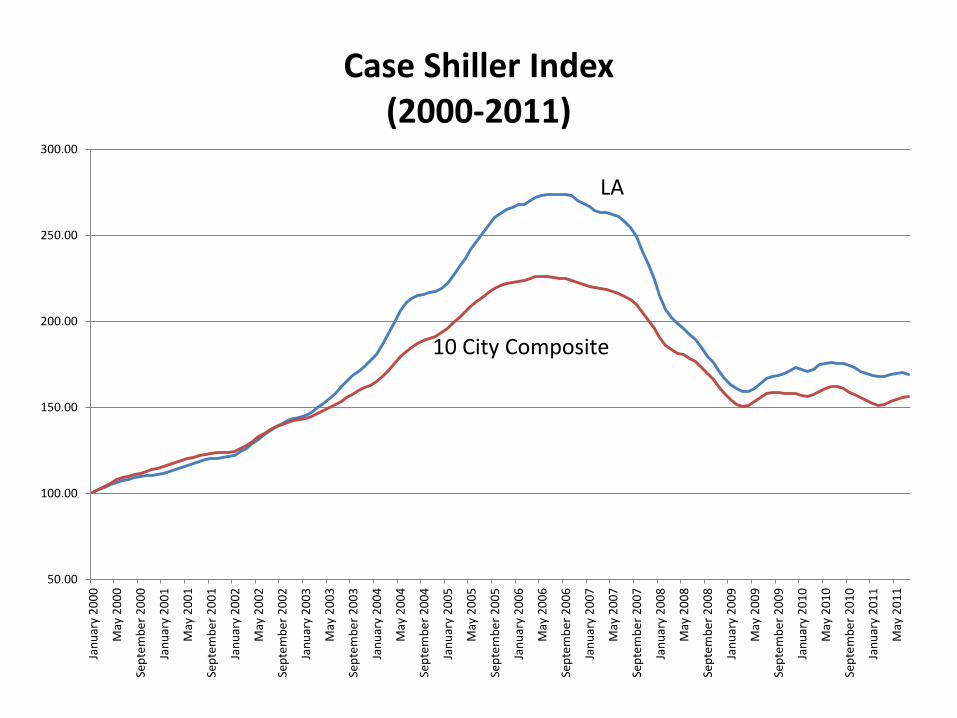
Case Shiller Index (2000-2011)
LA
10 City Composite

0
500
1,000
1,500
2,000
2,500
Jan
-00
May
-00
Sep
-00
Jan
-01
May
-01
Sep
-01
Jan
-02
May
-02
Sep
-02
Jan
-03
May
-03
Sep
-03
Jan
-04
May
-04
Sep
-04
Jan
-05
May
-05
Sep
-05
Jan
-06
May
-06
Sep
-06
Jan
-07
May
-07
Sep
-07
Jan
-08
May
-08
Sep
-08
Jan
-09
May
-09
Sep
-09
Jan
-10
May
-10
Sep
-10
Jan
-11
May
-11
Sep
-11
New residential Construction (in thousands, 2000-2011)
US
West Region

What Can Trade and Transportation Data Tell Us?

0.4
0.45
0.5
0.55
0.6
0.65
0.7
0.75
0.8
0.85
0.9
2005-Jan-03 2006-Jan-03 2007-Jan-03 2008-Jan-03 2009-Jan-03 2010-Jan-03 2011-Jan-03
Euros per US Dollar (2005-2011)

5
5.5
6
6.5
7
7.5
8
8.5
2005-Jan-03 2006-Jan-03 2007-Jan-03 2008-Jan-03 2009-Jan-03 2010-Jan-03 2011-Jan-03
Yuan per US Dollar (2005-2011)

$4
$6
$8
$10
$12
$14
A '09 S O N D J '10 F M A M J J A S O N D J '11 F M A M J J A
Bill
ion
s o
f U
S D
olla
rs
US Agricultural Imports and Exports (2009-2011)
U.S. Exports U.S. Imports
HT: Journal of Commerce

$50
$70
$90
$110
$130
$150
A '09 S O N D J '10 F M A M J J A S O N D J '11 F M A M J J A
Bill
ions o
f U
S D
olla
rs
US Manufacturing Imports and Exports (2009-2011)
U.S. Exports U.S. Imports
HT: Journal of Commerce

0.0
100.0
200.0
300.0
400.0
500.0
600.0
700.0
800.0
Jan
-95
Jun
-95
No
v-9
5
Ap
r-9
6
Sep
-96
Feb
-97
Jul-
97
De
c-9
7
May
-98
Oct
-98
Mar
-99
Au
g-9
9
Jan
-00
Jun
-00
No
v-0
0
Ap
r-0
1
Sep
-01
Feb
-02
Jul-
02
De
c-0
2
May
-03
Oct
-03
Mar
-04
Au
g-0
4
Jan
-05
Jun
-05
No
v-0
5
Ap
r-0
6
Sep
-06
Feb
-07
Jul-
07
De
c-0
7
May
-08
Oct
-08
Mar
-09
Au
g-0
9
Jan
-10
Jun
-10
No
v-1
0
Ap
r-1
1
Sep
-11
Tho
usa
nd
s San Pedro Bay Container Traffic
(1995-2011)
Loaded In Loaded Out

-30.0%
-20.0%
-10.0%
0.0%
10.0%
20.0%
30.0%
40.0%
50.0%
Jan
-06
Mar
-06
May
-06
Jul-
06
Sep
-06
No
v-0
6
Jan
-07
Mar
-07
May
-07
Jul-
07
Sep
-07
No
v-0
7
Jan
-08
Mar
-08
May
-08
Jul-
08
Sep
-08
No
v-0
8
Jan
-09
Mar
-09
May
-09
Jul-
09
Sep
-09
No
v-0
9
Jan
-10
Mar
-10
May
-10
Jul-
10
Sep
-10
No
v-1
0
Jan
-11
Mar
-11
May
-11
Jul-
11
Sep
-11
Year-Over-Year Changes, SPB Ports (2006-2011)
Inbound Outbound

10%
15%
20%
25%
30%
35%
250,000
300,000
350,000
400,000
450,000
500,000
550,000
J 09 A S O N D J 10 F M A M J J A S O N D J 11 F M A M J J
RAIL CAR STORAGE (2009 – 2011)
Freight cars in storage Percent share of total fleet
HT: Journal of Commerce

-10%
0%
10%
20%
30%
40%
J '10 A S O N D J '11 F M A M J J
Year-Over-Year Changes in Intermodal Traffic (2010-2011)
Domestic International
HT: Journal of Commerce

90
95
100
105
110
115
S '09 O N D J '10 F M A M J J A S O N D J '10 F M A M J J A S
Cass Truckload Linehaul Index (2009-2011)
HT: Journal of Commerce

Summary
• Sluggish labor market
– Not adding jobs in a way that indicates solid recovery
– Firms are sitting on profits
• Transportation Indicators Mixed
– Trucking/rail show signs of nearing capacity
– Ocean is mixed – numbers are volatile and imports on different trajectory than pre-recession
• Spot rates are low however, which may bode well

80
85
90
95
100
105
110
Jan
-20
05
Mar
-20
05
May
-20
05
Jul-
20
05
Sep
-20
05
No
v-2
00
5
Jan
-20
06
Mar
-20
06
May
-20
06
Jul-
20
06
Sep
-20
06
No
v-2
00
6
Jan
-20
07
Mar
-20
07
May
-20
07
Jul-
20
07
Sep
-20
07
No
v-2
00
7
Jan
-20
08
Mar
-20
08
May
-20
08
Jul-
20
08
Sep
-20
08
No
v-2
00
8
Jan
-20
09
Mar
-20
09
May
-20
09
Jul-
20
09
Sep
-20
09
No
v-2
00
9
Jan
-20
10
Mar
-20
10
May
-20
10
Jul-
20
10
Sep
-20
10
No
v-2
01
0
Jan
-20
11
Mar
-20
11
May
-20
11
Jul-
20
11
Sep
-20
11
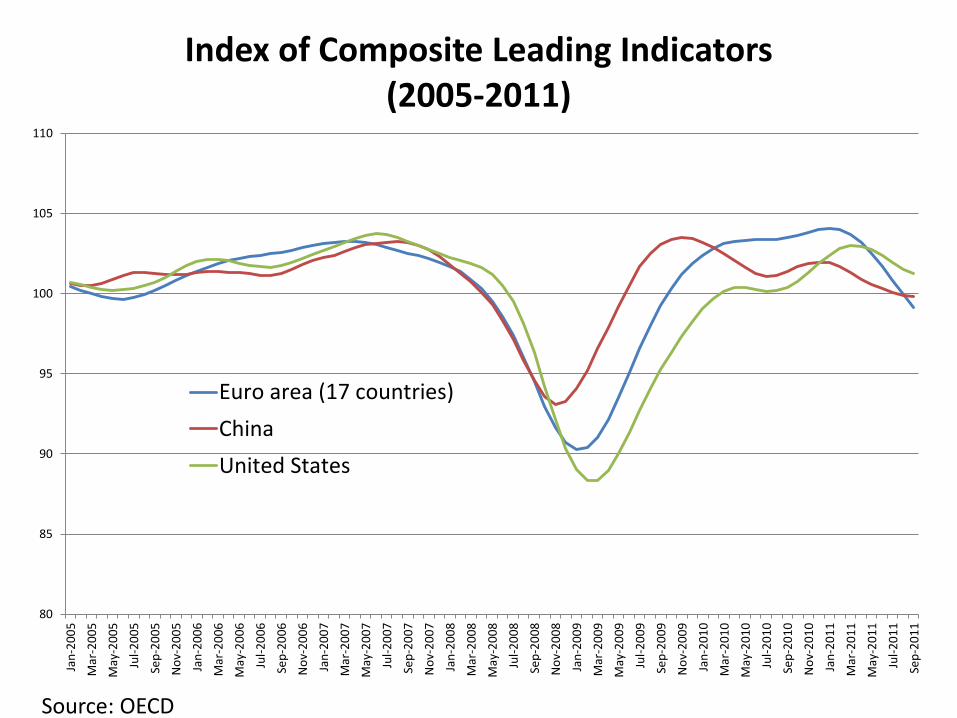
Index of Composite Leading Indicators (2005-2011)
Euro area (17 countries)
China
United States
Source: OECD

Country Latest yield
(11/16/2011)
Austria 3.62%
Belgium 4.89%
Canada 2.13%
Denmark 1.97%
Finland 2.52%
France 3.65%
Germany 1.82%
Greece 32.86%
Ireland 8.21%
Italy 7.01%
Netherlands 2.44%
New Zealand 3.92%
Portugal 11.44%
Spain 6.40%
Sweden 1.64%
Switzerland 0.87%
UK 2.14%
US 2.02%
Ten Year Government Bond Yields

Thanks for Your Time. Questions?
http://www.economonitor.com/
www.joc.com
www.csulb.edu/economics