changing wheels of fortune building a new player base
Post on 21-Dec-2015
214 views
TRANSCRIPT

Changing Wheels of Fortune Building a New Player Base
2
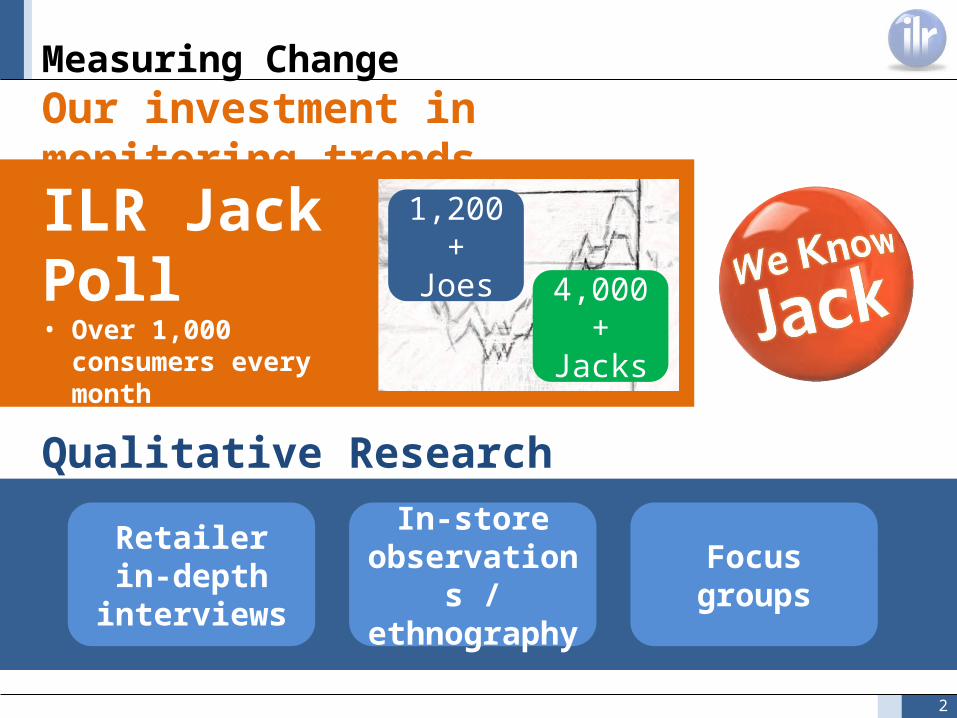
Measuring Change
Our investment in monitoring trends
ILR Jack Poll• Over 1,000 consumers
every month• Over 5,000 lottery players
surveyed this year alone
1,200+ Joes
4,000+ Jacks
Qualitative Research
Retailerin-depth
interviews
In-store observations / ethnography
Focus groups

25 ILR Jack Update Newsletters since October 2005
ILR Media Slide
Published more than 20 articles of actionable data for the industry
Interviewed for numerous national and local newspapers,
radio & TV stations

What’s Up With Joe and Jack?

5
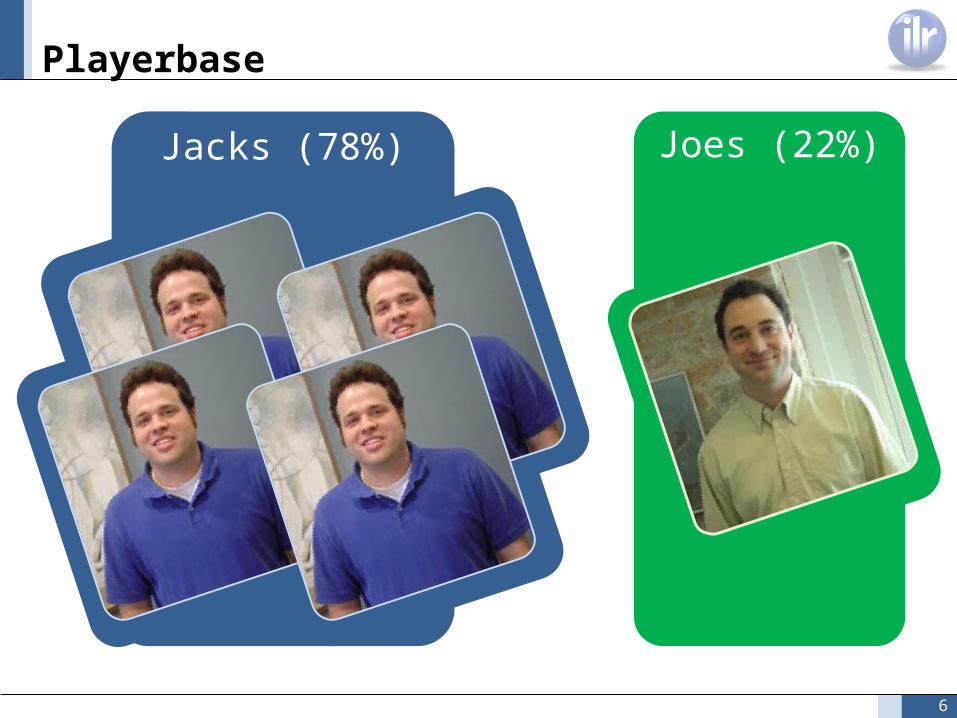
Playerbase• ILR developed the Joe and Jack classification to bring greater clarity to the definition of a
“Lottery Player” for the Industry
The question is, how do we get more Jacks to
play?
Plays 5 Times As Often As Jack
JackJoe
Spends Roughly The Sameas Joe When He Does Play
6
Playerbase
Joes (22%)Jacks (78%)

7
Playerbase
Joes; 14%
Jacks; 50%
Never Played;
33%
Percent of All Consumers (age 18+) in Lottery States

• In a hypothetical large population state, getting just 5% of Jacks to play Mega Millions or
Powerball at $5 a week (average spend) could generate an additional $90M in sales each year while getting 5% of Joes to spend $5 more a week only generates an additional $27M
Growth Potential
$5 More Per Joe
$5 More Per Jack
Contribution to Sales if 5% of Group Played $5 More on Multistate Games Per Week
$90M
$27M
$0M $20M $40M $60M $80M $100M
8

The Impact of the Recession on Joe and Jack

Household Financial Situation Worse than Last Year
Sep '07
Oct Nov Dec Jan '08
Feb Mar Apr May
Jun Jul Aug Sep Oct Nov Dec Jan '09
Feb Mar Apr May
Jun Jul Aug Sep
33%32%
37%35%35%
38%37%
41%
49%
45%
42%
47%46%
51%
61%
56%
52%
58%59%
56%54%
55%57%
55%56%
10

Trend Over Last 3 Decades• Last major recession in the U.S. in the late 70’s
– Gas lines– 17% interest rates
Jan '77 Oct '78 Jul '80 Apr '82 Jan '84 Oct '85 Jul '87 Apr '89 Jan '91 Oct '92 Jul '94 Apr '96 Jan '98 Oct '99 Jul '01 Apr '03 Jan '05 Oct '06 Jul '080
10
20
30
40
50
60
70
80
Easier Harder Same
11

Q306 Q406 Q107 Q207 Q307 Q407 Q108 Q208 Q308 Q408 Q109 Q2090%
10%
20%
30%
40%
50%
60%
22%24%
15%
22% 23% 23% 23%
30%
27%29%
45%
53%
21%
18% 18%20% 21%
23%
26% 26%
30%
35%
43%45%
15%
18% 17% 16%
21%23%
21%
27%25%
29%
37% 36%
Income Decreased in Past Year
Joes Jacks Never Played
Income Levels
*Not asked in Q206 12
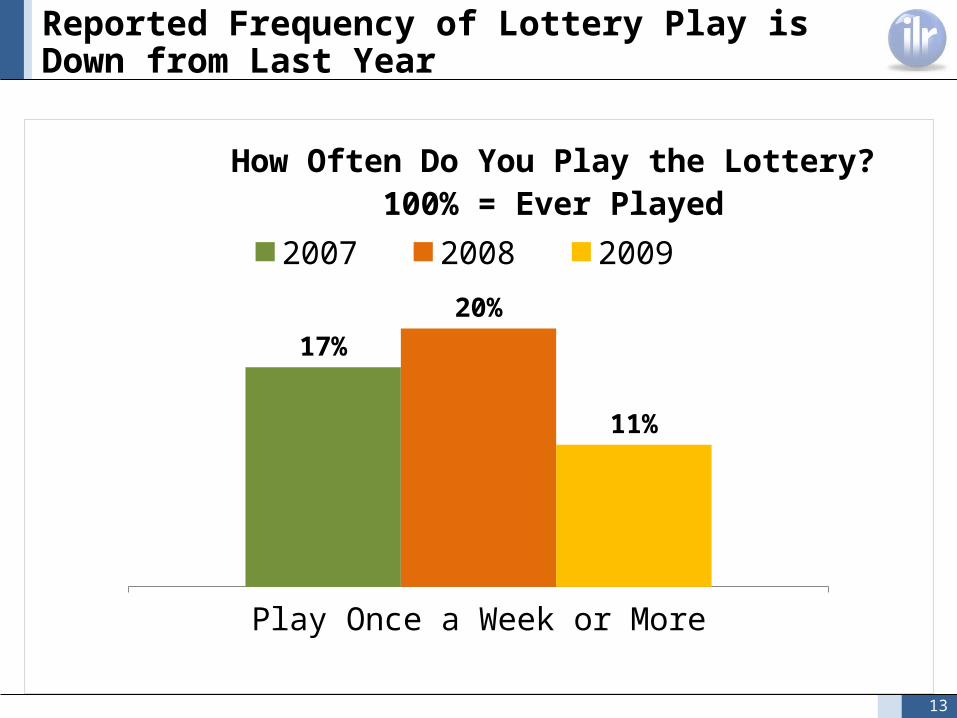
Reported Frequency of Lottery Play is Down from Last Year
Play Once a Week or More
17%20%
11%
How Often Do You Play the Lottery?100% = Ever Played
2007 2008 2009
13

One Third Are Playing Less, but 8% Playing More in Recession
Playing More8%
Playing Same61%
Playing Less31%
Lottery Play Currently vs. a Year Ago(100% = Ever played lottery)
14

It’s Not Just The Economy, Stupid
Harder to Pay Bills Cutting Back on Standard of Living
Have Less Than Enough to Live Comfortably
69%75%
55%57% 57%
39%
72% 75%
55%
Playing More Playing Same Playing Less
15

The Optimism Gap
Better Worse0%
10%
20%
30%
40%
50%
60%
51%
22%
Playing More
Expect Household Finances Next Year to be Better / Worse
Better Worse
-10%
0%
10%
20%
30%
40%
50%
60%
40%
32%
Playing Less
29%
8%16

Those Playing More Skew Younger
18-24 25-34 35-49 50-64 65+
21%
14%10%
6%3%
50%55%
59%64% 64%
30% 31% 31% 30%33%
Past-Year Change in Lottery Play by Age Group
Playing More Playing Same Playing Less
17

The Next Generation
19
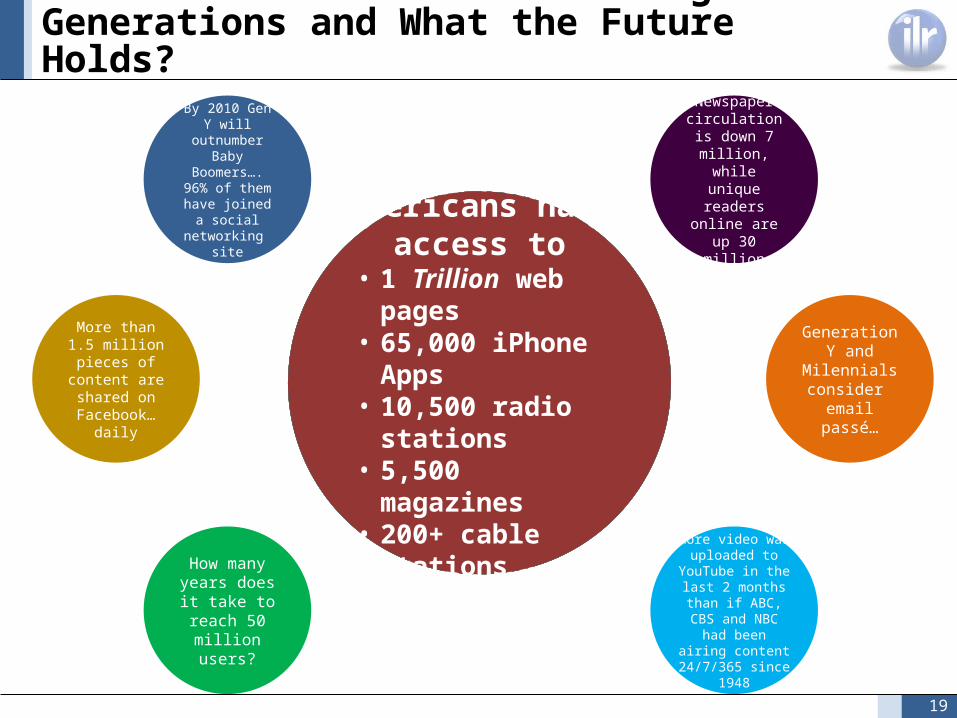
So What Do We Know About Younger Generations and What the Future Holds?
By 2010 Gen Y will outnumber
Baby Boomers….96% of them have
joined a social network
By 2010 Gen Y will outnumber
Baby Boomers….96% of them have
joined a social networking site
Generation Y and Z consider e-mail
passé…
Generation Y and Milennials consider email
passé…
How many years does it take to reach
50 million users?Radio (38 Years)
TV (13 Years)Internet (4 Years)
iPod (3 Years)Facebook 100M users (>9 months)
iPhone apps: 1B downloads(9 months)
Newspaper circulation is down
7 million, while unique readers
online are up 30 million
How many years does it take to reach
50 million users?
Newspaper circulation is
down 7 million, while unique
readers online are up 30
million
More than1.5 million pieces
of content areshared on
Facebook…daily
More than1.5 million pieces of
content areshared on
Facebook…daily
More video was uploaded to
YouTube in the last 2 months than if
ABC, CBS and NBC had been airing
content 24/7/365 since 1948
More video was uploaded to YouTube in the last 2 months than if ABC, CBS and NBC had been airing
content 24/7/365 since 1948
Americans have access to
• 1 Trillion web pages• 65,000 iPhone Apps• 10,500 radio stations• 5,500 magazines• 200+ cable stations
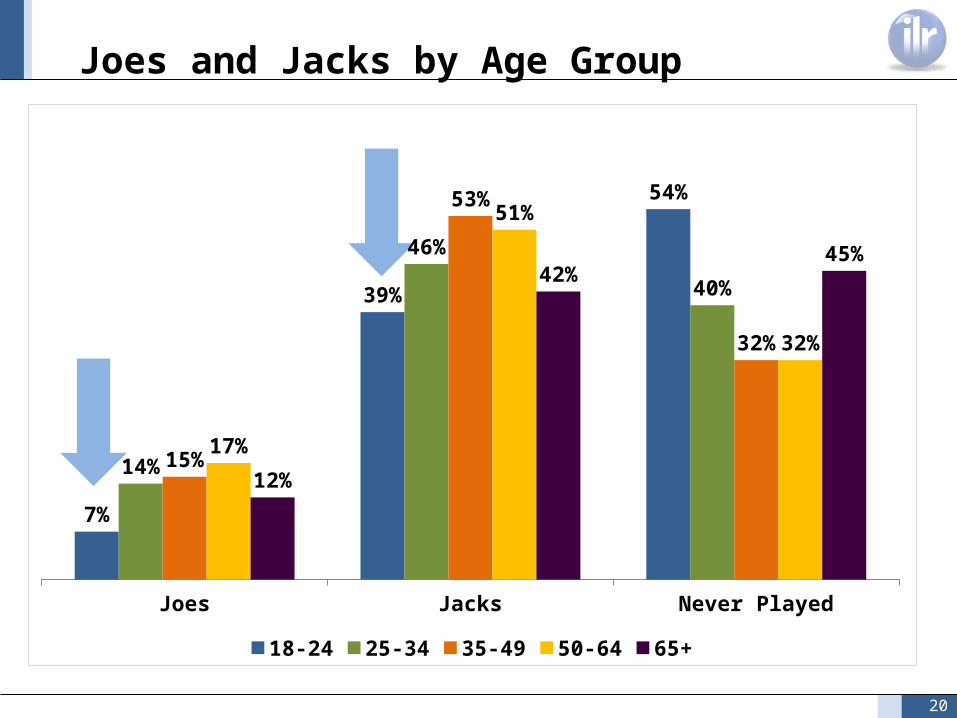
Joes Jacks Never Played
7%
39%
54%
14%
46%
40%
15%
53%
32%
17%
51%
32%
12%
42%45%
18-24 25-34 35-49 50-64 65+
Joes and Jacks by Age Group
20

Different Prizes Appeal to Younger Players
New or Used Car Furniture Major Appliance Computer
40%
37%
22%
25%
33%
29%
17%
20%
28%
23%
14%
17%
22%
16%
11%
15%13%
10%8%
5%
Major Purchases Considered by Age Group
18-24 25-34 35-49 50-64 65+
21

22Young Adults 18-34 Older Adults 35 +
Instant Tickets Preferred by Age(Source: Oklahoma Lottery Game Plan Studies)

23
Different Media are Relevant to Younger Players
Any Social Network Site Facebook MySpace
54%
42%
32%
56%
44%
30%
37%
30%
14%
22%
16%
6%
16%
11%
2%
Active in Social Network Sites by Age Group
18-24 25-34 35-49 50-64 65+

The “Millennial Generation” is Satisfied with Less Income
Median Household Income (thousands)
Age 18-27$26,900
Age 28+$52,000
Have enough income to live comfortably
Age 18-2753%
Age 28+54%
SOURCE: National Poll, April 2009 (N =1,000) and Millennials Survey, April 2009 (N = 400)24

“Millennials” Place Greater Value on Corporate Responsibility
Age 18-2779%
Age 28+64%
Extremely or Very Important to Work for a Socially Responsible Company
SOURCE: National Poll, April 2009 (N =1,000) and Millennials Survey, April 2009 (N = 400)25

“Millennials” Feel Less Affected by Financial Crisis
Hurt by Current Financial Crisis Have Money Invested in Stock Market
Age 18-2738%
Age 18-2722%
Age 28+49%
Age 28+44%
SOURCE: National Poll, April 2009 (N =1,000) and Millennials Survey, April 2009 (N = 400)26

27
As a Result…It’s Beginning to Look a Lot Like Christmas
Under 35 35 - 54 55+0%
5%
10%
15%
20%
25%
30%27%
23%
15%
Plan to Buy Lottery Tickets As Gifts This Christmas
Family
Friend
Coworker
0%10%
20%30%
40%50%
60%70%
80%90%
100%
74%
31%
26%
70%
24%
20%
87%
29%
12%
Giving to…
55+ 35 - 54 Under 35% Yes

Making Research Actionable: What Does This All Mean for Lottery Brands?

29
Is Your Brand Relevant to aNew Generation of Players?
Is it even understood?
30
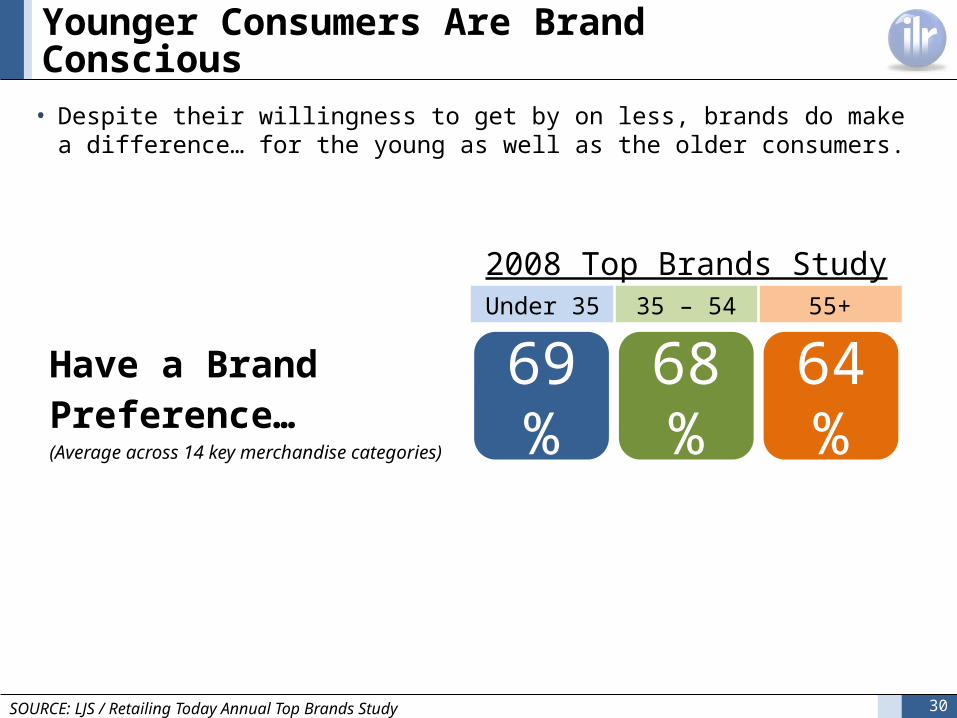
Younger Consumers Are Brand Conscious• Despite their willingness to get by on less, brands do make a difference… for the young
as well as the older consumers.
SOURCE: LJS / Retailing Today Annual Top Brands Study
2008 Top Brands StudyUnder 35 35 – 54 55+
Have a Brand Preference…(Average across 14 key merchandise categories) 69% 68% 64%

31
But Some Brands Do a Better JobWith Younger Consumers
Beverages (89%)*Under
35 35-54 55+
Coke 24 34 29
Pepsi 10 17 25
Juicy Juice 13 2 --
Sprite 7 1 1
HABA (89%)*Under
35 35-54 55+
Dove 15 7 7
Revlon 10 -- 3
Crest 2 11 6
Colgate 2 4 12
Suave 7 18 8
Candy (80%)*Under
35 35-54 55+
Snickers 33 14 3
Hershey 23 24 38
M&M 22 28 16
Skittles 11 6 --
Cameras (80%)*Under
35 35-54 55+
Kodak 29 30 48
Canon 18 11 6
Sony 28 18 4
Men’s Apparel (59%)*Under
35 35-54 55+
Hanes 22 35 17
Levis 9 18 16
Wrangler 15 6 8
Nike 15 -- 1
Women’s Apparel (43%)*Under
35 35-54 55+
Hanes 25 17 8
Levis 6 20 5
Victoria’s Secret 11 3 2
Nike 10 3 --
* ( ) Percent with any brand preference

32
Measuring Lottery Brand Strength - PRODUCT
• All brands must deliver on product benefits. For lotteries…– Instant/online/multi-state
– Games that I like to play
– Games are fun to play (not dull or boring)
– Games are easy to play
– Available where I want them
– Money put to good use
– Supports our schools

33
Are We Delivering?
Under 35 35-54 55+0%
5%
10%
15%
20%
25%
30%
35%
40%
45%
29%
39%
32%
42%
33%
25%
Lottery Games Are Fun To Play…*(Top 3 Box Rating)
2008 2009*Based on a 9 point scale with 9 being “agree completely” and 1 “disagree completely.”

34
Measuring Brand Strength - PERSONA
• Brands must also have a persona or “style” that resonates with consumers…
– Someone like me
– Outgoing
– Funny
– Spirited
– Caring
– Smart
– Friendly
–Modern
• Does your brand persona have a distinct character?
• Consumers, (particularly younger consumers) like to do business with brands that share similar traits and values.

35
Do Consumers “Like” the Persona We Project?
Under 35 35-54 55+0%
5%
10%
15%
20%
25%
30%
35%
40%
45%
34%32%
26%
42%38%
30%
I Like The Lottery In My State*(Top 3 Box Rating)
2008 2009*Based on a 9 point scale with 9 being “agree completely” and 1 “disagree completely.”

36
Measuring Brand Strength – SPACE/PLACE
– Your State?
– Local Neighborhood?
– School?
– The Future (Your Future)?
– Virtual?
All lotteries are “local” brands in space / place and that connection is vital to our brand promise.

37
Space / Place - Example
More than 1 in 3 are off-track –and this is even true for Joe, our core player.
2009
Correct Responses (State Specific) 63%
Incorrect Response 17%
Don’t know 20%37%
Do You Know How Lottery Proceeds are Used in Your State?

38
Is the Situation Improving?For Younger Consumers, it May Be.
Top 3 Box Agreement Under 35 35 – 54 55+
2008 2009 2008 2009 2008 2009
Money Goes to Good Use in My State
Lottery Takes Advantage of People
24% 43% 37% 29% 26% 34%
24% 37% 40% 42% 45% 52%

IMPLICATIONS

40
Observations and Implications
The bulk of our sales and profits come from a small group of Joes who have been hit hard by the economy
Observation Implications
Focus efforts beyond core players, especially during these times. Try to engage Jacks and new players who are open to our messages.
Getting just 5% of Jacks to play more generates three times as much as getting 5% Joes.
• Are our products and messaging “Joe-centric”?
• What does Jack think about us today?
• What do we WANT him to think about us?

41
Observations and Implications
Roughly 1 in 10 adults are actually playing the lottery MORE in this recession. Initial observations suggest that they are:• Younger• More optimistic
Observation Implications
Young adults are THE primary opportunity for lotteries, especially in this economy. Older players have less disposable income and are cutting back even more.
Have you thought about how our product, persona and place resonate with these younger players?
Are we where they are with the kinds of games, prizes and messages they are looking for and trust?
Do they even notice us?
Do they believe we share their values?
It’s not enough to just be on Facebook

42
Observations and Implications
Most young adults we talked with were introduced to the lottery through a family member.
Holiday is the one time families come together to play the lottery.
This level of intergenerational gift giving and young adult purchasing happens only once a year.
Observation Implications
What is our holiday strategy?
It must go beyond developing a few “cool” tickets for the younger folks.
How do we try to reach younger adults and tap into the strong emotions surrounding our brands during this crucial time?
How can we use holiday as an opportunity to capture their interest in us and consider us throughout the rest of the year?

Change is Inevitable – and Already Happening
“All things must change
to something new, something strange."
- Henry Wadsworth Longfellow
43