~chanical properties of astm a572 grade …digital.lib.lehigh.edu/fritz/pdf/343_2a.pdf · highere...
TRANSCRIPT

I
by
Suresh Desai
Plastic Design in A572 (Grade 65) Steel
Fritz Engineering Laboratory Report No. 343.2A
~CHANICAL PROPERTIES OF ASTM A572 GRADE 65 STEEL
Plastic Design in A572 (Grade 65) Steel
MECHANICAL PROPERTIES OF ASTM A572 GRADE 65 STEEL
by
Suresh'Desai
This work was carried out as a Structural ResearchProblem, Course No. C.E. 404, being part fulfillmentof the requirements for the ~egree of Master of Science.It forms part of an investigation sponsored by the American Institute of Steel Construction.
This report is submitted to· Dr. L. S. Beedle, ·Prafes-.sor of Civil Engineering and Director, Fr'itz/'EngineeringLaboratory.
Fritz Engineering LaboratoryDepartment of Civil Engineering
Lehigh UniversityBethlehem, Pennsylvania
July 1968
Fritz Engineering L~boratory Report No. 343.2A

343.2A
TABLE OF CONTENTS
SYNOPSIS
1. INTRODUCTION
2. TESTING PROGRAM AND PROCEDURE
3. TEST RESULTS AND ANALYSIS
4. SUMMARY AND CONCLUSIONS
'5. FURTHER RESEARCH
6. ACKNOWLEDGEMENTS
7. NOMENCLATURE
8 . APPENDIXES
(1) Testing Instructions
(2) Summary of relevant ASTM Standards
(3) Set of typical results
(4) Proposed program of work under Project 343
9 . TABLES AND FIGURES
,10 • REFERENCES
1
3
17
21
24
25
26
28
34
35
40
41
64 '
i
343.2A
SYNOPSIS
This study forms a part of a research (Fritz Laboratory Project
343) initiated to explore the possibility of extending plastic design
concepts to structures of ASTM A572 (Grade 65) Steel. The overall ob
jective was to study the mechanical properties of this material with
particular emphasis on the properties in the plastic range. This re~
port includes discussion of the testing procedure, the machine and the
instruments used. After a general discussion of the mechanical pro
perties of steel; results of forty-six tension specimens from plates and
shapes of A572 (Grade 65) Steel are summarized.
ii

343.2A -1
1. INTRODUCTION
1.1 Plastic Design concepts and procedures for ASTM A36 steel
have gained wide acceptance during the past decade and are now an im
portant part of the AISC Specifications. 1
1.2 Recent advances in metallurgical techniques have led to the
development of a number of low-alloy steels with yield strength higher'r
6 -2than that of ,structural carbon steel covered by ASTM A3. These high-
. strength low alloy steels have found increasing use during the last
few years and need was felt of extending plastic design principles to
such steels. A project was initiated at Fritz Engineering Laboratory
in 1962 to study the plastic behavior of structural members and frames
of steels covered by ASTM A242 , A440 and A441 with sp~ci£ie~ yield
strength of 42-50 ksi. 3 This research has resulted in extensive
design recommendations for such steels 8
The next step was t~ investigate the low alloy steels with
highere strength covered by ASTM A572. Grade 65 with a yield strength
of 65 ksi has the highest strength in the range, of steels covered by
this standard~ Hence, a new project entitled UPlastic Design in A572
(Grade 65) Steel ll was sponsored in early 1967 by the American Institute
of Steel Construction with a view to extend plastic design techniques to
include steels with a yield strength of 65 ksi. A comprehensive pro-
gram was proposed which included~study of mechanical properties, stub col-
umns, beams, etc. details of which are included in Appendix 4. Since little

343.2A -2
information relating to A572 steels is available, it was decided to test
a large number of tension specimens to determine the mechanical pro-
perties of the Grade 65 material.
1.3 A study of the mechanical properties, especially those in the
plastic region is particularly relevant with regard to the following'
problems in plastic design.
(i)
(ii)
(iii)
(iv)
(v)
(vi)
Hinge formation and mechanism 'theory,
Lateral-torsional buckling,·
Lateral bracing spacing,
Local buckling of web and flange, .
Rotation capacity,
Deflectiono
1.4 The object of this report is t~ provide data on the mech
anical properties of A572 (Grade 65) Steel with special emphasis on
those more pertinent to plastic design and to demonstrate the feasibility
of extending the concepts ,of plastic design up to 65 ksi material.
Results of forty-six tension tests are presented.
1.5 A572 was issued as a standard for the first time in Sept4
1966.2
It covers "Standard Specification for High-Strength Low-alloy
Columbium-Vanadium St~els of Structural Quality". The high-strength of
A572 steels is due to small amounts of nitrogen and vanadium. Addition
of columbium promotes a fine grained structure with increased notch
toughness~ Important ASTM specifications for the chemical composition
and the mechanical properties of AS72 steel as also of the. A36, A242,
A440 and A441 steels are produced in Appendix 2.

343 2A -3
2 • TESTING PROGRAM AND PROCEDURE
2.1 A fairly extensive program of testing tension specimens was
instituted and a par~ of the testing was done by the class of course ex
456F in the spring semester of 1967. , A 120k Tinius,-01sen universal test·
ing machine of the ·screw-power type was used. Detailed instructions
issued on the procedure to be followed are reporduced in Appendix 1.
A pilot test was run to determine approximately the properties
of the material to facilitate a proper formulation of the testing pro
cedure. Later, twenty~eight.specimenswere tested by the class of course
CE456F. ~The class was divided into fourteen groups of two students each
and-each group tested two specimens. Later, thirteen remaining specimen~
from the original lot supplied by the manufactureres were tested as a
part of this particular reporto Results of four tests on specimens
from the undamaged portion 'of a 12B19 beam previously tested under mO
ment gradient are also included in this reporto
i The results of twenty-eight specimens tested by the ~la5s of
course No. CE456F are summarized in Fritz Engineering Laboratory Report
Nos. 456F.1) 456F. 2, 456F'a3 ,and -456F 04.
2.2 Material was received from two manufacturers and is desig_
nated Material A and M~terial B. Al~ the material was cut to conform to
ASTM A370 and an 8 in gage.2
Specimens were taken from plates and from
webs and flanges of shapes as listed in Table 1. All the specimens were
tested, in an as-received condition except that any loose scale was re-

343.2A -4
moved. No attempt was made to remove tignt mill scale. None of the faces
were milled, only the sides were milled.
Results of test, No. 1.7.3P are included in Appendix 3 as a set
of typical detail results.
2.3 The rationale of testing instructions are now briefly re
viewed. Also discussed are the difficulttes encountered with the machine
and the strain-measuring instruments.
2.3.1 The 120 kip Tinius~Olsen machine which was used in this
series of tests is a screw power type with a 'speed selector which pro
vides a crosshead speed of from 0.025 in./min. up to 10 in./min. The
manufacturers claim that the crosshead speed indicated on the speed selec-
tor is maintained constant at all loads, However, the strain rate, which
is the significant factor which influences the stress level, depends on
crosshead speed, shape of the specimen, load and also on whether the
specimen is in elastic or plastic or strain-hardening orange. Th~s,
there appears to be no way of testing under a uniform strain rate with
this machine.
Since it was considered desirable to keep strain rate as low as
possible with a view to minimize its influence- on stress levels, a cross
head speed of 0.025' in./min, was specified, This i8 the minimum speed
indicated on the speed selector. Besides. it is in keeping with the
current Fritz Laboratory practice.
However, it is possible to~run the machine at a lower speed but
such lower speeds were not attempted) since the absence of definite mark
ings on the speed selector would introduce an additional undes'irable

343.2A
variable.
-5
2.3.2 There is one I source of possible er~or which was not noted
until after the tests were completed. The static yield stress level
was recorded by shutting off the machine at a strain of 0.005. How-
ever, the motor backs up when stopped by the ·STOP· button or by set-
ting the ,speed selector to zero. It is suspected that this could result
in an unloading of the specimen and consistentily low values for crys
This probl~m is currently under investigation and preliminary indica-
tions are that if there is any effect at allon.cr ,such effect is negy8
ligible. However, this backing up of motor could have been eliminated
by reducing the crosshead speed by a gentle manipulation of the speed
selector until the motor stalled.
2.3.3 Two types of strain-measuring instruments were used as
noted in Appendix I, One was the mechanical dial gage which was mounted'
on one side of the specimen while the extensometer which was connected
to the autographic recorder was mounted on the other side. The smallest
magnification was used for the latter to obtain the entire strain-har-
dening range in one run of the drum.
Although' both the autographic recorder and the dial gage were
used to record strains, no attempt was made in the early tests to corre-
late the results, After about thirty specimens were tested, disagree-
ment between the twa.sets of results was noticed,· It was not possible
to verify any of the. previous tests because in most cases, the dial gage
data were not available and in the few 6ases where ~uch records were
available, they were incomplete. Later, complete records of dial gage

343.2A -6
t~.
readings were maintained and results compared with the automatic graph.
Excellent agreement was observed in some cases and startling disagree
ment in some others. However, there was no discernible pattern to draw
any definite conclusion. Special tests for checking both instruments
again indic~ted good agreement. It was then decided to rely on the
dial gage readings for a number of reasons.
Firstly, a mechanical instrument may bet considered inherently more
reliable. Secondly, the dial gage always gave more realistic data in
the elastic range, that is the value of E was around 30,000 ksi. As
against that, the giaph sometimes gave a much lower value of E and in
all such cases,'the disagreement between the dial gage and the graph was
more pronounced in the plastic range .. Thirdly, while the engagement of
the conical points of the dial gage into the punched holes on the speci
men was generally considered satisfactory, the same could not be said of
the knife-edge of th~ extensometer. There was no positive device to
maintain the position of the knife-edge, and a slip in the grips was of
ten accompanied by slip of ~~e knife-edge.' This by itself, was probably
not serious be~ause it appeared on the graph and could be accounted for.
But if there was a creep of the knife-edge during straining, it was im-
possible to detect. This possibility seemed particularly strong in the
plastic region when the mill scale under the knife-edge became loose.
Marking of scribe lines on the specimen for engaging the knife-
edge was tried on on~ specime~ but not considered a success~ A num-
ber of scribe lines were necessary for the various runs of the autographic
recorder and i~ was difficult to mark these accurately. This made it
difficult to bring the drum~toi zero position. Further, the scribe lines,

343.2A -7'r
which were never deep too start with, tended to flatten out in the plastic
range and became ineffective.
All these factors coupled with the lack of sensitivity of the auto-
graphic recorder as noted earlier cast some doubt on the realibility of
the graph.
It is interesting to note that wherever there was pronounced dis,.
agreement between the graph and the dial gage, the strains as recorded
by the graph were almost invariably higher. In other words, the move-
ffient of the knife-edge wa~ greater than the correspondi~g line on the
specimen. This appears rather strange because creep of the knife-edge
may be expected to record lower strains.
Vatues of strain at strain-hardening € and strain-hardening modulusst
E based on dial gage readings are marked \wi~h an asterisk * in Table 5.st2 ~~
2.4 The following mechanical properties were determined from the
tension tests:
Young's Modulus E
Fracture strength of
Strain at first yield €y
Proportional limit np
Upper yield stress level cruy
Lower yield stress level crty
Dynamic yield stress level cryd
Static yield stress level crys
Tensile strength (ultimate strength) cru
1.
2.
3.
4.
5.
Strain at onset of strain-hardening est
Strain-hardening Modulus E, st
12. "-'-Percent Elongation~'·(in 8 in.)
6,.
7 .
8.
9.'
10.
11.'
I
~
13. , Percent reduction of area

343.2A -8
Of these the properties most important in p~astic 4esign are:
1. Static yield 0"ys2. Yield strain 12;
y3. Strain at onset of strain-hardening €
st4. Strain-hardening modulus Est
5. Tensile strength (ultimate strength) cru
All these properties are studied in some detail here. Also presen-
ted in detail is the ratio a d /o ,although the+study is confined to only. . y ys
one crpsshead speed of 0.025 in./min.
A typical stress-strain curve for A572 grade 65 steel is shown in
Fig. 1.
2.4.1 Proportional limit up is the maximum stress up to which a
linear stress-strain rel~tionship is exhibited. However, due to the prac-
tical difficulty' of determining such a stress, it has been the practice
to define cr as the maximum stress below which the stress-strain graphp
deviates from the initial straight line by a finite strain. The stress
is then determined as the intersection of ~ straight line parallel to the
'initial straight li'ne of the stress-strain curve a nd tvith an offset on
strain-axis equal to, the specified strain. CRe specifies this as 10 mict'o-
. /. 4~n. ~n~ Due to the low magnification used in the present series of tests
this value ~as too low for practical use. A higher value of 100 micro in. lin.
was, therefore, used. See Fig. 5. However~ there is no practical 8igni£1-
cance of the value of a. Although structural carbon as well as low alloyp
steels are 'expected to exhibit linear elasticity almost up to yielding,
many tests give l.ower and widely varying values of Up' This can be at
tributed to two factors: (i) Inaccurate alignment of the specimen and the
consequent· higher stress'es due to eccentric load and (ii) The Bauschinger .

343.2A -9
effect. Bauschinger was the first to point out the phenomen0l?- of the lower-
ing of (1 in a crystalline material previous 1y subjected to a large strainp
in the o pposi te direction. S
'II
2.4.2 Four yield leve,ls were recorded. See Fig. 5
Upper yield stress (J corresponds to ,the highest load attaineduy
before the plastic range. It is influenced by the strain rate, the grain size
I~
and the previous strain-history of the ma,terial,.' In terms of dislocation,
mechanics, the presence of an upper yield point is attributed to interstital
impurities in dislocation which lead to a drop in flow stress after plastic
flow ha'ls b,een initiated at the upper yield point.5
This load is recorded,('
by the leading 'pointer on the load dial, as well as by the autographic re-
corder .. However, in many in~tanc~s, when the drop in load after the at-
tainment of the highest load is small, the au~ographic recorder failed to
register the load corresponding to cruy
This is because t~ere is a cer-
tain play between the gears operati~g, t~e rod recording the load as also
between the rod and the recording pen so that the recording mechanism is '
rendered insensitive to small reversals of, load. However, cr is not anuy
important property and many tension specimens fail to exhibit any <Juy
pos-
sib 1y because' of misalignment or .Bati'sching~r' effect.
Lower yield stress level GJJy
corresponds to the lowest .load recor
der after upper yield is 'reached and the dynamic yield load is stabilized.
This can be recorded from the load dial, keeping a close watch when the load
begins to drop. The difference between the load corresponding to Gj,y and
the stabilized dynamic yield load is often so small that the recording
~, mechanism fails to record it because of its insensitivity to load reversals.

3L~3 " 2:\ -10
(J t is not a significant quantity and is dependent on the presence of. ,'1
an 'observed 0 and the response of the specimen and the machine after theuy
first slip. Because of these reasons, the values of 0~y are not included
in this report.
Dynamic yield stress level 0yd
corresponds to the fairly stable
value of the load as the specimen yields at a constant strain rate and be-
fore the onset of strain-hardening. It was recorded using the leading, ~
pointer of the load dial just before stopping the machine ,at a strain of
0.005. Static yield stress level 0ys
may be defined as the value of 0yd
at zero strain rate.
The value of (J is of decisive importance to plastic design. Howys
ever, there is no simple and practical method of testing a specimen at zero
strain-rate. All tension tests are conducted at finite strain-rates and
the yield stress level is known to be significantly raised even by very
small strain(orates. 6
Two steps were taken to obtain a reliable value of cr,ys Firstly,
.1
~~-
the minimum practicaple crosshead speed of 0.025 in/min. was sleeted so
that the effect of strain~ratewa5·minimized. Secondly, the machine was
shut off at a strain of O. 005 and the load a llowed to drop and was recorded
as the static yield load, five minutes after stopping the. machine. The
interval of five minutes was chosen as a practical minimum for obtaining
results under uniform conditions but the possibility of a small further
drop in load over ~ long period of time cannot be ruled out.
Since the yield stress quoted by manufacturers is based on mill
tests which are conducted at much higher crosshead speeds, the study of
the ratio cr cl/a assumes importance. Such studies have been made fory ys

343.2A
A36, A44l and ASl4 steels but the A572 steels have not been examined so
far. 6 No ~uch study 'was planned for this series of tests but the ratio
-11
cr dla is studied for the uniform crosshead speed.of 0.025 in.fmin. Ay ys
few simulated mill tests are, however·, planned. '",'
ASTMA370 specifies a maximum crosshead speed of 0.5 in./min. for
28 in. gage. The speed adopted for this series of tests was only aue-I \, {, ~1 ,~\\r! .' '.'/
twentieth of the maximum stipulated by ASTM anq usually for mill tests./\,
Also, the yield load as defined by the ASTM A370 is the load corresponding
to a 0.2% offset or 0.5% s~rain.2 The latter criterion was used for this
series of tests.
2.4.3 Tensile itrength a corresponds to the maximum load on theu
specimen. This is recorded from the leading pointer after the load begins
to drop off.
2.4.4 Fractur~ stress of of corresp~nds to the load at the instane
of fracture. Since the cDosshead speed was increased after the initial
strain-hardening range, the drop in load was rather sharp just before
fracture. Because of this, it was difficult to record the fracture load.
Hence, the value ?f of should be regarded as approximate only. Perhaps"
if the speed of crossheads, is considerably reduced prior to fracture, a
more accurate value of cr/, can be obtained. However, crf"· is. only of aca-~
demie interest and has no significance in design.
2.4.5 Strain at first yield € was recorded on the dial gage aty
the instant the load pointer dr~pped on reaching ·the upper yield point.
However, in the absence of an upper yield point, no observation could
be taken. In such cases, even the autographic recorder failed to regis-
ter a' clear value tif ey' Because of this, the observed values of €
y are
343.2A
not included in this report. Instead e is computed as average cr IE.y y5
-12
2,4.7
2.4.6 Young's modulus E was computed from observations taken as
per the procedure~detailed in Appendix 1. However, this method is not re- ,
fined enought to give accurate values of E. Hence, the observed values of
E are not reported here and its value is assumed at 29,600 ksi. 7
Strain at onset of strain-hardening e was measured fromst,
the autographic recorder and 'latter whencertain~discrepanciesappeared,
as noted earlier, ,dial gage readings were also.,.taken. The values of est
2.4,8
based on dial gage readings are marked with an asterisk * in Table 5.
The process of straining between first yield and the'onset of strain-har-
dening is a discontinuous process due to the formation of successive slip
bands. In terms of the modern theory of dislocation mechanics, the values
of € depends on the distribution of dislocations. S Previous strain hisst
tory would also modify the value of ~st. This would suggest that est is
not a characteristic mechanical property and would explain the uncertain
nature of strain in this region and the rather wide scatter of the values
A small r~duction in the gage length occured as the extensometer
was lifted off the specimen usually after a strain of 0.0125 __ This was
done to obtain the entire strain-hardening range in one run. In computing
est' no correction was applied to the ,strain on the second run. In any
case, such correction would be small.
Strain-hardening modulus E has received considerable attenst
tion in research because of the importance in stability problems. Since
members of a structure designed by. plastic design procedur~s are expected
to be strained well into the strain-hardening region, E is one of thest
factors which determin~s the buckling strength, of such members or of the

m
343.2A -13 ~
plate elements constituting the cross-section of such members. Many ap-
proaches have been used tn evaluating E and some of these are brieflyst
reviewed below.
E. lis the instantaneous value as measured by a tangent to thest
curve at the point where strain-hardening commences. See Fig. 6. In the
present series of tests, this value was obtained from the autographic re-
corder. It would be rather difficult to obtain it from dial gage readings.;
EStl
is only of academic interest. and has no practical significance
Value of E falls rapidly as strain-hardening progresses and it wouldst
be rather unrealistic to use the value of E 1 in any srability compust
tations. Besides, the tangent is difficult to determine uniquely and the
small drop in load which oft~n precedes initi~tion of strain~hardening
often results in rather high values of E 1. Further, the value of E. st st
depends on the distribution of dislocations. S All these factors contribute
to a wide scatter of values.
8G. Haaijer used a similar tangent modulus approach. This value is
designated as Estl(a).He defined the str~ss-strain relationship in the
strain-hardening region using three parameters introduced by Ramberg and
9Osgood_
(j' - (j'y +
cr - crK -----¥.
Est
and K and m are coefficients.
where a and € are respectively the stress and strain, a is the yield stressy
The value of Estl(a) is used in the above·
equation. Values of K, m, and Estl(a) are determined from experimental
curves by a curve-fitting technique.
This approach eliminates the uncertainties involved in constructing

343.2A -14
complete dial gage observations.
a tangent and provides a powerful mathematical tool for the study of in-
cremental stress-strain·relationship. However, Est l(a) was not deter
mined in this series of tests.
p. F. Adams ~nd M. G. fLay obtained a static strain-hardening modulus
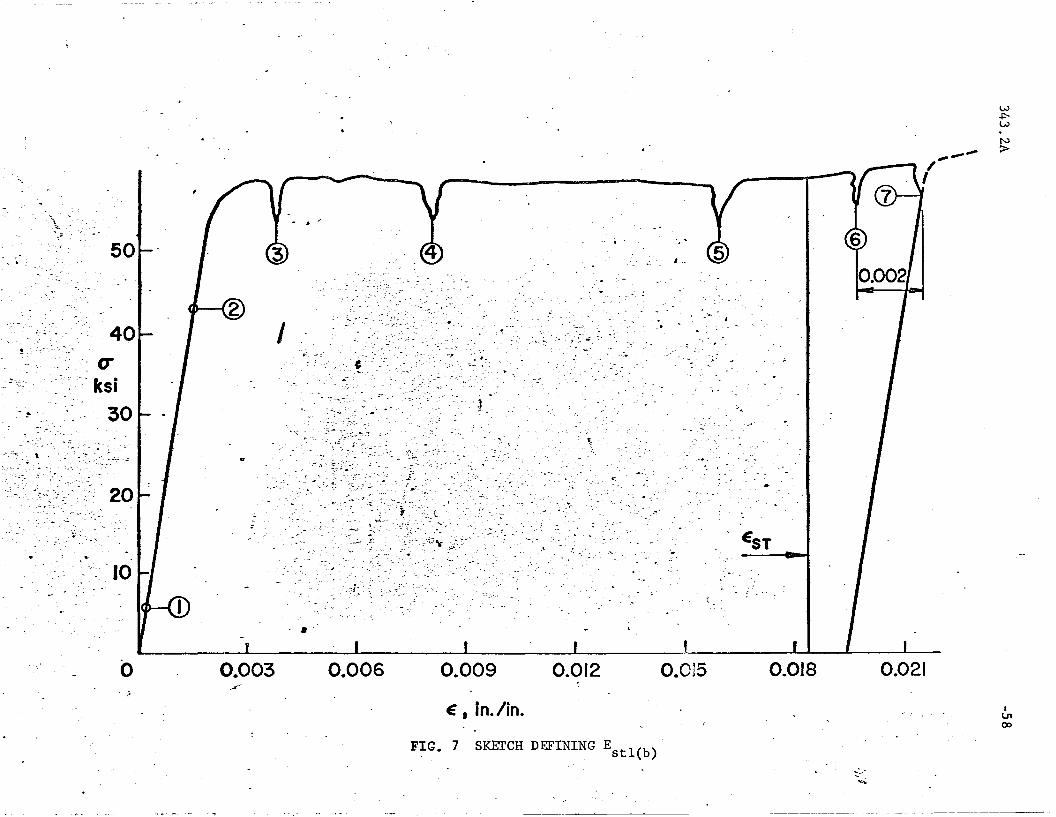
7Est l(b) by using the static load at est and est + 0.002. See Fig. 7.
However, due to the uncertainties of the static valu~s and the, di££i-
E 2 which was measured and is reported here is the strain-harst
dening modulus measured as the chord slope between strains € + 0.003st
and e + 0.010. See Fig. 6. This approach eliminates the initial unst
stable portion of the curve. This results in a smaller scatter of ex-
perimental values. Est 2 provides more conservative values than any
other approach and is a more realistic value to use when 'the material
is strained substantially into the strain-hardening range. This is some-
times the in dealing with buckling problems.10
Also, rotarizingcase
sometimes strains the material into this3
range.
Est :2 was compute~ from the autographic recorder in most of the
tests. However) when certain discrepancies b~tween the dial gage readings
and the recorder were discovered and the results of the recorder appeared
to be in d~ubt as described in Section 2.3.3, it was decided to take
Wherever values of E 2 are based onst
dial gage readings) they are marked by an asterisk * in Table 5.
4E 3 is obtained using the CRe Approacp. It is the average valuest
in an increment of 0.005 in. lin. strain after the onset of strain-har-

343.2A -15
dening. See Fig. 6. Onset of strain-hardening is defined as the strain
corresponding to the intersection on the stress strain curve of the yield
'stress kevel in the plastic range with the tangent to the curve in the
strain-hardening range. This tangent is drawn as the average valu~ in
an increment of 0.002 in. lin. after the apparent onset of strain-hardening.
The definition of the onset of strain"hardening is so modified here that
the effect of the frequently encountered drop in ,load immediately prior
.<)
to the apparent onset of strain-hardening is eliminated.
E 3 includes the effect of the steeper initial slope. Thisst
being a more unstable region, the values of E 3 exhibit a bigger scatter.st
This also results in E 3 being a less conservative value than E 2'st st .
The range of strain-hardening is also rather arbitrary and" this is quite
significant because the influence of range on E 3 is much greater thanst
on E 2'st
In the present ~eries of tests, E 3 was measured in two ways.st
The value measured from the autographic recorder was designated Est 3 (a)
and that measured from dial gage readings designated ESt3
(b), 3
No single value of E can be satisfactorily used in all situast
tionSe For incremental analysis, Ramberg and Osgood's equation wuth
Est l(a) would be the most appropriate.8 ,9 For the local buckling ana
lysis of web and flanges) it has been suggested that the webs and flanges
be so proportioned that load is sustained up to € for uniform moment andst
t f + 1 ( ) f d · 10 I h f ·up to a s ress 0 cr -4 G - cr or moment gra 1ent, n t e ~rsty u. y
case, E 3 should be used whereas for the second case, E 2 would best ' st
~ more appropriate.

343.2A -16-
It may be emphasized again that E is not a stable material prost
Uniform strain which is the strain corresponding
perty but depends on factors like distribtuion of dislocations', previous
strain history etc~ Under these circumstances) both Est 2 and Est 3
(average of Est 3(a) and Est 3(b» are reported.
It may be pointed out here that the effective value of E in comst
pression is somewhat larger than in tension for a material exhibiting
the same stress-strain relationship in compression and ~.~nsion. 5 This
is because the change in cross section which occurs as a result of lateral
strairi which accompanies longitudinal strain i~ usually ignored. This
longitudinal strain is· more pronounced in the inelastic"range. Further,
E is most frequently used in problems invoiving compressive stress.st
2.4.9 Both percent elongation and percent reduction of area at
fracture have been used extensively as a measure of ductility although
both these quantities depend upon a variety of factors other than the
" 1 · 5mater~a propert~esv
to the attainment of. -the maximum load by tension specimen is the measure
of ductility specified by some standards and is a more consistent material
property. Percent elongation represents the sum of uniform strain and
a large localized necking strain averaged over the gage length. That
is why the gage length, if always specifie~ along with percent elongation.
H9wever the necking strain itself depends on the cross section. Mechanics
of necking in a circular cross section is far different from that in a
rectangular"cross section. This adds further uncertainty to the value ofpercent elongation. The same" applie~to percent reduction of area as
a measure of ductility.
\ \

343.2A -17
3. TEST R,ESULTS AND ANALYSIS·
3.1 Results of tests are presented in this section together with
pertinent discuss~on. All the data has been collected in the form of
tables or charts towards the end of this report. Table 1 lists the num-
ber of specimens from various heats and ~hapes or and the schedule
of tests with cross section of each specimen appear~ in Table 2. Table
3 gives the frequency distribution of. specimen thickness. Details of
stresses are given in Table 4 and strain and other mechanical properties
in whereas the summary of these properties appear in Tables 6
and 7 respectively.
3.2 A typical a-e curve is shown in Fig. 1. A summary ,of the
average value of the mechanical properties listed earlier in section 2.4
is given below:
1. a p 57,.1 ksi
2. O"uy = 67.1 ksi
3.(J~y
is not reported for reasol1~ stated in section 2.4.2
4. O"Yd = 65.1 ksi
5. 0" 62.5 ksiys
6. fJ = <,86.1 ksiu
7. crf 68.5 ksi
8~ € = 0.211% = average" (J IE. Recorded values not reportedy y8as, explained in section 2.4.5.
9. E assumed as 29,600 ksi. Measured values are not reported.See Section 2.4.6
10. est = 1.94%
11. ESt1
= 2,980 ksi
Est2 = 545 ksi
Est3 (a) = 750 ksi
ESt3 (b) 670 ksi
ESt3 = Average of Est3 (a) and Est3 (b) = 710 ksi

343.2A -18
12. Percent Elongation (in 8 in.) 21.5
13. Percent Reduction of Area = 51.0
In addition to these, the following values are also of interest.
14. (J dloy ys = 1.041 for a strain rate of about 40 micro in./in./sec.(crosshead speed = 0.025 in./min.)
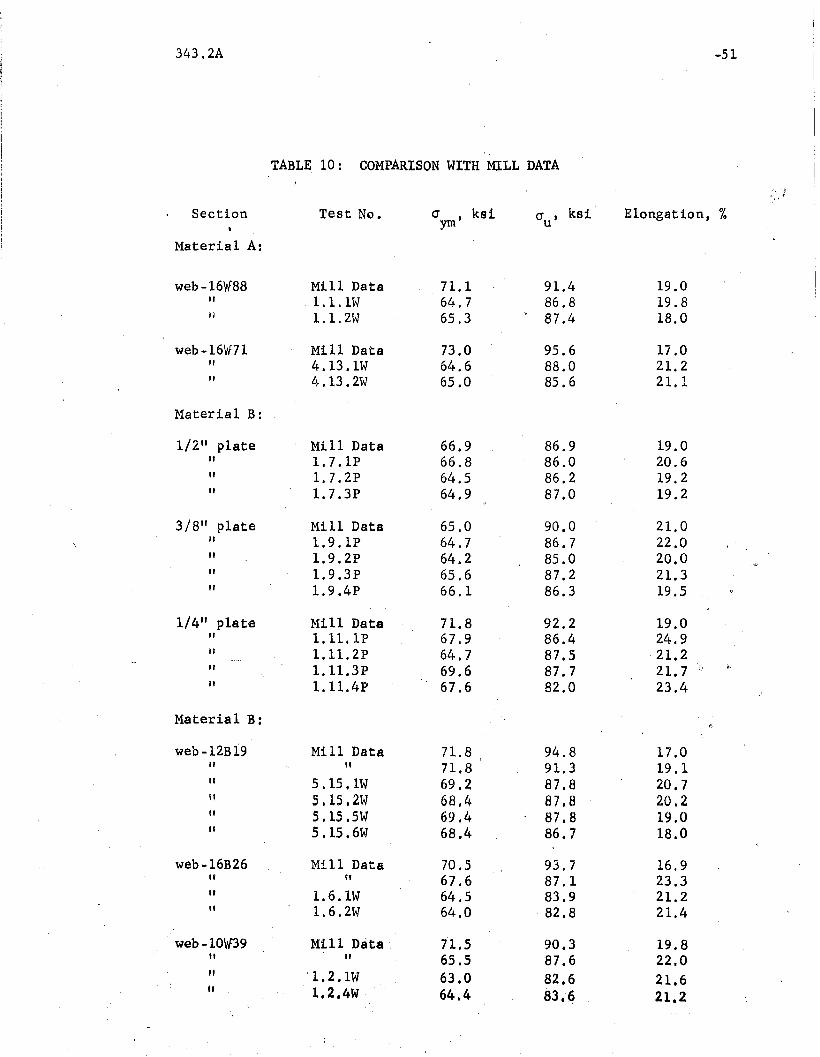
15. 0 = 66.5 ksi which is the mill value of yield stress obtainedym
by using results of a' previous study of the effect of6strain rate.
In the fo 110wing secti,ons, some of the above results are discussed~,
in detail.
3.3.1 Rao et al have pointed out that in the plastic range, the
lenvth of the specimen undergoing plastic deformation takes up all the
strain.6
Assuming such length.to be about 10" a crosshead speed of 0.025
in./min. would give a strain rate of about 40 micro in./in./sec. This
value is in agreement with the observations from the timing device as
also with the findings of Rao et al,
Projecting the results derived for A36 and A441 steels the following
results are obtained.
8 = 40 micro in./in/sec. e 800 micro in./in/sec.Proj ected Experimental Projected
cr d/cr 1.04 1.041 1.05y ys
a -(5 2.88 2.53 4.0yd y8
The value of a ; cr + 4.0 for e = 800 micro in./in./sec. isym y8
used for comparison with mill results in Table 9.
Standard deviation for cr was 1.992 ksi and the coefficient ofy8
variation 3.19%.11

343.2A -19
3.3.2 Specimens of tests 1.1.3F, 1.l.4F and 4.13.4F could not
be fractured because the load corresponding to the tensile strength ITu
exceeded 120 kips - the capacity of the machine. This corresponds to
a stress of over 92 ksi. " '
3.3.3 Important mechanical properties, namely, 0ys
' e and Est st
were studied further to find whether any factors influenced them and the
following conclusions were reached:
1. Jz;:1J plate specimens exhibited, a slightly higher (J •y82. Apart from the exception noted above, no definite trend
could be observed of the influence ori cr e ~nd Eys' st st
of the following variables:
(i) Thckness
(ii) Weight of the shape from which the specimen was cut.
(iii) Origin of the specimen, that is, whether plate, flange
or web.
(iv) The presence or absence of yield lines, indicating the
absence of any influence of rotarizing or gagging.
All these conclusions are not in line with the experience with
other structural steels. Rolling to a smaller thickness is known to
raise cr ' and for'the same reason its value is usually higher for lighterys12
shapes and higher for web than th~ flange ,of the same shape. Curiously
enough, the flange specimens: ,0£ 'matl.l A had higher 0- . than the web speci-. ys
ffi§n§_ ~ht§ is all the mote remarkabl§ in view of the fact that th~ BhApea
were outside of Group 1 and hence heavier than permitted by ASTM A512.
Further, rotarizing or gagging is known to cause such ~evere
strain in shapes that both € and E are substantially modified.3
s.t st
3.4 Figs. ' 8-15 show the histograms for O"yd' (J ) cr ,y8 U
€ per-st

343.2A -20
Tab Ie 8 showscent elongation, Est 2' Est 3(a) and E st'3(b) respectively,
the associated statistical data for some of these quantities. It ,may ,be
observed that the scatter for the values of (J d)' cr ,cr and Percenty ys u
elongation is small. However, est' Est 2' Est 3(a) and Est 3(b) exhibit
much wider scatter testifying to the uncertain 'material behavior in ,the
inelastic zone, But due to the deletion of the initial unstable curve
in the strain-hardening region) the scatter of the values of E 2 isst
1
considerably less than those of Est 3(a) and Est 3(b)'
3.5 It appears that the material received for testing, particular
ly Material B with most specimens on the thinner sid~ (Tahle 3) was pro-
bably on the low side of the mill distribution.
Mill test data supplied by the manufacturers is reproduced in
Table 9 together with the projected value of a = a + 4.'0 as in Sec-ym ys
tion 3.3.1.'
3.6 One interesting result is the € whic~ could prove of somest
significance in the study of the behavior of structures of A572' (Grade 65)
steel. Average est = 1.94% and € = 0.211% for A572 (Grade 65) steel.y
For A7 steel, est =,1.40% and ey
= 0.115%.13 Thus there is an increase
in the value of est alon~ with an increase in the value of cr althoughY8
such increase is less than proportionate. If estley or est - € are takeny
as a lUeasure of ductility, the values can be written down as:
(Jys
A7 34.1
A572 ("Grade 65),' 62.5
12.18
8.83
€ - €st y
1.285%
1.72%
Thus although (J is increased; 83% from A7 to A572 (Grade 65),, ys
estley drops only 28% and est - ey increases 34%.
80 as to minimize the effects of dynamic straining.
recorder and one of the values with the dial gage.
343.2A -21
4. SUMMARY AND CONCLUSIONS-.! \'
l, c' ;,~ :!. ('c ('Ir '7
After a description of the testing procedure and the testing
machine and instruments used, a general discussion of the mechanical pro-
perties was presented in Section 2. The ,test resul ts are summarized
in Section 3.2.
The tests were conducted at a low crosshead speed of 0.025 in/min.
a was computed. ys
from the stabilized load recorded five minutes after stopping the machine
at a strain of 0.5%. Average cr = 62.5 ksi with a standard deviation, Y8
o fl. 992 ks i .
In keeping with past experience, gre~t scatter was observed in
the values of € and E . Four different values of E were computed.;st st st
The smallest scatter was exhibited by E 2' A part of these difficultiesst
could be attributed to the need for using low magnification to obtain the
entire strain-hardening curve in one run.
In conclusion, it may be observed that the A572 (Grade 65) steel
exhibits mechanical properties characteristic of structural carbon steel
and that there is evidence to suggest that 'further study with a view·"to '
extend plastic design concepts to A572 (Grade 65) steel is appropriate.
Three values of E were defined and measured on the autographicst
Eland to a smallerst
extent Est3 which include the initial unstable portion of the strain-
hardening curve exhibit~d a very large scatter of values. Besides the

343.2A-22
fact that the properties in strain-hardening range are affected by the
distribution of dislocations, prior strain~history etc., factors like
strain-rate and low magnification for strain on graph contributed to
the uncertainty of the various'values of Est
E 3 was measured in two ways. The first method whose resultsst
are designated Est3 (a) involved the use of an autographic recorder which
directly recorded the load-strain curve with bhe help of an extensometer.
The second method involved measuring the deformation by means of a mech-
anical dial gage and observing the-corresponding load on the load dial.
This value was designated Est3 (b) , Good correlation between the two
values was sometimes lacking possibly because of malfunctioning of the
extensometer.
The average of the above two values was' 710 ksi. This would in-
dicate that the width-thickness ratios and the bracing spacing require-
ments would not be too restrictive. Oth.erwise, since the AS 72 (Grade
65) steel is limited to shapes of Group 1 which includes only light
sahpes, low width-thickness ratios would render most of them non-compact.
However, in dealing with strairis, well into the strain-hardening range,
the, lower value of E 2 will require closer studyst ,
Tha average results of this test series conform to the relevant
ASTM A572 requiremerts.
The high, value of e at 1.94% will have a beneficial effect onst
the ductility of structures of A572 (Grade 65) steel. A comparison
13with A7 steel w~ll make this clear.

........................._ __ _._ _..- .._ _-_.- -_.-.__._~--- '._- -- _._-._--_._-_._.__._-
343.2A
A7
A572
Ratio
(Jy8
34.1 l<.si
62.5 ksi
1.83
ey
0.115%
0.211%
1.83
1.40%
1.94/0
1.39
-23
/ e -8.est / 8
yst Y
12.18 "1.285%
8.83 1.72%
0.724 1.338
J~.
In spite of an increase of 83% in the value of cr , € tie re-y8 S y,
duces by 28% only and the more significant e -e increases by 34%.st: y
Both these factors could be regarded as measures of ductility.

343.2A -24
5 . FURTHER RESEARCH
Further research on the mechanical properties of ASTM A572 Grade
65 steel is necessary particularly in the strain-hardening region. As
already pointed out the values of e and E show a very wide scatterst st
of results and further investigation is necesgary (i) to determine the
value of € and E more accurately, (ii) fo test a larger number ofst at
specimens to see the range of variation and (iii) to investigate as to
which factors cause this variation. Also indicated is a need for a
revised procedure for determining these properties.
The present' study is confined to only Grade 65 steel. A need
for research into other grades is also indicated. Only with reliable
values of the 'significant mechanical pro perties of all grades of AS 72
steels will ii be possible to establish gerieral criteria for plastic
design.

343.2A -25
6. ACKNOWLEDGMENTS·
The present study was made at the Fritz Engineering Laboratory,
Department of Ci~il Engineering, Lehigh University, Bethlehem, Fa. Dr.
Lynn S. Beedle is Director of the Laboratory and Dr. D. A. VanHorn is the
Chairman of the Department. The study forms a p~rt of Project 343
IlPlastic Design in A572 (Grade 65) Steel, II sponsored by the Am,erican
Institute of Steel Construction.
Con~iderable help was received from Drs. L. S. Beedle, L. W. Lu,
Lambert Tall and B. T. Yen in conducting this study and preparing the
report. Mr. S. N. S. Iyengar and M~. Roger Scheid helped with the tests
and the class of course CE 456F carried out tests and prepared repors
which were extensively used i~ this study.
Miss K. Philbin typed this report and Mr. John M. Gera, Jr. pre
pared the drawings.
To all of them, very sincere -thanks are due.

343.2A -26
8. NOMENCLATURE
= Strain at onset of atrain-h~rdening
~ Limit of proportion~lity in ksi as determined by an offset
of 0.0001
E
Est
Estl
Estl(a)
Est3(a)
Est3 (b)
e
€Y
est
ap
ay
auy
u£,y
=
=
Young's modulus, ksi, taken as 29,600 ksi.
Strain-hardening modulus, ksi
Value of Est in ksi obtained from the maximum initial slope
of the autographic recorder carve at the apparent onset of
strain hardening, judged by eye.
Value of E in ksi determined by curve fitting and usedstin Tamberg-Osgood stress-strain equation with three parameters.
Value of E in ksi determined using static stress levelsst
at 8 t and e + 0.002s st
Value of E in: ksi obtained as the ~hord slope of thest
autographic recorder curve between strains 0.003 and 0.010
after the apparent onset of strain-hardening.
Value of E in ksi obtained by the method of lease squaresst .from the autographic recorder curve by selecting twn strain
intervals of 0.065 each after the onset of strain-hardening.
Value of Est in ksi determined in the same way as Est3 (a)
from readings taken from thee dial gage and the corresponding
readings of the load indicator.
Strain rate, micro in./in./sec.
Strain at first yield, evaluated as average a IEys
yield stress,. ksi stress
Upper yield stress level, ksi
Lower yield stress level, ksi

.~,
O'ym
.(5u
AISC
ASTM
Dynamic yield stress level, ksi
Static yield stress level, ksi
Dynamic yield stress level for mill test; ksi
;::: Tensile 'strength (ultimate strength), ksi
= Rupture stress, ksi
= American Institute of Steel Construction
= American Society for Testing and Materials
\
-27

343.2A -27A
GLOSSARY
The £0 llawing beams have been used as defined by ASTM STP 15 _C ll;:
1. The f Average I of a set of n numbers is the sum of the num-''
bers divided by n.
2. The 'Median' of the frequency. distribution of n numbers is
the,middlemos~ value
3. The . 'Standard Deviation' of a set of n numbers is the
square root of the average of the squares of the deviations
of the numbers:from their average.
4. The I'Coefficient of Variation I of a set of n numbers is
the ratio of their standard deviation to their average, ex
pressed as ~ percentage.
343.2A -28
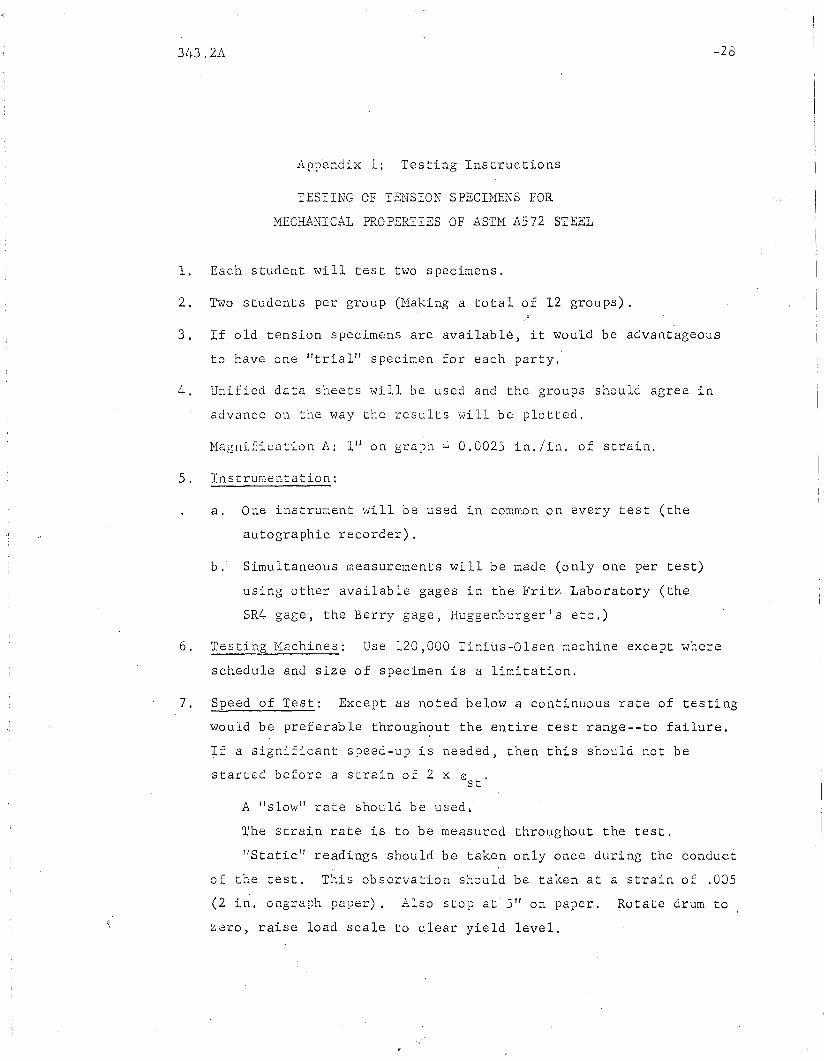
App~ndix 1: Testing Instructions
TESTING OF TENSION SPECIMENS FOR
MECHANICAL PROPERTIES OF ASTM A572 STEEL
1. Each student will test two specimens.
2. Two students per group (Making a total of 12 groups).A
3. If old tension specimens are available, it would be advantageous
to have one "trialJl specimen for each party.
4. Unified data sheets will be used and the groups should agree in
advance on the way the results will be plotted.
Magnification A; 1" on graph = 0.0025 in./in. of strain.
5. Instrumentation:
a. One instrument will be used in common on every test (the
autographic recorder).
b. Simultaneous measurements will be made (only one per te~t)
using other available gages in the Fritz Laboratory (the.
SR4 gage, the Berry gage, Huggenbu~gerfs etc.)
6. Testing Machines: Use 120,000 Tinius-Olsen machine except where
schedule and size of specimen is a limitation.
7. Speed of Test: Except as noted below a continuous rate of testing
would be preferable throughout the entire test range--to failure.
If a significant speed-up is needed, then this should not be
started before a strain of 2 x 8 .st
A lIslow" rate should be used,·
The strain rate is to be measured throughout the test.
"Static" readings' should be taken only once during the conduct
of the test. This observation should be taken at a strain of .005
(2 in. ongraph paper). Also stop at·Sf! on paper. Rotate drum to
zero, raise load scale to ~lear yield level.
'J.

343.2A
8. Definition of Terms: See eRe Guid~ (Technical Memorandum
No.3) .
9. Methods of Test: In the elastic region there should be at least
10 points taken between 10 ksi and 50 ksi when individual readings
are taken. (It may b~ necessary to -stop the machine in the elastic
range to take these readings).
10. Determination of Properties: (See various Fritz Lab reports)
E:
(J :p
(Juy
Autographic Recorder
Dault report
Offset method (.0001)
Record if observed
Other Instruments
Least squares
Same from Plotted curve
Same
(]ys
(J at E;
o at e
0.005
0.005
Same
Same
Est
Intersection of twostraight lines
a) Yield plateaub) Est ,(CRG TM-3)
a) eRe TM #3 (to .005)b) Same, but to .003
Record
Calipers
Same
Same
11. The class will be g~ouped for reporting of results in the fol
lowing categories: (BTY deleted #1 & #6)
1.
2.
3~
4.
5.
6.
Introduction, preparations for test
Elastic and proportional limit (E, Up)
Yiold otrongth (0 A _. R )t3 uy' u yc1' v ys
Strain hardening (8 ,E )s t ~·l _, ~t,
Ultimate and rupture (0 , € )U r
Summary

343.2A
TENSION TEST
PURPOSE: To obtain mechanical properties of steel in tension (assume
identical properties in simple compression).
Equipment Required:
-30
1. Tinius-Olsen Machine (O~120 kips range)
2. Extensometer (8 it gage length) for autographic recorder. Usemagnification A on recorder and long arm of ~xtensometer. Thestrain· scale on graph is 1" = 0.0025 in/in.
3. One additional strain measuring instrument to measure strainover a gage length of 8".
Mounted dial gage
4. Pair of dividers for measuring final gage length
5. 0"-1" micrometer (thickness of specimen)
6. 1"_2" micrometer (width of specimen}
7. 3 or more pieces of shock cord
8. Scriber
9. Center Punch
10. Autographic Recorder Sheet (0-60 kips or 0-120 kips
11. Test data and computations sheets
12. Automatic timing device
13. Scale
Procedure
Before testing, sketch pbserved yield lines on the specimen in the
figure on the test data sheet.
Locate the longitudinal' center of the speciluen and 'llleasure 4° on
either side longitudinally to mark the 8' gage length. On this side of
t11e specimen, the Itadditional" strain measuring device will be mounted.
Make sharp punch holes in the center of t~e width, measure and record
the actual distance between these holes as the gage length, Also make
sharp punch holes I" apart between the end holes. Measure and record

343.2A
thickness and width of the specimen at these 9 locations.
Corresponding to one of the end holes, make another on the other
-31
face of the specimen. The point support of the extensometer (autographic
recorder) engages this punch mark.
Mount the specimen in the machine using almost the same thickness
of the grips at top and bottom and taking care to see: 1) that the specimen
is adequately held in the grips, 2) the grips afe well within ~" of the
surfaces of the crossheads (as illustrated on the machine), 3) the spec,imen
is vertical. JlZ ero " the illachine on the load indicator dial.
Load to about 5000 psi and unload so as to grip the specimen.
Mount the Jt'additional" instrument. If the mounted dial gage is used,
attach to specimen by using two shock cords, one at each point support.
Mount the (autographic) extensometer and make attachment to the autographic
recorder.
Place in position the graph sheet and mak~·sure: 1) adequacy
of tracing needle pressure on paper, 2) whether'the teeth on the load
tracing arm are properly engaged with the ~arresponding teeth on the
k' kmachine (Use half-range la'ad position for 60 paper and 120 range) a
Mount the timing device (use the device only on the second run on
the recording paper).
Set the s peed a to. 025 :L pITl. 0 f c. 17 0 S s h0 Ll ds, e om pleterea c1 1. i1g 0 f the s e
pages ~nd then start loading. (Be sure the machine in on Iflowfl) Q
If at any stage in the elastic range slip occurs, unload to zero,
check the grips and start allover again. However, report for fu~ther
instructions should the stress at slip be higher than. 50 ksi (for V65
steel) .

343.2A
Make one stop at 0.005 strain (2" on paper) for 5 minutes to get
-32
the static yield load. Stop machine and reset the graph to zero strain
when the strain measures 5" on paper. Shift the load axis by an even
number of divisions at this stage. Start the machine and the automatic
timing devices simultaneously. See notes regarding strain-hardenin~
modulus. Strain-hardening may start anywhere from 68 to lie.y y
Discontinue timing device after the second run on the graph sheet.
Discontinue strain measurements after the third run on paper.
Discuss any suggestion or comment with instructor. The class witl
be advi~ed of improvements that may re~ult from such discussions.
Determination of E - Valuesst
Report 4 values of Est
E 1 is the maximum initial slope of the autographic recorder curvest
at the apparent onset of strain-hardening, judged by eye.
ESt2
is the average slope in the region near the onset of strain
hardening where the' slope is practically uniform. This region is expec-
ted to lie between strains of 0.003 and 0.010 after the apparent onset
of strain-hardening. Assume the average slope to be the chord ,slope
corresponding to these strain values. Hence, note load dial readings
on the machine at these strain values, correct to 50# or smaller (a
divisi.on on the load dial corresponds to 10011' when llsing the 0-120 )OOO:/f.
range on the Tinius~Olsen machine) .
Est3 (1) is the value ob~ained following the procedure prescribed
in Technical Memorandum #3 of the eRG, using the curve obtained from the
autographic recorder. The procedure and relevant definitions are repro-
duced below for ready references~

343.2A -33
(h) Onset of Strain Hardening may be defined as the strain correspondling to the intersection on the stress-strain curve of theyield stress level in the plastic range with the tangent tothe curve in the strain-hardening range. This tanger~ is drawnas the average value in an increment of 0.002 in./in~ after theapparent onset of strain hardening.
(i) Strain-Hardening Modulus is the range of strain after the plastic range where the cross section no longer strains at a constantor near-constant stress.
(j) Strain-Hardening Modulus is the ratio of stress to strain inthe strain-hardening range. It is measured as the averagevalue in an increment of 0.005 in./in. strain after the onsetof strain hardening.
Disregard the previous instruction ( p. 2) concerning the re porting.
of the E -value corresponding to 0.003 strain.st .
Est3 (1) value should be based on the slope obtained using the method
ad least squares. Select 10 intervals for 'this purpose.
Est3 (2) repeat steps for Est3 (1) but use mechanical dial gage readings
and corresponding loads. Since est = 6€y to ll€y' start taking readings
of "additional" instrument at 6e. Read both the load dial and the in-y
strument at 0.005/10 = 0.005 in/in internals, that is, two smallest
.divisions of autographic recorder.
Use a sharp pencil no harder than lH when drawing lines on the load-
strain curve obtained from the autographic recorder. Any lines drawn on
the curve should be capable of being easily erased. Preferably, make
faithful tracings for working, and attach to your report such tracings
when used.

343.2A -34
APPENDIX 2: SUMMARY OF RELEVANT ASTM STANDARDS
Chemical Requirements (All Figures for Check Analysis) "~~'I ,¢
Carbon Manganese Phosphous SulfurMax % % Max % Max %
A36 0.30 0.05 0.063A242 0.21 Max 1.30 0.063A440 0.32 1.05-1.65 0.05 0.063A44l 0.26 Max 1.40 0.05 0.063 .A572Grade 42 0.25 Max 1.40 0.05 0.06Grade 45 0.26 " " "Grade 50 0.27 " " II
Grade 5S 0.39 It ,', "Grade 60 0.30 " " fI
Grade 65 0.30 " tr "
These are broad requirements only. A572 also details the requirements
for Columbium, Vanadium and Nitrogen.
Tensile Requirements and Maximum Product Thickness
Minimum Minimum Minimum Max. Thickness or Sizecr , ksi 0' , ksi Percent Plate & Bars Shapes
y u Elongation(8 in. gage)
A36 36 58 20A242, A440, A441 50 70 18 up to 3/4" incl. Group 182
46 67 19 over 3/4" to 1 1/2 inc.I. Group 3A572 42 63 16 - over 1 1/2" to 4"incl. Group 485
42 60 20 4 All shapes45 60 19 1 1/2 up to 42650 65 18 1 1/2 161ft. incl.55 70 17 1 1/260 75 16 1 Group 18265 80 15 1/2 Group 1

343.2A ' -35Appendix 3: Set of Typic~l Results
TENSION TEST
I
Plate
38.4
66.4
62.8
63.0
60.9
87.0
62.6
0.0112
0.0112
19.2 %
45.8 %
30,600 ksiE = 2,560 ksiat J
E 634 ksist2
Est3 (a) 850 ksi
ESt3 (b) 950 ksi
I
Location of Specimenin cross-section
Shape
Test No.1. 7.3PProjec"t 343B-------Specimen No. 12T3271/18818
(Attach load-elongation curveand supporting calculations)
I
Loads (Kips)
Upper Yield Load 51.9
Lower Yield Load 49.1
Dynamic Yield Load 49.3(e ::: 0.005)
Static Yield Load 47.6(e = 0.005)
Ultimate Load 68.1
Rupture Load 49.0
RESULTS:
Proportional Limit(e = O. 0001)
Upper Yield Stress
Lower 'Yield Stress
Dynamic Yield Stress(e: = 0.005)
Static Yield Stress(€ = O. 005)
Ultimate Stres's
Rupture Stress
Strain at Yielding(upper yield)
Strain at StrainHarde'ning
?ercent Elongation\ .Percent Reduction";··-'
of AreaYoungls Modulus
Strain ,HardeningModulus
in.
in.0.782 sq.
8.02 in.
9.56 in.
_0_.2_9_6_i_n_._x_l_.•;....O....;;.,9....;,4_in.
0.324 , sq.=
Measurements
Thickness Width(in. ) (in. )
0.521 1.5020
00.521 1.502
0.521 1.501."j,,\
0
00.521 1.500
00.521 1.501
00.521 1.501
00.522 1.501
00.522 1.502
cD0.522 1.503
4.692 13.513
0.521 1.501(average) (average)
Date: August 1, 1967
Temperature: Room temperature
Tested by: Suresh Desai & Roger Scheid
Machine ,used: 0-120k Tinius-Olsen
Gages used: Mounted dial gage & Extensometer
Rate gf Straining; 0,025 in/mint of crossheads
Scales: I" = 0.0025 in/in. strain(Automatic
Record er) _H_a_l_f_-r_a_n~g,-e _
Indicate Fracture on Sketch
Reduced Area:
Gage Length:
Final G~ge Length:
(Average) Area:

343.2A -36
Specimen No. 12T3271/18818
SUPPORTING CALCULATIONS .
Original Area = 0.782 sq. in.
STRESSES
Vroportional Limit (6e =,0.0001)
Upper Yield Stress
Lower Yield Stress
Dynamic Yield Stress
Static Yield Stress
Ultimate Stress
Rupture Stress
LOAD (kips)
30.0
31.9
49.1
47.6
68.1
49.0
STRESS (ksi)
38.4
66.4
62.8
63.0
60.9
87.0
62.6
Original Length (Gage Length) = 8.02 in.
STRAINS
Straip at Yielding (Upper Yield)
Strain at Strain Hardening
Percentage Elongation
FINAL AREA(sq. in.)
Percentage Reduction of Area 0.324
ELONGATION (in.)
0.000182
0.0898
9.56-8.02=1.54
ORIGINAL AREA(sq. in.)
0.782 .
STRAIN
0.00228
0.0112
19.2%
REDUCTION BY·PERCENTAGE
0.358 (100) = 45.8%0.782
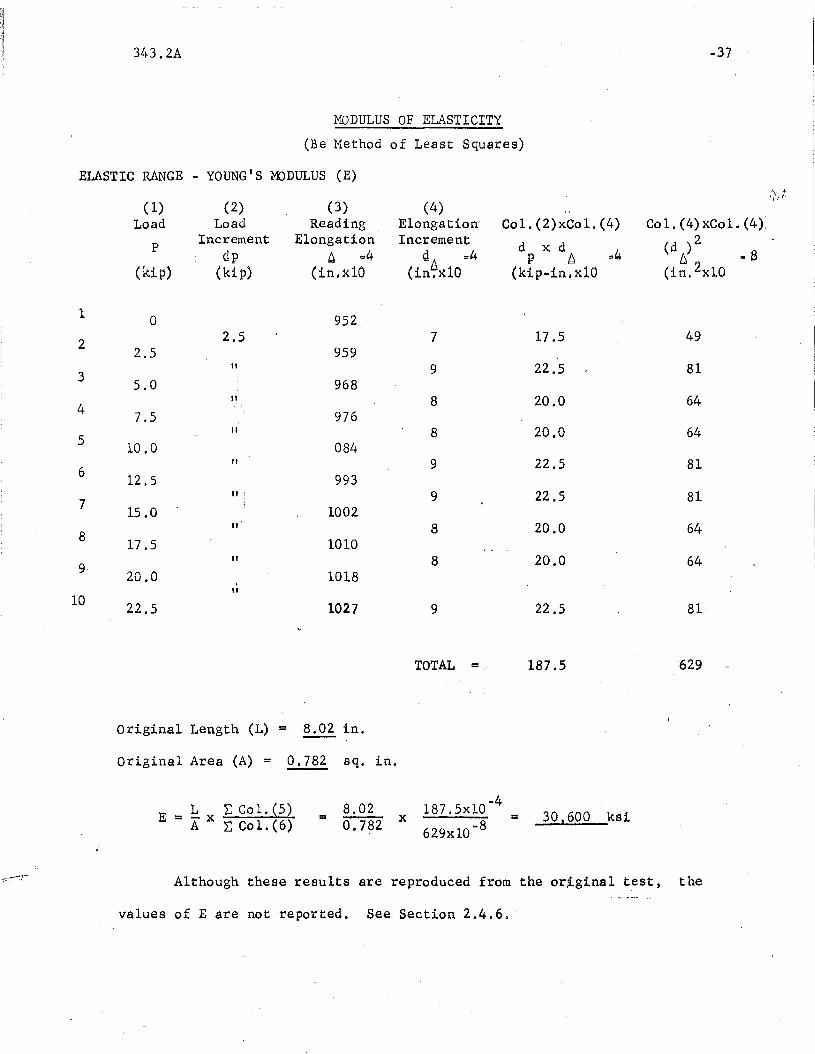
343.2A
TOTAL =
Original Length (L) = 8.02 in.
original Area (A) = 0.782 sq. in.
187.5
-37
E = !:: x L: Co 1. (5)A 1: Co 1. (6)
-48.02 187.5xlO= 0.782 x 629xlO-8 = 30,600 ksi
Although these. results are reproduced from the ortginal test, the
values of E are not reported. See Section 2.4.6. '

343.2A -38
Test No. 1.7.3P Specimen No. 12T 3271/18818
Dial Gauge Readings
Load, k Reading Load, k Reading , Load" k Reading:~;'~ 'J
0 0952 49.0 1400 54.6 2600
2.5 0959 49.1 1450 54.9 2650
5.0 0968 49.1 1500 55.2 2700
7.5 0976 49.2 1550 55.5 2750'0
8.7 slip 49.3 1600 55.8 2800
10.0 0984 49.3 1650
12.5 0993 49.3 1700
15.0 1002 49.3 ~750
17.5 1010 49.3 1800
20.0 1018 49.3 1850
22.5 1027 49.6 1900
25.0 1036 50.3 1950
27.5 1044 ' 50.8 2000
28.5 slip 51.2 2050
30.0 1053 51.5 2100
32.5 1062 51.8 2150
34.7 slip 52.2 2200
35.0 1072 52.5 2250
37.5 1081 52.9 2300
30.0· 1089 53.2 2350
42.5 1098 53.5 2400
45.0 1107 53.8 2450
47.5 1117 54.0 2500
50.0 1280 54.3 . 2550
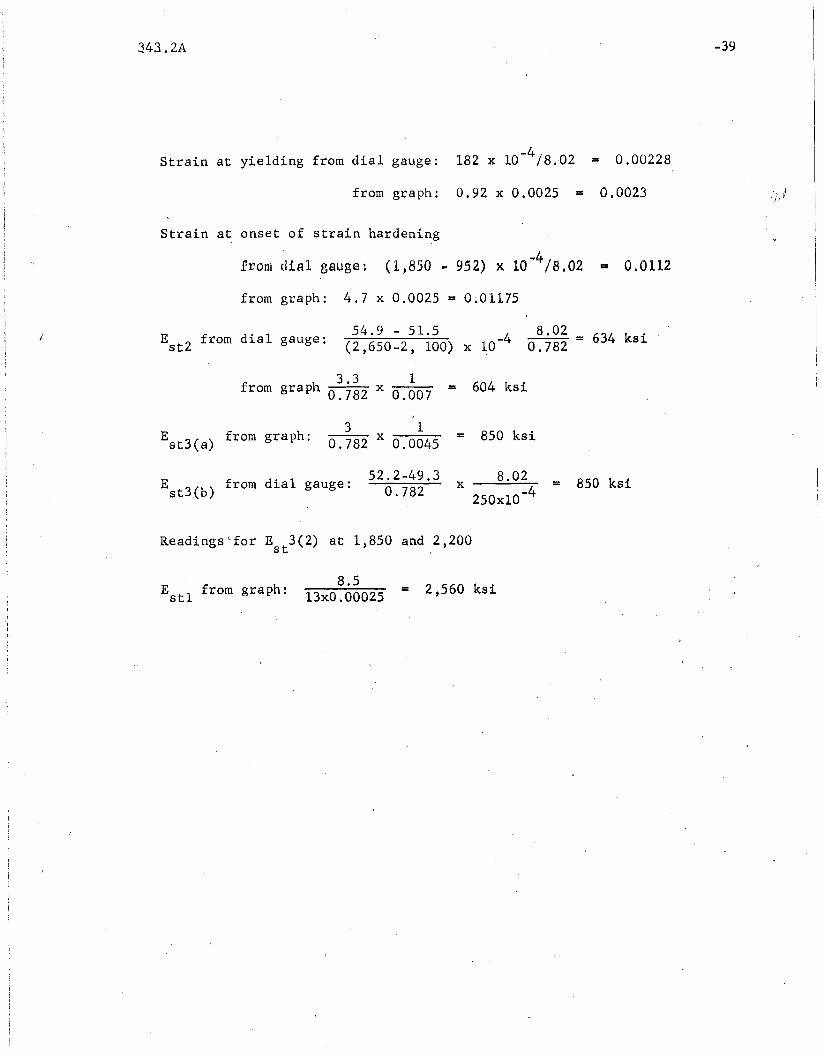
343.2A -39
Strain at yielding from dial gauge: 182 x 10-4/8 ..02 = 0.00228
from graph: 0.92 x 0.0025 = 0.0023
Strain at onset of strain hardening
from dial gauge: (1,850 N 952) x 10-4/8.02 • 0.0112
from graph: 4.7 x 0.0025 = 0.01175
J E from dial gauge:st2
54.9 - 51.5 4 8.02 = 634 k ·(2,650-2, 100) x ~O- 0.782 S~
f h 3.3 1 604 k irom grap 0.782 x 0.007 = s
E from graph:3 1 850 ksix 0.0045 =
st3(a) 0.782
E from dial52.2-49.3 ' 8.02 850 ksi
st3(b)gauge: x =0.782 2S0xlO-4
Readings'for Est
3(2) at 1,850 and 2.,200
ESt1
from graph: 8.513xO.00025 = 2,560 ksi

343.2A -40
Appendix 4: Proposed Program of Work Under Project 343
PLASTIC DESIGN
AND THE
PROPERTIES OF 65 ksi STEEL
Phase
1. Mechanical Properties(Fritz Lab)
2. Mechanical Properties( Producers)
Purpose
Determine Est' est' as
well as a , E, cr , v, %y uelongation, for varietyof shapes and plates.
Collect such preliminary information as isavailable in producers·research labs onproperties listed inPhase 1.
Tests
Coupon type testsFlange and web;,Shapes and Platesthick and thin.(Inc lude a fewsimulated milltests) V65 andExten 65. A fewcompression tests.
None (Producerssupply typicalcomplete (J - €curves)
Notes &Status
1st priority
Proposal date2/4/67 and2/14/67
3.
4.
5.
Mill data
Stub 'Column Tests
Beam tests
Find statistical variation in 0 and such
yother' properties as arereported in the milltest sheet.
Check local ~uckling toverify theory (observeproportional limit)obs~rve average yieldstress.
Check local buckling .provision, check lateralbracing spacing provision, check shear rule
None ProducerssupplyMill reports for a"few thousand"specimens
2 tests (one heavy,one light)
3 tests "Beam"shapes, momentgradient and uniform moment.
Was done in1954 for A7under eRe
2nd priority
Proposal date2/4/67
2nd priority
Proposal date2/4/67
6. Beam Column
7. Residual Stresses
Check Column provisionsof theory
Needed for beam columntheory (check stub column test, local andlateral buckling in ASD)
1 test (Samematerial as one ofPhase 4 tests)
Several sets,same as Phase 4

343.2A -41
10. TABLES AND FIGURES
Page
Tab Ie 1
Tab Ie 2
Tab Ie 3
Table 4
Table 5
Table 6
Tab Ie 7
Table 8
Tab Ie 9
Table 10
Fig. 2
Fig. 3
Fig. 4
Fig. 5
Fig. 6
Fig. 7
Fig. 8
Fig. 9
Fig. 10
Fig. 11
Fig. 12
Fig. 13
Fig. 14
Fig. 15
Fig. 16
Specimens
~rogrBm of Tests
Frequency Distribution of Thickness
Stresses
Strain and other Mechanical Properties
Summary of Stresses
Summary of Strain and other Mechanical Properties
Ratio cr d/ (Jy ysData on Experimental Scatter
Comparison with Mill Data
Idealized Stress-Strain Curve for A572 Grade 65 Steel(with strain-hardening)
Complete stress-strain curves for A572 (Grade 65) Steel-'---~
Idealized Stress-Strain curves for\A7,! A44l, A572 (Grade65) Steels (with strain-hardening).~ _ /'
J tlComplete stress-strain curves for A36, A441, A572 (Grade65) Steels.
Sketch defining 0p' 0uy' 0yd' 0ys
Sketch defining Est!' ESt2 and Est3Sketch defining Estl(b)
Dynamic Yield Stress 0yd: Histogram
The Static Level of Yield Stress cr Histogramy8
Tensile Strength 0: Histogramu
Strain at Onset of Strain-hardening est: Histogram
Percent Elongation: Histogram
Strain-Hardening Modulus Est2
: Histogram
Strain-Hardening Modulus Est3 (a): Histogram
Strain-Hardening Modulus Est3 (b): Histogram
Typical Graph From Autographic Recorder
42 ,';';~1
43
44
45
46
47
48
49
50
51
52
53
54
55
'56
57
58
59
59
60
60
61
61
6262
63
343.2A -42
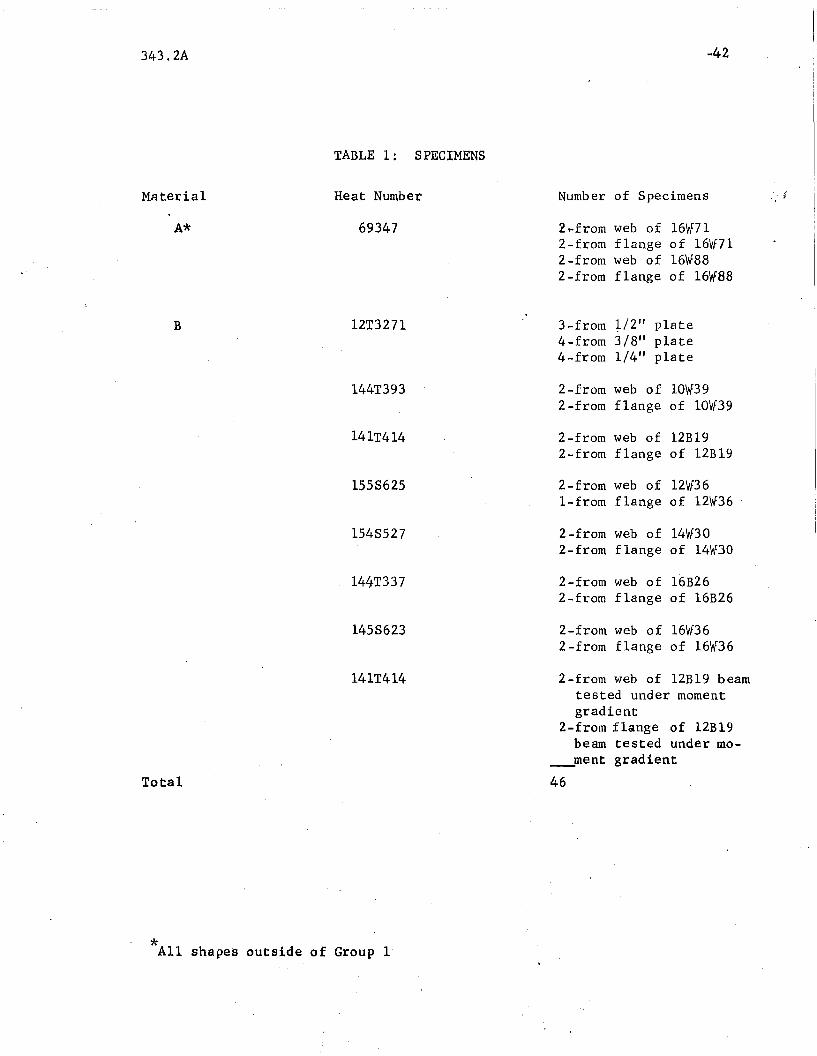
TABLE 1: SPECIMENS
Material Heat Number Number of Specimens ' ,1',...,'1
A* 69347 Z... from web of 16Vf712-frorn flange of 16\f712-from web of 16\f882-from flange of 16Vf88
B 12T3271 3-from ~/2" plate4-from 3/8" plate4-from 1/4" plate
144T393 2-from web of 10\1392-from flange of 10\f39
141T414 2-from web of 12B192-from flange of 12Bl9
1558625 2-from web of 12W36I-from flange of 12W"36 '
1548527 2-from web of 14W302-from flange of 14\f30
144T337 2-from web of 16B262-from flange of 16B26
1458623 2-from web of 16\f362 ... from flange of 16\136
141T414 2-from web of 12B19 beamtested under momentgradient
2-from flange of 12B19beam tested under mo-
__ment gradient
Totsl 46
*All shapes outside of Group 1

343.2A -43
TABLE 2: PRoGRAM OF TESTS
Condition " JMaterial. Test No. Section inxin. Shape of Specimen
A 1.1.1W O.527xl.591 weh-16Vf88 . Clean
" 1.1.2W O.550xl.592 " "" 4.13.1W O.509xl.596 web-16W71 "tr 4.13.2W O.521xl.S94 " "It 1.1.3F O.819xl.593 '. \flange-16YF88 "" 1.1.4F O.820xl.591 " "" 4.13.3F O.809xl.595 flange-16YF71 "" 4.13.4F O.817xl.594 " "B l.7.IP o.524xl. 503 plate Clean
" 1.7.2p O. 522xl. 504 " "" 1.7.3P O.521xl.501 " If'
" 1.9.Ip O.404xl.493 " "" 1.9.2p O.403xl.494 " "" 1.9.3P o.402xl.493 " "" 1.9.4p o.402xl.503 " "
">'
" ,1.ll.lP O.256xl.505 " "" 1.11.2P O.256xl.499 " "" 1.11.3P O.255xl.501 " It'
" 1.li.4P O.254xl.503 " "tI 1.2.1W O.340xl .. 501 web-lOW-39 Yield lines
" l.2.?i-W O.339xl.501 " CleantI 1.3.1W o.388xl.500 web-12\Af36 "" 1.3.2W 0.33 8xl.50 I' ft "B- 1.4.1W O.307xl.504 web-16Vf36 c', Clean
" 1.4.3W O.323~1.504 " "" 1.5.1W O.274xl.500 web-14W36 "" l.5.2W O;273xl.503 it "
~
B 1.6.1W 0 ·~13 7'" O. 293xl.503 web-16B26 cleanIt 1.6.2W O.284xl.498 " "" . 5.15.1W O.257xl,510 web-12B19 "". 5.15.2W ,0. 259xl. 50 1 " "" S.15.5W* O.262xl.504 " "II 5.15.6W* O. 265xl. 505 u "B 1.2.2F O.516xl.500 flange-lOW39 yield lines" l.2.3F 0.5l3xl.503 " clean
" 1.3.3F. 0.527xl.511 flange-l2Vf36 "" 1.4.2F O.427xl.502 flange 16\f36 yield lines
" 1.4.4F O.424xl.552 " clean
" 1.5.3F o•390xl. 500 flange-14Vf30 yield lines
" 1.5.4F O.383xl.503 " clean
II 1.6.3F O.359xl.500 flange-12Vf36 yield lines.II 1.6.4F o•37lx1. 500 " cleanII 5.15.3F O.368xl.502 flange-12B19 clean" 5.15.4F O.367xl.495 " "" ..5. 15. 7F* O.371xl.506 " "if 5.15.8F* O.372xl.505 " n
*From end of 12B19 previously tested under moment gradient o'

343.2A ..44
T~LE 3: FREQUENCY DISTRIBUTION OF THICKNESSI. "/
'l~ >
Thickness, in. No. of Specimens " -Percent
0.2 - 0.3 12 26
0.3 - 0.4 14 30
0.4 0.5 6 13
0.5 - 0,.6 lOa 22
0.6 0.7 0 0
0.7 0.8' , 0 ~ 0
0.8 - 0.9 4b 9
Total 46 100
8. Four specimens from Material A
b. All specimens from Material A, ~j

343.2A
IeOver 92 ksi. Load corresponding to cru exceeded capacity of the machine.
-45

343.2A -46 "
TABLE 5: STRAIN AND OTHER. MECHANICAL PROPERTIES
strain at E1onga- Reduc- Strain Hardening Modulus :j~,1
strain tion tion of E in ksiTest hardening, (8 in.), Area, st
Matr. No. est' percent percent percent ESt?l ESt2
E ESt3 (b)st3(a)
A 1.1.lW 0.95* 19.8 57.2 700 590* 530 546" 1.1.2W 2.51* 18.0 59.4 406 600* 406 . 602.,
" 4.13.1W 1.80* 21.2 61.4 600 590* 574 730" 4.13.2W __ tIIIIIII_ 21.1 58.7
A 1.1.3F 2.32* _.......... --- 2,000 705* 852 895" 1.1.4F 1.08* ~ ... _- --- 4,200 726* 680 770" 4.13.3F 1.20* 21.5 56.0 9,150 688* 705 550rr 4.13.4F 1.19* .......... - _............. 1,800 670* 854 755...
B 1. 7.1p· 1. 75 20.6 54.5 540 576 13 507" 1.7.2p 1.23 19.2 51.4 4,020 645 737 639" 1.7.3p 1.12* 19.2 45.8 2,560 634* 850 850
" l.9.1P 3.25 22.0 47.0 930 350 812 220" 1.9.2P 2.29 20.0 36.4 830- 775 598 500" l.9.3P 1.45 21.3 50.7 1,500 441 685 590tI 1.9.4p 1.21* 19.5" 59.3 480 530* 480 720
"
" 1.1l.lP- 2.05 24.9 46.0 2,030 446 461 475ft 1.11.2P 0.02 21.2P 40.6 6,860 557 841 493" 1.11.3p 2.05 21.7 47.2 6,274 485 993 . * 794" 1.11.4P 2.09 23.4 48.7 1,375 340 960 £ 650
" 1.2.1W 1.95 21.6 44.2 5,320 642 591 630fI 1.2.4W 1.67* 21.2 .61.6 393 580* 655 900"
-1.3.1W 1.85 21.0 49.2 2,920 505 987 'if,'- 822
B 1.4.1W 2.18 . 22.6 62.3 868 496 819 859" 1.4.3W 2.27 20.5 55~5 3,960 456 871 826
" 1.S.1W '2.55 21.5 58.3" 1.5.2W 3.28 21.4 42.0 8,372 479 926fI 1.6.1W 1.91 21.2 53.2 --- --- --- 411" 1.6.2W 1.75 21.4 39.5 1,750 497 895 769
" 5.15.1W 2.52 20.7 40.5 696 619 538 569" 5.15.2W 1.97 20.2 43.2 2,500 644 382 744" 5.15.5W 2.12 19.0 47.0 ' 1,425 499 979 402" 5.15.6W 2.20 18.0 37.0 1,394 523 836 717
" 1.Z.2F 1.65 * 21.2 58.2 2,500 565* 975 830" 1.2.3F 1.58* 21.2 50.5 1,050 573* 990 1,020" 1.3.3F 1.77 36.1 58.6 1,883 550 664
" 1.4.2F 1.·90 24.6 53.3 3,710 322 660 434......
" 1.4.4F 2.62 23.1 55.0 6,840 380 1,160 402
B 1.5.3F 2.10 22.6 58.1 2,720 560 730 67011 1.5.4F 1.90 22.5 44.0 5 ,030' ;' 542 355 472 ~
II 1.6.3F 1.99 18.8 55.1 9,825 542 805 941" 1.6.4F 1.70. 18.1 57.5 5,030 616 820 452H 5. 15. 3F 2.00 21.0 52.6 1,660 490 903
5.15.4F 2.00 20.5 57.3 4,250 575 727 6385 .15. 7F 2.13 18.0 53.0 1,245 484 736 9555.15.8F 2.01 20.0 45.0 1,374 522 764 900
Value based on dial gage readings

343.2A
------_..__._---_._ .._...._--_ .•.- ._-- --"--'-~--
-47

343.2A -48
TABLE 7: SUMMARY OF STRAIN AND OTHER MECHANICAL ~ PERTIES
Value Strain at ' J"i'l
Material of Strain- Percent Percent EStl
Est2
E Est3 (b)Hardening Elong. reduction
st3 (a)
€st(%) (8in. gage) of area
A web-average 1,.75 20.0 59.2 589 593 503 626It web-median 1.80 20.4 59.0 600 S95 530 602
" flange-average 1.45 21.5 56.0 4,312 697 773 742to £lange~median 1.19 21.5 5'6.0 3,100 697 779 763Ie all-average 1.58 20.3 58.5 2,708 653 657 693II a"ll-median 1.20 21.1 58.7 1,900 670 680 730
B plate-average 1.86 21.2 48.0 2,500 '525 721 585JI plate-median 2.02 21.2 47.2 . 1,500 530 '737 639
" web-average 2.10 21.0 48.4 2,720 541 782 710II web-median ..2~OO 21.0 45.7 2,900 530 820 765.. flange-average 1.95 22.9 '53.7 3,800 510 791 700II flange-median 1.90 22.0 54.8 3,320 542 800 730II all-average 2.00 21.7 50.,0 3,040 525 767 667tI all-median 1.98 21.0 50.0 2,502 540 802 , , 692
A&B plate-average 1.86 '21.2 48.0 2,500 525 721 585JI plate-median 2.02 21.2 47.2 1,500 530 737 639.. web-average 2.02 20.8 50.3 .' (/'-2,360 ) 734 695.. web-median 1.92 20.8 47.6 2,500 539 772 750.. flange-average 1.86 22.7 54.1 3,890 543 ,788 707..
flange-medi~n 1 0 81 21.8 55.2 3,400 575 797 737
" ~ll~avel:"aae 1.94 21,5 51.0 2.98Q 545 7.50 670
" All=m@dlAIl l,9!) 21.0 ~3.6 2,400 !)~O 800 690

343.2A -49
TABLE 8: RATIO cr d / cry ys
Strain rate e = 40 microin./in./sec. approx. (crosshead speed = 0.025. in./min.) I';'~'l
Material Test No. ('yd/ays Material~ Test No. ay/ ays
A 1.1.1W 1.023 B 1.4.1W 1.030tf .1.1.2W 1.042 " 1.4.3W 1.043
" 4.13.1W 1.035 " 1.5.1W 1.045IV 4.13.2W 1.054
...
" 1.5.2W 1.090
It 1.1.3F 1.035 . " 1.6.1W 1.050II 1.1.4F 1.027 II 1.6.2W 1.051
" 4.13.3F 1.032 ." 5 .15 .1W 1.,051Ii 4.13.4F 1.034 II 5.15.2W 1.064
B 1.7.1P l~. 013 B 5.15.5W 1.038 " ,
" 1.7.2P 1.033 " S.15.6W 1.036It 1.7.3P 1.034 II 1.2.2F 1.033
..1.9~lP 1.033 " 1.2.3F 1.026
RI 1.9.2P 10.42- ft 1.3.3F 1.043 '10 1.9.3P 1.040 It 1.4.2F 1.053
" 1.9.4P 1.028 " 1.4.4F 1.027
.. 1.II.iP 1.047 " 1.5.3F [;) 1.032,-,... 1.11.2P 1.062 II 1.5.4F 1.02511 1.11.3P 1.029 " 1.6.3F 1.046It 1.11.4P 1.072 .. 1.6.4F 1.048
" 1.2 0 1W 1.049 " 5.15ll3F 1.050
" 1.2.4W 1.028 " 5~' ~5. 4F 1.05419 1.3.1W 1.030 " 5. 15. 7F 1.050
" 1.3.2W . 1.033 It 5.15.8F ,1.047
Average of all. tests 1.041

343.2A
TABLE 9: ' DATA ON EXPERIMENTAL SCATTER
-50
Property Average StandardDeviation
, Coefficient ofVariation %
C1ys ksi 62.5
est % 1.82
E 2 kai 545st
Est3 (a)ksi 750
Est3 (b)ksi 670
1.992
0.493
101.4,
198.7
185.3 '
3.19
25.40
18.60
26.50
27.70
*For definitions see '~omenc18turet.
," \
,.....
iJ ,
343.2A -51

343.2A -52
I
r-: .":\'.0:-'
100
Ey =CTys/E =~.0021 in.'.in•..4 • I ..
,~.., 1 .• , I
, t-"
I ... f,
• ~. ..... l ~ ~ .......
Est=0.0194 in./in.
, I
2.5 X 10⁻² .....
I '
.. Est2 ~ 545 ksi
Ests.· 710 ksi
I .~
2.0,1.0 !.5
'. Ino/lno
All Values are Avera~e
TOYs -62.5 ksl. ,..
0.5
CTuy =6l'J ksiiCTyd =65.1 ksl
80
20
o
60
(J
ksi
. 40 .
,FIG•.1 IDEALIZED STRESS~STRAIN CURVE ~OR A572 (GRADE 65)
. STEEL (WITH STRAIN-HARDENING) . , ,
." , j fl _
, ',~:; ~,
'j' .~,
.• '"},t.
!' , .
f ,
.'.
" '; :,1:
; ,
i. ," , ,;
, ,

343.2A ... 53
",.)
100 -',
80
crksi
60..;,'
, ,
.' ~ j •
~ , . 'j
'f,.
~. /.'',J<,
'.
40t-
I, '",;
, ,
20, "
, .. "
ot,;
0.05 i,:;, ,', 0.10
C,In./ln.-' I. 1 ~
,': I I' '
r,t,',"
"
j'
.',
,'..
l'" '", It'
J' 'I
~"i "
" ~ \;
': ~ ,
'.':'.:' 'I"~
~I f j ~
,~. ,- .
" ,
FIV.· 2 TYPICAL 'COMPLETE STRE~S-,STRAIN' ,CURVE ~OR ,A572 (GRAD~" 65) S'+EEL, (FROM, TES~ NO.~ 1~6.2W)
/ ~' ~ t ". , . , " i ~
i'

343.2A -54
70 Est2 =545 ksi
OYs =62.5 ksiEst3 =710 ksi .'::,Ji
60 ' A572 (Grade 65) Steel I--Est =0.0194I • ~
a: =52 ksi' . Estl(b) =.705 ksiys
50 A441 (50 ksi)(7 Tests) t--Est ·0.~198
. Est = 572 ksi
it· .." \"., \
:'l":
I ~ ,)'.1 •
"
'I- • .. ~ • r ~ •
',i"" ,;.
r-Est • 0.0177 'i '01:
I~. :,
. ..;\':, ~~\':"f':' "
:: ~ , ,iI 'j , ,
A7(21 Tests)'
(Tys =34.1 ksi
• :' l .~.
40
20
aksJ
30
10.. ' ,,~; , ..
t,•
•
0 0.5 1.0 1.5 2.0 2.5 '" -2I'" 3.0x 10 .
( I,
E, In./in.,."
,)
"
FIG. 3 IDEALIZED STRF,:SS-STRAIN CURVES dF A1, A441 and AS'72 , (GRADE 65) STEELS. 14• I
Values for A7 steel taken from unpublished results of Project 20SB,20SE and 220A at Fritz Lab. ,Values ,0f Es~at'e read,'ss tangents in the, flatter
portion of.. the":curve and l~e soml;lwhere betw.e~r\"Est3 and Esd " "'I to,' i" ,;. ,'f ,I;
.',,1 ;, j I
, J ~~ , ,
'I I",'
;. : ~ <'~. " t. 1 ~

w~w.~
100 •
.. ..
A36.....
. ~-
",." ~.
• -i-, '.
".-,.. ' ........ ~ - ---
A441
~;.. --.. -. - - ~ ..
" .
A572 (65)
'--
... ' ~ ..
':~'
: ~-,
--~- ,"! . .:"".''j . ,--
60
80
-CF
ksi
-',,'·40
.--.
~ .~
-:.....~~.
. ,~- -~ -,. 20
'\,:.
!'"
!- ...
•~
'.,,-
" -
o 0.10 0.20 0.30
E • in./in.
FIG. 4 TYPICAL COMPLETE STRESS-STRAIN CURVES FOR A36 A441 and A572 (GRADE 65) STEELS
,\JllJ1
.....

) ,
343.2A
CF
ksi
jOU~.,\\ '.\ ,;....
'j,'
/'1;:
.' "
"i
,, ,'<M"'j~ ~.
"\ ,;
'. ~- - '-
, .;'
'/-l'
I'"
.-56
,ii,
f , -In./ln. .\ .. " , l
..
.4.

343.2A -57
Modified Onsetof Strain-Hardening
< • I l' '~
,.'.,~' -"'" .
. ,r" '. '! '. ~ ."
, ~ : ., .'. II' ,,I.
...... ".
/ "'. ..'~ ',.' )"'.J~J{':"" ' ,,~~. '. . .' /'.' .,..."' . '~'
'. 't'
0.005
r •. . '
0.002" '
';,I' ,
-"'I,
0.003, 0.007
\ '
. I"
"
.'
I,
, ",' ~~,. , .'
l ~ ..' .. ~ f.~
1'.' . ,'.;t .........'t·
" ,i/. ' ;, '" ",', .' lf~. '~: :-~
," 4"· I,l;. I
'J: -/• .... ~I.~l '
" :,'
Apparent Onsetof Strain-Hardening
w.p0-W
N>
0.0210.018
EST~ .
,-
"*
;;.~ ~..:. • r. •
---.
.~-
,- ........
'I- •
~.~. -~ ~
:. a
,.; .~..- ....... -
-~
-.-;...
0.012
. ,...•...
't ...
0.0090.006
... ".
•
I
0.003· · · , , L,__---.........'_---L.__--'-'__
0.015o
50
40CT
. ksi
30'.--:.;.-
. <--\..
..~ .'-.,-::,.,
..-.1-
E • in. lin. •VIco
FIG. 7 SKETCH DEFINI~G ESt1(b)-~~-{.
~~

343.2A -59
, j ,,' ',;" "
.'; Average =65.1 ksi46 Specimens
.'
~ t .,~ AI •.•.' 'I' to
" ,
60 65',\ '
CTyd • ksi '.. ',', 0,K •. ', ,
" -
, : '~ ..
, 10
30
'/,'
~20
FREQUENCY, 0/0
FIG.S' DYNAMI.~/:,fELDsrRE~sLEVEL' cJyd:' HISTOGRAM• ' L ~'~:' (1 ~. ••• "., •
, \ "
' .. " ' 1", ",', "._,'
, l
.. "
" ,',
~ ",
,Average 62.5 ksi .'46 Specim~ns'
'I'
'f ':
.,' .',,",' ~~!J..
, 60 65, .. : :,;\,,' 70 ~,;.',.
,::' ." OYs.' ksi ,/'0, " " ,; ,0,
',_I· .:
,,\--.--.~-a.-.......a.-&--.a-__.........--...
l ," '.
",
'0
, .
•• 0 '
,30
10
, '.," '
20
FREQUENC,Y0/0 -. '
" ,
. '.' ,. " ,:" ••• > "
I,

343.2A -60
, '
•• ,',.l1
,,', I.'
" ,
• I
,r
, " ..
".1
\'-,
'~¥'.Ji • '.
I'
, "'1' :'~ '~-, • •
\", ~:t,,i'
" ,
.. . • ".' :-- ... I~.
, t \ j • ..lI I .•..~; .' ~
... ,~':>. ,,~.~ ~ , , ',':, .. t,
, 'I~ ~ ,
Average =0.0194: · 45, Specimen~ ,"::, ~':.,.I .( /~
IIIIII
Average =86.1 ksl ~
43 Specimens
:.' ........ "
~ ~. '
.~<', " ":" "'f',
",. ,"'.''',~,
85
. '".'. (Tu' ksi, .. "
~ L ~ I'~ I "
,f·~ ~j
80
I I • ,, ,
FIG.I
, 10 ~ TENSILE, STRENGTH C1 : .' HISTOGRAM'~,·M.. ",,',' 'f .,', ',U' , '\ >. "'" ,':' , .;:
,I i" , :" :."". .-' ,', ,:.. '," ." '~ ;' ":',Ii ..;, I· ~ •
't·
~ 1;. ; -; ~ ~
II, ~J. r:
o
25 ·
o
50
50
, ..
FREQUENCY0/0
FREQUENCY0/0
- e',
"',' .' Est t In.lln. .•..",,, "'.' f ;,
l ,~ ~ I .. • , ~
,l ,): •• i'
!. '" ",' "
FIG. 1'1 'STRAIN ATONSm:',~F ST~IN~!H'ARD~ING".,es~;! :~~STO~:." . '. '. ": '(',"', '.,'. . '.,' t., '-':'" . ",,-,' ',:",",> '.' .' :1,';.•.• ;', ..••. .-_. ".' '.":'"
t',",:" '. "," ." "
,./O'f

343.2A' -61
50
FREQUENCY0/0
I Average =21.5 0/0
l43 Specimens
I, .
~' :
.' ....
, .... -
"
\
.'-, ~.. ~f .... ,.
" '
.', ' .... !,_.
.... ' .
o" ....
'20 25 30
PERCENT ELONGATION ~
35
i.' l j<
l! ,~ j ... ,
,,' .
I. '
l " ,;~, ,,' ', ; :;' I' .' : ;: ,', ~ .' :
, ~.... '. ~"
. '~ . FIG. 12 '. . PERCENT ELONGATION :" . HISTOGRAM ,. ,,'.•• ; . ~. .4 I I t I
~ I ' I t~ . f 1. "
"oj.e'~. 1
I 'r~·
" :~
..,
"
.f'
l'
, "
'., ',,-,1, ','I ,.\';.
,.
, .I
~ I • '\. ,." •
.j I ,
Lt ..~ .'." It';' : .: .. <
,! .,
': ,"'.' .'.1'
1 ',~ ! :t" 1 l. .(!,', 1';:;' , " ...
Average =545 ksi,43 Speclme~s
, ,, .....~ ,'.., '''''''''i\,
''0 '
\.,." '
, , • , , ~ I, -
" i.' .• ",' ',', -::1.00 800';;1 v
E " ':': ....~ ,. st2. ksl : ':< ",", ','
, ".. ~ ~ '.. , ..'·,to-:"" I\, _--...-..~ ....---.-Ao_....
.'
, '
\ ,
" .. ,
t I ~.
" I
50
·25
'f
. ' .
" . -

343.2A -62
:.
I ,.."
. .. :
~ j ,
i ' ',,"
,. :, ;
1500. . .",~ ","
' ..
'1'.'
I Average =750 ksiI 43 SpeelmensIIIIII
IIIIII
).
":,.' ...• 01 11 . "
I '
30
. ...' '
"~ , -, ",I~" • 0' t. • 500 1000" ..I '," \ ,,,,' \' ,
.' .. ~':.',;' Est3(al • ksl '
20
FREQU~NCYOJ '· to ,.
, ..
.', , : ,", ,, ", ,'..... "' "':
... .... ;, ~.
"r t
.) .L
I'
• " 1 '..; - I ...' ~. '
. ~
, , ;', • i ' ~
l" t'
.. . ~ ,~ I
~ ',"
, '!t ,: 4~ , '_', ,
--\::'! t., :1'" " '~ •• 'I~ ,~ ..
, \
I f ~ I
, ~ I •
Average =670 ksl ~
I 41 Specimens :'c',>I '...... ;, -,I
-I
I
I ~ " .~
" ",
r \"i,'I"-f,, "
,- ~ '.,""
",-- ., " .\ "" 1.",-" .- I.
',,",.,' , ", i
" .• 'f )
'. • t
~..,' '
,','., ':' .
j'
I" "
.",'
".',':' "-~" 10, . I, f" '
• .', ~ I 'r
- I~' ~
· ~,<""Y'" 30
'~, f
, .'
20
FREQUENCY0/0 ,.
-/ '
. , .',.
l'\
..
". ..
"
", oj'
·,1'
1 .
t ~. j
• " >' '~' ;


343.2A
10. REFERENCES
-64
1. AISCMANUAL OF STEEL CONSTRUCTION, American Institute of Steel Construction, New York, N. Y.) Sixth Edition, Third Revised Printing, 1966.
2. ASTM1968 BOOK OF ASTM STANDARDS PART 4, American Society for Testingand Materials, Philadelphia, Pa.1968.
3 . Adams, P. F.PLASTIC DESIGN IN HIGH STRENGTH STEEL, Fritz Engineering Laboratory Report No. 297.19, May 1966.
4. Johnston, B. G., EditorCOLuMN RESEARCH COUNCIL: GUIDE TO ·DESIGN CRITERIA FOR METALCOMPRESSION MEMBERS, John Wiley & Sons, Inc. New York, No Y.,1966.
5. McClintock, F. A. & Argon, A. S., Editors nMECHANIcAL BEHAVIOR OF MATERIALS, Addison·-Wesley PublishingCo., Inc., Reading, Mass., 19660 1\
I/ L~
6 4 Rao, N. R., <Lohrmann, M. & Tall, L.EFFECT OF STRAIN RATE ON THE YIELD STRESS OF STRUCTURAL STEELS,Journal of Materials, Vol. 1, No, 1, March 1966, American Societyfor Testing and ~aterials, Philadelphia, Pa.
7. Adams) p. F., Lay, M. Go and Galambos, T. V.EXPERIMENTS ON HIGH STRENGTH STEEL MEMBERS, Fritz EngineeringLaboratory Report No~ 297.8, July 1964D
8(0 Haaijer, G.BUCKLING OF UNIFORMLY COMPRESSED STEEL PLATES IN THE STRAINHARDENING RANGE, Frtiz Engineering Laboratory Report No. 20SE.7August 1956 D
98 Ramberg, W. and Osgood, Re
DESCRIPTION OF STRESS-STRAIN CURVES BY THREE PARAMETERS, NACA TN902, 19438
lOll Lay, M. GoTHE STATIC LOAD-DEFORMATION BEHAVIOR OF PLANAR STEEL STRUCTURES,Fritz Engineering Laboratory Report No. 207.6, April 1964~
11. ASTMASTM MANUAL ON QUALITY CONTROL OF MATERIALS, STP15-C, AmericanSociety for Testing and Materials, Philadelphia, Pa. 1951.
343.2A
12. Tall, L.MATERIAL PROPERTIES OF STEEL, Fritz. Engineering LaboratoryRe-Vort No~ 220A.28, 1957.
13. Beedle, L. S.PLASTIC DESIGN OF STEEL FRAMES, John Wiley & Sons, Inc., NewYork, N. Y., 1958.
14. Adams, p. F.DETERMINATION OF THE STATIC YIELD LEVEL AND THE STRAIN -HARDENINGMODULUS, Fritz Engineering Laboratory Report No. 297.7 March 1964.
-65