channel islands 2013 deep sea coral cruise addendum report ... · sandy veneer. additional needed...
TRANSCRIPT

2013 CINMS DSC Cruise Addendum Report 1
Channel Islands 2013 Deep Sea Coral Cruise Addendum Report Channel Islands National Marine Sanctuary
R. Freedman and C. Caldow 2015
Purpose: The Channel Islands National Marine Sanctuary (CINMS) is one of 13 protected national marine sanctuaries and one marine national monument under NOAA governance (Figure 1). Originally designated in 1980 to protect its biodiversity, the sanctuary encompasses the waters six miles off the five northern most Channel Islands: Anacapa, Santa Cruz, Santa Rosa, San Miguel and Santa Barbara islands. The sanctuary is known to be home to thriving deep sea coral communities; however, the extent of these communities within sanctuary boundaries remains unknown. In an effort to fill in some of these information gaps, CINMS initiated a series of partnerships to explore these uncharted regions. In 2011, CINMS teamed with NOAA’s Ocean Exploration Program aboard the R/V Okeanos Explorer to map deep water habitats around the Channel Islands (Okeanos Mission EX1101). In 2013 (the focus of this report), the sanctuary with the support of NOAA’s Deep Sea Coral Research and Technology Program (DSCRTP) returned to the shallower areas mapped in 2011 (100-600 m depth), with an ROV to identify and characterize deep sea coral habitat. CINMS and the Marine Applied Research and Exploration (MARE) conducted the field operations and the Institute for Applied Marine Ecology (IfAME) at California State University Monterey Bay produced a report on preliminary findings from the project.
Cruise Overview: In 2013, MARE and the research team at CINMS conducted a series of ROV dives from the R/V Shearwater to identify and characterize the deep sea coral and sponge communities in the areas mapped by the R/V Okeanos Explorer in 2011 (Lobecker 2011). Using the ROV Beagle, the research party conducted 9 dives around the south side of the Santa Cruz, Santa Rosa and San Miguel Islands (Table 1 and Figure 2). The ROV Beagle was outfitted with five cameras and lighting equipment, sizing lasers, and a CTD with DO2 sensors. Transects were conducted approximately 0.1-0.3 m from the seafloor at a speed of about 0.5-0.7 knots. In total, the mission collected 41.2 hours of ROV imagery across the 9 transects and CTD data from each dive.
Cruise Data Analysis: The Institute for Applied Marine Ecology (IfAME) at California State University Monterey Bay submitted a report summarizing the video data from the 2013 cruise. The group quantified bottom type as well as the amount and size of corals, sea pens, sponges and gorgonians. IfAME covered a total of 22,255 m2 of seafloor; producing 11,127 video frames. Across all transects, corals were in 18% of the frames and sponges were in 25% (Figure 3). In total, IfAME found 1,134 hard corals, 95 soft corals, 2,306 pens/whips and 629 sponges over 20 cm (smaller sponges were not quantified). IfAME did not identify down to species level for any of the invertebrate community and also did not quantify the fish in transects.
IfAME also quantified the benthic habitat into bottom type classifications based on the sediment or bottom type. Their habitat classification by transect number can be found in their report. IfAME researchers found a number of relationships between species abundance and the habitat availability. A positive correlation between sponge abundance and cobble/boulder habitats was found. Larger

2013 CINMS DSC Cruise Addendum Report 2
substrates were also correlated with larger sponges. Hard corals also exhibited a positive relationship with hard substrate, while soft corals were most strongly associated with hard substrates that had a sandy veneer.
Additional Needed Information: The IfAME report did not include the location of dives or any associated environmental data. This addendum is meant to fill in these information gaps.
The first dives conducted were to the east of San Miguel Island over EX1101 Area 1 (Figure 4). Dive1/Transect 14 was the first dive and is the farthest east. It has no associated CTD data but was conducted over a depth range of approximately 293 m to 531 m. Dive2/Transect 12 was conducted next and was closer to San Miguel. Dive 2 was conducted from 117 m to 592 m and it’s CTD dive profile can be seen in Figure 5. Both transects 12 and 14 were dominated by soft sediments (IfAME 2013).
Three transects were conducted to the southwest of Santa Rosa Island over EX1101 Area 2 (Figure 6): Dive 3/Transect 9, Dive 8/Transect 8, Dive 9/Transect 10. Dive 3/Transect 10 was conducted between 323 m and 446 m, was composed of about 65% hard substrate, and its CTD dive profile can be seen in Figure 7A. Dive 8/Transect 8 was conducted between 336 m and 453 m, was composed of about 60% hard substrate, and its CTD dive profile can be seen in Figure 7B. Dive 9/Transect 10 was conducted between 338 m and 468 m, was composed of about 50% hard substrate, and its CTD dive profile can be seen in Figure 7C (see IfAME 2013 for substrate percentages).
There were four dives conducted to the southwest of Santa Cruz Island over EX1101 Area 3 (Figure 8): Dive 4/Transect 5, Dive 5/Transect 4, Dive 6/Transect 2, Dive7/Transect 3. Dive 4/Transect 5 was conducted between 297 m and 607 m, was composed of about 10% hard substrate, and its CTD dive profile can be seen in Figure 8A. Dive 5/Transect 4 was conducted between 156 m and 581 m, was composed of > 10% hard substrate, and its CTD dive profile can be seen in Figure 8B. Dive 6/Transect 2 was conducted between 230 m and 600 m, was composed of about 45% hard substrate, and its CTD dive profile can be seen in Figure 8C. Dive7/Transect 3 was conducted between 106 m and 620 m, was composed of about 50% hard substrate, and its CTD dive profile can be seen in Figure 8D(see IfAME 2013 for substrate percentages) .
Future Work: Quantification of transects down to species for corals, other invertebrates and fish communities would be helpful for CINMS to have in order to understand the distribution and abundance of these resources. This is critical for spatial management when deep sea projects, like submarine cable placement, must be reviewed by sanctuary managers. These data are also critical to inform spatial distribution models.
Additionally, temperature and oxygen tended to fall with depth and CINMS is trying to quantify how these environmental parameters affect deep sea habitats. Research with NCCOS around the Channel Islands seeks to understand how deep sea corals are affected by ocean acidification. Deep sea corals around the Channel Islands are in some of the most acidic habitats in the world and current work is dedicated to understanding how resilient these corals will be to increasing acidic conditions.

2013 CINMS DSC Cruise Addendum Report 3
Cited Work
Lindholm J., A. Cramer and A. Braddock (2013) Distribution and Abundance of Selected Corals and Sponges in the Channel Islands National Marine Sanctuary as Determined from ROV Video Imagry. Prepared for: The Channel Islands National Marine Sanctuary. Project # NCND6022-12-02931
Lobecker M. (2001) California Shakedown Cruise 2011: Exploring California’s National Marine Sanctuaries. NOAA Office of Ocean Exploration and Research. Found at: http://oceanexplorer.noaa.gov/okeanos/explorations/ex1101/welcome.html

2013 CINMS DSC Cruise Addendum Report 4
Table 1: The locations, dates and times of each ROV dive are shown below
Dive
Site Date Start Time
End Time
IfAME Transect
Line Number
Starting Latitude
Starting Longitude
Ending Latitude
Ending Longitude
1 San Miguel Island
6/11/2013 21:45:09 1:02:06 14 34.02563 -120.59811 34.05672 -120.57716
2 San Miguel Island
6/12/2013 15:44:25 18:51:47 12 33.99586 -120.53595 34.01764 -120.50385
3 Santa Rosa Island
6/12/2013 21:51:28 23:23:00 9 33.84353 -120.18012 33.83854 -120.18998
4 Santa Cruz Island
6/13/2013 15:50:17 18:10:02 5 33.86073 -119.86912 33.86170 -119.89054
5 Santa Cruz Island
6/13/2013 20:13:02 23:31:00 4 33.88615 -119.86513 33.88496 -119.91029
6 Santa Cruz Island
6/14/2013 14:46:33 17:05:27 2 33.91211 -119.78979 33.92874 -119.78951
7 Santa Cruz Island
6/14/2013 19:13:53 23:22:29 3 33.905363 -119.79779 33.92555 -119.82952
8 Santa Rosa Island
6/15/2013 14:40:53 16:29:16 8 33.82272 -120.17008 33.82197 -120.18465
9 Santa Rosa Island
6/15/2013 18:01:14 19:50:42 10 33.86108 -120.20460 33.84809 -120.20982

2013 CINMS DSC Cruise Addendum Report 5
Figure 1: The Channel Islands National Marine Sanctuary is shown by the white boundary line and consists of the protected waters six miles off the 5 northern Channel Islands. Sanctuary managers protect the islands through a series of spatial management tools, including the marine reserves shown in red.
2013 CINMS DSC Cruise Addendum Report 6
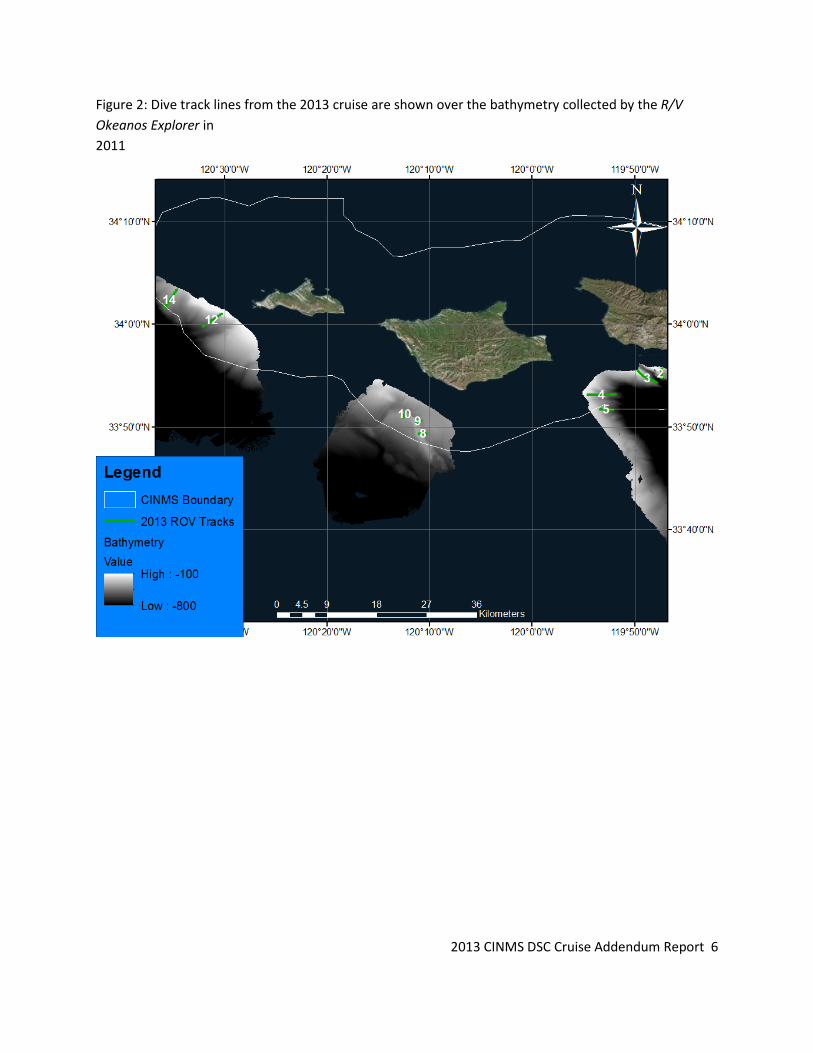
Figure 2: Dive track lines from the 2013 cruise are shown over the bathymetry collected by the R/V Okeanos Explorer in 2011

2013 CINMS DSC Cruise Addendum Report 7
Figure 3: Figure 3A shows the percentage of frames across all transects that contained coral which includes hard coral, soft coral and sea pens/whips. Figure 3B shows the percentage of frames that contained sponges

2013 CINMS DSC Cruise Addendum Report 8
Figure 4: The transect lines for the dives off San Miguel Island are shown by transect number over the the bathmetry collected by the Okeanos Explorer (EX1101 Area 1).

2013 CINMS DSC Cruise Addendum Report 9
Figure 5: The CTD dive profile for Dive 2/Transect 12. Dissolved oxygen (ppm) is in blue, temperature (°C) in red and salinity (ppt) is in Green.

2013 CINMS DSC Cruise Addendum Report 10
Figure 6: The transects southwest of Santa Rosa are shown by transect number over the bathymetry collected by the Okeanos Explorer (EX1101 Area 2).

2013 CINMS DSC Cruise Addendum Report 11
Figure 7: CTD Dive profiles for transects around Santa Rosa Island are shown here. Please note the changes in scale between each dive. Dissolved Oxygen (ppm) is in blue, Temperature (°C) in red and Salinity (ppt) is in Green. (A) Dive 3/Transect 9, (B) Dive 8/Transect 8, and (C) Dive 9/Transect 10.
C
A B

2013 CINMS DSC Cruise Addendum Report 12
Figure 8: The transects southwest of Santa Cruz are shown by transect number over the bathymetry collected by the Okeanos Explorer (EX1101 Area 3).

2013 CINMS DSC Cruise Addendum Report 13
Figure 9: CTD Dive profiles for transects around Santa Cruz Island are shown here. Please note the changes in scale between each dive. Dissolved Oxygen (ppm) is in blue, Temperature (°C) in red and Salinity (ppt) is in Green. (A) Dive 4/Transect 5, (B) Dive 5/Transect 4, (C) Dive 6/Transect 2, and (D) Dive7/Transect 3.
A
B
C D