channel islands beach community services district …
TRANSCRIPT
CHANNEL ISLANDS BEACH
COMMUNITY SERVICES DISTRICT
ANNUAL AUDIT REPORT
Years Ended June 30, 2015 and 2014


Channel Islands Beach Community Services District Annual Audit Report
Years Ended June 30, 2015 and 2014
TABLE OF CONTENTS PAGE
I. INDEPENDENT AUDITORS' REPORT 1 - 2
II. MANAGEMENT’S DISCUSSION AND ANALYSIS 3 - 6
III. BASIC FINANCIAL STATEMENTS Statements of Net Position 7 - 8 Statements of Revenues, Expenses and Changes in Net Position 9 - 11 Statements of Cash Flows 12 - 13 Notes to Financial Statements 14 - 27
IV. SUPPLEMENTAL INFORMATION SECTION Schedule of Revenues and Expenses - Budget to Actual - All Activities 28 - 30 Schedule of Revenues and Expenses - Budget to Actual - Water 31 - 33 Schedule of Revenues and Expenses - Budget to Actual - Wastewater 34 - 36 Schedule of Revenues and Expenses - Budget to Actual - Solid Waste Disposal 37 - 38 Schedule of Revenues and Expenses - Budget to Actual - Community Service 39 - 40

ii F?S TEAMAN, RAMIREZ & SMITH, INC. CERTIFIED PUBLIC ACCOUNTANTS
INDEPENDENT AT..JIMTORS' REPORT
Board of Directors Channel Islands Beach Community
Services District Oxnard, CA
Report on the Financial Statements
We have audited the accompanying financial statements of the Channel Islands Beach Community Services District (the "District"), as of and for the years ended June 30, 2015 and 2014, and the related notes to the financial statements, which collectively comprise the District's basic financial statements as listed in the table of contents.
Management's Responsibility for the Financial Statements
Management is responsible for the preparation and fair presentation of these fmancial statements in accordance with accounting principles generally accepted in the United States of America; this includes the design, implementation, and maintenance of internal control relevant to the preparation and fair presentation of financial statements that are free from material misstatement, whether due to fraud or error.
Auditor's Responsibility
Our responsibility is to express opinions on these financial statements based on our audit. We conducted our audit in accordance with auditing standards generally accepted in the United States of America and the standards applicable to financial audits contained in Government Auditing Standards, issued by the Comptroller General of the United States. Those standards require that we plan and perform the audit to obtain reasonable assurance about whether the financial statements are free from material misstatement.
An audit involves performing procedures to obtain audit evidence about the amounts and disclosures in the financial statements. The procedures selected depend on the auditor's judgment, including the assessment of the risks of material misstatement of the financial statements, whether due to fraud or error. In making those risk assessments, the auditor considers internal control relevant to the District's preparation and fair presentation of the financial statements in order to design audit procedures that are appropriate in the circumstances, but not for the purpose of expressing an opinion on the effectiveness of the District's internal control. Accordingly, we express no such opinion. An audit also includes evaluating the appropriateness of accounting policies used and the reasonableness of significant accounting estimates made by management, as well as evaluating the overall presentation of the financial statements.
We believe that the audit evidence we have obtained is sufficient and appropriate to provide a basis for our audit opinions.
Opinions
In our opinion, the financial statements referred to above present fairly, in all material respects, the respective fmancial position of the Channel Islands Beach Community Services District, as of June 30, 2015 and 2014, and the respective changes in fmancial position, and its cash flows for the years then ended in accordance with accounting principles generally accepted in the United States of America.
Richard A. Teamar,, CPA s David M. Ramirez, CPA • Javier H. Carrillo, CPA
4201 Brockton Ave. Suite 100, Riverside CA 92501 • 951.274.9500.951.274.7828 FAX• www.trscpas.com


Other Matters Required Supplementary Information Accounting principles generally accepted in the United States of America require that the management's discussion and analysis on pages 3 through 6 be presented to supplement the basic financial statements. Such information, although not a part of the basic financial statements, is required by the Governmental Accounting Standards Board, who considers it to be an essential part of financial reporting for placing the basic financial statements in an appropriate operational, economic, or historical context. We have applied certain limited procedures to the required supplementary information in accordance with auditing standards generally accepted in the United States of America, which consisted of inquiries of management about the methods of preparing the information and comparing the information for consistency with management's responses to our inquiries, the basic financial statements, and other knowledge we obtained during our audit of the basic financial statements. We do not express an opinion or provide any assurance on the information because the limited procedures do not provide us with sufficient evidence to express an opinion or provide any assurance. Other Information Our audit was conducted for the purpose of forming opinions on the financial statements that collectively comprise the Channel Islands Beach Community Services District’s basic financial statements. The supplemental information section is presented for the purpose of additional analysis and is not a required part of the basic financial statements. The supplemental information section is the responsibility of management and was derived from and relate directly to the underlying accounting and other records used to prepare the basic financial statements. Such information has been subjected to the auditing procedures applied in the audit of the basic financial statements and certain additional procedures, including comparing and reconciling such information directly to the underlying accounting and other records used to prepare the basic financial statements or to the basic financial statements themselves, and other additional procedures in accordance with auditing standards generally accepted in the United States of America. In our opinion, the supplemental information section is fairly stated in all material respects in relation to the basic financial statements as a whole. Other Reporting Required by Government Auditing Standards In accordance with Government Auditing Standards, we have also issued our reported dated March 2, 2016, on our consideration of the District’s internal control over financial reporting and on our tests of its compliance with certain provisions of laws, regulations, contracts, and grant agreements and other matters. The purpose of that report is to describe the scope of our testing of internal control over financial reporting and compliance and the results of that testing, and not to provide an opinion on internal control over financial reporting or on compliance. That report is an integral part of an audit performed in accordance with Government Auditing Standards in considering the District’s internal control over financial reporting and compliance.
Riverside, California March 2, 2016


3
MANAGEMENT’S DISCUSSION AND ANALYSIS
As management of the Channel Islands Beach Community Services District, we offer readers of the Channel Islands Beach Community Services District’s financial statements this narrative overview and analysis of the Channel Islands Beach Community Services District and its financial activities for the fiscal year ended June 30, 2015.
OVERVIEW FINANCIAL STATEMENTS
This discussion and analysis serves as an introduction to the District’s basic financial statements. The District’s basic financial statements reflect the combined results of the Operating and Capital Programs and include four components: 1) Statements of Net Position; 2) Statements of Revenues, Expenses and Changes in Net Position; 3) Statements of Cash Flows; and, 4) Notes to the Financial Statements. In addition to the basic financial statements, supplementary information is also presented. The Statement of Net Position presents information on all of the District’s assets, liabilities, and deferred inflows/outflows of resources with the difference between the two reported as net position. Over time, increases or decreases in net position may serve as a useful indicator of whether the financial position of the District is improving or deteriorating. The Statement of Revenues, Expenses and Changes in Net Position present information showing how the District’s net position changed during the year. All changes in net position are reported as soon as the underlying event giving rise to the change occurs, regardless of the timing of related cash flows. Thus, revenues and expenses are reported in this statement for some items that will only result in cash flows in future fiscal periods (e.g., depreciation). The Statement of Cash Flows presents information regarding the District’s use of cash during the year. Cash flows will differ from revenues and expenses because the statement accounts only for transactions that resulted in the District’s receipt or payment of cash during the year.
FINANCIAL HIGHLIGHTS SIGNIFICANT EVENTS AND TRANSACTIONS The Board of Directors restricted the following amounts to their respective utilities:
Water - $1,690,491 for future unanticipated repairs and maintenance of the water distribution system, a $138,000 operating reserve and $467,858 for rate stabilization.
Sewer - $82,000 operating reserve and $780,345 for rate stabilization and $1,033,450 for unanticipated repairs and maintenance.
Trash - $60,000 operating reserve and $346,236 for rate stabilization.
4
Capital assets increased by $2,227,964. Most of the increase was due to capital expenditures related to construction of sewer lines.
Accounts payable has increased by $214,309, most of which is related to sewer line construction.
The District has not revised the rate structure for services in recent years; however the board periodically reviews the cost of providing services, future maintenance requirements of the District’s infrastructures and future capital expenditures needs in order to set new rates for the District’s services. The board anticipates such changes will take place in the near term to maintain the level of services provided by the District.
FINANCIAL STATEMENTS
NET POSITION
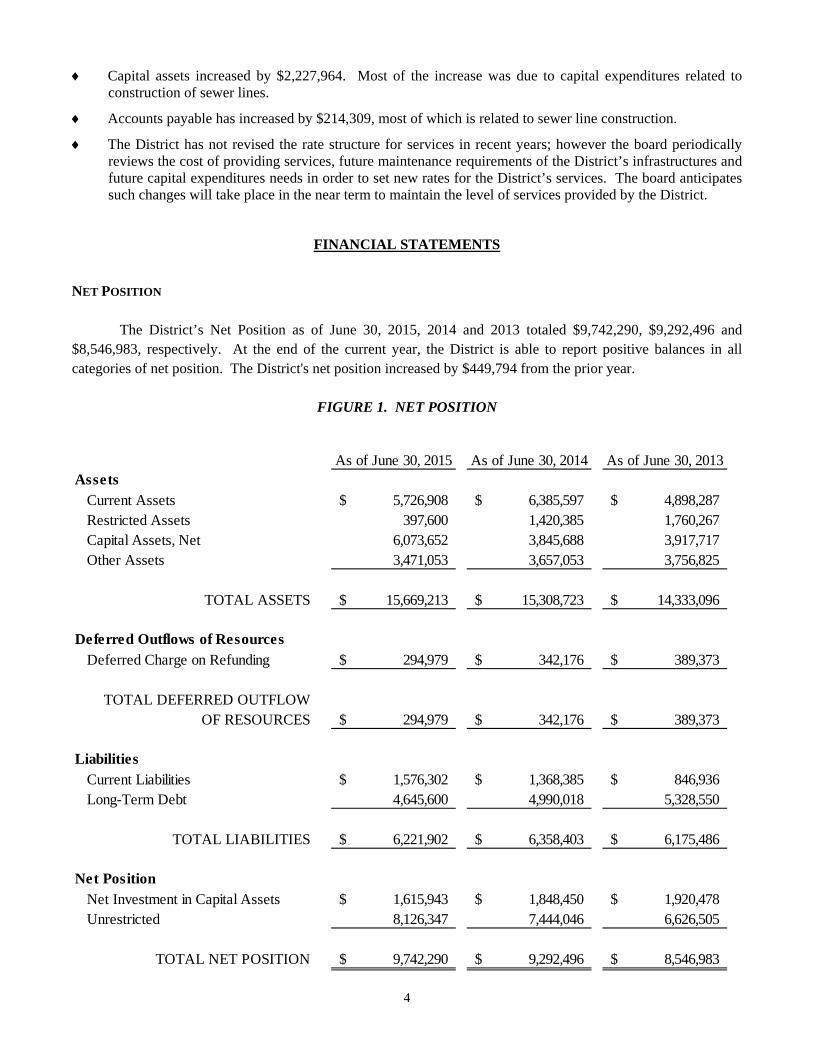
The District’s Net Position as of June 30, 2015, 2014 and 2013 totaled $9,742,290, $9,292,496 and
$8,546,983, respectively. At the end of the current year, the District is able to report positive balances in all categories of net position. The District's net position increased by $449,794 from the prior year.
FIGURE 1. NET POSITION
As of June 30, 2015 As of June 30, 2014 As of June 30, 2013Assets
Current Assets 5,726,908$ 6,385,597$ 4,898,287$ Restricted Assets 397,600 1,420,385 1,760,267 Capital Assets, Net 6,073,652 3,845,688 3,917,717 Other Assets 3,471,053 3,657,053 3,756,825
TOTAL ASSETS 15,669,213$ 15,308,723$ 14,333,096$
Deferred Outflows of ResourcesDeferred Charge on Refunding 294,979$ 342,176$ 389,373$
TOTAL DEFERRED OUTFLOWOF RESOURCES 294,979$ 342,176$ 389,373$
LiabilitiesCurrent Liabilities 1,576,302$ 1,368,385$ 846,936$ Long-Term Debt 4,645,600 4,990,018 5,328,550
TOTAL LIABILITIES 6,221,902$ 6,358,403$ 6,175,486$
Net PositionNet Investment in Capital Assets 1,615,943$ 1,848,450$ 1,920,478$ Unrestricted 8,126,347 7,444,046 6,626,505
TOTAL NET POSITION 9,742,290$ 9,292,496$ 8,546,983$
5
Total assets increased by $360,490, which is mostly because of the construction of new sewer lines. Total liabilities decreased by $136,501 which is mostly due to principal payments made on the outstanding sewer and water bonds. REVENUES, EXPENSES AND CHANGES IN NET POSITION
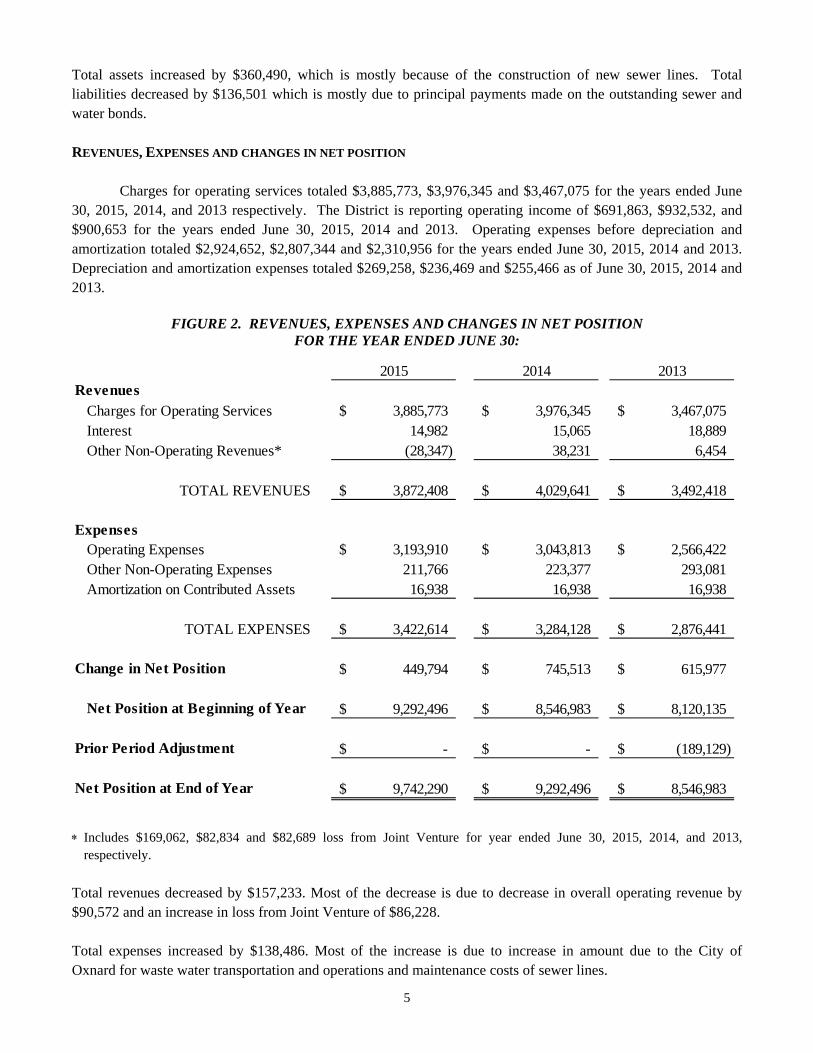
Charges for operating services totaled $3,885,773, $3,976,345 and $3,467,075 for the years ended June
30, 2015, 2014, and 2013 respectively. The District is reporting operating income of $691,863, $932,532, and $900,653 for the years ended June 30, 2015, 2014 and 2013. Operating expenses before depreciation and amortization totaled $2,924,652, $2,807,344 and $2,310,956 for the years ended June 30, 2015, 2014 and 2013. Depreciation and amortization expenses totaled $269,258, $236,469 and $255,466 as of June 30, 2015, 2014 and 2013.
FIGURE 2. REVENUES, EXPENSES AND CHANGES IN NET POSITION
FOR THE YEAR ENDED JUNE 30:
2015 2014 2013Revenues
Charges for Operating Services 3,885,773$ 3,976,345$ 3,467,075$ Interest 14,982 15,065 18,889 Other Non-Operating Revenues* (28,347) 38,231 6,454
TOTAL REVENUES 3,872,408$ 4,029,641$ 3,492,418$
ExpensesOperating Expenses 3,193,910$ 3,043,813$ 2,566,422$ Other Non-Operating Expenses 211,766 223,377 293,081 Amortization on Contributed Assets 16,938 16,938 16,938
TOTAL EXPENSES 3,422,614$ 3,284,128$ 2,876,441$
Change in Net Position 449,794$ 745,513$ 615,977$
Net Position at Beginning of Year 9,292,496$ 8,546,983$ 8,120,135$
Prior Period Adjustment -$ -$ (189,129)$
Net Position at End of Year 9,742,290$ 9,292,496$ 8,546,983$
Includes $169,062, $82,834 and $82,689 loss from Joint Venture for year ended June 30, 2015, 2014, and 2013, respectively.
Total revenues decreased by $157,233. Most of the decrease is due to decrease in overall operating revenue by $90,572 and an increase in loss from Joint Venture of $86,228. Total expenses increased by $138,486. Most of the increase is due to increase in amount due to the City of Oxnard for waste water transportation and operations and maintenance costs of sewer lines.
6
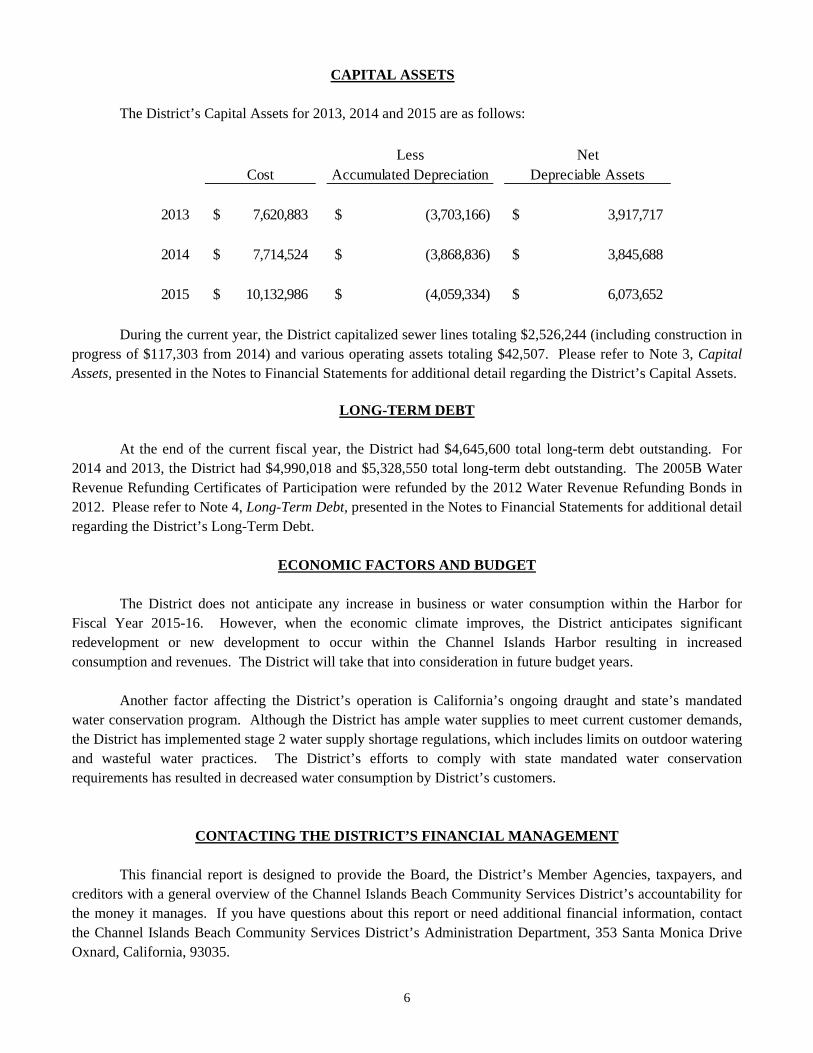
CAPITAL ASSETS The District’s Capital Assets for 2013, 2014 and 2015 are as follows:
Less NetCost Accumulated Depreciation Depreciable Assets
2013 7,620,883$ (3,703,166)$ 3,917,717$
2014 7,714,524$ (3,868,836)$ 3,845,688$
2015 10,132,986$ (4,059,334)$ 6,073,652$ During the current year, the District capitalized sewer lines totaling $2,526,244 (including construction in
progress of $117,303 from 2014) and various operating assets totaling $42,507. Please refer to Note 3, Capital Assets, presented in the Notes to Financial Statements for additional detail regarding the District’s Capital Assets.
LONG-TERM DEBT
At the end of the current fiscal year, the District had $4,645,600 total long-term debt outstanding. For 2014 and 2013, the District had $4,990,018 and $5,328,550 total long-term debt outstanding. The 2005B Water Revenue Refunding Certificates of Participation were refunded by the 2012 Water Revenue Refunding Bonds in 2012. Please refer to Note 4, Long-Term Debt, presented in the Notes to Financial Statements for additional detail regarding the District’s Long-Term Debt.
ECONOMIC FACTORS AND BUDGET
The District does not anticipate any increase in business or water consumption within the Harbor for Fiscal Year 2015-16. However, when the economic climate improves, the District anticipates significant redevelopment or new development to occur within the Channel Islands Harbor resulting in increased consumption and revenues. The District will take that into consideration in future budget years.
Another factor affecting the District’s operation is California’s ongoing draught and state’s mandated water conservation program. Although the District has ample water supplies to meet current customer demands, the District has implemented stage 2 water supply shortage regulations, which includes limits on outdoor watering and wasteful water practices. The District’s efforts to comply with state mandated water conservation requirements has resulted in decreased water consumption by District’s customers.
CONTACTING THE DISTRICT’S FINANCIAL MANAGEMENT This financial report is designed to provide the Board, the District’s Member Agencies, taxpayers, and creditors with a general overview of the Channel Islands Beach Community Services District’s accountability for the money it manages. If you have questions about this report or need additional financial information, contact the Channel Islands Beach Community Services District’s Administration Department, 353 Santa Monica Drive Oxnard, California, 93035.
BASIC FINANCIAL STATEMENTS


2015 2014
ASSETS Current Assets:
Unrestricted Cash (Notes 1 and 2) 105,000$ 105,000$ Board Restricted Cash and Cash Equivalents (Notes 1 and 2) 4,598,380 5,229,958 Accounts Receivable (Note 1) 422,209 446,819 Other Receivable (Note 1) 566,626 560,485 Interest Receivable 3,891 4,012 Prepaid Items 10,283 10,718 Inventory (Note 1) 20,519 28,605
Total Current Assets 5,726,908 6,385,597
Noncurrent Assets: Restricted Assets:
Cash and Cash Equivalents (Notes 1, 2, and 4) 397,600 1,420,385 Land and Construction in Progress, Not Being Depreciated (Note 3) 42,060 159,363 Capital Assets, Net of Depreciation (Note 3) 6,031,592 3,686,325
Total Noncurrent Assets 6,471,252 5,266,073
OTHER ASSETSInvestment in Water JPA, Net of Accumulated Depreciation (Note 9) 3,471,053 3,657,053
Total Other Assets 3,471,053 3,657,053
Total Assets 15,669,213 15,308,723
DEFERRED OUTFLOWS OF RESOURCESDeferred Charge on Refunding 294,979 342,176
Total Deferred Outflows of Resources 294,979$ 342,176$
June 30, 2015 and 2014
Channel Islands Beach Community Services DistrictStatements of Net Position
The accompanying notes are an integral part of these statements.7
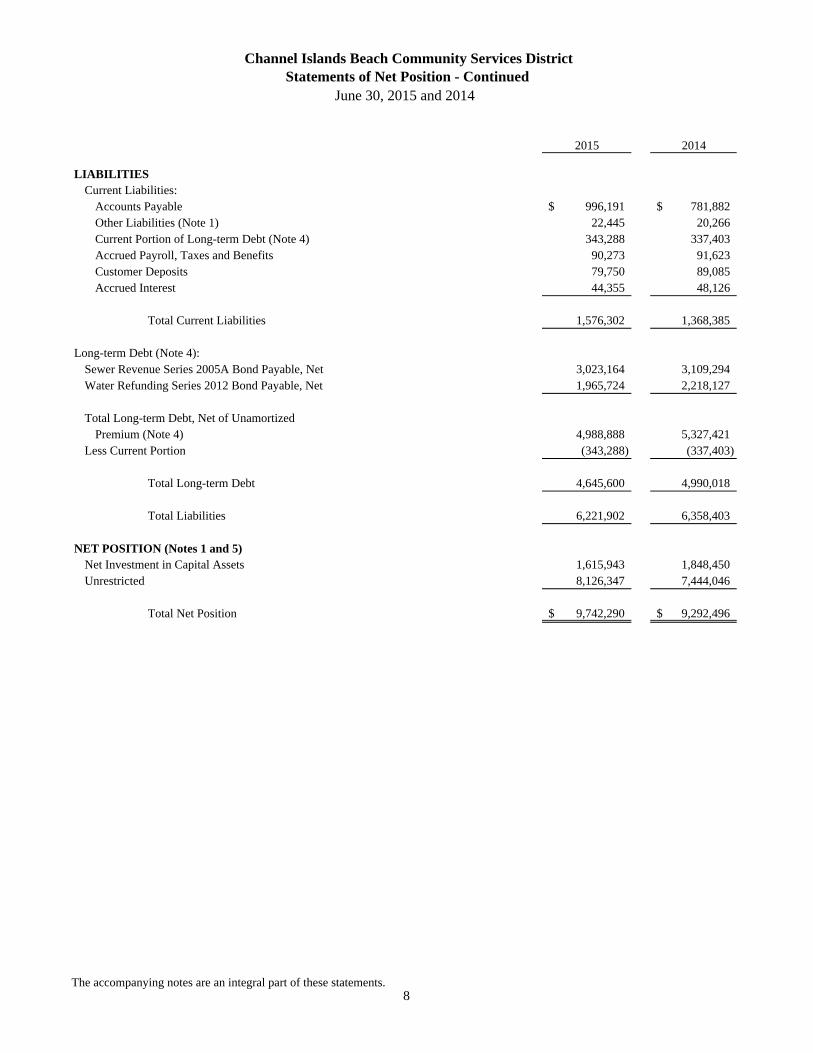
2015 2014
LIABILITIES Current Liabilities:
Accounts Payable 996,191$ 781,882$ Other Liabilities (Note 1) 22,445 20,266 Current Portion of Long-term Debt (Note 4) 343,288 337,403 Accrued Payroll, Taxes and Benefits 90,273 91,623 Customer Deposits 79,750 89,085 Accrued Interest 44,355 48,126
Total Current Liabilities 1,576,302 1,368,385
Long-term Debt (Note 4):Sewer Revenue Series 2005A Bond Payable, Net 3,023,164 3,109,294 Water Refunding Series 2012 Bond Payable, Net 1,965,724 2,218,127
Total Long-term Debt, Net of UnamortizedPremium (Note 4) 4,988,888 5,327,421
Less Current Portion (343,288) (337,403)
Total Long-term Debt 4,645,600 4,990,018
Total Liabilities 6,221,902 6,358,403
NET POSITION (Notes 1 and 5)Net Investment in Capital Assets 1,615,943 1,848,450 Unrestricted 8,126,347 7,444,046
Total Net Position 9,742,290$ 9,292,496$
June 30, 2015 and 2014
Channel Islands Beach Community Services DistrictStatements of Net Position - Continued
The accompanying notes are an integral part of these statements.8
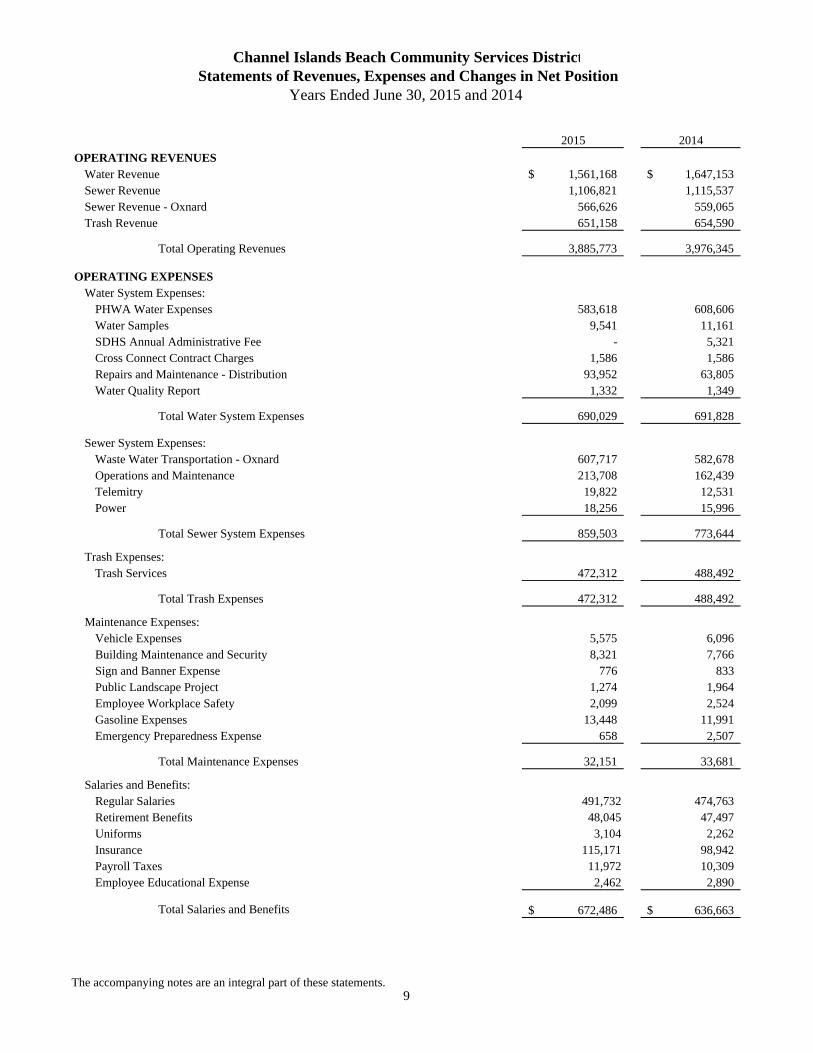
2015 2014
OPERATING REVENUESWater Revenue 1,561,168$ 1,647,153$ Sewer Revenue 1,106,821 1,115,537 Sewer Revenue - Oxnard 566,626 559,065 Trash Revenue 651,158 654,590
Total Operating Revenues 3,885,773 3,976,345
OPERATING EXPENSESWater System Expenses:
PHWA Water Expenses 583,618 608,606 Water Samples 9,541 11,161 SDHS Annual Administrative Fee - 5,321 Cross Connect Contract Charges 1,586 1,586 Repairs and Maintenance - Distribution 93,952 63,805 Water Quality Report 1,332 1,349
Total Water System Expenses 690,029 691,828
Sewer System Expenses:Waste Water Transportation - Oxnard 607,717 582,678 Operations and Maintenance 213,708 162,439 Telemitry 19,822 12,531 Power 18,256 15,996
Total Sewer System Expenses 859,503 773,644
Trash Expenses:Trash Services 472,312 488,492
Total Trash Expenses 472,312 488,492
Maintenance Expenses:Vehicle Expenses 5,575 6,096 Building Maintenance and Security 8,321 7,766 Sign and Banner Expense 776 833 Public Landscape Project 1,274 1,964 Employee Workplace Safety 2,099 2,524 Gasoline Expenses 13,448 11,991 Emergency Preparedness Expense 658 2,507
Total Maintenance Expenses 32,151 33,681
Salaries and Benefits:Regular Salaries 491,732 474,763 Retirement Benefits 48,045 47,497 Uniforms 3,104 2,262 Insurance 115,171 98,942 Payroll Taxes 11,972 10,309 Employee Educational Expense 2,462 2,890
Total Salaries and Benefits 672,486$ 636,663$
Years Ended June 30, 2015 and 2014
Channel Islands Beach Community Services DistrictStatements of Revenues, Expenses and Changes in Net Position
The accompanying notes are an integral part of these statements.9
2015 2014
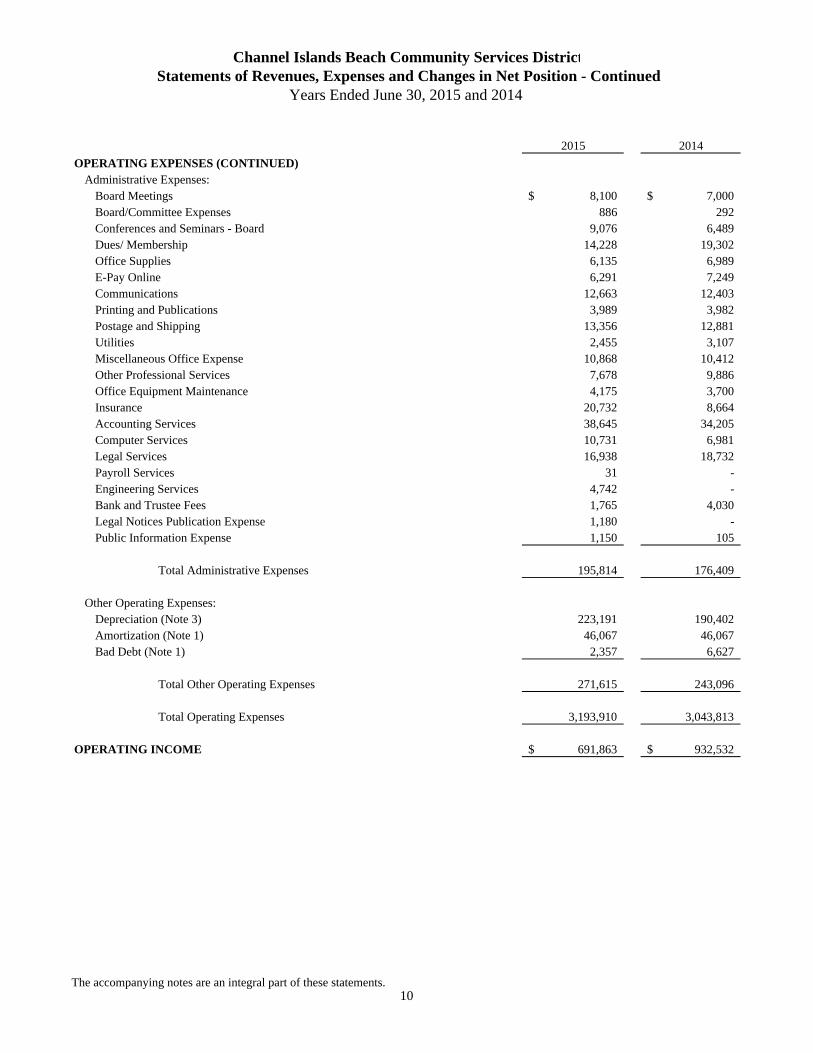
OPERATING EXPENSES (CONTINUED)Administrative Expenses:
Board Meetings 8,100$ 7,000$ Board/Committee Expenses 886 292 Conferences and Seminars - Board 9,076 6,489 Dues/ Membership 14,228 19,302 Office Supplies 6,135 6,989 E-Pay Online 6,291 7,249 Communications 12,663 12,403 Printing and Publications 3,989 3,982 Postage and Shipping 13,356 12,881 Utilities 2,455 3,107 Miscellaneous Office Expense 10,868 10,412 Other Professional Services 7,678 9,886 Office Equipment Maintenance 4,175 3,700 Insurance 20,732 8,664 Accounting Services 38,645 34,205 Computer Services 10,731 6,981 Legal Services 16,938 18,732 Payroll Services 31 - Engineering Services 4,742 - Bank and Trustee Fees 1,765 4,030 Legal Notices Publication Expense 1,180 - Public Information Expense 1,150 105
Total Administrative Expenses 195,814 176,409
Other Operating Expenses:Depreciation (Note 3) 223,191 190,402 Amortization (Note 1) 46,067 46,067 Bad Debt (Note 1) 2,357 6,627
Total Other Operating Expenses 271,615 243,096
Total Operating Expenses 3,193,910 3,043,813
OPERATING INCOME 691,863$ 932,532$
Years Ended June 30, 2015 and 2014
Channel Islands Beach Community Services DistrictStatements of Revenues, Expenses and Changes in Net Position - Continued
The accompanying notes are an integral part of these statements.10
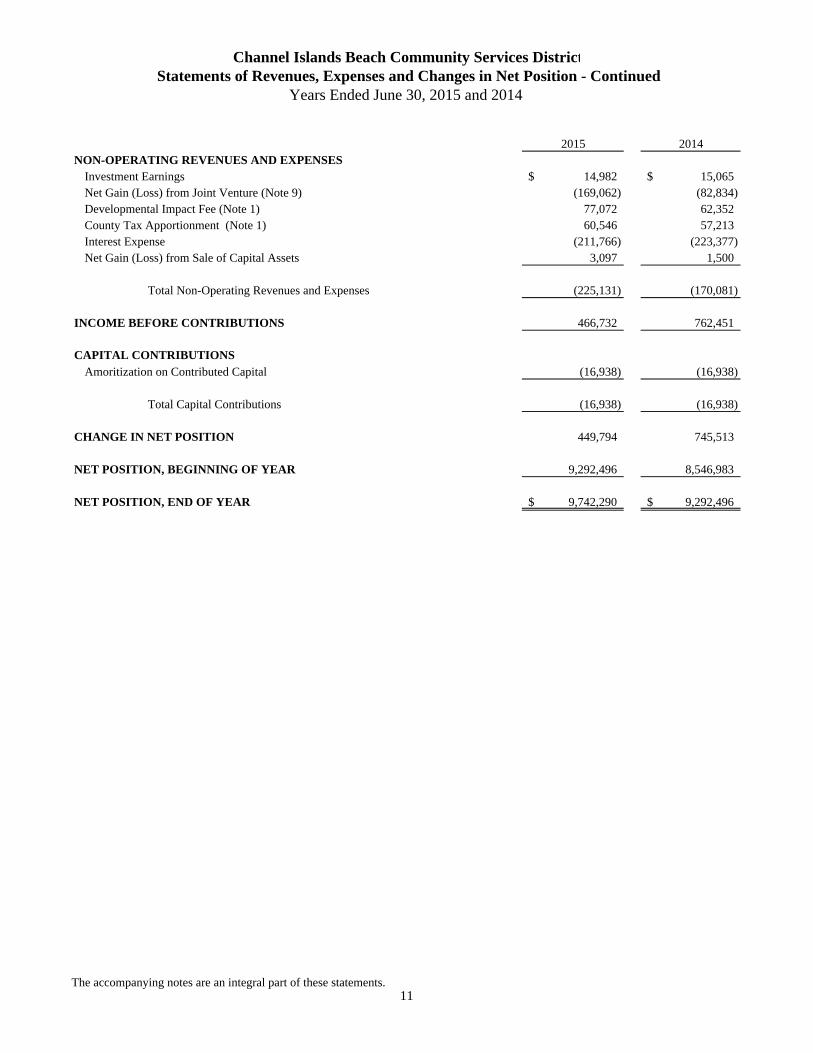
2015 2014NON-OPERATING REVENUES AND EXPENSES
Investment Earnings 14,982$ 15,065$ Net Gain (Loss) from Joint Venture (Note 9) (169,062) (82,834) Developmental Impact Fee (Note 1) 77,072 62,352 County Tax Apportionment (Note 1) 60,546 57,213 Interest Expense (211,766) (223,377) Net Gain (Loss) from Sale of Capital Assets 3,097 1,500
Total Non-Operating Revenues and Expenses (225,131) (170,081)
INCOME BEFORE CONTRIBUTIONS 466,732 762,451
CAPITAL CONTRIBUTIONSAmoritization on Contributed Capital (16,938) (16,938)
Total Capital Contributions (16,938) (16,938)
CHANGE IN NET POSITION 449,794 745,513
NET POSITION, BEGINNING OF YEAR 9,292,496 8,546,983
NET POSITION, END OF YEAR 9,742,290$ 9,292,496$
Channel Islands Beach Community Services DistrictStatements of Revenues, Expenses and Changes in Net Position - Continued
Years Ended June 30, 2015 and 2014
The accompanying notes are an integral part of these statements.11
2015 2014
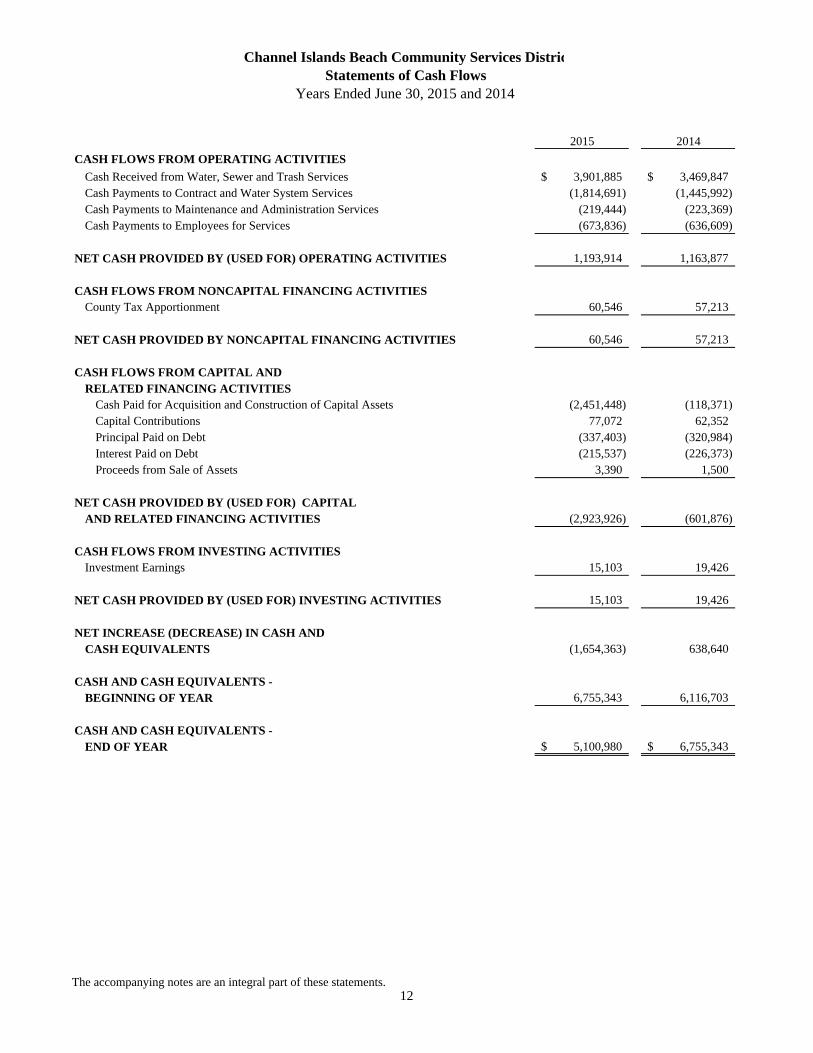
CASH FLOWS FROM OPERATING ACTIVITIES
Cash Received from Water, Sewer and Trash Services 3,901,885$ 3,469,847$ Cash Payments to Contract and Water System Services (1,814,691) (1,445,992) Cash Payments to Maintenance and Administration Services (219,444) (223,369) Cash Payments to Employees for Services (673,836) (636,609)
NET CASH PROVIDED BY (USED FOR) OPERATING ACTIVITIES 1,193,914 1,163,877
CASH FLOWS FROM NONCAPITAL FINANCING ACTIVITIESCounty Tax Apportionment 60,546 57,213
NET CASH PROVIDED BY NONCAPITAL FINANCING ACTIVITIES 60,546 57,213
CASH FLOWS FROM CAPITAL ANDRELATED FINANCING ACTIVITIES
Cash Paid for Acquisition and Construction of Capital Assets (2,451,448) (118,371) Capital Contributions 77,072 62,352 Principal Paid on Debt (337,403) (320,984) Interest Paid on Debt (215,537) (226,373) Proceeds from Sale of Assets 3,390 1,500
NET CASH PROVIDED BY (USED FOR) CAPITAL AND RELATED FINANCING ACTIVITIES (2,923,926) (601,876)
CASH FLOWS FROM INVESTING ACTIVITIESInvestment Earnings 15,103 19,426
NET CASH PROVIDED BY (USED FOR) INVESTING ACTIVITIES 15,103 19,426
NET INCREASE (DECREASE) IN CASH ANDCASH EQUIVALENTS (1,654,363) 638,640
CASH AND CASH EQUIVALENTS -BEGINNING OF YEAR 6,755,343 6,116,703
CASH AND CASH EQUIVALENTS -END OF YEAR 5,100,980$ 6,755,343$
Channel Islands Beach Community Services DistricStatements of Cash Flows
Years Ended June 30, 2015 and 2014
The accompanying notes are an integral part of these statements.12

2015 2014RECONCILIATION OF OPERATING INCOME
TO NET CASH PROVIDED BY (USED FOR) OPERATING ACTIVITIESOperating Income 691,863$ 932,532$
ADJUSTMENTS TO RECONCILE NET OPERATING INCOMETO NET CASH PROVIDED BY OPERATING ACTIVITIES
Depreciation and Amortization 269,258 236,469 Bad Debt Expense 2,357 6,627 (Increase) Decrease in Accounts and Other Receivables 16,112 (506,498) (Increase) Decrease in Prepaid Expenses 435 1,869 (Increase) in Inventory 8,086 (15,148) Increase (Decrease) in Accounts Payable and Other Liabilities 216,488 513,927 Increase in Accrued Payroll Taxes and Benefits (1,350) 54 (Decrease) in Deposits (9,335) (5,955)
TOTAL ADJUSTMENTS 502,051 231,345
NET CASH PROVIDED BY (USED FOR) OPERATING ACTIVITIES 1,193,914$ 1,163,877$
SUPPLEMENTAL DISCLOSURESNon-cash Investing and Financing Activities consisted of the following:
Amortization Related to Long-term Debt 46,067$ 46,067$ Amortization on Contributed Capital 16,938$ 16,938$
Cash and Cash EquivalentsUnrestricted Cash 105,000$ 105,000$ Board Restricted Cash and Cash Equivalents 4,598,380 5,229,958 Restricted Cash and Cash Equivalents 397,600 1,420,385
Total 5,100,980$ 6,755,343$
Statements of Cash Flows - ContinuedYears Ended June 30, 2015 and 2014
Channel Islands Beach Community Services Distric
The accompanying notes are an integral part of these statements.13
Channel Islands Beach Community Services District Notes to Financial Statements
Years Ended June 30, 2015 and 2014
14
1) REPORTING ENTITY AND SUMMARY OF SIGNIFICANT ACCOUNTING POLICIES
A) Reporting Entity
The Channel Islands Beach Community Services District, a public agency, was created by election held on November 2, 1982 as the first such district in Ventura County. The District began operations December 13, 1982 pursuant to the Community Services District Law of the State of California, as amended, with authority under the Government Code, Section 61000 et. seq. The District’s major utility operations include the provision of water, sewer and trash utility services.
The Channel Islands Beach Community Services District is a successor district to its first predecessor agency, the
Oxnard Beach County Water District (“OBCWD”), which was organized on January 28, 1960. Its inception resulted from the merging of three mutual water companies for the purpose of more economically providing water services to the beach communities and County of Ventura Channel Islands Harbor facilities. The District’s immediate predecessor agency, the Channel Islands County Water District, succeeded OBCWD in 1973, followed by the Channel Islands Beach Community Services Districts’ succession by its formation in 1982.
The Channel Islands Beach Community Services District is located on the coastal plain of Ventura County. The
District comprises an unincorporated total of 6,630 acres; however, the major portion of this acreage is in a seaward extension to the three-mile limit. The developed portion of the District, which is on the county assessment rolls, lies around the Channel Islands Harbor and comprises about 151 acres. The District is bound on the east by the United States Naval Base Ventura County, Port Hueneme, on the north and west by portions of the Cities of Oxnard and Port Hueneme, and on the south by the Pacific Ocean.
The Channel Islands Beach Community Services District serves the communities of Hollywood Beach, Hollywood by
the Sea and Silver Strand. The District also serves an adjacent incorporated portion of the Channel Islands Harbor, which is outside the District’s boundaries, pursuant to existing service agreements with the County of Ventura and the City of Oxnard.
B) Basis of Presentation The District’s basic financial statements are prepared in conformity with accounting principles generally accepted in
the United States of America as they are applicable to governmental units. The Governmental Accounting Standards Board (GASB) is the accepted standard setting body for establishing governmental accounting and financial reporting principles. The more significant accounting policies reflected in the financial statements are summarized as follows:
C) Basis of Accounting and Measurement Focus
The District reports its activities as an enterprise fund, which is used to account for operations that are financed and operated in a manner similar to a private business enterprise, where the intent of the District is that the costs (including depreciation) of providing goods or services to the general public on a continuing basis be financed or recovered primarily through user charges. The District financial statements are reported using the economic resources measurement focus and the accrual basis of accounting. Revenues are recognized in the accounting period in which they are earned and expenses are recognized in the period incurred regardless of the timing of related cash flows.
Channel Islands Beach Community Services District Notes to Financial Statements
Years Ended June 30, 2015 and 2014
15
1) REPORTING ENTITY AND SUMMARY OF SIGNIFICANT ACCOUNTING POLICIES - Continued
C) Basis of Accounting and Measurement Focus - Continued
Proprietary funds distinguishes operating revenues and expenses from those revenues and expenses that are non-operating. Operating revenues are those revenues that are generated by water sales and services while operating expenses pertain directly the furnishing of those services. Non-operating revenues and expenses are those revenues and expenses generated that are not directly associated with the normal business of supplying water and services.
When both restricted and unrestricted resources are available for use, it is the District’s policy to use restricted resources first, then unrestricted resources as they are needed.
D) Use of Estimates The preparation of financial statements in conformity with generally accepted accounting principles requires
management to make estimates and assumptions that affect the reported amounts of assets and liabilities and disclosure of contingent assets and liabilities at the date of the financial statements and the reported amounts of revenues and expenses during the reporting period. Actual results could differ from those estimates.
E) Restricted Net Position
Restricted net position represents restricted assets net of liabilities that relate to those specific restricted assets. Restricted net position is assets for which constraints have been placed on the asset’s use by creditors, contributors, laws or regulations of other governments, or as a consequence of a restriction established by the reporting government’s own governing body at the time a particular fee, charge, levy, or assessment was approved. These restrictions must be more narrow than the general purposes for which the reporting government can use its resources.
A liability is considered to relate to restricted assets if the restricted assets resulted from the incurring of that liability or
if the liability will be liquidated with those specific restricted assets held at year end.
F) Budgetary Data
Formal budgetary accounting is employed as a management control for the District. Annual operating budgets are adopted each fiscal year on the budgetary basis in accordance with existing legal requirements. Budgetary control is exercised at the utility enterprise divisional program level. The District did not modify their adopted budget for the year ended June 30, 2015.
The encumbrance method of accounting for budget information is not employed by the District.
G) Investments As a governmental entity other than an external investment pool in accordance with GASB 31, the District’s
investments are stated at fair value except for interest-earning investment contracts (See Note 2).

Channel Islands Beach Community Services District Notes to Financial Statements
Years Ended June 30, 2015 and 2014
16
1) REPORTING ENTITY AND SUMMARY OF SIGNIFICANT ACCOUNTING POLICIES - Continued
G) Investments - Continued
In applying GASB 31, the District utilized the following methods and assumptions: 1) Fair value is based on quoted market prices as of the valuation date; 2) The portfolio did not hold investments in any of the following:
a) Items required to be reported at amortized cost, b) Items in external pools that are not SEC registered, c) Items subject to involuntary participation in an external pool, d) Items associated with a fund other than the fund to which the income is assigned; 3) The gain/loss resulting from valuation will be reported within the revenue account “investment earnings”
on the Statement of Revenues and Expenses. In accordance with GASB Statement 9, for purposes of the statement of cash flows, all cash and investments with original maturities of 90 days or less are considered cash or cash equivalents.
H) Deferred Outflows/Inflows of Resources In addition to assets, the statement of financial position will sometimes report a separate section for deferred outflows of resources. This separate financial statement element, deferred outflows of resources, represents a consumption of net position that applies to a future period(s) and so will not be recognized as an outflow of resources (expense/expenditure) until then. The District only has one item that qualifies for reporting in this category. It is the deferred charge on refunding reported in the statements of net position. A deferred charge on refunding results from the difference in the carrying value of refunded debt and its reacquisition price. This amount is deferred and amortized over the shorter of the life of the refunded or refunding debt. In addition to liabilities, the statement of financial position will sometimes report a separate section for deferred inflows of resources. This separate financial statement element, deferred inflows of resources, represents an acquisition of net position that applies to a future period(s) and so will not be recognized as an inflow of resources (revenue) until that time. Currently, the District does not report any deferred inflows.
I) Net Position GASB No. 63 requires that the difference between assets, liabilities and deferred outflows/inflows of resources be reported as net position. Net position is classified as either net investment in capital assets, restricted, or unrestricted. Net position classified as net investment in capital assets consists of capital assets, net of accumulated depreciation and reduced by the outstanding principal of related debt. Restricted net position is the net position that has external constraints placed on them by creditors, grantors, contributors, laws, or regulations of other governments, or through constitutional provisions, or enabling legislation. Unrestricted net position consists of net position that does not meet the definition of net investment in capital assets or restricted net position.
Channel Islands Beach Community Services District Notes to Financial Statements
Years Ended June 30, 2015 and 2014
17
1) REPORTING ENTITY AND SUMMARY OF SIGNIFICANT ACCOUNTING POLICIES - Continued
J) Accounts Receivable
Accounts receivable include $145,331 and $149,878 of unbilled utility services as of June 30, 2015 and 2014,
respectively, which is attributable to the second half of the June 30th service period billed in July. The District has
established a reserve for doubtful accounts based on the prior three years of bad debts. The amount of the reserve for
doubtful accounts at June 30, 2015 and 2014 was $5,000 and $5,000 respectively. The Bad Debt expense was $2,357
and $6,627 as of June 30, 2015 and 2014, respectively.
K) Other Receivables and Other Liabilities
Other receivables include $566,626 and $559,065 from the City of Oxnard as of June 30, 2015 and 2014. The
District and the City of Oxnard share a pipeline for wastewater transportation and treatment in which the City of
Oxnard reimburses the District for the estimated cost for their portion of the use of the pipeline. The remaining
other receivables of $0 and $1,420 were from the State of California as of June 30, 2015 and 2014, respectively.
Other liabilities, also, includes amounts accrued for trash services of $22,445 and $20,266 respectively, as of June
30, 2015 and 2014.
L) Inventory and Prepaid Items
Inventory is valued at the lower of cost (first-in, first-out) or market.
Certain payments to vendors reflect costs applicable to future accounting periods and are recorded as prepaid items.
The cost of prepaid items is recorded as expenditures/expenses when consumed rather than when purchased.
M) County Tax Apportionment
Taxes are considered revenue in the year in which collections are made, as that is when they are both measurable and
available.
The District utilizes the services of Ventura County for the assessment and collection of taxes (special benefit
assessments and general property taxes). These taxes are collected at the same time and on the same tax rolls as are
county, cities, school districts and other special district taxes. Assessed valuations are the same for both District and
County taxing purposes. The District receives an apportionment of the County’s one percent (1%) maximum property
tax levy. The percentage of tax that the District receives is determined by a formula prepared by the Ventura County
Tax Assessor in accordance with State law. The valuation of property is determined as of March 1 of each year.
Secured taxes are payable in two installments the first is due November 1, and the second due February 1. Such taxes
are considered delinquent if not paid by December 10 and April 10 immediately following their respective due dates.
Taxes on unsecured property are due March 1 and become delinquent August 31 and such taxes are levied at the prior
years’ secured tax rate. The county wide 1% levy has been pledged to debt service of the District.
Channel Islands Beach Community Services District Notes to Financial Statements
Years Ended June 30, 2015 and 2014
18
1) REPORTING ENTITY AND SUMMARY OF SIGNIFICANT ACCOUNTING POLICIES - Continued
N) Bond Discounts and Premiums
The District amortizes bond discounts and premiums using the straight-line method over the term of the related bond issue. The current related bond issue is the Sewer Revenue Bonds Series 2005A.
O) Compensated Absences
Employees are entitled to accumulate vacation leave at a rate of two, three or four weeks per year, depending on the number of years of service completed. Upon termination, separation, or retirement, each employee is paid for all their accumulated vacation hours at the hourly rate then in effect. In accordance with accounting principles generally accepted in the United States of America, the liability is reflected in the line item for accrued payroll, taxes and benefits on the statement of net position and the current year allocation has been expensed.
Employees are entitled to accumulate sick leave at a rate of twelve days per year. Once during a twelve month period,
an employee may request to exchange excess sick leave accruals for vacation hours at the rate of one hour of vacation time for each two hours of sick leave accrued if they comply with the following conditions: 1) must have accrued at least twelve days of unused sick leave and used six days or less during the previous twelve months, and 2) must maintain a sick leave accrual balance of at least ten days of sick leave after the once a year exchange of excess sick leave for vacation hours takes place. Upon termination, separation, or retirement, each employee is paid for all their accumulated sick leave at the hourly rate in effect. In accordance with accounting principles generally accepted in the United States of America, the liability is reflected in the line item for accrued payroll, taxes and benefits on the statement of net position and the current year allocation has been expensed.
P) Contributed Capital
Contributed capital represents cash or utility plant additions contributed to the District by property owners or developers desiring services that require capital expenditures or capacity commitment. In accordance with GASB Statement 33 all such capital contributions are reflected as revenues.
Q) Reclassifications
Certain amounts presented in the prior year data have been reclassified in order to be consistent with the current year’s presentation.
2) CASH AND INVESTMENTS
The District has defined cash for purposes of the statement of cash flows to include cash on hand, demand deposits and cash
with the County Treasurer.

Channel Islands Beach Community Services District Notes to Financial Statements
Years Ended June 30, 2015 and 2014
19
2) CASH AND INVESTMENTS - Continued The District participates in the County Pool Investment Program with interest being allocated on the basis of deposit in the
Treasury. Investment policies and associated risk factors applicable to District monies are those of the County of Ventura and are included in the County’s Annual Financial Report. The carrying value and estimated market value of the County of Ventura Pool at June 30, 2015, were $2,066,398,258 and $1,840,798,199, respectively. The District’s share of the Pool at June 30, 2015, was approximately 0.2046 percent.
The District utilized a commercial bank for all operational transactions. The District invests cash with the County Treasurer
and in Union Bank (fiscal agent for proceeds of debt). At June 30, 2015 and 2014 the carrying amount of the District’s petty cash, deposits and investments were $5,100,980 and $6,755,343 and are broken down as follows:
2015 2014 Petty Cash $ 500 $ 500 Union Bank 331,410 1,364,035 County Treasury 4,227,594 4,852,706 First California Bank 541,476 538,102 Total $ 5,100,980 $ 6,755,343
The District has adopted an investment policy, which authorizes the District’s investment in local obligations, obligations of
the United States Treasury and agencies, the County Pool Investment Program, savings and other interest bearing accounts. The District selects its investments based on safety, liquidity and yield.
Cash and Investments are classified in the accompanying financial statements as follows:
2015 2014 Statement of Net Position: Unrestricted Cash $ 105,000 $ 105,000 Board Restricted Cash and Investments 4,598,380 5,229,958 Restricted Cash and Investments 397,600 1,420,385 Total Cash and Investments $ 5,100,980 $ 6,755,343
Cash and investments consist of the following:
2015 2014 Cash on Hand $ 500 $ 500 Deposits with Financial Institutions 541,476 538,102 Deposits with County Treasurer 4,227,594 4,852,706 Investments 331,410 1,364,035 Total Cash and Investments $ 5,100,980 $ 6,755,343
Channel Islands Beach Community Services District Notes to Financial Statements
Years Ended June 30, 2015 and 2014
20
2) CASH AND INVESTMENTS - Continued
Investments Authorized by the California Government Code and the District’s Investment Policy
The table below identifies the investment types that are authorized for the District by the California Government Code (or the District’s investment policy, where more restrictive). The table also identifies certain provisions of the California Government Code (or the District’s investment policy, where more restrictive) that address interest rate risk, credit risk, and concentration of credit risk. This table does not address investments of debt proceeds held by bond trustee that are governed by the provisions of debt agreements of the District, rather than the general provisions of the California Government Code or the District’s investment policy.
Maximum Maximum Authorized Maximum Percentage Investment Investment Type Maturity Of *Portfolio In One Issuer Mutual Funds N/A 20% 10% County Pooled Investment Funds N/A None None
*Excluding amounts held by bond trustee that are not subject to California Government Code restrictions.
Investments Authorized by Debt Agreements
Investment of debt proceeds held by bond trustee are governed by provisions of the debt agreements, rather than the general provisions of the California Government Code or the District’s investment policy.
Disclosures Relating to Interest Rate Risk
Interest rate risk is the risk that changes in market interest rates will adversely affect the fair value of an investment. Generally, the longer the maturity of an investment, the greater the sensitivity of its fair value to changes in market interest rates. One of the ways that the District manages its exposure to interest rates risk is by purchasing a combination of shorter term and longer term investments and by timing cash flows from maturities so that a portion of the portfolio is maturing or coming close to maturity evenly over time as necessary to provide the cash flow and liquidity needed for operations.
As of June 30, 2015, the District had the following investments:
Maturity Date Held by Bond Trustee: Mutual Funds $ 331,410 N/A
Disclosures Relating to Credit Risk
Generally, credit risk is the risk that an issuer of an investment will not fulfill its obligation to the holder of the investment. This is measured by the assignment of a rating by a nationally recognized statistical rating organization.
Channel Islands Beach Community Services District Notes to Financial Statements
Years Ended June 30, 2015 and 2014
21
2) CASH AND INVESTMENTS - Continued
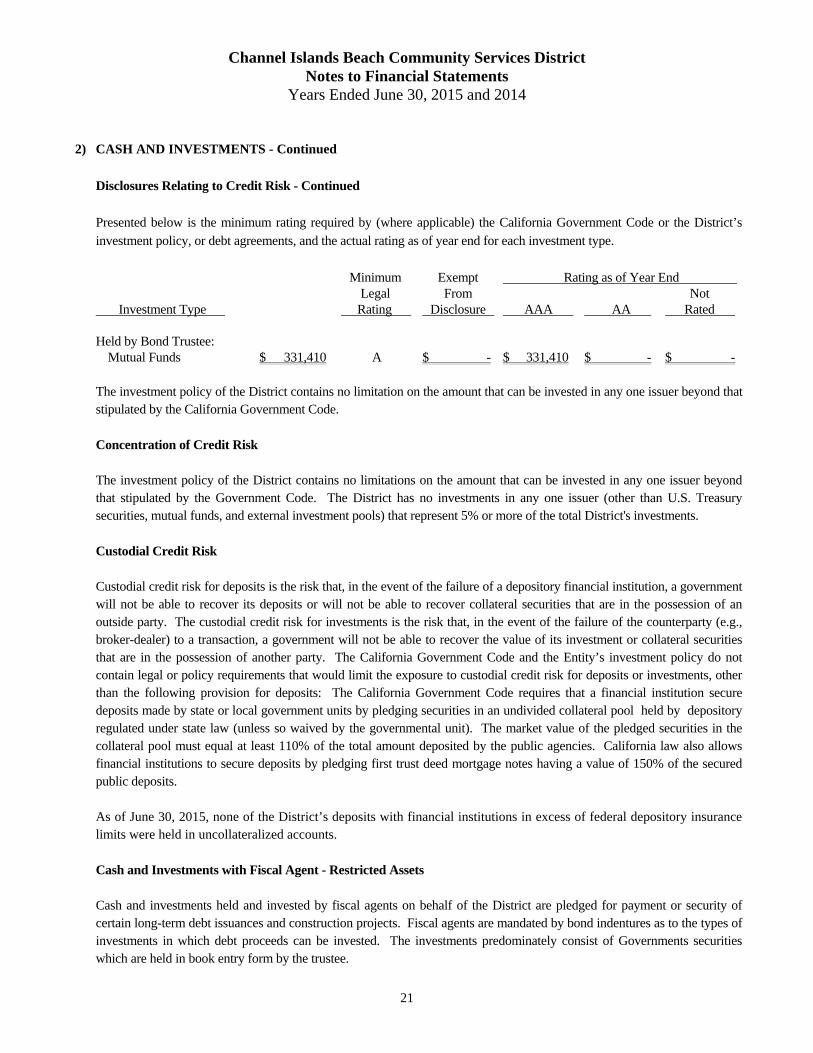
Disclosures Relating to Credit Risk - Continued Presented below is the minimum rating required by (where applicable) the California Government Code or the District’s investment policy, or debt agreements, and the actual rating as of year end for each investment type. Minimum Exempt Rating as of Year End Legal From Not Investment Type Rating Disclosure AAA AA Rated Held by Bond Trustee: Mutual Funds $ 331,410 A $ - $ 331,410 $ - $ -
The investment policy of the District contains no limitation on the amount that can be invested in any one issuer beyond that stipulated by the California Government Code. Concentration of Credit Risk The investment policy of the District contains no limitations on the amount that can be invested in any one issuer beyond that stipulated by the Government Code. The District has no investments in any one issuer (other than U.S. Treasury securities, mutual funds, and external investment pools) that represent 5% or more of the total District's investments.
Custodial Credit Risk Custodial credit risk for deposits is the risk that, in the event of the failure of a depository financial institution, a government will not be able to recover its deposits or will not be able to recover collateral securities that are in the possession of an outside party. The custodial credit risk for investments is the risk that, in the event of the failure of the counterparty (e.g., broker-dealer) to a transaction, a government will not be able to recover the value of its investment or collateral securities that are in the possession of another party. The California Government Code and the Entity’s investment policy do not contain legal or policy requirements that would limit the exposure to custodial credit risk for deposits or investments, other than the following provision for deposits: The California Government Code requires that a financial institution secure deposits made by state or local government units by pledging securities in an undivided collateral pool held by depository regulated under state law (unless so waived by the governmental unit). The market value of the pledged securities in the collateral pool must equal at least 110% of the total amount deposited by the public agencies. California law also allows financial institutions to secure deposits by pledging first trust deed mortgage notes having a value of 150% of the secured public deposits. As of June 30, 2015, none of the District’s deposits with financial institutions in excess of federal depository insurance limits were held in uncollateralized accounts.
Cash and Investments with Fiscal Agent - Restricted Assets Cash and investments held and invested by fiscal agents on behalf of the District are pledged for payment or security of
certain long-term debt issuances and construction projects. Fiscal agents are mandated by bond indentures as to the types of investments in which debt proceeds can be invested. The investments predominately consist of Governments securities which are held in book entry form by the trustee.
Channel Islands Beach Community Services District Notes to Financial Statements
Years Ended June 30, 2015 and 2014
22
2) CASH AND INVESTMENTS - Continued
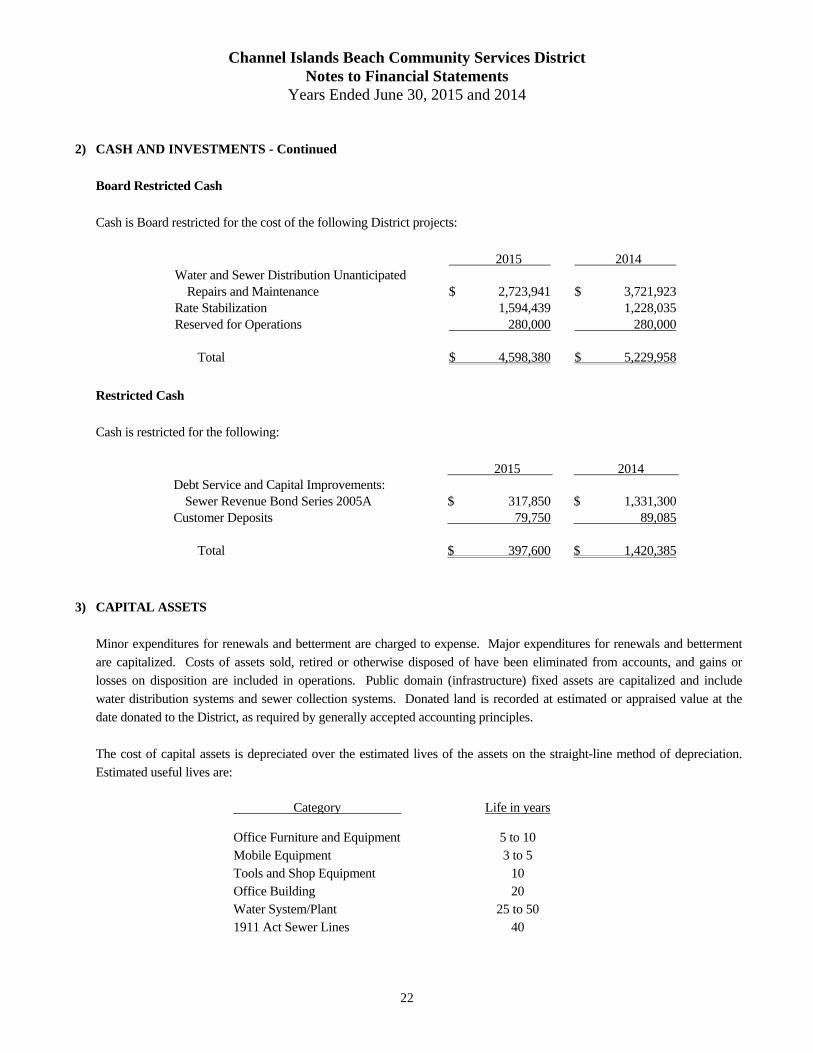
Board Restricted Cash Cash is Board restricted for the cost of the following District projects:
2015 2014 Water and Sewer Distribution Unanticipated Repairs and Maintenance
$ 2,723,941
$ 3,721,923
Rate Stabilization 1,594,439 1,228,035Reserved for Operations 280,000 280,000 Total $ 4,598,380 $ 5,229,958
Restricted Cash Cash is restricted for the following:
2015 2014 Debt Service and Capital Improvements: Sewer Revenue Bond Series 2005A $ 317,850 $ 1,331,300Customer Deposits 79,750 89,085 Total $ 397,600 $ 1,420,385
3) CAPITAL ASSETS Minor expenditures for renewals and betterment are charged to expense. Major expenditures for renewals and betterment
are capitalized. Costs of assets sold, retired or otherwise disposed of have been eliminated from accounts, and gains or losses on disposition are included in operations. Public domain (infrastructure) fixed assets are capitalized and include water distribution systems and sewer collection systems. Donated land is recorded at estimated or appraised value at the date donated to the District, as required by generally accepted accounting principles.
The cost of capital assets is depreciated over the estimated lives of the assets on the straight-line method of depreciation.
Estimated useful lives are:
Category Life in years Office Furniture and Equipment 5 to 10 Mobile Equipment 3 to 5 Tools and Shop Equipment 10 Office Building 20 Water System/Plant 25 to 50 1911 Act Sewer Lines 40
Channel Islands Beach Community Services District Notes to Financial Statements
Years Ended June 30, 2015 and 2014
23
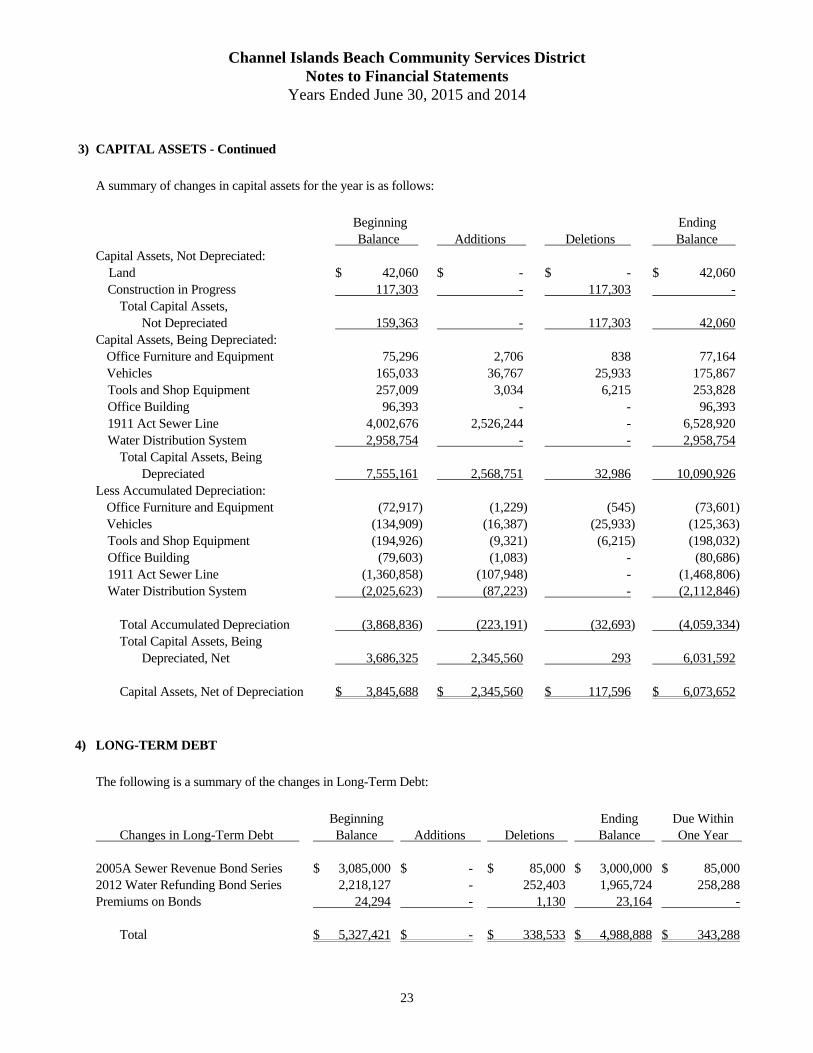
3) CAPITAL ASSETS - Continued A summary of changes in capital assets for the year is as follows:
Beginning Ending Balance Additions Deletions Balance Capital Assets, Not Depreciated: Land $ 42,060 $ - $ - $ 42,060 Construction in Progress 117,303 - 117,303 - Total Capital Assets, Not Depreciated 159,363 - 117,303 42,060 Capital Assets, Being Depreciated: Office Furniture and Equipment 75,296 2,706 838 77,164 Vehicles 165,033 36,767 25,933 175,867 Tools and Shop Equipment 257,009 3,034 6,215 253,828 Office Building 96,393 - - 96,393 1911 Act Sewer Line 4,002,676 2,526,244 - 6,528,920 Water Distribution System 2,958,754 - - 2,958,754 Total Capital Assets, Being Depreciated 7,555,161 2,568,751 32,986 10,090,926 Less Accumulated Depreciation: Office Furniture and Equipment (72,917) (1,229) (545) (73,601) Vehicles (134,909) (16,387) (25,933) (125,363) Tools and Shop Equipment (194,926) (9,321) (6,215) (198,032) Office Building (79,603) (1,083) - (80,686) 1911 Act Sewer Line (1,360,858) (107,948) - (1,468,806) Water Distribution System (2,025,623) (87,223) - (2,112,846) Total Accumulated Depreciation (3,868,836) (223,191) (32,693) (4,059,334) Total Capital Assets, Being Depreciated, Net 3,686,325 2,345,560 293 6,031,592 Capital Assets, Net of Depreciation $ 3,845,688 $ 2,345,560 $ 117,596 $ 6,073,652
4) LONG-TERM DEBT The following is a summary of the changes in Long-Term Debt:
Beginning Ending Due Within Changes in Long-Term Debt Balance Additions Deletions Balance One Year 2005A Sewer Revenue Bond Series $ 3,085,000 $ - $ 85,000 $ 3,000,000 $ 85,0002012 Water Refunding Bond Series 2,218,127 - 252,403 1,965,724 258,288Premiums on Bonds 24,294 - 1,130 23,164 - Total $ 5,327,421 $ - $ 338,533 $ 4,988,888 $ 343,288

Channel Islands Beach Community Services District Notes to Financial Statements
Years Ended June 30, 2015 and 2014
24
4) LONG-TERM DEBT - Continued
Bonds Payable In 2006, the District issued $3,455,000 in Sewer Revenue Certificates of Participation Series 2005A to fund certain
improvements to the Sewer System and to the Water System. The Certificates interest rates range from 3.70% to 5.25%. Interest on the Certificates is payable November 1st and May 1st of each year. Principal on the Certificates is payable in annual installments ranging from $70,000 to $225,000 commencing November 1, 2009 through November 1, 2035. At June 30, 2015, the District has a cash reserve balance for debt service of $236,199 which is sufficient to cover the Certificates Indenture Reserve Requirement.
In June 2012, the District issued $2,716,072 in Water Revenue Refunding Bonds Series 2012 to advance refund the 2005B
Revenue Refunding Certificates of Participation. The bonds interest rate is 3.05%. Interest on the bonds is payable September 1st and March 1st of each year. Principal on the bonds is payable in annual installment ranging from $240,984 to $303,604 commencing September 1, 2012 through September 1, 2021.
Future debt requirements are as follows:
Sewer Bond Water Bond Total Year Ending Series 2005A Series 2012 Debt Requirements
June 30, Principal Interest Principal Interest Principal Interest
2016 $ 85,000 $ 148,050 $ 258,288 $ 56,016 $ 343,288 $ 204,066 2017 90,000 144,242 263,630 48,056 353,630 192,298 2018 95,000 140,173 272,961 39,873 367,961 180,046 2019 100,000 135,833 281,332 31,420 381,332 167,253 2020 105,000 131,193 289,240 22,719 394,240 153,912
2021-2025 585,000 578,353 600,273 18,414 1,185,273 596,767 2026-2030 745,000 415,069 - - 745,000 415,069 2031-2035 970,000 191,625 - - 970,000 191,625
2036 225,000 5,906 - - 225,000 5,906
Total $ 3,000,000 $ 1,890,444 $ 1,965,724 $ 216,498 $ 4,965,724 $ 2,106,942
Revenues Pledged
The District has pledged a portion of future sewer revenues and a portion of investment earnings to repay the District’s Sewer Revenue Certificates of Participation Series 2005A. The District’s Sewer Certificates of Participation are payable solely from sewer revenues and a portion of investment earnings. Total principal and interest remaining on the Sewer Certificates of Participation are $4,890,444, payable through fiscal year 2036. For the current year, principal and interest paid by sewer revenues and investment earnings were $85,000 and $151,663, respectively.
The District has pledged a portion of water revenues and a portion of investment earnings to repay the District’s Water Revenue Refunding Certificates of Participation Series 2012. The District’s Water Certificates of Participation are payable solely from water revenues and a portion of investment earnings. Total principal and interest remaining on the Water Certificates of Participation are $2,182,222, payable through fiscal year 2022. For the current year, principal and interest paid by water revenues and investment earnings were $252,403 and $63,804, respectively.
Channel Islands Beach Community Services District Notes to Financial Statements
Years Ended June 30, 2015 and 2014
25
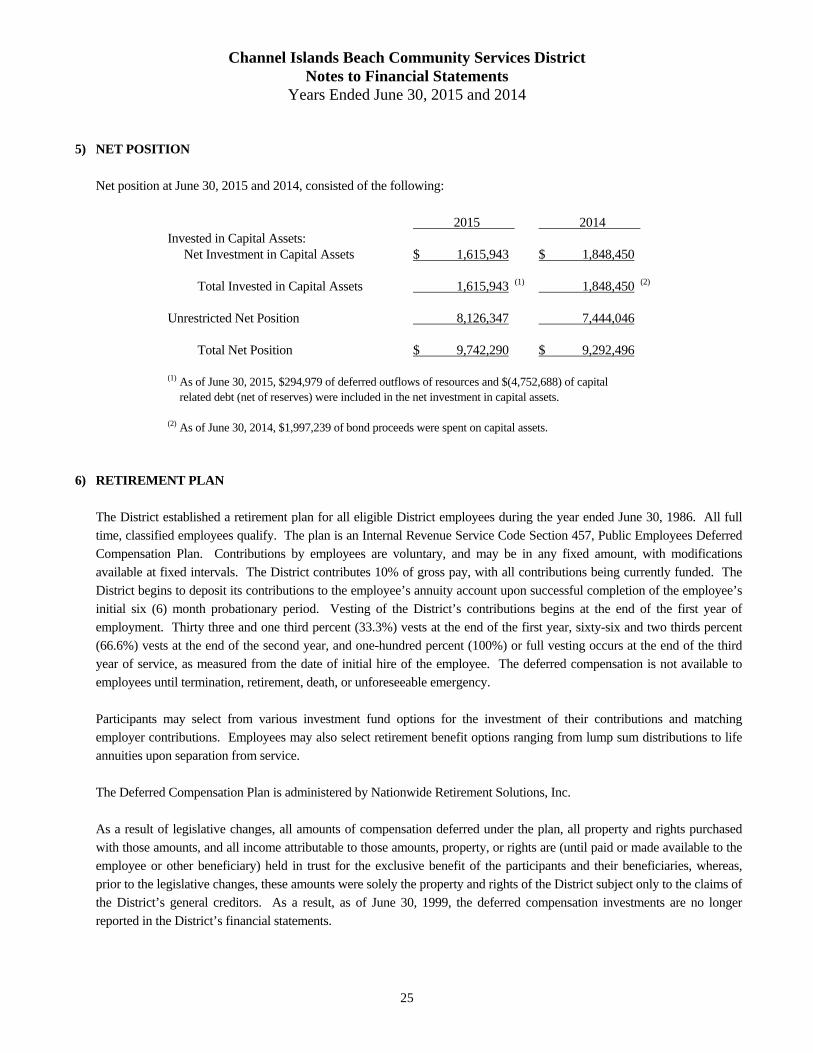
5) NET POSITION Net position at June 30, 2015 and 2014, consisted of the following:
2015 2014 Invested in Capital Assets: Net Investment in Capital Assets $ 1,615,943 $ 1,848,450 Total Invested in Capital Assets 1,615,943 (1) 1,848,450 (2)
Unrestricted Net Position 8,126,347 7,444,046 Total Net Position $ 9,742,290 $ 9,292,496
(1) As of June 30, 2015, $294,979 of deferred outflows of resources and $(4,752,688) of capital related debt (net of reserves) were included in the net investment in capital assets. (2) As of June 30, 2014, $1,997,239 of bond proceeds were spent on capital assets.
6) RETIREMENT PLAN The District established a retirement plan for all eligible District employees during the year ended June 30, 1986. All full
time, classified employees qualify. The plan is an Internal Revenue Service Code Section 457, Public Employees Deferred Compensation Plan. Contributions by employees are voluntary, and may be in any fixed amount, with modifications available at fixed intervals. The District contributes 10% of gross pay, with all contributions being currently funded. The District begins to deposit its contributions to the employee’s annuity account upon successful completion of the employee’s initial six (6) month probationary period. Vesting of the District’s contributions begins at the end of the first year of employment. Thirty three and one third percent (33.3%) vests at the end of the first year, sixty-six and two thirds percent (66.6%) vests at the end of the second year, and one-hundred percent (100%) or full vesting occurs at the end of the third year of service, as measured from the date of initial hire of the employee. The deferred compensation is not available to employees until termination, retirement, death, or unforeseeable emergency.
Participants may select from various investment fund options for the investment of their contributions and matching
employer contributions. Employees may also select retirement benefit options ranging from lump sum distributions to life annuities upon separation from service.
The Deferred Compensation Plan is administered by Nationwide Retirement Solutions, Inc. As a result of legislative changes, all amounts of compensation deferred under the plan, all property and rights purchased
with those amounts, and all income attributable to those amounts, property, or rights are (until paid or made available to the employee or other beneficiary) held in trust for the exclusive benefit of the participants and their beneficiaries, whereas, prior to the legislative changes, these amounts were solely the property and rights of the District subject only to the claims of the District’s general creditors. As a result, as of June 30, 1999, the deferred compensation investments are no longer reported in the District’s financial statements.

Channel Islands Beach Community Services District Notes to Financial Statements
Years Ended June 30, 2015 and 2014
26
7) INCOME TAX The District is exempt from income taxes.
8) JOINT POWERS AGENCY (ACWAJPIA) The District is a member of the Association of California Water Agency Joint Powers Insurance Authority (ACWAJPIA).
The District receives the benefits of the pooled insurance risk program, but not as an equity member of the authority. Total insurance payments for the year ended June 30, 2015 and 2014 were $20,663 and $20,824 respectively.
9) PORT HUENEME WATER AGENCY/JOINT VENTURE
In 1994, the CIBCSD entered into a Joint Powers Agency Agreement (JPA) with the City of Port Hueneme (COPH) to create the Port Hueneme Water Agency (PHWA). The JPA was formed in order to develop a subregional Water Quality Improvement Program to address the need for area-wide planning, coordination, development, financing, constructions and operation of a water desalination plant and the necessary transport facilities to service the water need of CIBCSD, COPH, the US Navy installations at the Naval Base Ventura County, Port Hueneme. The PHWA is responsible to design, construct and operate facilities necessary to deliver a combination of ground water and imported water.
Financial statements for the PHWA can be obtained through the COPH. CIBCSD’s percentage share in PHWA’s cost of the improvements and related liabilities varies from 0% to 86%, based on
each party’s share of the facilities - overall the total cost of improvements through June 30, 2015 was $16,417,343, of which CIBCSD’s share was $3,244,304. CIBCSD’s share in ongoing operating costs vary from 12% to 16% for certain fixed costs; other variable operating costs are allocated based on the volume of water delivered to each party.
CIBCSD uses the equity method to account for its share of the JPA according to the joint venture agreement. The initial investment was recorded at cost. CIBCSD’s share of joint venture’s net income is reported in CIBCSD’s operating statement as a profit or loss in the joint venture. Nonoperating transactions between CIBCSD and the joint venture increase or decrease the equity interest. A summary of the assets, liabilities and results of operations of PHWA are as follows.
2015 2014 Total Assets $ 18,999,794 $ 19,647,222 Total Liabilities 1,435,022 1,141,222 Net Position Net Investment in Capital Assets 15,887,452 16,740,615 Restricted for Operations 367,223 93,418 Unrestricted 1,310,097 1,671,967 Total Net Position $ 17,564,772 $ 18,506,000
Channel Islands Beach Community Services District Notes to Financial Statements
Years Ended June 30, 2015 and 2014
27
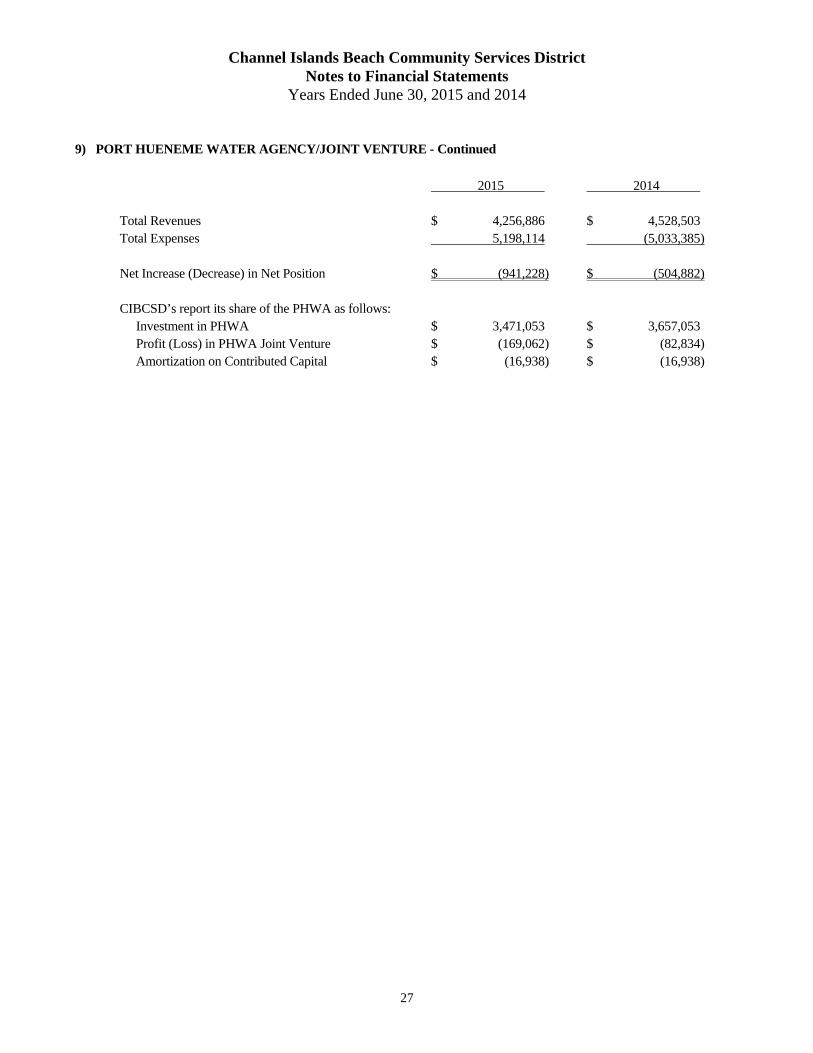
9) PORT HUENEME WATER AGENCY/JOINT VENTURE - Continued
2015 2014 Total Revenues $ 4,256,886 $ 4,528,503 Total Expenses 5,198,114 (5,033,385) Net Increase (Decrease) in Net Position $ (941,228) $ (504,882) CIBCSD’s report its share of the PHWA as follows: Investment in PHWA $ 3,471,053 $ 3,657,053 Profit (Loss) in PHWA Joint Venture $ (169,062) $ (82,834) Amortization on Contributed Capital $ (16,938) $ (16,938)

This page intentionally left blank

SUPPLEMENTAL INFORMATION

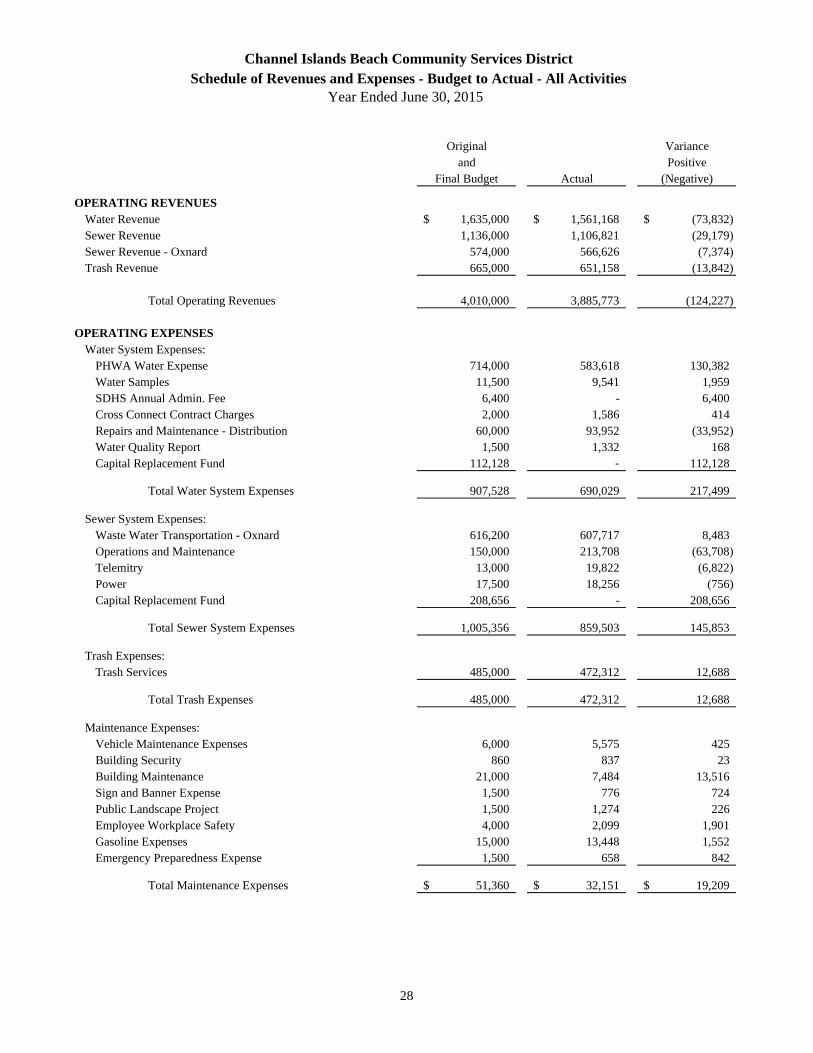
Original Varianceand Positive
Final Budget Actual (Negative)
OPERATING REVENUESWater Revenue 1,635,000$ 1,561,168$ (73,832)$ Sewer Revenue 1,136,000 1,106,821 (29,179) Sewer Revenue - Oxnard 574,000 566,626 (7,374) Trash Revenue 665,000 651,158 (13,842)
Total Operating Revenues 4,010,000 3,885,773 (124,227)
OPERATING EXPENSESWater System Expenses:
PHWA Water Expense 714,000 583,618 130,382 Water Samples 11,500 9,541 1,959 SDHS Annual Admin. Fee 6,400 - 6,400 Cross Connect Contract Charges 2,000 1,586 414 Repairs and Maintenance - Distribution 60,000 93,952 (33,952) Water Quality Report 1,500 1,332 168 Capital Replacement Fund 112,128 - 112,128
Total Water System Expenses 907,528 690,029 217,499
Sewer System Expenses: Waste Water Transportation - Oxnard 616,200 607,717 8,483 Operations and Maintenance 150,000 213,708 (63,708) Telemitry 13,000 19,822 (6,822) Power 17,500 18,256 (756) Capital Replacement Fund 208,656 - 208,656
Total Sewer System Expenses 1,005,356 859,503 145,853
Trash Expenses:Trash Services 485,000 472,312 12,688
Total Trash Expenses 485,000 472,312 12,688
Maintenance Expenses:Vehicle Maintenance Expenses 6,000 5,575 425 Building Security 860 837 23 Building Maintenance 21,000 7,484 13,516 Sign and Banner Expense 1,500 776 724 Public Landscape Project 1,500 1,274 226 Employee Workplace Safety 4,000 2,099 1,901 Gasoline Expenses 15,000 13,448 1,552 Emergency Preparedness Expense 1,500 658 842
Total Maintenance Expenses 51,360$ 32,151$ 19,209$
Year Ended June 30, 2015
Channel Islands Beach Community Services DistrictSchedule of Revenues and Expenses - Budget to Actual - All Activities
28
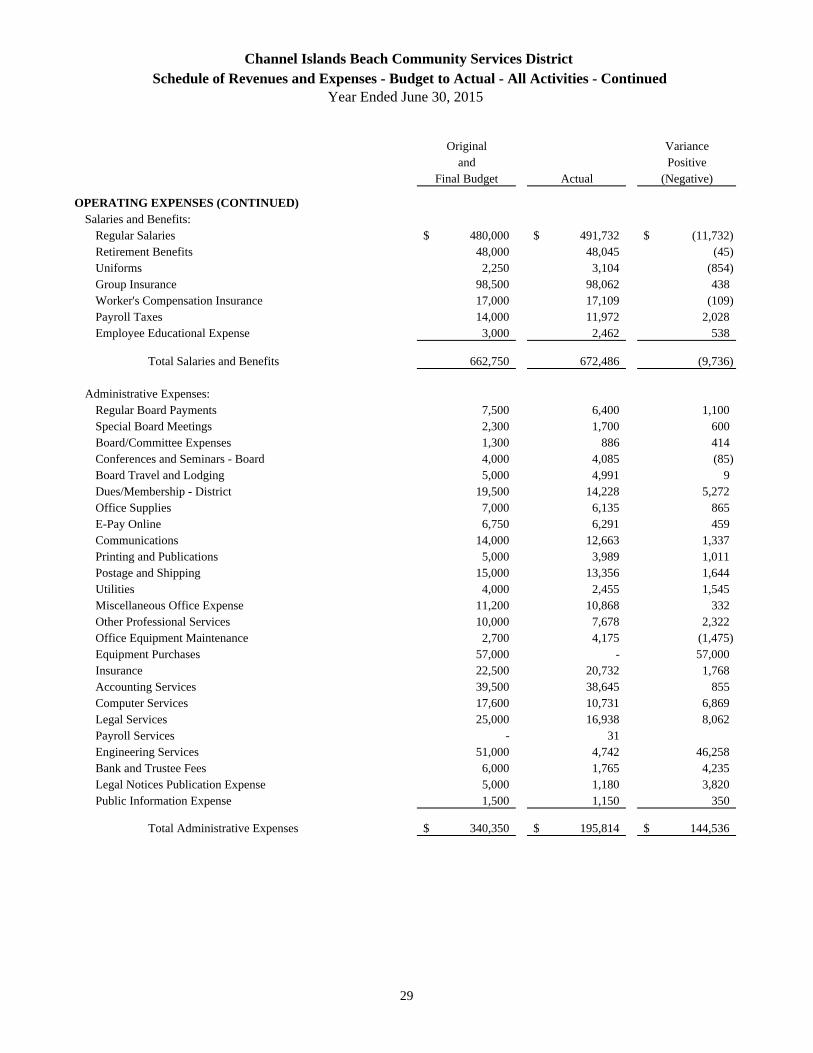
Original Varianceand Positive
Final Budget Actual (Negative)
OPERATING EXPENSES (CONTINUED)Salaries and Benefits:
Regular Salaries 480,000$ 491,732$ (11,732)$ Retirement Benefits 48,000 48,045 (45) Uniforms 2,250 3,104 (854) Group Insurance 98,500 98,062 438 Worker's Compensation Insurance 17,000 17,109 (109) Payroll Taxes 14,000 11,972 2,028 Employee Educational Expense 3,000 2,462 538
Total Salaries and Benefits 662,750 672,486 (9,736)
Administrative Expenses:Regular Board Payments 7,500 6,400 1,100 Special Board Meetings 2,300 1,700 600 Board/Committee Expenses 1,300 886 414 Conferences and Seminars - Board 4,000 4,085 (85) Board Travel and Lodging 5,000 4,991 9 Dues/Membership - District 19,500 14,228 5,272 Office Supplies 7,000 6,135 865 E-Pay Online 6,750 6,291 459 Communications 14,000 12,663 1,337 Printing and Publications 5,000 3,989 1,011 Postage and Shipping 15,000 13,356 1,644 Utilities 4,000 2,455 1,545 Miscellaneous Office Expense 11,200 10,868 332 Other Professional Services 10,000 7,678 2,322 Office Equipment Maintenance 2,700 4,175 (1,475) Equipment Purchases 57,000 - 57,000 Insurance 22,500 20,732 1,768 Accounting Services 39,500 38,645 855 Computer Services 17,600 10,731 6,869 Legal Services 25,000 16,938 8,062 Payroll Services - 31 Engineering Services 51,000 4,742 46,258 Bank and Trustee Fees 6,000 1,765 4,235 Legal Notices Publication Expense 5,000 1,180 3,820 Public Information Expense 1,500 1,150 350
Total Administrative Expenses 340,350$ 195,814$ 144,536$
Year Ended June 30, 2015
Channel Islands Beach Community Services DistrictSchedule of Revenues and Expenses - Budget to Actual - All Activities - Continued
29
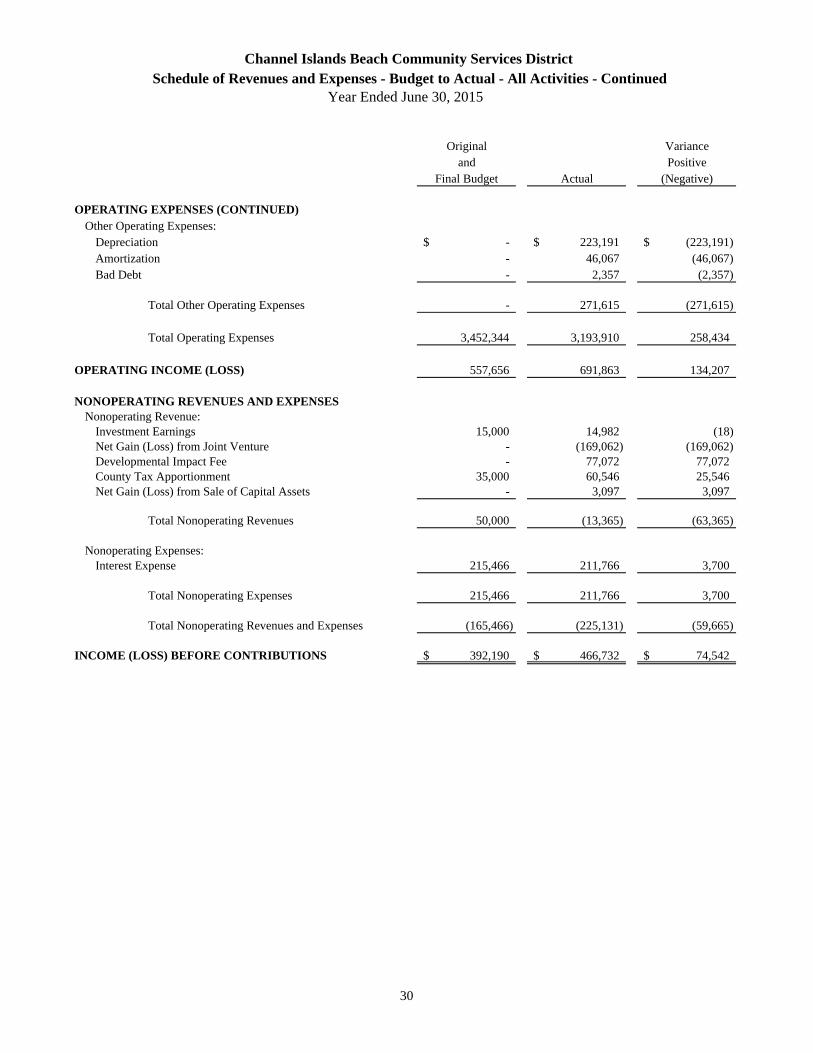
Original Varianceand Positive
Final Budget Actual (Negative)
OPERATING EXPENSES (CONTINUED)Other Operating Expenses:
Depreciation -$ 223,191$ (223,191)$ Amortization - 46,067 (46,067) Bad Debt - 2,357 (2,357)
Total Other Operating Expenses - 271,615 (271,615)
Total Operating Expenses 3,452,344 3,193,910 258,434
OPERATING INCOME (LOSS) 557,656 691,863 134,207
NONOPERATING REVENUES AND EXPENSESNonoperating Revenue:
Investment Earnings 15,000 14,982 (18) Net Gain (Loss) from Joint Venture - (169,062) (169,062) Developmental Impact Fee - 77,072 77,072 County Tax Apportionment 35,000 60,546 25,546 Net Gain (Loss) from Sale of Capital Assets - 3,097 3,097
Total Nonoperating Revenues 50,000 (13,365) (63,365)
Nonoperating Expenses:Interest Expense 215,466 211,766 3,700
Total Nonoperating Expenses 215,466 211,766 3,700
Total Nonoperating Revenues and Expenses (165,466) (225,131) (59,665)
INCOME (LOSS) BEFORE CONTRIBUTIONS 392,190$ 466,732$ 74,542$
Schedule of Revenues and Expenses - Budget to Actual - All Activities - ContinuedYear Ended June 30, 2015
Channel Islands Beach Community Services District
30
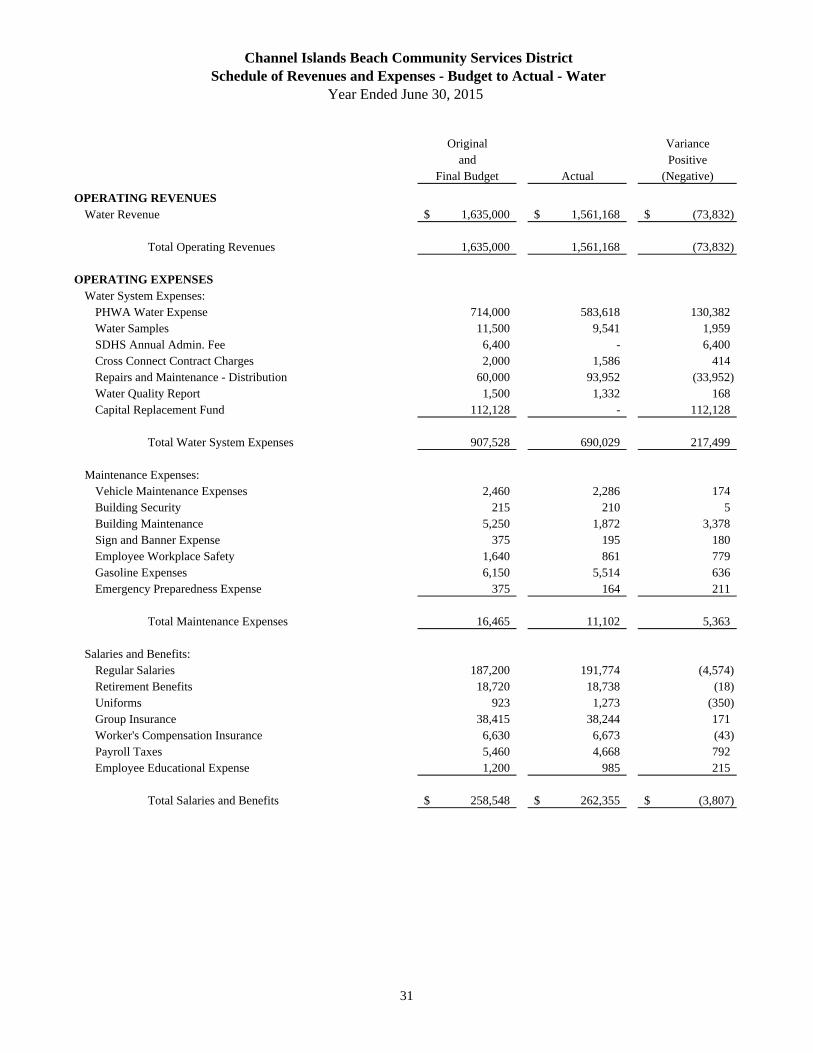
Original Varianceand Positive
Final Budget Actual (Negative)
OPERATING REVENUESWater Revenue 1,635,000$ 1,561,168$ (73,832)$
Total Operating Revenues 1,635,000 1,561,168 (73,832)
OPERATING EXPENSESWater System Expenses:
PHWA Water Expense 714,000 583,618 130,382 Water Samples 11,500 9,541 1,959 SDHS Annual Admin. Fee 6,400 - 6,400 Cross Connect Contract Charges 2,000 1,586 414 Repairs and Maintenance - Distribution 60,000 93,952 (33,952) Water Quality Report 1,500 1,332 168 Capital Replacement Fund 112,128 - 112,128
Total Water System Expenses 907,528 690,029 217,499
Maintenance Expenses:Vehicle Maintenance Expenses 2,460 2,286 174 Building Security 215 210 5 Building Maintenance 5,250 1,872 3,378 Sign and Banner Expense 375 195 180 Employee Workplace Safety 1,640 861 779 Gasoline Expenses 6,150 5,514 636 Emergency Preparedness Expense 375 164 211
Total Maintenance Expenses 16,465 11,102 5,363
Salaries and Benefits:Regular Salaries 187,200 191,774 (4,574) Retirement Benefits 18,720 18,738 (18) Uniforms 923 1,273 (350) Group Insurance 38,415 38,244 171 Worker's Compensation Insurance 6,630 6,673 (43) Payroll Taxes 5,460 4,668 792 Employee Educational Expense 1,200 985 215
Total Salaries and Benefits 258,548$ 262,355$ (3,807)$
Year Ended June 30, 2015
Channel Islands Beach Community Services DistrictSchedule of Revenues and Expenses - Budget to Actual - Water
31

Original Varianceand Positive
Final Budget Actual (Negative)
OPERATING EXPENSES (CONTINUED)Administrative Expenses:
Regular Board Payments 2,250$ 1,920$ 330$ Special Board Meetings 690 510 180 Board/Committee Expenses 390 266 124 Conferences and Seminars - Board 1,360 1,389 (29) Board Travel and Lodging 2,000 1,996 4 Dues/Membership - District 7,994 5,833 2,161 Office Supplies 2,240 1,963 277 E-Pay Online 2,295 2,139 156 Communications 3,500 3,166 334 Printing and Publications 1,500 1,197 303 Postage and Shipping 4,500 4,007 493 Utilities 1,200 737 463 Miscellaneous Office Expense 3,360 3,260 100 Other Professional Services 3,000 2,303 697 Office Equipment Maintenance 1,296 2,003 (707) Equipment Purchases 21,090 - 21,090 Insurance 7,875 7,256 619 Accounting Services 17,380 17,004 376 Computer Services 5,280 3,219 2,061 Legal Services 11,000 7,453 3,547 Payroll Services - 9 (9) Engineering Services 7,650 711 6,939 Bank and Trustee Fees 960 282 678 Legal Notices Publication Expense 1,700 401 1,299 Public Information Expense 375 288 87
Total Administrative Expenses 110,885 69,312 41,573
Other Operating Expenses:Depreciation - 113,827 (113,827) Amortization - 47,197 (47,197) Bad Debt - 801 (801)
Total Other Operating Expenses - 161,825 (161,825)
Total Operating Expenses 1,293,426 1,194,623 98,803
OPERATING INCOME (LOSS) 341,574$ 366,545$ 24,971$
Year Ended June 30, 2015
Channel Islands Beach Community Services DistrictSchedule of Revenues and Expenses - Budget to Actual - Water - Continued
32
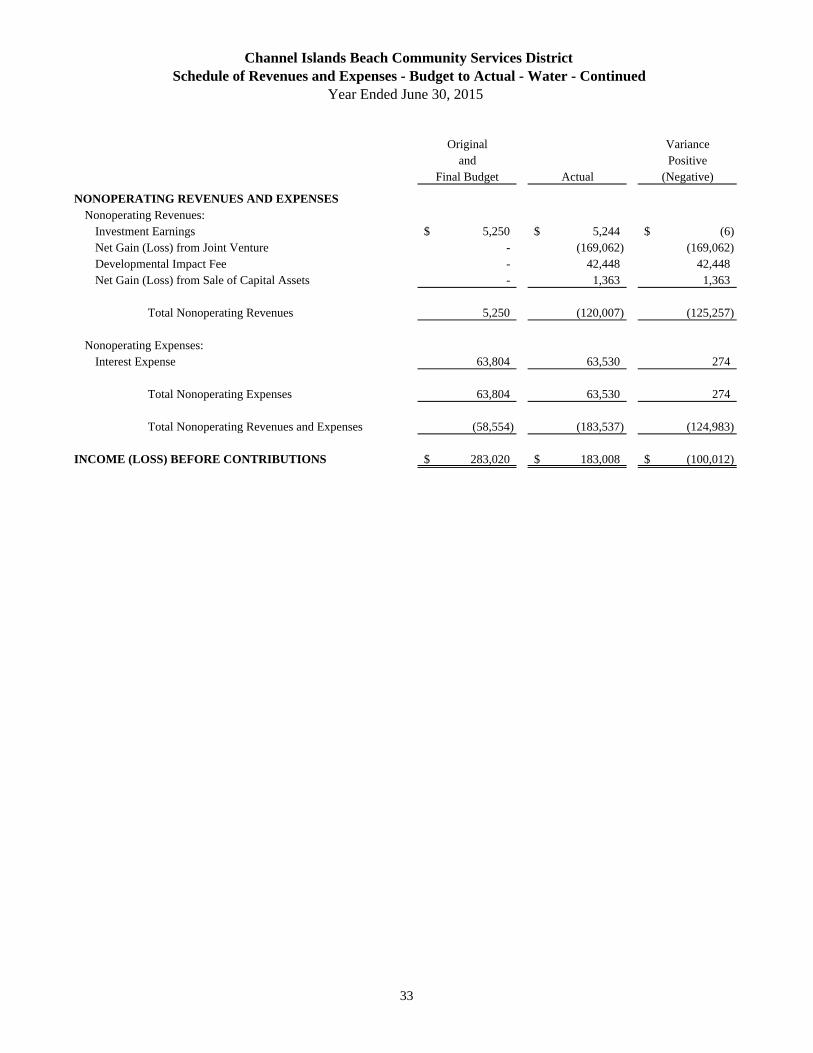
Original Varianceand Positive
Final Budget Actual (Negative)
NONOPERATING REVENUES AND EXPENSESNonoperating Revenues:
Investment Earnings 5,250$ 5,244$ (6)$ Net Gain (Loss) from Joint Venture - (169,062) (169,062) Developmental Impact Fee - 42,448 42,448 Net Gain (Loss) from Sale of Capital Assets - 1,363 1,363
Total Nonoperating Revenues 5,250 (120,007) (125,257)
Nonoperating Expenses:Interest Expense 63,804 63,530 274
Total Nonoperating Expenses 63,804 63,530 274
Total Nonoperating Revenues and Expenses (58,554) (183,537) (124,983)
INCOME (LOSS) BEFORE CONTRIBUTIONS 283,020$ 183,008$ (100,012)$
Schedule of Revenues and Expenses - Budget to Actual - Water - ContinuedYear Ended June 30, 2015
Channel Islands Beach Community Services District
33
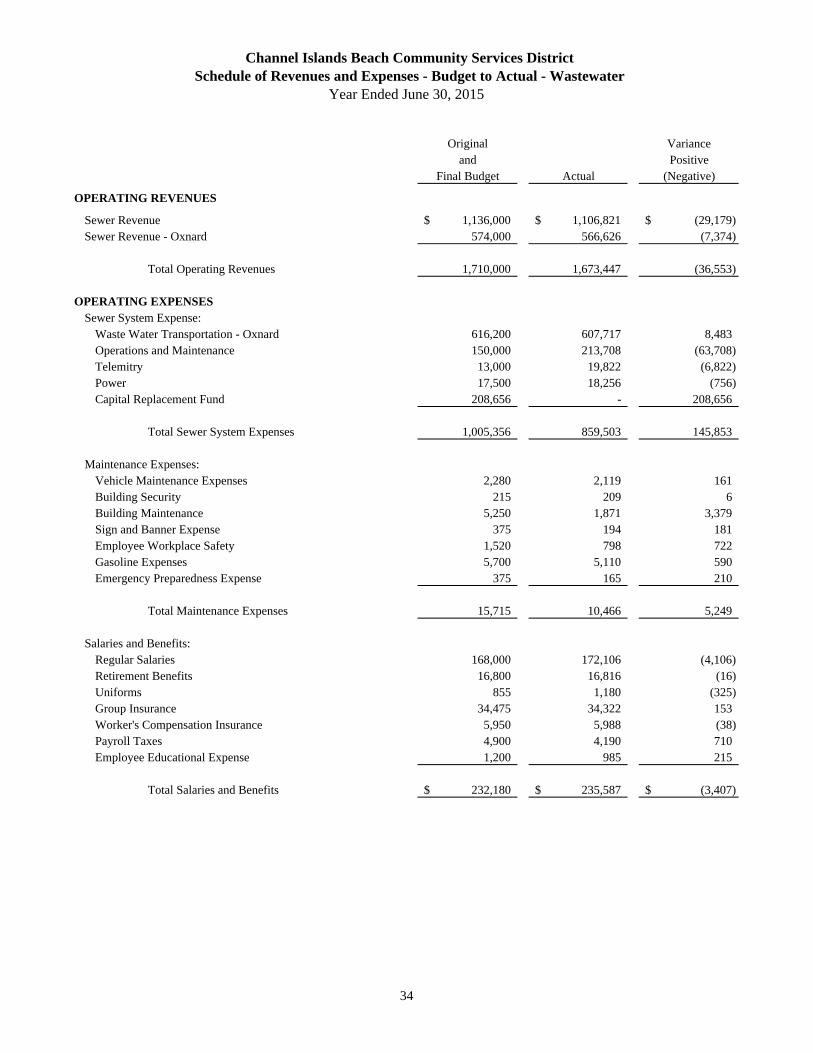
Original Varianceand Positive
Final Budget Actual (Negative)
OPERATING REVENUES
Sewer Revenue 1,136,000$ 1,106,821$ (29,179)$ Sewer Revenue - Oxnard 574,000 566,626 (7,374)
Total Operating Revenues 1,710,000 1,673,447 (36,553)
OPERATING EXPENSESSewer System Expense:
Waste Water Transportation - Oxnard 616,200 607,717 8,483 Operations and Maintenance 150,000 213,708 (63,708) Telemitry 13,000 19,822 (6,822) Power 17,500 18,256 (756) Capital Replacement Fund 208,656 - 208,656
Total Sewer System Expenses 1,005,356 859,503 145,853
Maintenance Expenses:
Vehicle Maintenance Expenses 2,280 2,119 161 Building Security 215 209 6 Building Maintenance 5,250 1,871 3,379 Sign and Banner Expense 375 194 181 Employee Workplace Safety 1,520 798 722 Gasoline Expenses 5,700 5,110 590 Emergency Preparedness Expense 375 165 210
Total Maintenance Expenses 15,715 10,466 5,249
Salaries and Benefits:Regular Salaries 168,000 172,106 (4,106) Retirement Benefits 16,800 16,816 (16) Uniforms 855 1,180 (325) Group Insurance 34,475 34,322 153 Worker's Compensation Insurance 5,950 5,988 (38) Payroll Taxes 4,900 4,190 710 Employee Educational Expense 1,200 985 215
Total Salaries and Benefits 232,180$ 235,587$ (3,407)$
Year Ended June 30, 2015
Channel Islands Beach Community Services DistrictSchedule of Revenues and Expenses - Budget to Actual - Wastewater
34

Original Varianceand Positive
Final Budget Actual (Negative)
OPERATING EXPENSES (CONTINUED)Administrative Expenses:
Regular Board Payments 2,250$ 1,920$ 330$ Special Board Meetings 690 510 180 Board/Committee Expenses 390 266 124 Conferences and Seminars - Board 1,360 1,389 (29) Board Travel and Lodging 2,000 1,996 4 Dues/Membership - District 6,240 4,553 1,687 Office Supplies 2,240 1,963 277 E-Pay Online 2,228 2,076 152 Communications 3,500 3,165 335 Printing and Publications 1,500 1,197 303 Postage and Shipping 4,500 4,007 493 Utilities 1,200 737 463 Miscellaneous Office Expense 3,360 3,260 100 Other Professional Services 3,000 2,303 697 Office Equipment Maintenance 756 1,169 (413) Equipment Purchases 31,920 - 31,920 Insurance 7,875 7,256 619 Accounting Services 12,640 12,366 274 Computer Services 5,280 3,219 2,061 Legal Services 8,000 5,420 2,580 Engineering Services 43,350 4,031 39,319 Payroll Services 9 (9) Bank and Trustee Fees 3,120 918 2,202 Legal Notices Publication Expense 1,650 389 1,261 Public Information Expense 375 288 87
Total Administrative Expenses 149,424 64,407 85,017
Other Operating Expenses:Depreciation - 102,668 (102,668) Amortization - (1,130) 1,130 Bad Debt - 778 (778)
Total Other Operating Expenses - 102,316 (102,316)
Total Operating Expenses 1,402,675 1,272,279 130,396
OPERATING INCOME (LOSS) 307,325$ 401,168$ 93,843$
Year Ended June 30, 2015
Channel Islands Beach Community Services DistrictSchedule of Revenues and Expenses - Budget to Actual - Wastewater - Continued
35
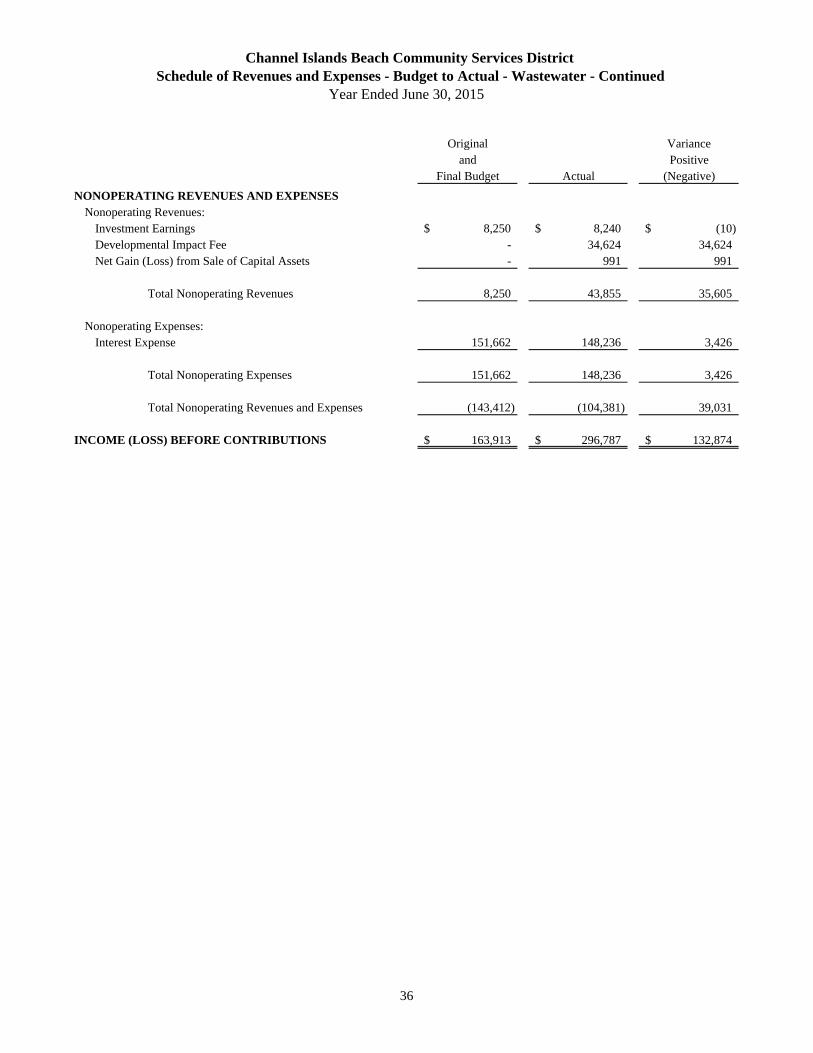
Original Varianceand Positive
Final Budget Actual (Negative)
NONOPERATING REVENUES AND EXPENSESNonoperating Revenues:
Investment Earnings 8,250$ 8,240$ (10)$ Developmental Impact Fee - 34,624 34,624 Net Gain (Loss) from Sale of Capital Assets - 991 991
Total Nonoperating Revenues 8,250 43,855 35,605
Nonoperating Expenses:Interest Expense 151,662 148,236 3,426
Total Nonoperating Expenses 151,662 148,236 3,426
Total Nonoperating Revenues and Expenses (143,412) (104,381) 39,031
INCOME (LOSS) BEFORE CONTRIBUTIONS 163,913$ 296,787$ 132,874$
Year Ended June 30, 2015
Channel Islands Beach Community Services DistrictSchedule of Revenues and Expenses - Budget to Actual - Wastewater - Continued
36

Original Varianceand Positive
Final Budget Actual (Negative)
OPERATING REVENUESTrash Revenue 665,000$ 651,158$ (13,842)$
Total Operating Revenues 665,000 651,158 (13,842)
OPERATING EXPENSESTrash Expense:
Trash Service 485,000 472,312 12,688
Total Trash Expense 485,000 472,312 12,688
Maintenance Expenses:Vehicle Maintenance Expenses 720 669 51 Building Security 215 209 6 Building Maintenance 5,250 1,871 3,379 Sign and Banner Expense 375 194 181 Employee Workplace Safety 480 252 228 Gasoline Expenses 1,800 1,614 186 Emergency Preparedness Expense 375 165 210
Total Maintenance Expenses 9,215 4,974 4,241
Salaries and Benefits:Regular Salaries 81,600 83,594 (1,994) Retirement Benefits 8,160 8,168 (8) Uniforms 270 372 (102) Group Insurance 16,745 16,671 74 Worker's Compensation Insurance 2,890 2,909 (19) Payroll Taxes 2,380 2,035 345 Employee Educational Expense 450 369 81
Total Salaries and Benefits 112,495 114,118 (1,623)
Administrative Expenses:Regular Board Payments 750$ 640$ 110$ Special Board Meetings 230 170 60 Board/Committee Expenses 130 89 41 Conferences and Seminars - Board 640 654 (14) Board Travel and Lodging 750 749 1 Dues/Membership - District 3,315 2,419 896 E-Pay Online 2,227 2,076 151
Year Ended June 30, 2015
Channel Islands Beach Community Services DistrictSchedule of Revenues and Expenses - Budget to Actual - Solid Waste Disposal
37
Original Varianceand Positive
Final Budget Actual (Negative)
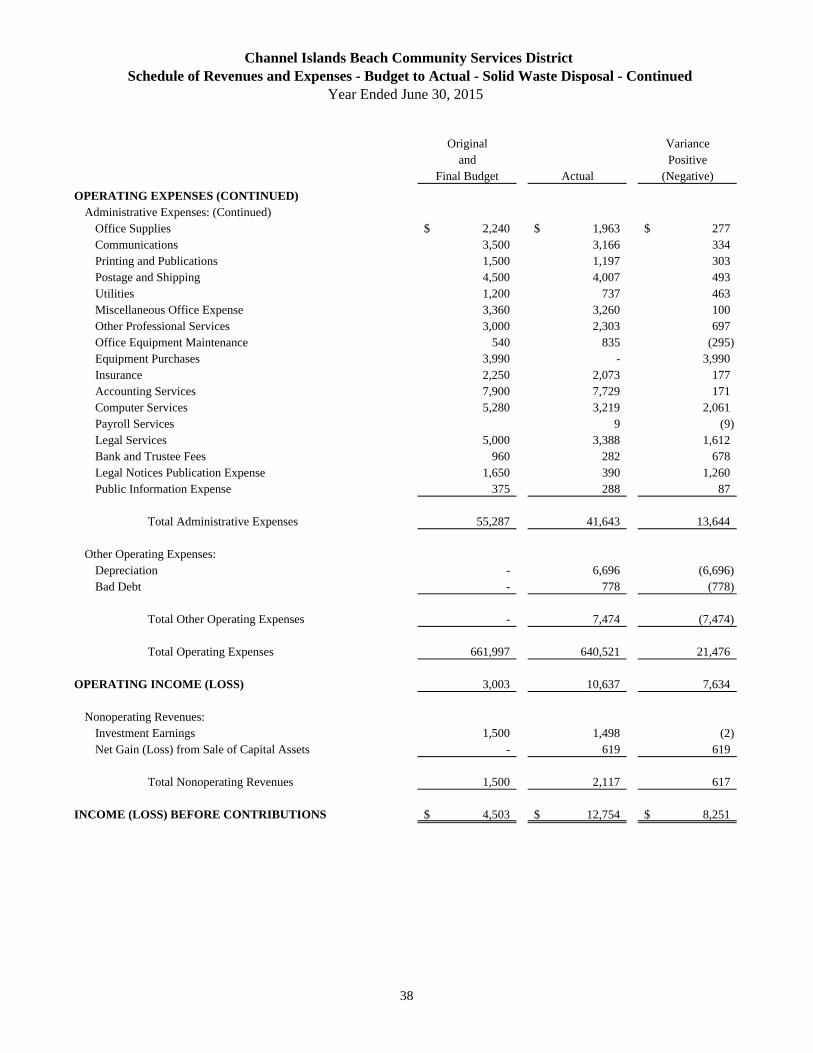
OPERATING EXPENSES (CONTINUED)Administrative Expenses: (Continued)
Office Supplies 2,240$ 1,963$ 277$ Communications 3,500 3,166 334 Printing and Publications 1,500 1,197 303 Postage and Shipping 4,500 4,007 493 Utilities 1,200 737 463 Miscellaneous Office Expense 3,360 3,260 100 Other Professional Services 3,000 2,303 697 Office Equipment Maintenance 540 835 (295) Equipment Purchases 3,990 - 3,990 Insurance 2,250 2,073 177 Accounting Services 7,900 7,729 171 Computer Services 5,280 3,219 2,061 Payroll Services 9 (9) Legal Services 5,000 3,388 1,612 Bank and Trustee Fees 960 282 678 Legal Notices Publication Expense 1,650 390 1,260 Public Information Expense 375 288 87
Total Administrative Expenses 55,287 41,643 13,644
Other Operating Expenses:Depreciation - 6,696 (6,696) Bad Debt - 778 (778)
Total Other Operating Expenses - 7,474 (7,474)
Total Operating Expenses 661,997 640,521 21,476
OPERATING INCOME (LOSS) 3,003 10,637 7,634
Nonoperating Revenues:Investment Earnings 1,500 1,498 (2) Net Gain (Loss) from Sale of Capital Assets - 619 619
Total Nonoperating Revenues 1,500 2,117 617
INCOME (LOSS) BEFORE CONTRIBUTIONS 4,503$ 12,754$ 8,251$
Year Ended June 30, 2015
Channel Islands Beach Community Services DistrictSchedule of Revenues and Expenses - Budget to Actual - Solid Waste Disposal - Continued
38
Original Varianceand Positive
Final Budget Actual (Negative)
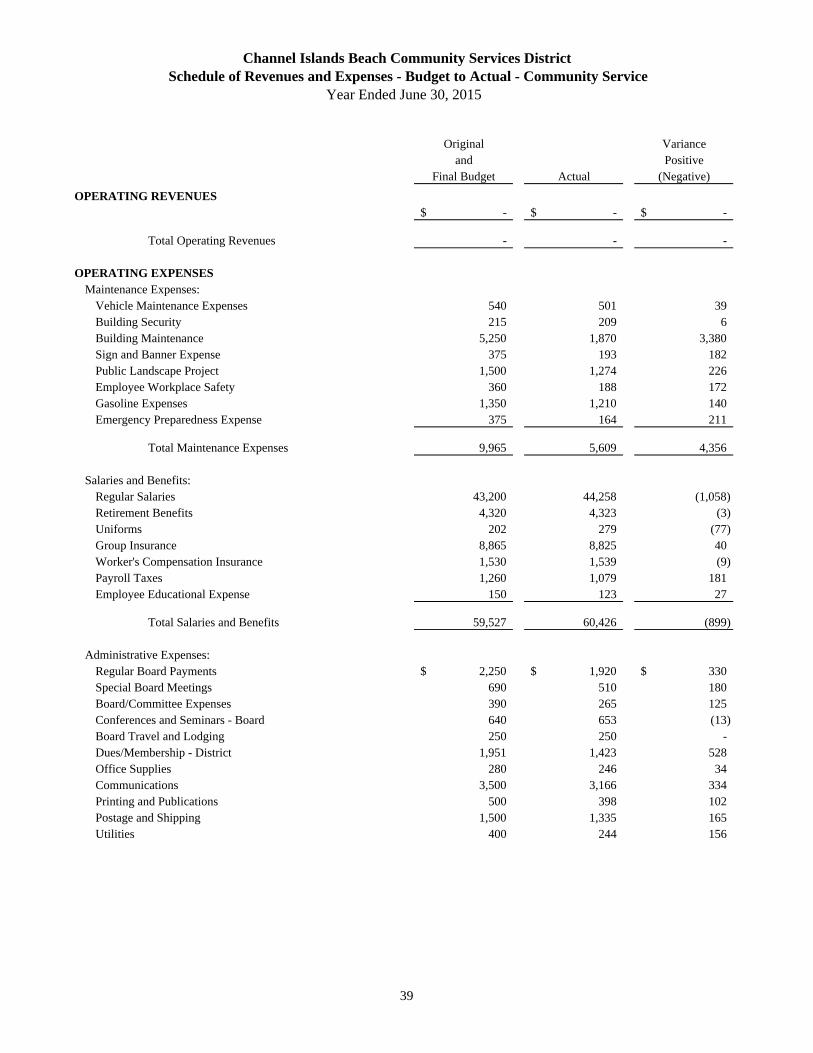
OPERATING REVENUES-$ -$ -$
Total Operating Revenues - - -
OPERATING EXPENSESMaintenance Expenses:
Vehicle Maintenance Expenses 540 501 39 Building Security 215 209 6 Building Maintenance 5,250 1,870 3,380 Sign and Banner Expense 375 193 182 Public Landscape Project 1,500 1,274 226 Employee Workplace Safety 360 188 172 Gasoline Expenses 1,350 1,210 140 Emergency Preparedness Expense 375 164 211
Total Maintenance Expenses 9,965 5,609 4,356
Salaries and Benefits:Regular Salaries 43,200 44,258 (1,058) Retirement Benefits 4,320 4,323 (3) Uniforms 202 279 (77) Group Insurance 8,865 8,825 40 Worker's Compensation Insurance 1,530 1,539 (9) Payroll Taxes 1,260 1,079 181 Employee Educational Expense 150 123 27
Total Salaries and Benefits 59,527 60,426 (899)
Administrative Expenses:Regular Board Payments 2,250$ 1,920$ 330$ Special Board Meetings 690 510 180 Board/Committee Expenses 390 265 125 Conferences and Seminars - Board 640 653 (13) Board Travel and Lodging 250 250 - Dues/Membership - District 1,951 1,423 528 Office Supplies 280 246 34 Communications 3,500 3,166 334 Printing and Publications 500 398 102 Postage and Shipping 1,500 1,335 165 Utilities 400 244 156
Year Ended June 30, 2015
Channel Islands Beach Community Services DistrictSchedule of Revenues and Expenses - Budget to Actual - Community Service
39
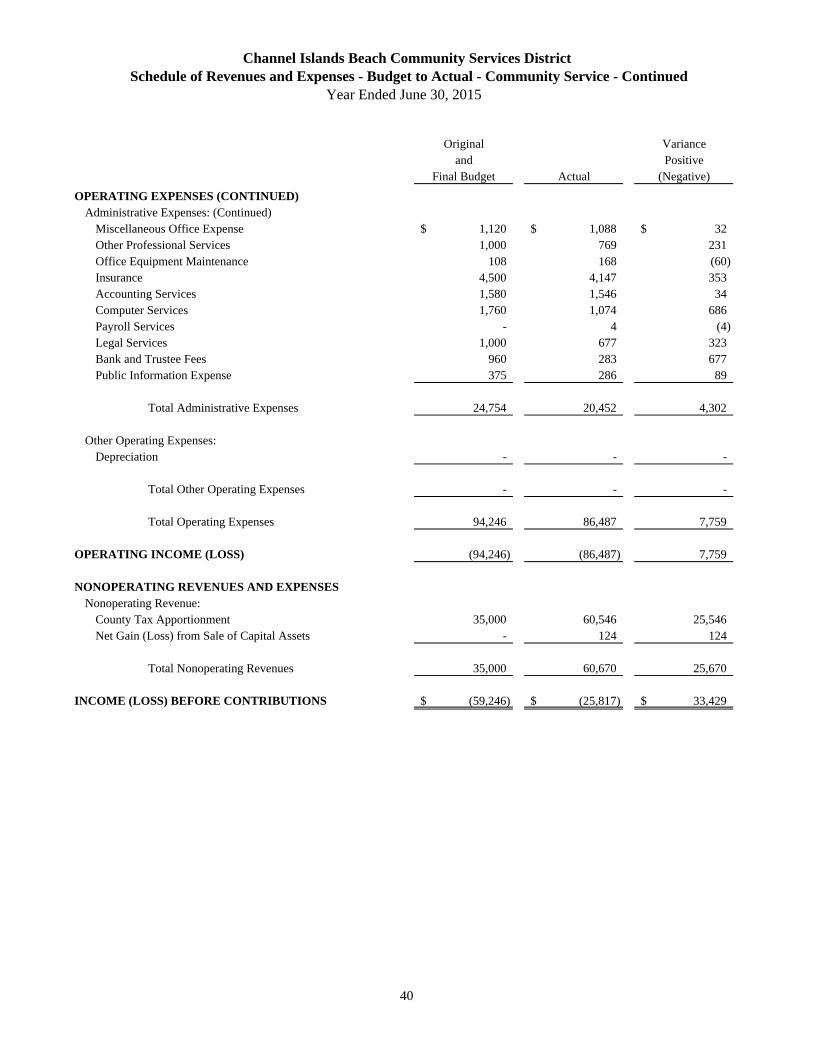
Original Varianceand Positive
Final Budget Actual (Negative)
OPERATING EXPENSES (CONTINUED)Administrative Expenses: (Continued)
Miscellaneous Office Expense 1,120$ 1,088$ 32$ Other Professional Services 1,000 769 231 Office Equipment Maintenance 108 168 (60) Insurance 4,500 4,147 353 Accounting Services 1,580 1,546 34 Computer Services 1,760 1,074 686 Payroll Services - 4 (4) Legal Services 1,000 677 323 Bank and Trustee Fees 960 283 677 Public Information Expense 375 286 89
Total Administrative Expenses 24,754 20,452 4,302
Other Operating Expenses:Depreciation - - -
Total Other Operating Expenses - - -
Total Operating Expenses 94,246 86,487 7,759
OPERATING INCOME (LOSS) (94,246) (86,487) 7,759
NONOPERATING REVENUES AND EXPENSESNonoperating Revenue:
County Tax Apportionment 35,000 60,546 25,546 Net Gain (Loss) from Sale of Capital Assets - 124 124
Total Nonoperating Revenues 35,000 60,670 25,670
INCOME (LOSS) BEFORE CONTRIBUTIONS (59,246)$ (25,817)$ 33,429$
Year Ended June 30, 2015
Channel Islands Beach Community Services DistrictSchedule of Revenues and Expenses - Budget to Actual - Community Service - Continued
40