channel strategy & business intelligence @ tpc
TRANSCRIPT
Channel Strategy & Business IntelligenceTPC INTRODUCTION
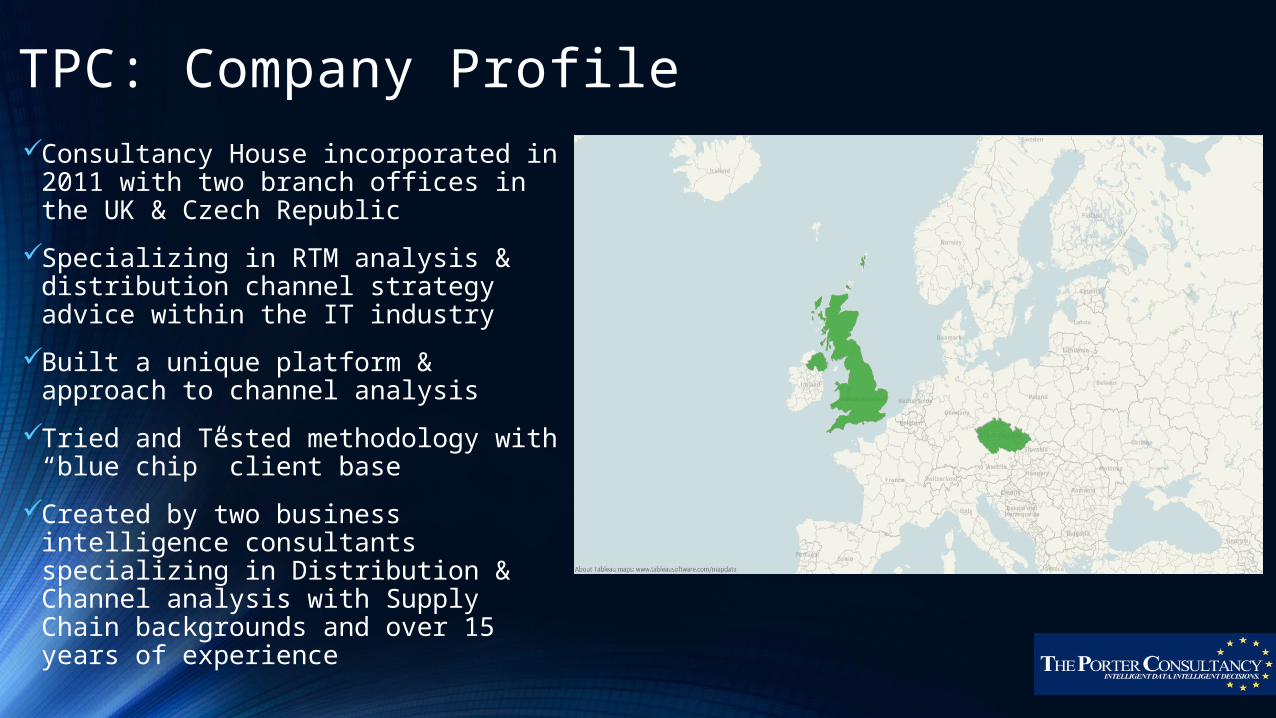
TPC: Company Profile
Consultancy House incorporated in 2011 with two branch offices in the UK & Czech Republic
Specializing in RTM analysis & distribution channel strategy advice within the IT industry
Built a unique platform & approach to channel analysis
Tried and Tested methodology with “blue chip” client base
Created by two business intelligence consultants specializing in Distribution & Channel analysis with Supply Chain backgrounds and over 15 years of experience
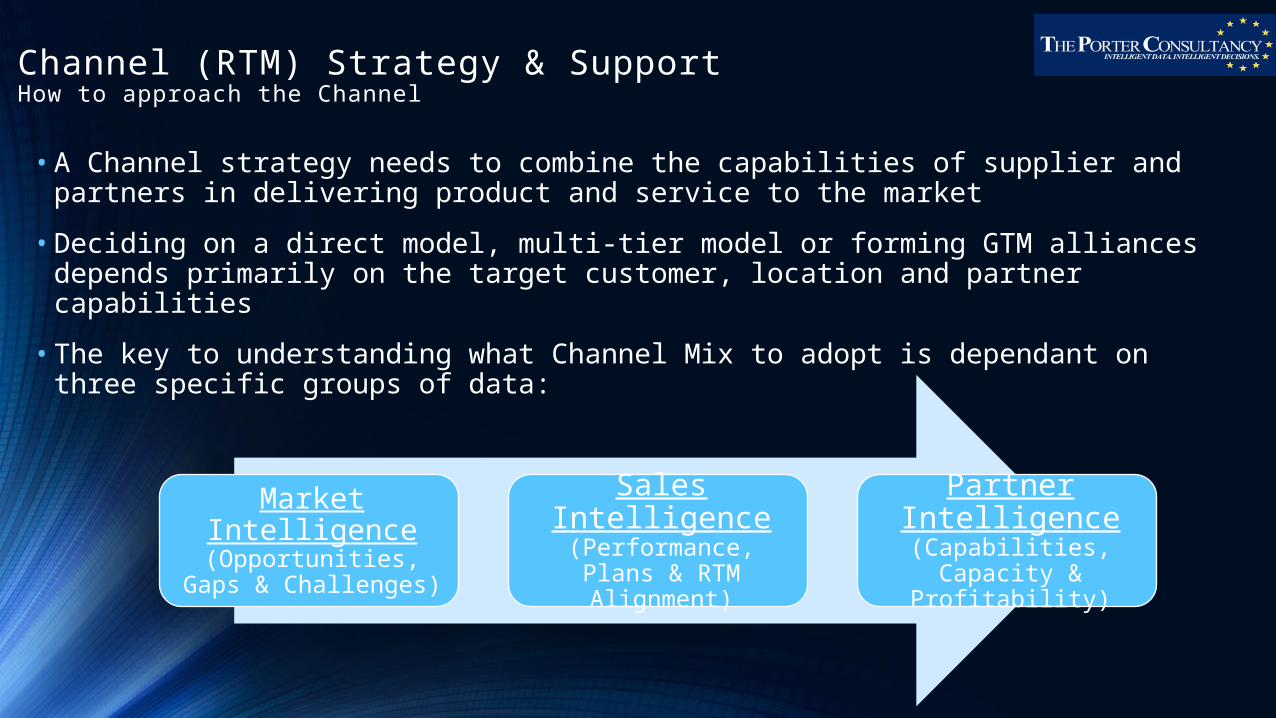
Channel (RTM) Strategy & SupportHow to approach the Channel
• A Channel strategy needs to combine the capabilities of supplier and partners in delivering product and service to the market
• Deciding on a direct model, multi-tier model or forming GTM alliances depends primarily on the target customer, location and partner capabilities
• The key to understanding what Channel Mix to adopt is dependant on three specific groups of data:
Market Intelligence
(Opportunities, Gaps & Challenges)
Sales Intelligence
(Performance, Plans & RTM Alignment)
Partner Intelligence (Capabilities, Capacity & Profitability)
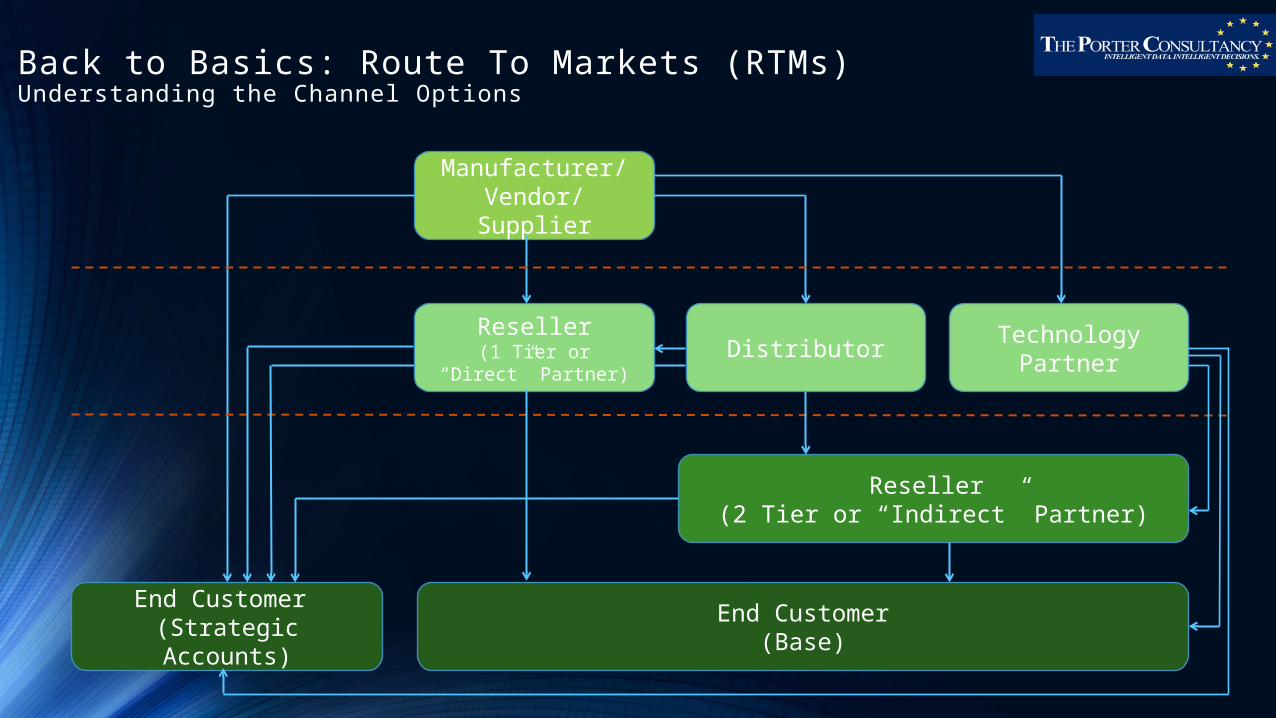
Back to Basics: Route To Markets (RTMs)Understanding the Channel Options
Manufacturer/ Vendor/ Supplier
Reseller (2 Tier or “Indirect” Partner)
Reseller(1 Tier or “Direct”
Partner)
End Customer(Base)
End Customer (Strategic Accounts)
DistributorTechnology
Partner
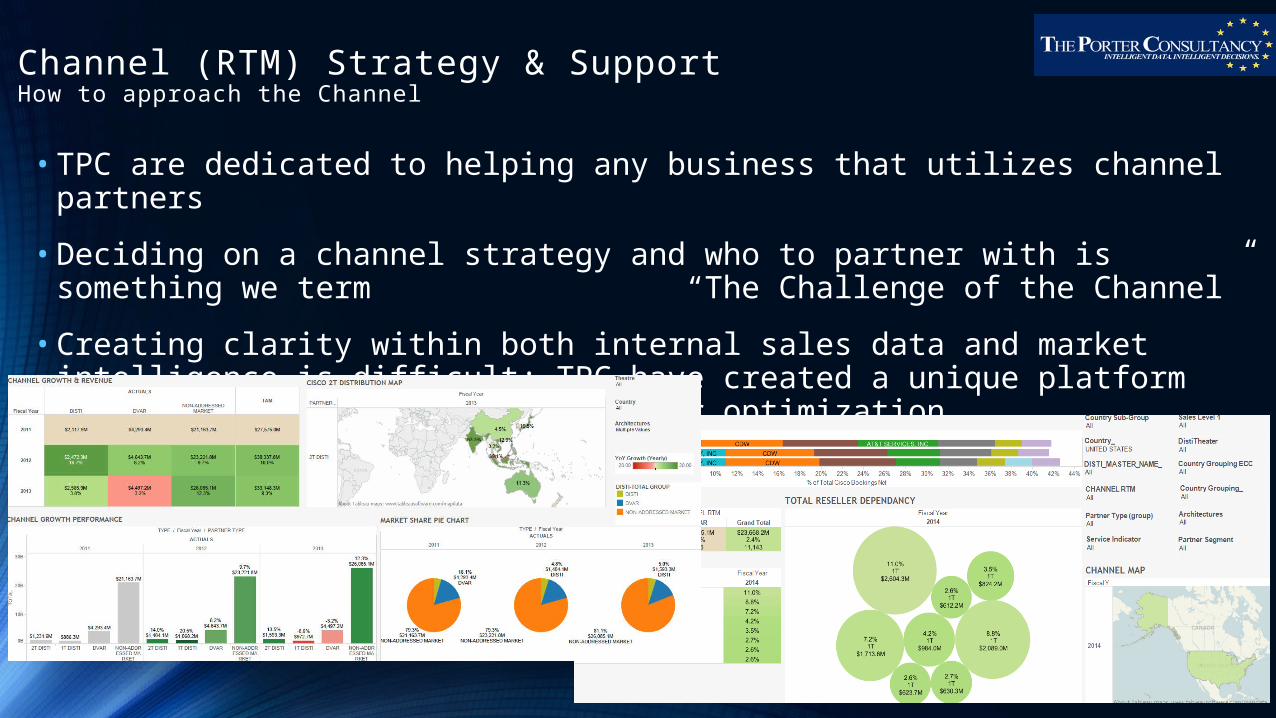
Channel (RTM) Strategy & SupportHow to approach the Channel
• TPC are dedicated to helping any business that utilizes channel partners
• Deciding on a channel strategy and who to partner with is something we term “The Challenge of the Channel”
• Creating clarity within both internal sales data and market intelligence is difficult; TPC have created a unique platform and approach to channel and partner optimization
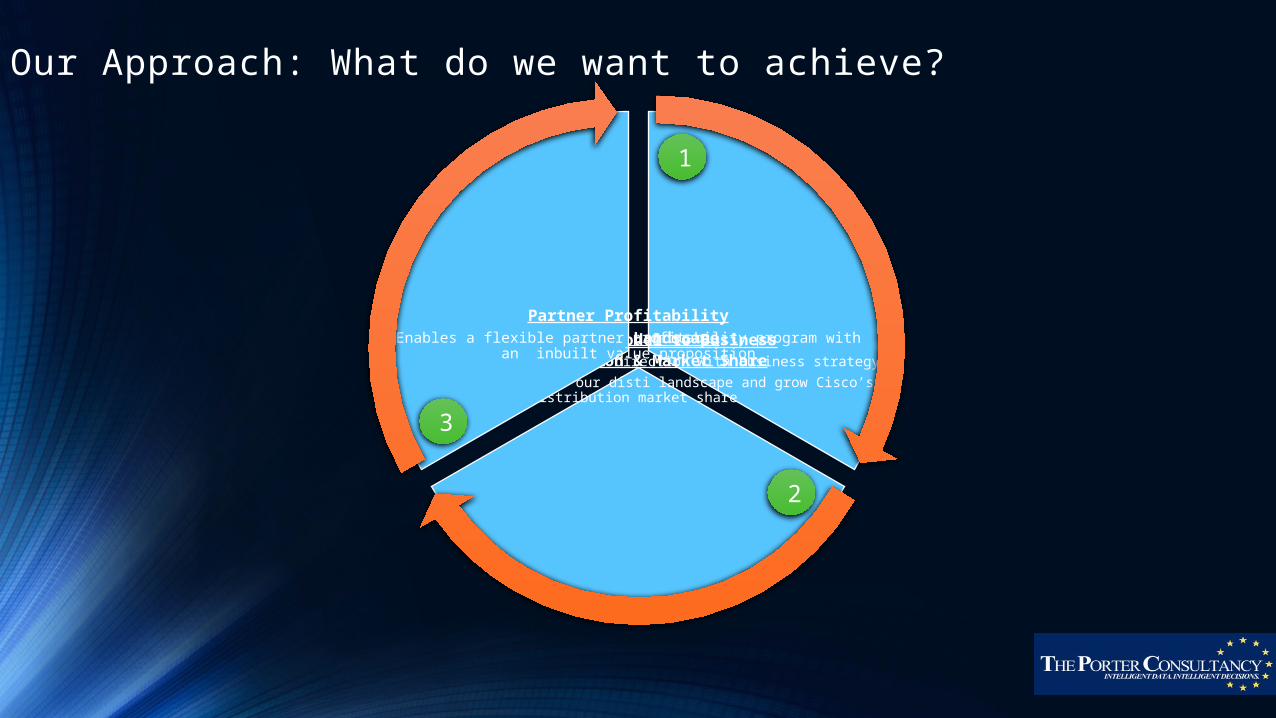
Our Approach: What do we want to achieve?
Align RTM Model to Business
Align channel strategic direction with business
strategy
Partner LandscapeOptimization & Market
ShareAssess the health of our disti landscape and grow Cisco’s distribution market share
Partner Profitability
Enables a flexible partner profitability program with an
inbuilt value proposition
3
2
1
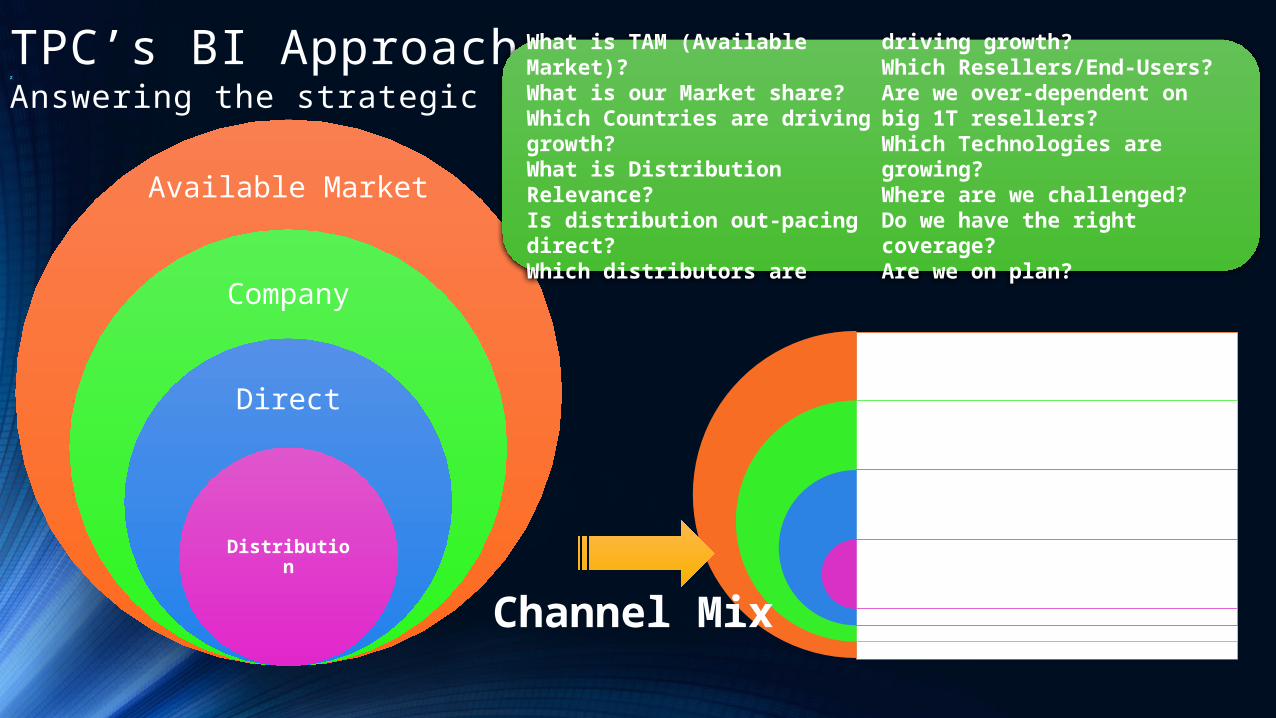
TPC’s BI Approachz
Answering the strategic questions
Available
Market
Company
Direct
Distribution
Geographical
Partner
Product
Customer
• Region• Theater• Country
• Global• Multi-Country• National
• Architecture• Technology
• Reseller• Certification• Vertical Markets
Channel Mix
What is TAM (Available Market)?What is our Market share?Which Countries are driving growth?What is Distribution Relevance?Is distribution out-pacing direct?Which distributors are driving growth?
Which Resellers/End-Users?Are we over-dependent on big 1T resellers?Which Technologies are growing?Where are we challenged?Do we have the right coverage?Are we on plan?
Account management &
partner responsibility
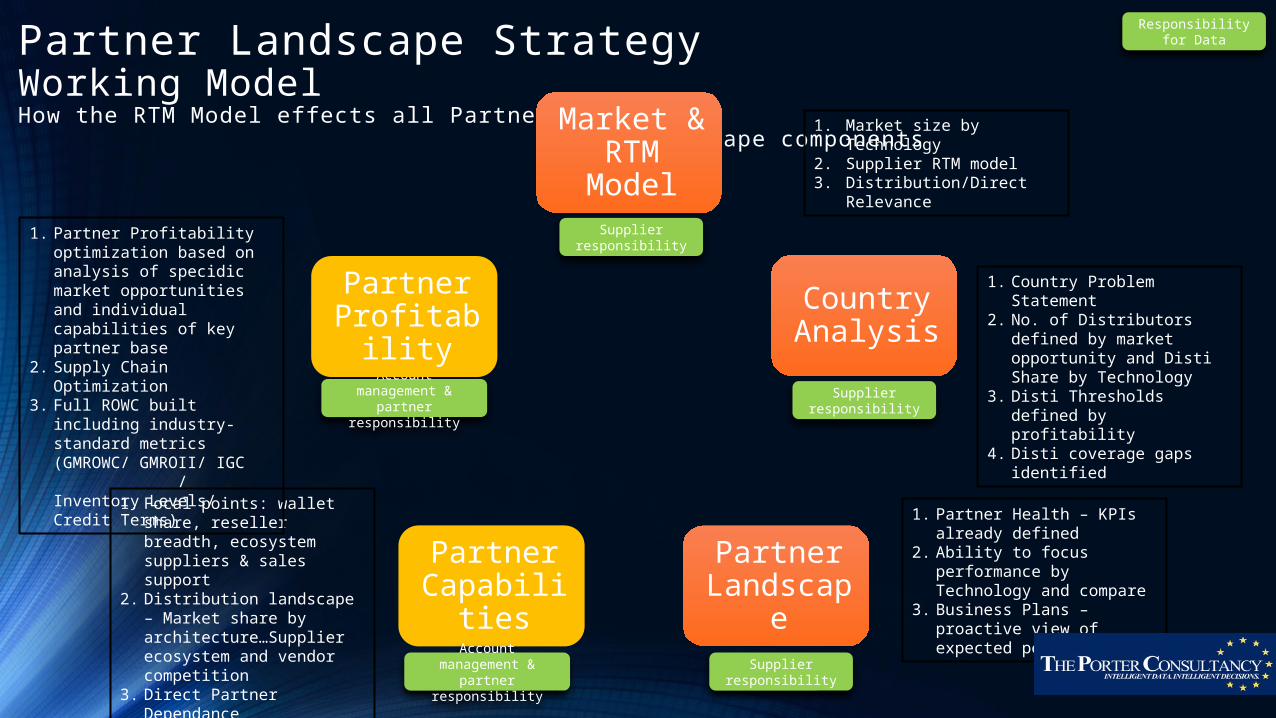
Partner Landscape StrategyWorking ModelHow the RTM Model effects all Partner Landscape components
Market & RTM
Model
Country Analysis
Partner Landscap
e
Partner Capabiliti
es
Partner Profitabilit
y
1. Market size by Technology2. Supplier RTM model3. Distribution/Direct
Relevance
1. Focal points: wallet share, reseller breadth, ecosystem suppliers & sales support
2. Distribution landscape – Market share by architecture…Supplier ecosystem and vendor competition
3. Direct Partner Dependance
1. Partner Health – KPIs already defined
2. Ability to focus performance by Technology and compare
3. Business Plans – proactive view of expected performance
1. Partner Profitability optimization based on analysis of specidic market opportunities and individual capabilities of key partner base
2. Supply Chain Optimization3. Full ROWC built including
industry-standard metrics (GMROWC/ GMROII/ IGC / Inventory Levels/ Credit Terms)
1. Country Problem Statement
2. No. of Distributors defined by market opportunity and Disti Share by Technology
3. Disti Thresholds defined by profitability
4. Disti coverage gaps identified
Supplier responsibility
Account management &
partner responsibility
Supplier responsibility
Supplier responsibility
Responsibility for Data
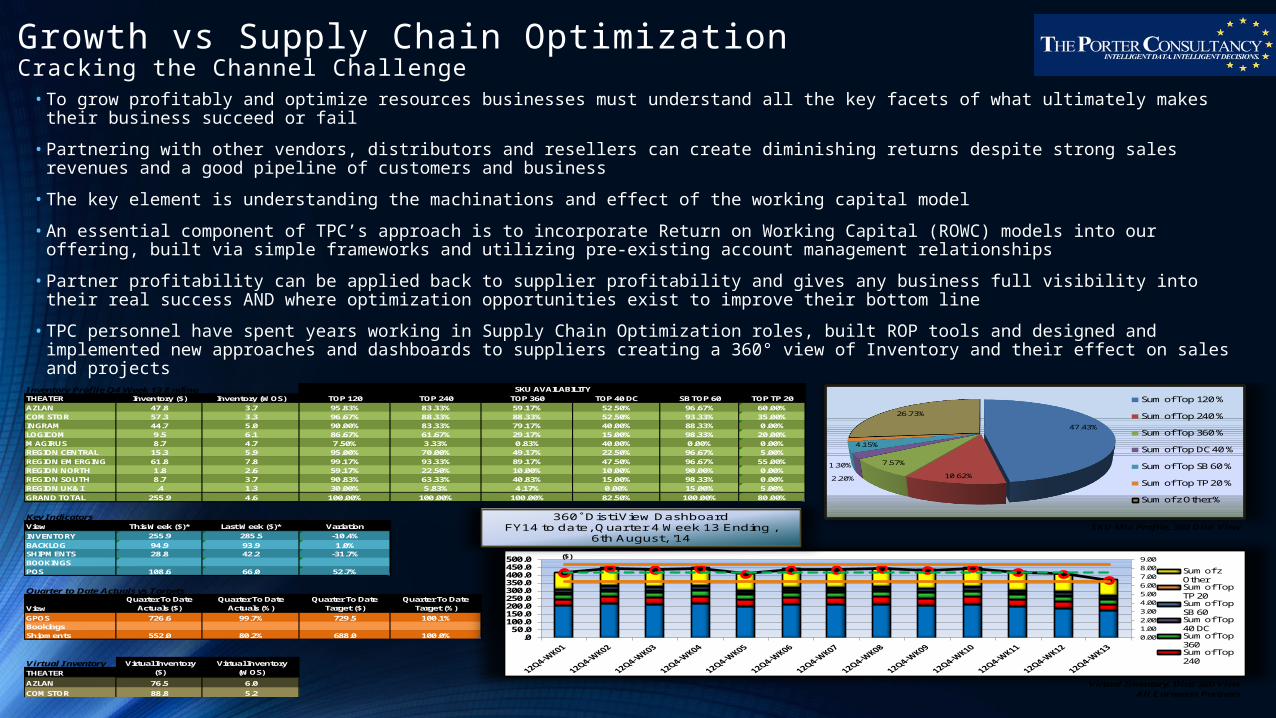
Growth vs Supply Chain OptimizationCracking the Channel Challenge• To grow profitably and optimize resources businesses must understand all the key facets of what ultimately makes their business succeed or fail
• Partnering with other vendors, distributors and resellers can create diminishing returns despite strong sales revenues and a good pipeline of customers and business
• The key element is understanding the machinations and effect of the working capital model
• An essential component of TPC’s approach is to incorporate Return on Working Capital (ROWC) models into our offering, built via simple frameworks and utilizing pre-existing account management relationships
• Partner profitability can be applied back to supplier profitability and gives any business full visibility into their real success AND where optimization opportunities exist to improve their bottom line
• TPC personnel have spent years working in Supply Chain Optimization roles, built ROP tools and designed and implemented new approaches and dashboards to suppliers creating a 360° view of Inventory and their effect on sales and projects
Inventory Profile Q4 Week 13 EndingTHEATER Inventory ($) Inventory (WOS) TOP 120 TOP 240 TOP 360 TOP 40 DC SB TOP 60 TOP TP 20AZLAN 47.8 3.7 95.83% 83.33% 59.17% 52.50% 96.67% 60.00%COMSTOR 57.3 3.3 96.67% 88.33% 88.33% 52.50% 93.33% 35.00%INGRAM 44.7 5.0 90.00% 83.33% 79.17% 40.00% 88.33% 0.00%LOGICOM 9.5 6.1 86.67% 61.67% 29.17% 15.00% 98.33% 20.00%MAGIRUS 8.7 4.7 7.50% 3.33% 0.83% 40.00% 0.00% 0.00%REGION CENTRAL 15.3 5.9 95.00% 70.00% 49.17% 22.50% 96.67% 5.00%REGION EMERGING 61.8 7.8 99.17% 93.33% 89.17% 47.50% 96.67% 55.00%REGION NORTH 1.8 2.6 59.17% 22.50% 10.00% 10.00% 90.00% 0.00%REGION SOUTH 8.7 3.7 90.83% 63.33% 40.83% 15.00% 98.33% 0.00%REGION UK&I .4 1.3 30.00% 5.83% 4.17% 0.00% 15.00% 5.00%GRAND TOTAL 255.9 4.6 100.00% 100.00% 100.00% 82.50% 100.00% 80.00%
Key IndicatorsView This Week ($)* Last Week ($)* Variation SKU Mix Profile, 360 Disti ViewINVENTORY 255.9 285.5 -10.4%BACKLOG 94.9 93.9 1.0%SHIPMENTS 28.8 42.2 -31.7%BOOKINGS 53.4 68.7 114.1%POS 108.6 66.0 52.7%
Quarter to Date Actuals vs Targets
ViewQuarter To Date
Actuals ($)Quarter To Date
Actuals (%)Quarter To Date
Target ($)Quarter To Date
Target (%)GPOS 726.6 99.7% 729.5 100.1%Bookings 476.6 68.7% 523.8 75.5%Shipments 552.0 80.2% 688.0 100.0%
Virtual InventoryTHEATER
AZLAN 76.5 6.0 Virtual Inventory, Disti 360 ViewCOMSTOR 88.8 5.2 All European Partners
SKU AVAILABILITY
Virtual Inventory ($)
Virtual Inventory (WOS)
0.001.002.003.004.005.006.007.008.009.00
.050.0
100.0150.0200.0250.0300.0350.0400.0450.0500.0 ($)
Sum of zOtherSum of TopTP 20Sum of TopSB 60Sum of Top40 DCSum of Top360Sum of Top240
360 ̊Disti View Dashboard FY14 to date, Quarter 4 Week 13 Ending ,
6th August, '14
47.43%
10.62%
7.57%
2.20%
4.15%
1.30%
26.73%
Sum of Top 120 %
Sum of Top 240 %
Sum of Top 360 %
Sum of Top DC 40 %
Sum of Top SB 60 %
Sum of Top TP 20 %
Sum of z Other %
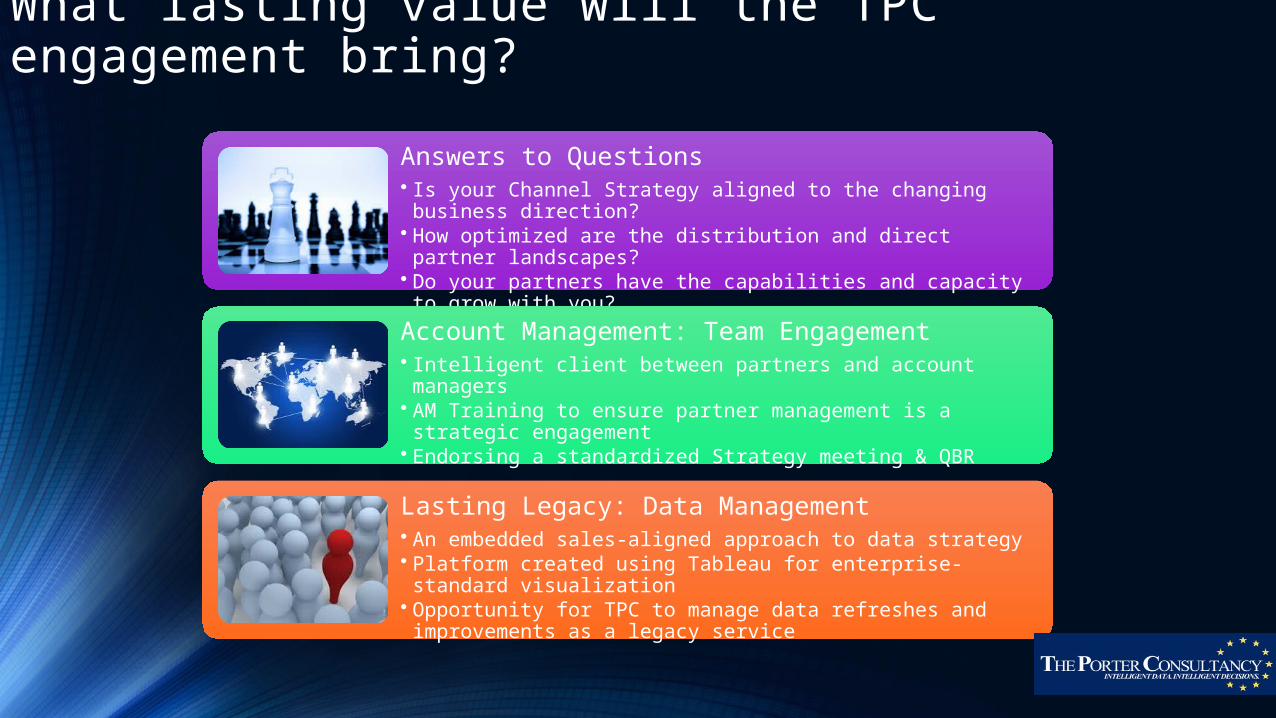
What lasting value will the TPC engagement bring?
Answers to Questions• Is your Channel Strategy aligned to the changing business direction?
• How optimized are the distribution and direct partner landscapes?
• Do your partners have the capabilities and capacity to grow with you?
• Monetized and Quantified recommendations to solve problemsAccount Management: Team Engagement• Intelligent client between partners and account managers• AM Training to ensure partner management is a strategic engagement
• Endorsing a standardized Strategy meeting & QBR
Lasting Legacy: Data Management• An embedded sales-aligned approach to data strategy• Platform created using Tableau for enterprise-standard visualization
• Opportunity for TPC to manage data refreshes and improvements as a legacy service
SummaryKey Messages
• Take advantage of a young talented consultancy with world-class expertise in a fast-moving market
• Technical capabilities range through RTM analysis, channel strategy, business planning, supply chain optimization, business intelligence (BI), data visualization & senior project management experience
• Ability to perform as the outsourcing arm to manage reporting requirements
• What did we miss? Contact us with any questions:
[email protected] 528 0234
www.theporterconsultancy.com