chao-ching chang1,2, meng-ju wu1,2, jer-yen...
TRANSCRIPT
1
Leptin-STAT3-G9a signaling promotes obesity-mediated breast cancer
progression
Chao-Ching Chang1,2, Meng-Ju Wu1,2, Jer-Yen Yang1,2, Ignacio Camarillo2,3, and
Chun-Ju Chang1,2,4
1Department of Basic Medical Sciences, Purdue University, West Lafayette, IN 47907, USA
2Center for Cancer Research, Purdue University, West Lafayette, IN 47907, USA
3Department of Biological Sciences, Purdue University, West Lafayette, IN 47907, USA
4Correspondence should be addressed to C.-J. Chang.
C.C. Chang and M.J. Wu contributed equally to this article
Phone: (765) 494-2648 Fax: (765) 494-0781
E-mail:[email protected]
Running title: Leptin directs epigenetic regulation to promote CSCs
The authors declare no conflicts of interest
on June 24, 2018. © 2015 American Association for Cancer Research. cancerres.aacrjournals.org Downloaded from
Author manuscripts have been peer reviewed and accepted for publication but have not yet been edited. Author Manuscript Published OnlineFirst on April 3, 2015; DOI: 10.1158/0008-5472.CAN-14-3076
2
Abstract
Obesity has been linked to breast cancer progression but the underlying mechanisms
remain obscure. Here we report how leptin, an obesity-associated adipokine,
regulates a transcriptional pathway to silence a genetic program of epithelial
homeostasis in breast cancer stem-like cells which promotes malignant progression.
Using genome-wide ChIP-seq and RNA expression profiling, we defined a role for
activated STAT3 and G9a histone methyltransferase in epigenetic silencing of
miR-200c, which promotes the formation of breast cancer stem-like cells (CSC)
defined by elevated cell surface levels of the leptin receptor (OBRhi). Inhibiting the
STAT3/G9a pathway restored expression of miR-200c, which in turn reversed the
CSC phenotype to a more differentiated epithelial phenotype. In a rat model of breast
cancer driven by diet-induced obesity, STAT3 blockade suppressed the CSC-like
OBRhi population and abrogated tumor progression. Together, our results show how
targeting STAT3-G9a signaling regulates CSC plasticity during obesity-related breast
cancer progression, suggesting a novel therapeutic paradigm to suppress CSC pools
and limit breast malignancy.
on June 24, 2018. © 2015 American Association for Cancer Research. cancerres.aacrjournals.org Downloaded from
Author manuscripts have been peer reviewed and accepted for publication but have not yet been edited. Author Manuscript Published OnlineFirst on April 3, 2015; DOI: 10.1158/0008-5472.CAN-14-3076
3
Introduction
Obesity is an established risk factor for breast cancer incidence, progression,
recurrence, and mortality (1, 2). The risk of breast cancer increases significantly in
women who have an elevated body mass index (30 kg/m2). Being overweight or
obese for a woman at the time she is diagnosed with breast cancer is linked to a high
risk of recurrence regardless of treatment factors (3). In rodents, high body weight is
also associated with increased incidence of spontaneous and chemically induced
tumors (4). Obesity in both humans and rodents is characterized by increased leptin
levels (4, 5). Accumulated evidence points to leptin signaling playing a significant role
in mammary development and tumorigenesis (6). Interestingly, recent studies have
further shown that leptin signaling may be involved in the promotion of the cancer
stem cell (CSC) phenotype (7-9). It is worthy to note that CSCs, a sub-population of
cancer cells that have acquired the stem cell properties associated with normal stem
cells, are considered to be the genesis of cancer and account for cancer initiation,
progression, and recurrence. It has been shown that an enlarged CSC population is
highly associated with tumor aggressiveness and recurrence (10, 11), and that in
response to microenvironmental stimuli, the CSC population can expand through
acquisition of epigenetic alterations that deregulate the balance of stemness versus
differentiation, and thereby drives the cancer progression (12). Nonetheless, the key
on June 24, 2018. © 2015 American Association for Cancer Research. cancerres.aacrjournals.org Downloaded from
Author manuscripts have been peer reviewed and accepted for publication but have not yet been edited. Author Manuscript Published OnlineFirst on April 3, 2015; DOI: 10.1158/0008-5472.CAN-14-3076
4
epigenetic mechanisms governing the emergence or expansion of breast CSCs,
particularly those in response to leptin signaling, still remain to be elucidated.
Using human mammary epithelial cells and human breast cancer cells
(primary tumor cells and cell lines), this study not only delineates the critical
epigenetic mechanism that leptin uses to promote the CSC traits, but also provides
molecular characterization of the leptin-induced breast CSC population. Using a
diet-induced obesity animal model of breast cancer, our data further elucidate that
therapeutic targeting of the leptin-induced CSC pool shows great promise to
effectively prevent obesity-related breast cancer progression. Furthermore,
correlation analysis of breast cancer patient specimens reveals that the molecular
signature associated with leptin-induced stemness can be used to predict
clinicopathological features and will potentially benefit the stratification and evaluation
of future therapeutic regimens.
Materials and Methods
Cell culture and treatment. The immortal normal mammary epithelial cells, MCF12A,
and the breast cancer cell line, MCF7, were purchased from American Type Culture
Collection (ATCC). Cells lines have been tested for mycoplasma free and
authenticated by ATCC using Short tandem repeat (STR) profiling and have not been
on June 24, 2018. © 2015 American Association for Cancer Research. cancerres.aacrjournals.org Downloaded from
Author manuscripts have been peer reviewed and accepted for publication but have not yet been edited. Author Manuscript Published OnlineFirst on April 3, 2015; DOI: 10.1158/0008-5472.CAN-14-3076
5
passaged for more than 6 months. Primary breast tumor cells (isolated from 12
low-grade tumors which include 10 luminal and 2 Her2+ tumors, and 12 high-grade
tumors which include 11 TNBC and 1 luminal tumor) were purchased from Promab
Inc. MCF12A cells were grown in DMEM-F12 medium supplemented with 5% horse
serum, epidermal growth factor (20ng/ml), insulin (10μg/ml), cholera toxin (1ng/ml),
hydrocortisone and gentamycin (Sigma). MCF7 cells were cultured with DMEM
medium supplemented with 10% FBS, penicillin (50U/ml), and streptomycin (50U/ml).
50μM human recombinant leptin protein (R&D Systems) and 50μM STAT3 specific
inhibitor, S3I-201 and 1μM G9a specific inhibitor, BIX01294 (Selleck Chemicals) were
used for the treatments in cells. Cells were serum starved for 8 hours prior to leptin
treatment.
Generation of stably expressed and knocked-down cell lines. Lentiviral infection
was performed as describe previously (13). Briefly, pCDH-puro or
pCDH-miR200c-puro was co-transfected with the third generation of lentiviral
packaging plasmids: pMDLg-pRRE, PRSV-Rev, and PMD2G into 293T cells by
LipofectamineTM2000 following the manufacturer’s instructions. At 24 and 48 hr
post-transfection, culture medium was harvested and subsequently incubated with
target cells in the presence of polybrene (5μg/ml) for 24hrs. At 48hr post-infection,
infected cells were harvested for gene and protein expression analysis or selected
on June 24, 2018. © 2015 American Association for Cancer Research. cancerres.aacrjournals.org Downloaded from
Author manuscripts have been peer reviewed and accepted for publication but have not yet been edited. Author Manuscript Published OnlineFirst on April 3, 2015; DOI: 10.1158/0008-5472.CAN-14-3076
6
with puromycin (2μg/ml) for 2 weeks to establish stably infected cells. Lentivirus
particles expressing short-hairpin RNAs, sh-STAT3, sh-G9a, and sh-OBR, were
purchased from Santa Cruz and the infection procedure was performed according to
the manufacturer’s instructions.
Mammary xenograft tumor. Isolation, infection, and culture of tumor spheres from
human primary breast tumor cells (Promab Inc) were performed as described
previously (13). Mammary fat pads of 6-week-old female NOD/SCID mice were
inoculated with indicated number of cells from the human primary breast tumor cells
(grade II-III) for a total volume of 100 µl per injection site. At the end of the second
week, prior to any palpable tumors, animals were given vehicle or S3I-201 i.v. at 5
mg/kg twice per week for 2 weeks (14). 4 weeks after inoculation, tumor incidences
were calculated and animals were sacrificed. All surgical procedures and animal
manipulations were performed under regulations of Purdue Animal Care and Use
Committee.
Establishment of the diet-induced obesity and breast cancer rat model.
Twenty-day-old outbred Sprague-Dawley rats were purchased from Harlan
laboratories. Pups were weaned 24 hours after arrival and maintained in a
temperature and light controlled animal facility. Animals were given ad libitum access
to water and randomly assigned to either the standard regular rat chow diet (Harlan
on June 24, 2018. © 2015 American Association for Cancer Research. cancerres.aacrjournals.org Downloaded from
Author manuscripts have been peer reviewed and accepted for publication but have not yet been edited. Author Manuscript Published OnlineFirst on April 3, 2015; DOI: 10.1158/0008-5472.CAN-14-3076
7
Teklad) or a Western diet (Research Diets). The regular rat chow diet contains 3.30
kcal/g with 18% protein, 5% fat, mainly from corn oil and 57% carbohydrates,
primarily in the form of complex polysaccharides. The Western diet contains 4.47
kcal/g with 20% protein, 21% fat, in the form of anhydrous milk fat and 50%
carbohydrates, 34% of which is sucrose. No significant difference was found in
consumption among groups (data not shown). At 54 days old, rats were grouped
according to their body fat composition determined by dual-energy x-ray
absorptometry (DEXA, Lunar Corporation). Animals on the Western diet were placed
into two groups with rats in the highest tertile being placed in the Western obese
group and rats in the lowest tertile being placed in the Western lean group. At 65 days
of age, half of the rats in Western diet each group were injected with 50 mg/kg of the
chemical carcinogen N-methylnitrosourea (MNU) (used in Figure 5) and the
remaining animals received 0.9% saline (used in Figure S5A-5B). Rats were
sacrificed by 168 days post injection or when the animal reached a terminal state as
determined by established guidelines (15). Intact mammary glands and tumors were
collected and flash frozen in liquid nitrogen or fixed in 10% neutral formalin for
histological evaluation. All animal experiments were conducted with approval of the
Purdue Animal Care and Use Committee.
on June 24, 2018. © 2015 American Association for Cancer Research. cancerres.aacrjournals.org Downloaded from
Author manuscripts have been peer reviewed and accepted for publication but have not yet been edited. Author Manuscript Published OnlineFirst on April 3, 2015; DOI: 10.1158/0008-5472.CAN-14-3076
8
Sphere formation under co-culture with epithelial free mammary fad pad.
Single tumor cells were isolated from the obese or lean rats and cultured in
suspension in low attachment culture wells to form spheres. The associated
epithelial-free fat pads were isolated as described previously (16) and then washed in
serum-free media and cut into explants of approximately 1 × 1 × 1 mm3 pieces.
Explants were randomly distributed onto cell-culture inserts (BD Biosciences; 3.0
micron pore size, high-density membrane) which were placed above the spheres
co-cultured in serum-free media.
Results
Leptin induces EMT and stem cell properties via activation of STAT3
To understand whether and how leptin influences mammary stem cell and CSC
population, including the epithelial-mesenchymal-transition (EMT) phenotype that
was previously linked to CSC traits (10, 13), we first treated human mammary
epithelial cells MCF12A and also breast cancer cells MCF7 with leptin for 3 days. We
found that leptin treatment induced a prominent EMT phenotype from a
cobblestonestone-like to a spindle-like morphology in both cell lines (Figure 1A),
accompanied by decreased expression of the epithelial marker, E-cadherin;
increased expression of the mesenchymal marker, N-cadherin (Figure 1B); and a
on June 24, 2018. © 2015 American Association for Cancer Research. cancerres.aacrjournals.org Downloaded from
Author manuscripts have been peer reviewed and accepted for publication but have not yet been edited. Author Manuscript Published OnlineFirst on April 3, 2015; DOI: 10.1158/0008-5472.CAN-14-3076
9
substantial enhancement in the putative stem cell population marked by CD24-CD44+
(Figure 1C).
It is known that leptin, bound to leptin receptor (OBR/LEPR) on the cell surface,
could activate a myriad of complex signaling cascades (2). To investigate the key
mechanism downstream of leptin that could potentially impact EMT and stem cell
properties in mammary epithelial cells, we next systematically examined the signaling
pathways regulated by leptin treatment in MCF12A cells using a protein antibody
array consisting of specific antibodies that detect the activation (phosphorylated or
cleaved) of important intracellular signaling nodes involving a variety of pathways,
such as AKT/mTOR/GSK3β, MAPK/ERK/p38/JNK, STAT1/3, p53, and
Caspase/PARP. Interestingly, leptin most significantly upregulated the
phosphorylation of STAT3 at Tyr705 (a 10.5-fold increase, P<0.05, Figure 1D, Table
S1). This result can be validated by immunoblotting in both MCF12A and MCF7 cells
(Figure 1E). Furthermore, the blocking of STAT3 activity by S3I-201, a STAT3 inhibitor
which blocks tyrosine phosphorylation, dimerization, and DNA binding of STAT3 in the
nucleus (14) markedly increased E-cadherin expression, while it decreased the levels
of N-cadherin and ZEB1 induced by leptin (Figure 1F). Similarly, specific inhibition of
STAT3 by knocking-down STAT3 using lentiviral delivered short-hairpin RNA reversed
leptin-promoted EMT phenotype and sphere formation in both MCF12A and MCF7
on June 24, 2018. © 2015 American Association for Cancer Research. cancerres.aacrjournals.org Downloaded from
Author manuscripts have been peer reviewed and accepted for publication but have not yet been edited. Author Manuscript Published OnlineFirst on April 3, 2015; DOI: 10.1158/0008-5472.CAN-14-3076
10
cells (Figure 1G and 1H). Together, these data suggest that leptin promotes the EMT
and stem cell properties via activation of STAT3.
Leptin induces STAT3-G9a interaction and their co-occupancy on targeted
gene promoters involved in cell differentiation
Although STAT proteins primarily act as a transcription activator, evidence has
suggested that they can mediate transcription repression of certain target genes by
recruiting the corepressor complex instead of the coactivator complex under
regulation of specific cellular contexts or chromatin features (17, 18). To determine
mechanism(s) underlying the regulation of the stem cell properties by leptin-activated
STAT3, a mass spectrometry analysis was used to identify potential chromatin
proteins that specifically interact with STAT3 in response to leptin treatment in MCF7
cells. Interestingly, we found that a histone methyltransferase G9a was significantly
associated with STAT3 in leptin-treated MCF12A cells, where endogenous STAT3
can be reciprocally co-immunoprecipitated with G9a in the nucleus (Table S2, Figure
2A). G9a, a H3K9 methyltransferase known to be highly expressed in a variety of
human cancers (19, 20), is responsible for mono- and di-methylation of H3K9 to
mediate epigenetic silencing. Nuclear STAT3 and G9a interaction appeared to be
specific and highly responsive to leptin as another known H3K9 methyltransferase
Suv39h1 could not interact with STAT3 regardless of the presence or absence of
on June 24, 2018. © 2015 American Association for Cancer Research. cancerres.aacrjournals.org Downloaded from
Author manuscripts have been peer reviewed and accepted for publication but have not yet been edited. Author Manuscript Published OnlineFirst on April 3, 2015; DOI: 10.1158/0008-5472.CAN-14-3076
11
leptin (Figure 2A). GST-pull down data also validated the direct physical interaction
between STAT3 and G9a proteins in vitro (Figure 2B). To understand whether and
how interaction of STAT3 and G9a impacts global gene expression, we performed
genome-wide chromatin immunoprecipitation sequencing (ChIP-seq) analysis
targeting STAT3 and G9a bound chromatin regions. We found that leptin most
significantly enhanced STAT3-G9a co-occupancy on promoters of a cohort of genes
involved in cell differentiation (Figure S1A and S1B), such as NUMB, GATAT3,
FOXA2, HOXA5, by gene ontology enrichment analysis (FDR<0.5, P<0.01, Table S3).
Furthermore, STAT3-G9a also highly co-occupied promoter regions of several
non-coding RNAs, such as MiR-200c-3p and MiR-34-5p (Figure S1C and S1D
showing a representative MiR-200c ChIP-seq binding plot). Consistently, the
expression levels of STAT3-G9a targeted genes/miRNAs were significantly
down-regulated by leptin treatment, among which miR-200c was the most repressed
(Figure S1E). Furthermore, the gene/miRNA expression levels suppressed by leptin
treatment were able to be restored by knocking-down STAT3 or G9a (Figure S1E),
suggesting both STAT3 and G9a are required for leptin-mediated repression of these
targeted genes/miRNAs.
Leptin-activated STAT3 recruits G9a to repress miR-200c via H3K9Me2
mediated epigenetic silencing and thereby promotes EMT-stem cell phenotype
on June 24, 2018. © 2015 American Association for Cancer Research. cancerres.aacrjournals.org Downloaded from
Author manuscripts have been peer reviewed and accepted for publication but have not yet been edited. Author Manuscript Published OnlineFirst on April 3, 2015; DOI: 10.1158/0008-5472.CAN-14-3076
12
Notably, studies have shown that miR-200c is the most downregulated miRNA in the
normal stem cell and neoplastic stem cell population (13, 21), where lost miR-200c
expression de-repressed miR-200c targets, including ZEB1 and BMI1, to promote
EMT and stem cell properties (13). Consistent with the ChIP-seq data, by analyzing
the changes in the global miRNA expression profile in response to the leptin
treatment using a genome-wide miRNA-PCR array consisting of 1,066 annotated
miRNAs, we found that leptin significantly downregulated a subset of microRNAs
(>2-fold change, P<0.05) in MCF12A cells, among which microRNA-200c-3p
(miR-200c) was the most significantly downregulated (a 6.2-fold decrease
compared to the mock treatment, P<0.01, Figure S2A). Despite the previous
findings that link miR-200c to regulation of EMT/stem cell phenotype, the epigenetic
mechanism which regulates miR-200c expression in response to the
microenvironmental stimuli, such as leptin, is largely unknown, and the functional role
of miR-200c in leptin-induced tumorigenesis remains unexplored.
Therefore, to investigate whether leptin indeed downregulates miR-200c
through STAT3-G9a mediated epigenetic silencing, we first analyzed, using promoter
analysis, the transcription factor response elements located within the 2kb region
upstream of the transcription starting site of miR-200c (Genomatix MetInspector). We
found a putative STAT3 response element located within the miR-200c promoter that
on June 24, 2018. © 2015 American Association for Cancer Research. cancerres.aacrjournals.org Downloaded from
Author manuscripts have been peer reviewed and accepted for publication but have not yet been edited. Author Manuscript Published OnlineFirst on April 3, 2015; DOI: 10.1158/0008-5472.CAN-14-3076
13
had a high consensus score (Figure 2C, the matrix similarity score>0.95 as cutoff,
score=1 as perfect match). To validate the direct association of STAT3 with miR-200c
in breast cancer cells, we performed ChIP analysis in MCF7 cells targeting the STAT3
consensus binding element using an antibody specifically against STAT3. Leptin
treatment resulted in transcription repression of the luciferase driven by miR-200c,
which was rescued by mutations of the STAT3 response element (Figure 2D). The
sequential-ChIP results further revealed that STAT3 along with G9a were indeed
bound to the STAT3 response element on miR-200c promoter (Figure 2E). Leptin
treatment significantly increased the association of both STAT3 and G9a with the
miR-200c promoter where H3K9Me2 level was highly enhanced (Figure 2F and 2G),
whereas another major histone modification involved in gene silencing, H3K27Me3,
remained unchanged (Figure 2G). Interestingly, the association between G9a and
miR-200c promoter as well as leptin-induced H3K9Me2 level were abolished upon
knocking-down of STAT3 (Figure 2F and 2G), suggesting that STAT3 is required for
recruitment of G9a to miR-200c promoter where it mediates silencing of MiR-200c via
activation of H3K9Me2. Consistently, leptin treatment significantly down-regulated
miR-200c expression, which can be rescued by treatment of S3I-201 and also by a
selective G9a inhibitor, BIX01294 (Figure 2H). Together, these data suggest that
nuclear STAT3 can recruit G9a in a MiR-200c bound complex to cooperatively
on June 24, 2018. © 2015 American Association for Cancer Research. cancerres.aacrjournals.org Downloaded from
Author manuscripts have been peer reviewed and accepted for publication but have not yet been edited. Author Manuscript Published OnlineFirst on April 3, 2015; DOI: 10.1158/0008-5472.CAN-14-3076
14
regulate miR-200c expression.
Functionally, to understand whether downregulation of miR-200c is required
for leptin-mediated modulation of EMT and stem cell phenotypes, we stably
expressed miR-200c in MCF7 and MCF12A cells. We found that re-expression of
miR-200c was able to reverse the mesenchymal phenotype that was previously
induced by leptin to the epithelial phenotype (MET, Figure S2B and S2C). Restoration
of miR-200c also significantly repressed the CD24-CD44+ population as well as the
sphere formation that were promoted by the leptin treatment in both the MCF12A
and MCF7 cells (Figure S2D and S2F). Together, these data suggest that
down-regulation of miR-200c is required for leptin-promoted EMT and stem cell
phenotypes in both normal and neoplastic mammary epithelial cells.
miR-200c reciprocally regulates leptin signaling by targeting OBR
Next, we attempted to identify new miR-200c targets that may be involved in the
regulation of leptin-promoted stemness. Using global gene expression profiling
analysis of MCF7 cells that were under leptin treatment for 12 hours compared to that
of the mock-treated cells, combined with the analysis result of miR-200c seed
sequence matching targets from three miRNA-target prediction databases (DIANSmT,
miRand, TargetScan), 26 putative miR-200c targets were identified with expression
levels significantly up-regulated by leptin treatment (>2 fold change, n=3, P<0.05) and
on June 24, 2018. © 2015 American Association for Cancer Research. cancerres.aacrjournals.org Downloaded from
Author manuscripts have been peer reviewed and accepted for publication but have not yet been edited. Author Manuscript Published OnlineFirst on April 3, 2015; DOI: 10.1158/0008-5472.CAN-14-3076
15
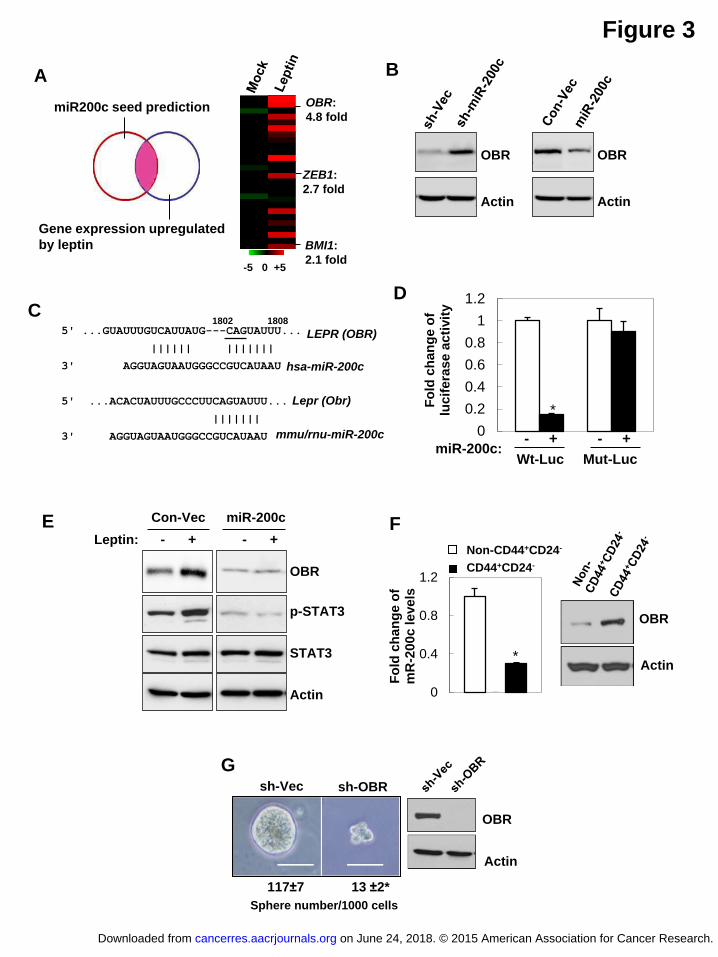
also with high context and conservation scores of miR-200c interaction (Figure 3A,
TargetScan 6.0). Interestingly, among these targets, leptin receptor (OBR/LEPR)
showed a significant upregulation (4.8-fold) by knock-down of miR-200c, while two
previously known miR-200c targets BMI1 and ZEB1 had only 2.1- and 3.7-fold of
change, respectively (Figure 3A). Immunoblot analysis further validated that OBR
protein expression was markedly upregulated by knock-down of miR-200c while it
was downregulated by ectopic expression of miR-200c in MCF7 cells (Figure 3B). To
determine whether OBR is directly regulated by miR-200c through interaction of the
complementary 3’UTR region (conserved between human, mouse and rat, Figure 3C),
a luciferase reporter linked with 3’UTR of OBR was used. Indeed, expression of
miR-200c significantly decreased OBR luciferase activity, whereas a reporter mutated
in OBR-3’UTR failed to respond to miR-200c expression (Figure 3D). Furthermore,
OBR along with p-STAT3 levels were elevated by the leptin, and leptin-induced OBR
and p-STAT3 expression was abolished by re-expression of miR-200c, suggesting
leptin enhances OBR expression through downregulation of miR-200c (Figure 3E).
Consistently, knocking-down either STAT3 or G9a, which restored miR-200c levels as
shown in Supplementary Figure S1E, effectively abolished the induced OBR
expression by leptin (Supplementary Figure S3A-S3B). Together, these data
corroborate that OBR is a bona fide miR-200c target and may be involved in the
on June 24, 2018. © 2015 American Association for Cancer Research. cancerres.aacrjournals.org Downloaded from
Author manuscripts have been peer reviewed and accepted for publication but have not yet been edited. Author Manuscript Published OnlineFirst on April 3, 2015; DOI: 10.1158/0008-5472.CAN-14-3076
16
self-reinforcing leptin-miR200c signaling in regulation of stem cell properties,
especially in the CSC population.
Thus, to determine whether OBR expression is functionally linked to the CSC
traits, we first examined OBR expression in the CSC-enriched CD24-CD44+ cell
population compared to the non-CD24-CD44+ cell population isolated from primary
human breast tumor cells. Compared to the non-CD24-CD44+ cell population, OBR
protein was found to be highly expressed in the CD24-CD44+ cell population, where
miR-200c expression was reduced (Figure 3F). Next, we stably knocked-down OBR
using lentiviral delivered short hairpin RNA (sh-OBR) in primary human breast tumor
cells. Suppression of OBR led to a significant decrease in tumor sphere formation
(Figure 3G), suggesting that OBR may play a role in maintenance of the CSC traits
(no significant cell death or cell cycle alteration was observed; data not shown).
OBRhi cell population is induced by leptin and enriched in CSC traits
It is recognized that conventional CSC markers which lack a functional link and
specificity create challenges for accurate characterization and treatment of CSCs.
Previous studies using CD24-CD44+, the most widely-used breast cancer stem cell
marker, identified a population that may not only consist of CSCs but also other
heterogeneous cells (22, 23). Since OBR is a cell surface protein whose expression is
potentially associated with the CSC traits, we attempted to determine whether OBR
on June 24, 2018. © 2015 American Association for Cancer Research. cancerres.aacrjournals.org Downloaded from
Author manuscripts have been peer reviewed and accepted for publication but have not yet been edited. Author Manuscript Published OnlineFirst on April 3, 2015; DOI: 10.1158/0008-5472.CAN-14-3076
17
could serve as an effective cell surface marker enriching the breast CSC population
induced by leptin, based on the functional link (leptin-miR200c-OBR) identified in
Figure 3. Using a fluorescence-conjugated antibody targeting OBR, primary human
breast tumor cells were sorted for two populations with high (hi) or negative/low (-/low)
endogenous OBR expression (fluorescence intensity OBR-:<101, OBRlow:101-102,
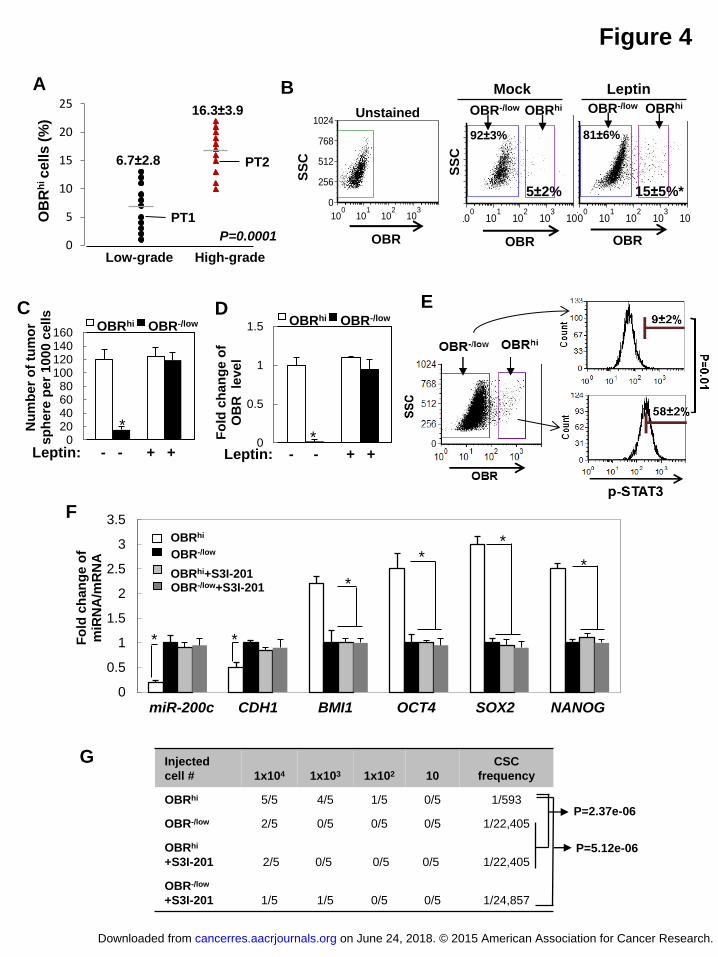
OBRhi>102). We found that the majority of the tumor cells are OBR-/low, and the
abundance of OBRhi population is correlated with high tumor grade (low grade I-II,
OBRhi 6.7±2.8%; high grade III, OBRhi 16.3±3.9%, n=12 patient samples/each group,
P=0.0001). Furthermore, leptin treatment to the primary tumor cells (PT1) for 3 days
led to a significant increase of the OBRhi population (5% to 15%, P<0.05, Figure 4B).
To understand how leptin influences OBRhi and OBR-/low populations in relation to the
CSC traits, we FACS-sorted OBRhi and OBR-/low populations from the primary tumor
cells, which were then maintained in sphere cultures individually under leptin or
vehicle treatment for 10 days. We found that OBRhi cells showed superior sphere
forming capacity compared with OBR-/low cells in the absence of leptin. Interestingly,
OBR-/low cells treated with leptin for 10 days started to exhibit sphere forming capacity
similar to OBRhi cells, accompanied by markedly elevated OBR expression,
comparable to the OBR level in OBRhi cells (Figure 4C and 4D).
We then investigated stemness-associated molecular signatures compared
on June 24, 2018. © 2015 American Association for Cancer Research. cancerres.aacrjournals.org Downloaded from
Author manuscripts have been peer reviewed and accepted for publication but have not yet been edited. Author Manuscript Published OnlineFirst on April 3, 2015; DOI: 10.1158/0008-5472.CAN-14-3076
18
between the FACS-sorted OBRhi cells and OBR-/low cells. We found that, compared to
OBR-/low cells, OBRhi cells exhibited substantially increased phospho-STAT3 (Y705),
decreased expression of miR-200c and CDH1 (E-cadherin), and elevated levels of
stemness-related genes, including NANOG, OCT4, SOX2, and BMI1 (known as a
miR-200c target, 13) (Figure 4E and 4F). In addition, OBRhi cells showed promoted
mammary xenograft tumor formation with a highly enhanced CSC frequency (Figure
4G). Blocking of STAT3 activation in OBRhi cells by S3I-201 treatment restored
miR-200c and CDH1, repressed the levels of stemness-related genes, and
significantly diminished the formation of mammary xenograft tumors (Figure 4F and
4G). Together, these data suggest that a subset of breast tumor cells (OBR-/low) may
acquire high OBR expression under leptin stimulation, through leptin-mediated
silencing of miR-200c to de-repress OBR, and generate a CSC-like population (OBRhi)
with substantially enhanced self-renewing and tumorigenic capacity.
Increased adiposity and tumor aggressiveness in diet-induced obesity and
breast cancer rats
To study the complex interaction between the mammary epithelia and the
microenvironment, with a focus on the mechanisms of leptin during the development
of mammary cancer in vivo, we have established a diet-induced obesity (DIO) rat
model of breast cancer (Figure S4A)(24). Briefly, outbred female Sprague-Dawley
on June 24, 2018. © 2015 American Association for Cancer Research. cancerres.aacrjournals.org Downloaded from
Author manuscripts have been peer reviewed and accepted for publication but have not yet been edited. Author Manuscript Published OnlineFirst on April 3, 2015; DOI: 10.1158/0008-5472.CAN-14-3076
19
(SD) rats were fed a “Western Diet” high in fat and simple sugars. Reflective of
human obesity trends, approximately 30% of the rats on the Western Diet became
obese, while 30% were diet resistant and remained lean. To study tumorigenesis,
both obese and lean rats were injected with N-methylnitrosourea (MNU) carcinogen.
Previous studies demonstrated that MNU-induced rat tumors had histological and
molecular features mimicking human breast cancer progression (25). As is
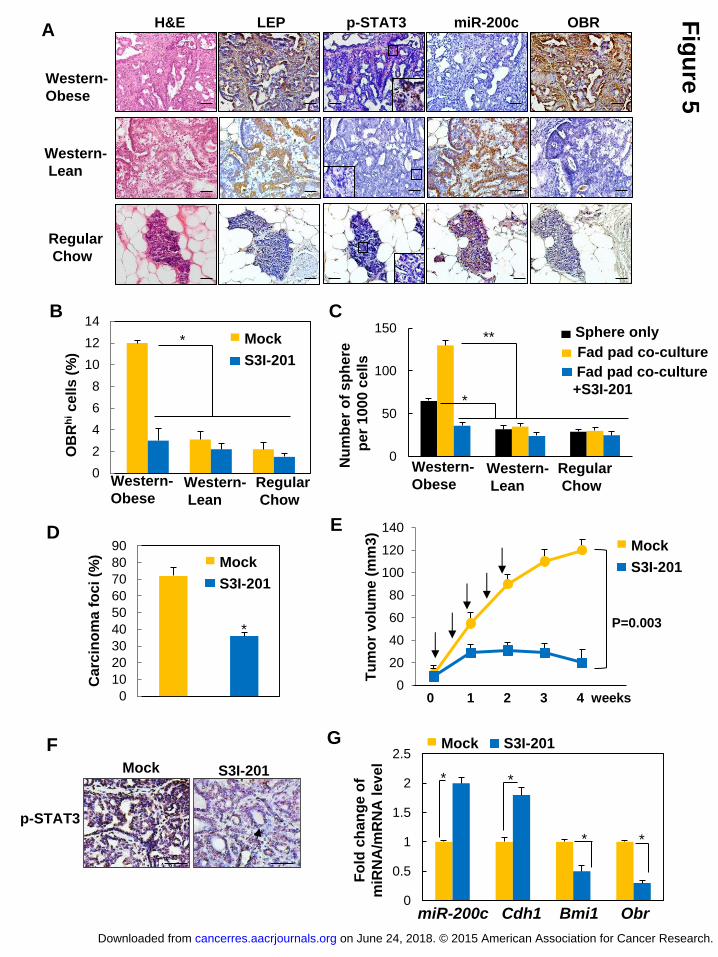
characteristic in humans, we found that the Western-obese rats had substantially
increased adiposity (a 2-fold increase of fat mass) and highly elevated leptin levels in
their mammary tissues compared to lean rats (Table S4, Figure 5A). Compared to
MNU-treated Western-lean rats and regular diet-fed rats, which predominantly
generated estrogen receptor-positive (ER+) benign adenomas and pre-neoplastic
lesions, respectively, MNU-treated Western-obese rats developed ER-deficient
adenocarcinomas along with significantly increased tumor incidences and
aggressiveness (Figure S4B and S4C, Table S5). The tumor sections from the
Western-obese rats exhibited elevated expression of leptin (LEP), phospho-STAT3
Y705 (p-STAT3), and OBR, along with showing a significant reduction in miR-200c
level compared to the Western-lean and regular diet-fed rats (Figure 5A, Table S6).
Interestingly, we observed that even in the absence of the carcinogen MNU, the
histologically normal mammary tissues of the Western-obese rats exhibited elevated
on June 24, 2018. © 2015 American Association for Cancer Research. cancerres.aacrjournals.org Downloaded from
Author manuscripts have been peer reviewed and accepted for publication but have not yet been edited. Author Manuscript Published OnlineFirst on April 3, 2015; DOI: 10.1158/0008-5472.CAN-14-3076
20
leptin (LEP) and p-STAT3 levels, along with decreased miR-200c and enhanced OBR
expression, compared with the Western-lean rats and the regular diet-fed rats
(Supplementary Figure S5A-S5B), similar to the data shown in Figure 5. Together,
these data suggest that adiposity induced-leptin receptor overexpression and
signaling dysregulation may serve as a cancer-predisposing condition, which likely
further contributes to promoting tumor progression in the presence of a carcinogen.
Pharmacological inhibition of STAT3 suppresses leptin-induced CSCs and
cancer progression in diet-induced obesity and breast cancer rats
To further understand whether S3I-201 treatment could be therapeutically effective for
obesity-promoted mammary tumorigenesis, we treated the Western-obese rats with
S3I-201 twice per week for 2 weeks (i.v. 5mg/kg, n=5/group, Supplementary Figure
S5C-S5E) at two months after MNU injection, when the obese rats started to display
mammary tumors. Compared to the Western-lean and regular diet-fed rats, the
percentage of OBRhi cells isolated from the primary tumors of the Western-obese rats
was significantly elevated, which can be suppressed by the treatment of S3I-201 in
vivo (Figure 5B). To further understand the influence of leptin (secreted from the
mammary adipose tissue) on formation of the tumor spheres (isolated from the
mammary tumor), we utilized a co-culture system that was physiologically parallel to
the coexisting compartments of the mammary fat pad and the epithelial/tumor cells,
on June 24, 2018. © 2015 American Association for Cancer Research. cancerres.aacrjournals.org Downloaded from
Author manuscripts have been peer reviewed and accepted for publication but have not yet been edited. Author Manuscript Published OnlineFirst on April 3, 2015; DOI: 10.1158/0008-5472.CAN-14-3076
21
which were separated by a basement membrane that allowed the passage of
secreted molecules, such as leptin (16). Compared to the Western-lean and regular
diet-fed rats, the tumor sphere forming capacity was markedly increased in the
primary mammary tumor cells isolated from the Western-obese rats and was further
enhanced by co-culturing the spheres with the associated obese fat pads; the
enhancement was completely abolished upon treatment of S3I-201 in the cultures
(Figure 5C).
Notably, S3I-201 treatment in the Western-obese rats significantly diminished
the incidence of mammary carcinomas (Figure 5D), decreased tumor growth (Figure
5E), and reverted the aggressive adenocarcinoma phenotype to a phenotype similar
to the benign adenoma observed in the lean rats (with low cuboidal epithelial cells
forming duct-like structures, Figure 5F and S4B), accompanied by significantly
suppressed p-STAT3 (Figure S5D-S5E and 5F), decreased Obr and Bmi1 expression,
and increased levels of miR-200c and Cdh1 (E-cadherin) (Figure 5G). Together,
these data suggest that diet-induced obesity, taking on a leptin-STAT3-miR200c
regulatory mechanism, promotes breast CSCs and the development of aggressive
mammary carcinoma.
Overexpression of LEP, p-STAT3, and OBR is correlated with
H3K9Me2-mediated silencing of miR-200c in poorly-differentiated aggressive
on June 24, 2018. © 2015 American Association for Cancer Research. cancerres.aacrjournals.org Downloaded from
Author manuscripts have been peer reviewed and accepted for publication but have not yet been edited. Author Manuscript Published OnlineFirst on April 3, 2015; DOI: 10.1158/0008-5472.CAN-14-3076
22
breast cancer
To further strengthen the pathological correlation of leptin regulated signaling
cascade in human breast cancer, we performed a correlation analysis of LEP,
p-STAT3, miR-200c, and OBR expression levels in human breast tissue microarrays
consisting of a cohort of normal and malignant breast tissue samples. We found that
miR-200c expression level was most abundantly expressed in benign lesions and
well-differentiated low-grade breast tumors (grade I) and was negatively correlated
with levels of LEP, p-STAT3, and OBR (Figure 6A and 6B). In contrast, miR-200c
expression level was significantly reduced in the poorly-differentiated high grade
tumors (grade II-III), where LEP, p-STAT3, and OBR were most highly expressed
(Figure 6B, n=98, P<0.001).To further determine the correlation of leptin regulated
signaling cascade with the breast cancer subtypes, we performed sequential-ChIP in
primary human breast tumor samples (11 luminal breast cancer samples and 11
triple-negative breast cancer TNBC samples). Notably, TNBC, a breast cancer
subtype deficient in expression of ER, PR, and HER2, tends to be more aggressive
than the other subtypes and manifests high recurrence and poor survival (10). We
found that, compared with luminal breast cancer, the association of STAT3-G9a to
miR-200c promoter was markedly elevated in TNBC, where the level of H3K9Me2 on
miR-200c promoter was also enhanced (Figure 6C and 6D). Consistently, miR-200c
on June 24, 2018. © 2015 American Association for Cancer Research. cancerres.aacrjournals.org Downloaded from
Author manuscripts have been peer reviewed and accepted for publication but have not yet been edited. Author Manuscript Published OnlineFirst on April 3, 2015; DOI: 10.1158/0008-5472.CAN-14-3076
23
expression was significantly reduced in TNBC, where the CD24-CD44+ population
was highly enriched (Figure 6E and 6F). Together, these data indicate that
leptin-STAT3/G9a-miR200c signaling is functionally linked to CSC traits and is
correlated with aggressiveness and poorly-differentiation in human breast cancer.
Together, our results reveal that leptin-STAT3-G9a-miR200c regulatory axis
plays a critical role in governing the stemness-differentiation plasticity in breast
cancer. During mammary cancer development, increased adiposity elevates leptin in
the surrounding environment of the mammary epithelia to downregulate miR-200c via
STAT3-G9a mediated epigenetic silencing, which in turn allows a subset of OBR-/low
cancer cell population to gain the EMT-CSC traits and high OBR expression, thereby
inducing a highly self-renewing and tumorigenic OBRhi-CSC pool, contributing to
mammary tumor progression. In contrast, blocking of STAT3 activation restores the
expression of miR-200c, which can program OBRhi cells from the CSC phenotype to
a differentiated epithelial phenotype, and thereby suppresses cancer progression
(Figure 7).
Discussion
In response to various microenvironmental cues, STATs have been known as major
transcription activators in regulation of genes and miRNAs involved in a myriad of
on June 24, 2018. © 2015 American Association for Cancer Research. cancerres.aacrjournals.org Downloaded from
Author manuscripts have been peer reviewed and accepted for publication but have not yet been edited. Author Manuscript Published OnlineFirst on April 3, 2015; DOI: 10.1158/0008-5472.CAN-14-3076
24
cellular processes (26), and an integrated regulatory circuit of miRNAs, transcription
factors, and chromatin-modifying activities is exploited to reinforce the breast cancer
stem cell state (27). Echoing that work, our study provides the first evidence showing
that STAT3 can recruit G9a to coordinately mediate epigenetic silencing of a specific
cohort of gene targets involved in stemness-differentiation plasticity. Interestingly,
previous study suggests that a STAT family member, STAT5, represses Igk through a
tetrameric binding pattern that involves a high-affinity STAT5 binding site adjacent to
a low-affinity biding site on Igk promoter where tetrameric STAT5 likely recruits the
corepressor complex instead of the coactivator complex (17). Further comprehensive
analysis of the promoter sequences co-occupied by STAT3-G9a from our ChIP study
will provide better understanding of how sequence features and chromatin contexts
coordinately regulates STAT3’s function (e.g. target selection for transcriptional
activation versus repression).
Furthermore, OBR has been shown to be overexpressed in aggressive
epithelial cancers including breast, colon, and ovarian cancers (6). In this study, we
found that breast tumor cells can acquire high OBR expression (OBRhi) under the
adiposity-leptin enriched environment to generate a population with enhanced CSC
properties and tumorigenic capacity. Based on the antagonistic regulation between
OBR and miR-200c revealed by our data and the established role of lost miR-200c in
on June 24, 2018. © 2015 American Association for Cancer Research. cancerres.aacrjournals.org Downloaded from
Author manuscripts have been peer reviewed and accepted for publication but have not yet been edited. Author Manuscript Published OnlineFirst on April 3, 2015; DOI: 10.1158/0008-5472.CAN-14-3076
25
CSCs from a broad spectrum of poorly-differentiated epithelial cancers (21), OBR and
may serve as an effective cell surface marker for identification of CSC populations in
multiple epithelial cancers. Furthermore, with the newly-identified
leptin-STAT3-miR200c regulatory axis in this study, restoration of miR-200c is
expected to be a therapeutic marker for determining the efficacy of STAT3 inhibitor for
targeting the cancer stemness. This will be of great interest and importance to explore
in future studies, given that several STAT3 inhibitors are currently tested under clinical
trials for various cancer types (clinicaltrial.gov), and an effective therapeutic
biomarker will not only guide the decision for personalized treatment but also prevent
the adverse reactions from overtreatment.
It is also worth noting that existing obesity models do have limitations in
applicability to both human obesity and breast cancer. Standard genetic models of
obesity are the ob/ob and db/db mouse and the Zucker fa/fa rat, each of which
contain a single mutation in the gene for leptin or its receptor (28). A drawback of
these systems is that mutations in leptin signaling are very rare in humans and
therefore do not represent the general cause, the complex polygenic human condition
of obesity, or parallel the normal progression of human obesity (29, 30). It has been
shown that diet-induced-obesity (DIO) out-bred Sprague-Dawley (SD) rats are an
excellent model system given their mammary development, mammary tumorigenesis,
on June 24, 2018. © 2015 American Association for Cancer Research. cancerres.aacrjournals.org Downloaded from
Author manuscripts have been peer reviewed and accepted for publication but have not yet been edited. Author Manuscript Published OnlineFirst on April 3, 2015; DOI: 10.1158/0008-5472.CAN-14-3076
26
and development of obesity are physiologically parallel to that of humans (31-33).
Furthermore, MNU-induced mammary tumorigenesis in SD rats is a well-recognized
model to study carcinogenesis as it mimics the morphology and the global molecular
phenotypes of human breast tumors (33). Indeed, Western-obese rats in our study
manifested the development of aggressive, ER-negative mammary tumors with
enhanced CSC-associated molecular phenotypes (Figure 5 and Figure S4), which
are accordingly enriched in the high-grade breast tumors and TNBC in breast cancer
patients (Figure 5 and 6). This parallelism demonstrates that our DIO-breast cancer
rat model represents a valuable tool to better understand the association of obesity
with breast cancer phenotypes and to be used for evaluation of therapeutics for
treatment of obesity-related breast cancer.
Acknowledgements
We thank the assistance of Purdue Veterinary Medicine Histopathology Service
Laboratory on histological sectioning and examination of the rat mammary tissue
samples. We thank National Taiwan University for technical assistance in animal
experiments. This study was supported by American Cancer Society IRG Junior
Investigator Award (IRG #58-006-53 to C-J. Chang), and Showalter Research
Scholar Grant (#206793 to C-J. Chang)
on June 24, 2018. © 2015 American Association for Cancer Research. cancerres.aacrjournals.org Downloaded from
Author manuscripts have been peer reviewed and accepted for publication but have not yet been edited. Author Manuscript Published OnlineFirst on April 3, 2015; DOI: 10.1158/0008-5472.CAN-14-3076
27
Author Contributions
C.-C.C. and C.-J.C. designed and conceived the study. C.-C.C. and C.-J.C.
performed the experiments and wrote the manuscript. M.-J.W performed the major
biochemical experiments. I.G.C. set up the obese and breast cancer animal model
and provided the animal samples.
References
1. Calle EE, Rodriguez C, Walker-Thurmond K, Thun MJ. Overweight, obesity, and mortality from cancer in a prospectively studied cohort of U.S. adults. N Engl J Med. 2003;348: 1625-1638. 2. Cleary MP, Grossmann ME. Minireview: Obesity and breast cancer: the estrogen connection. Endocrinology. 2009;150: 2537-2542. 3. Demark-Wahnefried W, Platz EA, Ligibel JA, et al. The role of obesity in cancer survival and recurrence. Cancer Epidemiol Biomarkers Prev. 2012;21: 1244-1259. 4. Ligibel J. Obesity and breast cancer. Oncology (Williston Park). 2011;25: 994-1000. 5. Grossmann ME, Cleary MP. The balance between leptin and adiponectin in the control of carcinogenesis - focus on mammary tumorigenesis. Biochimie. 2012;94: 2164-2171. 6. Hu X, Juneja SC, Maihle NJ, Cleary MP. Leptin--a growth factor in normal and malignant breast cells and for normal mammary gland development. J Natl Cancer Inst. 2002;94: 1704-1711. 7. Zheng Q, Dunlap SM, Zhu J, et al. Leptin deficiency suppresses MMTV-Wnt-1 mammary tumor growth in obese mice and abrogates tumor initiating cell survival. Endocr Relat Cancer. 2011;18: 491-503. 8. Park J, Scherer PE. Leptin and cancer: from cancer stem cells to metastasis. Endocr Relat Cancer. 2011;18: C25-29. 9. Yan D, Avtanski D, Saxena NK, Sharma D. Leptin-induced epithelial-mesenchymal transition in breast cancer cells requires beta-catenin activation via Akt/GSK3- and MTA1/Wnt1 protein-dependent pathways. J Biol Chem. 2012;287: 8598-8612. 10. Polyak K, Weinberg RA. Transitions between epithelial and mesenchymal states: acquisition of malignant and stem cell traits. Nat Rev Cancer. 2009;9: 265-273. 11. Reya T, Morrison SJ, Clarke MF, Weissman IL. Stem cells, cancer, and cancer stem cells.
on June 24, 2018. © 2015 American Association for Cancer Research. cancerres.aacrjournals.org Downloaded from
Author manuscripts have been peer reviewed and accepted for publication but have not yet been edited. Author Manuscript Published OnlineFirst on April 3, 2015; DOI: 10.1158/0008-5472.CAN-14-3076
28
Nature. 2001;414: 105-111. 12. Visvader JE, Lindeman GJ. Cancer stem cells in solid tumours: accumulating evidence and unresolved questions. Nat Rev Cancer. 2008;8: 755-768. 13. Chang CJ, Chao CH, Xia W, et al. p53 regulates epithelial-mesenchymal transition and stem cell properties through modulating miRNAs. Nat Cell Biol. 2011;13: 317-323. 14. Siddiquee K, Zhang S, Guida WC, et al. Selective chemical probe inhibitor of Stat3, identified through structure-based virtual screening, induces antitumor activity. Proc Natl Acad Sci U S A. 2007;104: 7391-7396. 15. Wallace J. Humane endpoints and cancer research. Ilar J. 2000;41: 87-93. 16. Salameh TS, Le TT, Nichols MB, Bauer E, Cheng J, Camarillo IG. An ex vivo co-culture model system to evaluate stromal-epithelial interactions in breast cancer. Int J Cancer. 2013;132: 288-296. 17. Mandal M, Powers SE, Maienschein-Cline M, et al. Epigenetic repression of the Igk locus by STAT5-mediated recruitment of the histone methyltransferase Ezh2. Nat Immunol. 2011;12: 1212-1220. 18. Ivanov VN, Bhoumik A, Krasilnikov M, et al. Cooperation between STAT3 and c-jun suppresses Fas transcription. Mol Cell. 2001;7: 517-528. 19. Shinkai Y, Tachibana M. H3K9 methyltransferase G9a and the related molecule GLP. Genes Dev. 2011;25: 781-788. 20. Dong C, Wu Y, Yao J, et al. G9a interacts with Snail and is critical for Snail-mediated E-cadherin repression in human breast cancer. J Clin Invest. 2012;122: 1469-1486. 21. Shimono Y, Zabala M, Cho RW, et al. Downregulation of miRNA-200c links breast cancer stem cells with normal stem cells. Cell. 2009;138: 592-603. 22. Al-Hajj M, Wicha MS, Benito-Hernandez A, Morrison SJ, Clarke MF. Prospective identification of tumorigenic breast cancer cells. Proc Natl Acad Sci U S A. 2003;100: 3983-3988. 23. Fillmore C, Kuperwasser C. Human breast cancer stem cell markers CD44 and CD24: enriching for cells with functional properties in mice or in man? Breast Cancer Res. 2007;9: 303. 24. Le TT, Rehrer CW, Huff TB, Nichols MB, Camarillo IG, Cheng JX. Nonlinear optical imaging to evaluate the impact of obesity on mammary gland and tumor stroma. Mol Imaging. 2007;6: 205-211. 25. Camarillo IG, Thordarson G, Moffat JG, et al. Prolactin receptor expression in the epithelia and stroma of the rat mammary gland. J Endocrinol. 2001;171: 85-95. 26. Iliopoulos D, Jaeger SA, Hirsch HA, Bulyk ML, Struhl K. STAT3 activation of miR-21 and miR-181b-1 via PTEN and CYLD are part of the epigenetic switch linking inflammation to cancer. Mol Cell. 2010;39: 493-506. 27. Polytarchou C, Iliopoulos D, Struhl K. An integrated transcriptional regulatory circuit that
on June 24, 2018. © 2015 American Association for Cancer Research. cancerres.aacrjournals.org Downloaded from
Author manuscripts have been peer reviewed and accepted for publication but have not yet been edited. Author Manuscript Published OnlineFirst on April 3, 2015; DOI: 10.1158/0008-5472.CAN-14-3076
29
reinforces the breast cancer stem cell state. Proc Natl Acad Sci U S A. 2012;109: 14470-14475. 28. Speakman J, Hambly C, Mitchell S, Krol E. Animal models of obesity. Obes Rev. 2007;8 Suppl 1: 55-61. 29. Farooqi IS, O'Rahilly S. Monogenic obesity in humans. Annu Rev Med. 2005;56: 443-458. 30. Rankinen T, Zuberi A, Chagnon YC, et al. The human obesity gene map: the 2005 update. Obesity (Silver Spring). 2006;14: 529-644. 31. Chan MM, Lu X, Merchant FM, Iglehart JD, Miron PL. Gene expression profiling of NMU-induced rat mammary tumors: cross species comparison with human breast cancer. Carcinogenesis. 2005;26: 1343-1353. 32. Ghibaudi L, Cook J, Farley C, van Heek M, Hwa JJ. Fat Intake Affects Adiposity, Comorbidity Factors, and Energy Metabolism of Sprague-Dawley Rats. Obes Res. 2002;10: 956-963. 33. Russo J, Gusterson BA, Rogers AE, Russo IH, Wellings SR, van Zwieten MJ. Comparative study of human and rat mammary tumorigenesis. Lab Invest. 1990;62: 244-278.
Figure Legends
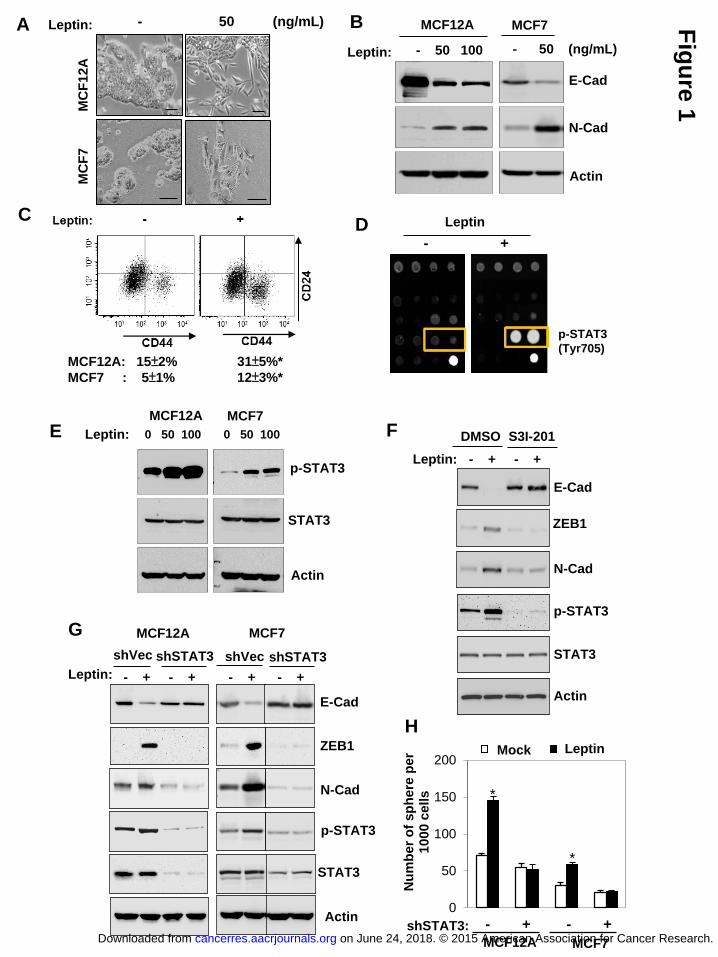
Figure 1 Leptin induces EMT and stem cell properties via activation of STAT3.
(A) Cell morphological change, (B) protein expression of E-cadherin (epithelial
marker) and N-cadherin (mesenchymal marker), and (C) representative double
staining-CD24/CD44-FACS plots of MCF12A (upper) and the percentages of
CD24-CD44+ populations (lower) in MCF12A and MCF7 cells treated with the
indicated concentration of leptin for 3 days (scale bar: 50 μm, n=3, asterisk indicates
P<0.05). (D) Representative antibody array image (lower right: positive control) of
MCF7 cells and (E) immunoblot showing significant STAT3 phosphorylation (Y705) in
MCF12A and MCF7 cells that were treated with leptin for 6 hours. (F) EMT protein
expression levels in MCF7 cells that were treated with leptin and S3I-201. (G) EMT
on June 24, 2018. © 2015 American Association for Cancer Research. cancerres.aacrjournals.org Downloaded from
Author manuscripts have been peer reviewed and accepted for publication but have not yet been edited. Author Manuscript Published OnlineFirst on April 3, 2015; DOI: 10.1158/0008-5472.CAN-14-3076
30
protein expression levels, and (H) the number of spheres generated from MCF12A
and MCF7 cells that stably expressed sh-STAT3 and treated with leptin for 7 days
(n=3, asterisk indicates P<0.05). Leptin concentration: 50 ng/mL. Error bars denote
±SD.
Figure 2 Leptin-activated STAT3 recruits G9a to repress miR-200c via H3K9Me2
mediated gene silencing. (A) Reciprocal co-immunoprecipitation assay showing
interaction between endogenous nuclear STAT3 and G9a in leptin-treated MCF7
cells (Input: 10% nuclear extract). (B) GST pull down assay showing direct
association of GST-STAT3 and His-G9a in vitro. (C) Diagram showing MiR-200c
promoter with the putative STAT3 response element (STAT3-RE, underline), and the
structure of luciferase reporters driven by MiR-200c promoter with the wild-type (Wt)
and mutated STAT3-RE (Mut, mutations are in gray). (D) Fold change of luciferase
activity driven by MiR-200c promoter with the wild-type or mutated STAT3-RE under
leptin treatment in MCF7 cells (n=3, asterisk indicates P<0.05). (E) Sequential
ChIP-PCR analysis showing the percentage of STAT3-G9a complex bound MiR200c
promoter chromatin/input chromatin in leptin-treated MCF7 cells (n=3, asterisk
indicates P<0.05). IgG was used as a negative control. ChIP-PCR analysis showing
the percentage of (F) STAT3/G9a and (G) H3K9Me2/H3K27Me3 bound MiR-200c
promoter chromatin/input chromatin in MCF7 cells that expressed shSTAT3 along
on June 24, 2018. © 2015 American Association for Cancer Research. cancerres.aacrjournals.org Downloaded from
Author manuscripts have been peer reviewed and accepted for publication but have not yet been edited. Author Manuscript Published OnlineFirst on April 3, 2015; DOI: 10.1158/0008-5472.CAN-14-3076
31
with leptin treatment. (n=3, asterisk indicates P<0.05). (H) Fold change of miR-200c
expression in MCF7 cells under leptin and S3I-201/BIX01294 treatment (n=3, asterisk
indicates P<0.05). Error bars denote ±SD.
Figure 3 miR-200c reciprocally antagonizes leptin signaling by targeting OBR.
(A) The overlapping genes were identified by miRNA seed sequence prediction and
global gene expression profiles compared between vehicle and leptin-treated MCF7
cells (left). Heat map showing mean expression values of these genes that were most
significantly upregulated in leptin-treated MCF7 cells (right, n=3/each group, fold
change>2, P<0.05). (B) OBR expression levels in MCF7 cells that stably expressed
miR-200c, sh-miR200c, and the control vectors. (C) Diagram showing the putative
miR-200c targeting seed sequence on OBR-3’UTR conserved between human,
mouse and rat (underline indicates mutation of CAG to ACC in Mut-Luc). (D) Fold
change of luciferase activity driven by the wild-type or mutant OBR-3’UTR reporter,
and (E) protein expression in MCF7 cells that stably expressed miR-200c under leptin
treatment. (F) miR-200c and OBR expression levels in the CD44+CD24- population
versus the non-CD44+CD24- population isolated from primary human breast tumor
cells (PT2). (G) The number of tumor spheres (per 1000 cells) generated from
primary human breast tumor cells that stably expressed sh-Vector or sh-OBR (PT2,
n=3, scale bar: 100 μm, asterisk indicates P<0.05).
on June 24, 2018. © 2015 American Association for Cancer Research. cancerres.aacrjournals.org Downloaded from
Author manuscripts have been peer reviewed and accepted for publication but have not yet been edited. Author Manuscript Published OnlineFirst on April 3, 2015; DOI: 10.1158/0008-5472.CAN-14-3076
32
Figure 4 Leptin induces OBRhi cells, a population enriched in CSC traits. (A)
The percentage of OBRhi cells in primary human tumor cells from low grade (I) or high
grade breast tumors (II-III) (n=12 in each group). (B) The flow cytometric plots
showing the changes in percentage of OBR-/low or OBRhi of primary human tumor cells
(PT1) under leptin treatment for 3 days. (C) The number of tumor spheres and (D)
OBR expression level from primary human breast tumor cells (PT1) that had been
FACS-sorted for high (hi) or negative/low (-/low) expression of OBR and then treated
with leptin or vehicle for 10 days (sphere>100 μm, n=3, asterisk indicates P<0.05). (E)
Horizontal bars showing the percentages of cells with high p-STAT3 levels in OBRhi
or OBR-/low population that were isolated from primary human breast tumor cells (PT2)
using intracellular flow cytometric staining (n=3, asterisk indicates P<0.05). (F)
miR-200c and mRNA expression levels in OBRhi or OBR-/low cells that were treated
with S3I-201 (n=3, asterisk indicates P<0.05). (G) NOD/SCID mice were inoculated
with OBR-/low or OBRhi cells isolated from primary human breast tumor cells and
treated with S3I-201. The frequency of the tumorigenic cancer stem cell (CSC) was
determined by extreme limiting dilution analysis (n=5/group). Error bars denote ±SD.
Figure 5 STAT3 inhibitor suppresses leptin-induced CSCs and prevents
obesity-related breast cancer progression. (A) Representative images showing
expression levels of leptin (LEP), p-STAT3, miR-200c, and OBR (inset showing
on June 24, 2018. © 2015 American Association for Cancer Research. cancerres.aacrjournals.org Downloaded from
Author manuscripts have been peer reviewed and accepted for publication but have not yet been edited. Author Manuscript Published OnlineFirst on April 3, 2015; DOI: 10.1158/0008-5472.CAN-14-3076
33
positive nuclear p-STAT3 in obsess rats, scale bar: 50 μm), (B) the percentage of
OBRhi cells, and (C) the number of tumor spheres (spheres only or spheres
co-cultured with the tumor-associated epithelia-free fat pads from individual diet
groups) isolated from mammary tumors of the MNU-treated lean and obese rats with
Western diet, and the MNU-treated control rats with regular diet, which were treated
with S3I-201 (n=5/group, asterisk indicates P<0.05, double asterisk indicates
P<0.01 ). (D) The percentage of observed mammary carcinoma, (E) mammary tumor
growth (arrows indicate time points of treatment), (F) representative p-STAT3 staining
with distinct tumor morphologies: aggressive adenocarcinoma (left), benign adenoma
(right, arrow indicates low cuboidal epithelial cells forming duct-like structures, scale
bar: 100 μm), and (G) fold change of miRNA/mRNA expression in tumors isolated
from MNU-treated obese rats with Western diet that had been treated with vehicle or
S3I-201 (n=5/group, asterisk indicates P<0.05). Error bars denote ±SD.
Figure 6 Overexpression of LEP, p-STAT3, and OBR is correlated with
H3k9Me2-mediated silencing of miR-200c in poorly-differentiated and
triple-negative breast cancer. (A) Representative images showing expression
levels of LEP, p-STAT3, miR-200c, and OBR in 98 human breast tissue specimens
(scale bar: 100 μm). (B) Chi-Square analysis of expression levels of LEP, p-STAT3,
miR-200c, and OBR in 98 human breast tissue specimens including benign and
on June 24, 2018. © 2015 American Association for Cancer Research. cancerres.aacrjournals.org Downloaded from
Author manuscripts have been peer reviewed and accepted for publication but have not yet been edited. Author Manuscript Published OnlineFirst on April 3, 2015; DOI: 10.1158/0008-5472.CAN-14-3076
34
low-grade tumors (≤tumor grade I), and high-grade tumors (tumor grade II-III). (-):
negative staining, (+): positive staining. The association of (C) STAT3-G9a and (D)
H3K9Me2 to MiR-200c promoter, and (E) expression level of miR-200c and (F) the
percentage of CD24-CD44+ cells in luminal or triple-negative (TNBC) breast tumors
(n=11 in each group). Error bars denote ±SD.
Figure 7 A proposed model illustrating the leptin-STAT3-G9a-miR200c regulatory
axis plays a critical role in governing the CSC traits in response to
microenvironmental adiposity, contributing to breast tumor progression.
on June 24, 2018. © 2015 American Association for Cancer Research. cancerres.aacrjournals.org Downloaded from
Author manuscripts have been peer reviewed and accepted for publication but have not yet been edited. Author Manuscript Published OnlineFirst on April 3, 2015; DOI: 10.1158/0008-5472.CAN-14-3076
C
- 50 (ng/mL) A B Leptin:
MC
F7
M
CF
12
A
Fig
ure
1
Leptin:
Actin
N-Cad
E-Cad
- 50 100 - 50 (ng/mL)
MCF7 MCF12A
MCF12A MCF7
0 50 100
p-STAT3
STAT3
Actin
0 50 100 Leptin: E
D
p-STAT3
(Tyr705)
- +
Leptin
G
Leptin:
shVec shSTAT3
- + - + - + - +
MCF12A
E-Cad
N-Cad
Actin
p-STAT3
STAT3
shVec shSTAT3
MCF7
ZEB1 Leptin Mock
0
50
100
150
200
Nu
mb
er
of
sp
he
re p
er
10
00
ce
lls
*
*
- + - +
MCF12A MCF7
shSTAT3:
F S3I-201 DMSO
Leptin: - + - +
E-Cad
N-Cad
Actin
p-STAT3
STAT3
ZEB1
H
MCF12A: 15±2%
MCF7 : 5±1%
31±5%*
12±3%*
on June 24, 2018. © 2015 American Association for Cancer Research. cancerres.aacrjournals.org Downloaded from
Author manuscripts have been peer reviewed and accepted for publication but have not yet been edited. Author Manuscript Published OnlineFirst on April 3, 2015; DOI: 10.1158/0008-5472.CAN-14-3076
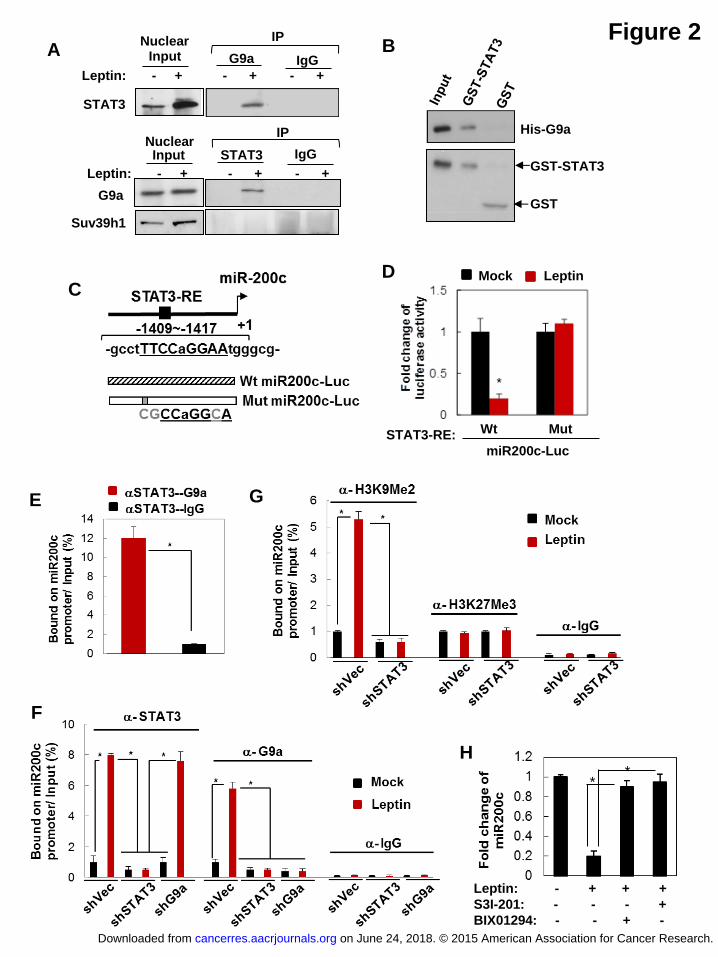
Figure 2
Wt Mut
miR200c-Luc
*
STAT3-RE:
Leptin Mock C
D
E G
F
B
His-G9a
GST
GST-STAT3
Leptin: - + - + - +
Input
STAT3
G9a IgG
STAT3 IgG
Leptin: - + - + - +
G9a
IP
Input
Nuclear
Suv39h1
A
IP Nuclear
H
Leptin: - + + +
S3I-201: - - - +
BIX01294: - - + -
* *
on June 24, 2018. © 2015 American Association for Cancer Research. cancerres.aacrjournals.org Downloaded from
Author manuscripts have been peer reviewed and accepted for publication but have not yet been edited. Author Manuscript Published OnlineFirst on April 3, 2015; DOI: 10.1158/0008-5472.CAN-14-3076
B
D
Figure 3
G sh-Vec sh-OBR
117±7 13 ±2*
Sphere number/1000 cells
OBR
Actin
0
0.2
0.4
0.6
0.8
1
1.2
Fo
ld c
ha
ng
e o
f lu
cif
era
se
ac
tivit
y
miR-200c: Wt-Luc Mut-Luc
*
F
OBR
Actin *
CD44+CD24-
Non-CD44+CD24-
0
0.4
0.8
1.2
Fo
ld c
ha
ng
e o
f
m
R-2
00
c le
ve
ls
- + - +
OBR
Actin
Con-Vec miR-200c
OBR
Leptin: - + - +
Actin
p-STAT3
STAT3
E
OBR
Actin
26 92 387
C 5' ...GUAUUUGUCAUUAUG---CAGUAUUU...
|||||| |||||||
3' AGGUAGUAAUGGGCCGUCAUAAU
5' ...ACACUAUUUGCCCUUCAGUAUUU...
|||||||
3' AGGUAGUAAUGGGCCGUCAUAAU
hsa-miR-200c
mmu/rnu-miR-200c
Lepr (Obr)
LEPR (OBR) 1802 1808
OBR:
4.8 fold
-5 0 +5
Gene expression upregulated
by leptin
miR200c seed prediction
A
ZEB1:
2.7 fold
BMI1:
2.1 fold
on June 24, 2018. © 2015 American Association for Cancer Research. cancerres.aacrjournals.org Downloaded from
Author manuscripts have been peer reviewed and accepted for publication but have not yet been edited. Author Manuscript Published OnlineFirst on April 3, 2015; DOI: 10.1158/0008-5472.CAN-14-3076
Injected
cell # 1x10⁴ 1x10³ 1x10² 10
CSC
frequency
OBRhi 5/5 4/5 1/5 0/5 1/593
OBR-/low 2/5 0/5 0/5 0/5 1/22,405
OBRhi
+S3I-201 2/5 0/5 0/5 0/5 1/22,405
OBR-/low
+S3I-201 1/5 1/5 0/5 0/5 1/24,857
P=2.37e-06
P=5.12e-06
miR-200c CDH1 BMI1 OCT4 SOX2 NANOG
* *
*
* *
*
OBR-/low+S3I-201
OBR-/low
OBRhi
OBRhi+S3I-201
0
0.5
1
1.5
2
2.5
3
3.5
Fo
ld c
ha
ng
e o
f m
iRN
A/m
RN
A
C OBR-/low OBRhi
020406080
100120140160
Nu
mb
er
of
tum
or
sp
he
re p
er
10
00
ce
lls
*
Leptin: - - + +
A lep_Tube_010.fcs
PE-A
SS
C-A
100
101
102
103
104
0
256
512
768
1024
SS
C
OBR OBR
Unstained lep_Tube_005.fcs compensated
APC-A
SS
C-A
100
101
102
103
104
0
256
512
768
1024
lep_Tube_013.fcs compensated
APC-A
SS
C-A
100
101
102
103
104
0
256
512
768
1024
Mock Leptin
OBR OBR OBR OBR
SS
C
5±2% 15±5%*
92±3% 81±6%
Figure 4
B
E
F
G
OB
Rh
i cell
s (
%)
0
5
10
15
20
25
Low-grade High-grade
P=0.0001
PT1
PT2
OBR-/low OBRhi OBR-/low OBRhi 16.3±3.9
6.7±2.8
Leptin: - - + +
D
0
0.5
1
1.5
Fo
ld c
ha
ng
e o
f
O
BR
le
ve
l
OBR-/low OBRhi
*
on June 24, 2018. © 2015 American Association for Cancer Research. cancerres.aacrjournals.org Downloaded from
Author manuscripts have been peer reviewed and accepted for publication but have not yet been edited. Author Manuscript Published OnlineFirst on April 3, 2015; DOI: 10.1158/0008-5472.CAN-14-3076
0
0.5
1
1.5
2
2.5
Fo
ld c
ha
ng
e o
f
miR
NA
/mR
NA
lev
el
Mock S3I-201
*
* *
miR-200c Cdh1 Bmi1 Obr
Fig
ure
5
A OBR miR-200c LEP p-STAT3 H&E
Western-
Obese
Western-
Lean
Regular
Chow
G F Mock S3I-201
p-STAT3
E
0
20
40
60
80
100
120
140
Tu
mo
r vo
lum
e (
mm
3)
P=0.003
0 1 2 3 4 weeks
Mock
S3I-201
0
10
20
30
40
50
60
70
80
90
Carc
ino
ma
fo
ci
(%)
D
Mock
S3I-201
*
0
2
4
6
8
10
12
14
OB
Rh
i cell
s (
%)
*
Western-
Obese Western-
Lean
Regular
Chow
Mock
S3I-201
B C
Nu
mb
er
of
sp
here
per
100
0 c
ells
Western-
Obese Western-
Lean
Regular
Chow
Fad pad co-culture
Fad pad co-culture
+S3I-201
Sphere only
0
50
100
150**
*
*
on June 24, 2018. © 2015 American Association for Cancer Research. cancerres.aacrjournals.org Downloaded from
Author manuscripts have been peer reviewed and accepted for publication but have not yet been edited. Author Manuscript Published OnlineFirst on April 3, 2015; DOI: 10.1158/0008-5472.CAN-14-3076
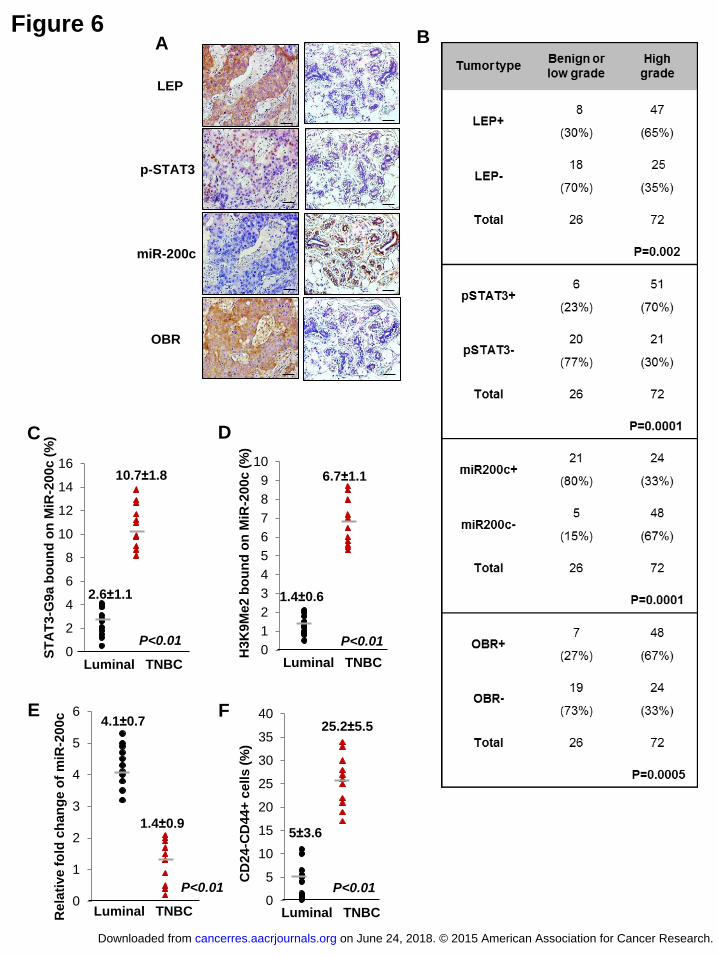
Figure 6 A
OBR
miR-200c
LEP
p-STAT3
B
0
5
10
15
20
25
30
35
40
CD
24
-CD
44+
ce
lls (
%)
P<0.01
C D
F
0
1
2
3
4
5
6
P<0.01
E
Re
lati
ve f
old
ch
an
ge o
f m
iR-2
00c
Luminal TNBC Luminal TNBC
0
1
2
3
4
5
6
7
8
9
10
P<0.01
Luminal TNBC H
3K
9M
e2 b
ou
nd
on
MiR
-20
0c (
%)
0
2
4
6
8
10
12
14
16
P<0.01
Luminal TNBC
ST
AT
3-G
9a b
ou
nd
on
MiR
-20
0c (
%)
1.4±0.6
6.7±1.1
2.6±1.1
10.7±1.8
1.4±0.9
4.1±0.7 25.2±5.5
5±3.6
on June 24, 2018. © 2015 American Association for Cancer Research. cancerres.aacrjournals.org Downloaded from
Author manuscripts have been peer reviewed and accepted for publication but have not yet been edited. Author Manuscript Published OnlineFirst on April 3, 2015; DOI: 10.1158/0008-5472.CAN-14-3076
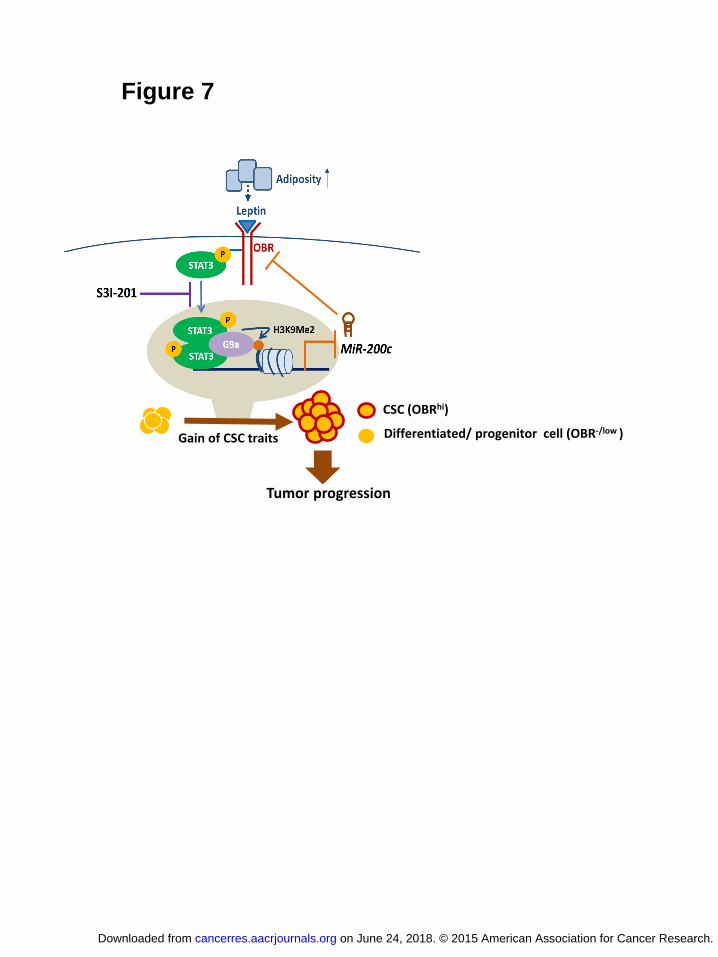
Figure 7
Differentiated/ progenitor cell (OBR-/low )
CSC (OBRhi)
Tumor progression
Gain of CSC traits
on June 24, 2018. © 2015 American Association for Cancer Research. cancerres.aacrjournals.org Downloaded from
Author manuscripts have been peer reviewed and accepted for publication but have not yet been edited. Author Manuscript Published OnlineFirst on April 3, 2015; DOI: 10.1158/0008-5472.CAN-14-3076
Published OnlineFirst April 3, 2015.Cancer Res Chao Ching Chang, Meng Ju Wu, Jer Yen Yang, et al. cancer progressionLeptin-STAT3-G9a signaling promotes obesity-mediated breast
Updated version
10.1158/0008-5472.CAN-14-3076doi:
Access the most recent version of this article at:
Material
Supplementary
http://cancerres.aacrjournals.org/content/suppl/2015/04/04/0008-5472.CAN-14-3076.DC1
Access the most recent supplemental material at:
Manuscript
Authoredited. Author manuscripts have been peer reviewed and accepted for publication but have not yet been
E-mail alerts related to this article or journal.Sign up to receive free email-alerts
Subscriptions
Reprints and
To order reprints of this article or to subscribe to the journal, contact the AACR Publications
Permissions
Rightslink site. Click on "Request Permissions" which will take you to the Copyright Clearance Center's (CCC)
.http://cancerres.aacrjournals.org/content/early/2015/04/03/0008-5472.CAN-14-3076To request permission to re-use all or part of this article, use this link
on June 24, 2018. © 2015 American Association for Cancer Research. cancerres.aacrjournals.org Downloaded from
Author manuscripts have been peer reviewed and accepted for publication but have not yet been edited. Author Manuscript Published OnlineFirst on April 3, 2015; DOI: 10.1158/0008-5472.CAN-14-3076