chaos&order: using visualization as a means to explore large heritage collections
TRANSCRIPT

Chaos & OrderChaos & Order
University of Oslo Library
Using visualization as a means to
explore large heritage collections
Hugo Huurdeman @timelessfuture

Visual Navigation Project
University of Oslo Library
bit.ly/VisualNavigationProject

https://www.youtube.com/watch?v=0Ojz0jO8Moc

Stream 2: Physical
Interaction
• Stream 1 & 3 build on top of
existing work and infrastructure
• Approach Stream 2:
experiment with novel ways of
interaction in physical space
• with library’s book collections
• experiments with a touch
table (Science Library)
• Includes an INF2260 project &
INF Master project Yaron Okun
Physical
interaction
(2)
Visualiza-
tion (1)
Visual
navigation
prototypes
Picture: Marina Tofting

Visual Navigation Project
University of Oslo Library
bit.ly/VisualNavigationProject
in collaboration with Department of Informatics
by support of the National Library of Norway
start: Sept. 2016. duration two years

1 Introduction

One motivation: ‘underuse’ of
Web archives
• Web archives preserve the fast-
changing Web. By now containing
Petabytes of valuable Web data
• This could be a valuable resource,
however, archives have not
frequently been used for research
[DoughertyMeyer14], e.g. due to access issues.
• Presentation focus: using
visualization as a means to explore
large heritage collections

2 Theoretical framework

• Information seeking as a process of construction
• E.g. [Kuhlthau91, Vakkari01]
Inf. seeking process 2.1
+ u
nce
rtain
ty -
feelings
thoughts
actions
vague focused
seeking general
information (exploring)seeking pertinent
information (documenting)
uncertainty optimism confusion clarity confidence (dis)satisfaction
doubt direction
FormulationInitiation Selection Exploration Collection Presentation

Stage-based search support
• Stage-based support [Huurdeman&Kamps14/15,HuurdemanWilson&Kamps16, Huurdeman17a/b]

Re/search as a constructive
process 2.3
• Mapping Kendall’s (2012) Research Process Model
• to Kuhlthau’s ISP Model (1991) [Huurdeman17b]

• Today: look at the initial (prefocus) phases
• How does one get curious, inspired, interested?
What support for this phase currently exists?
Research as a constructive
process 2.3

3. Exploratory Interfaces

[Ahlberg&Shneiderman94]
[Google Wonder Wheel]
[ClusterMap]
[Epicurious]
[Donato10]
[Hearst&Degler13]
[Proulx et al., 2006]
• SUIs may aid users to:
• express needs, formulate queries, provide
understanding & to track progress [Hearst09]
• Complexity of designing effective SUIs[Shneiderman05]
• Many proposed interactive features:
• search suggestions [Niu14], facets [Tunkelang09], item
trays [Donato10], ..
Search User Interfaces 3.1

Few features have made it to the general search engines, however
Some turned up in specific context, e.g. online shopping, analytics

Access to heritage collections
3.2
• Some developments have been incorporated in
systems to access cultural heritage collections
• Libraries, Museums, Archives
• Web archives
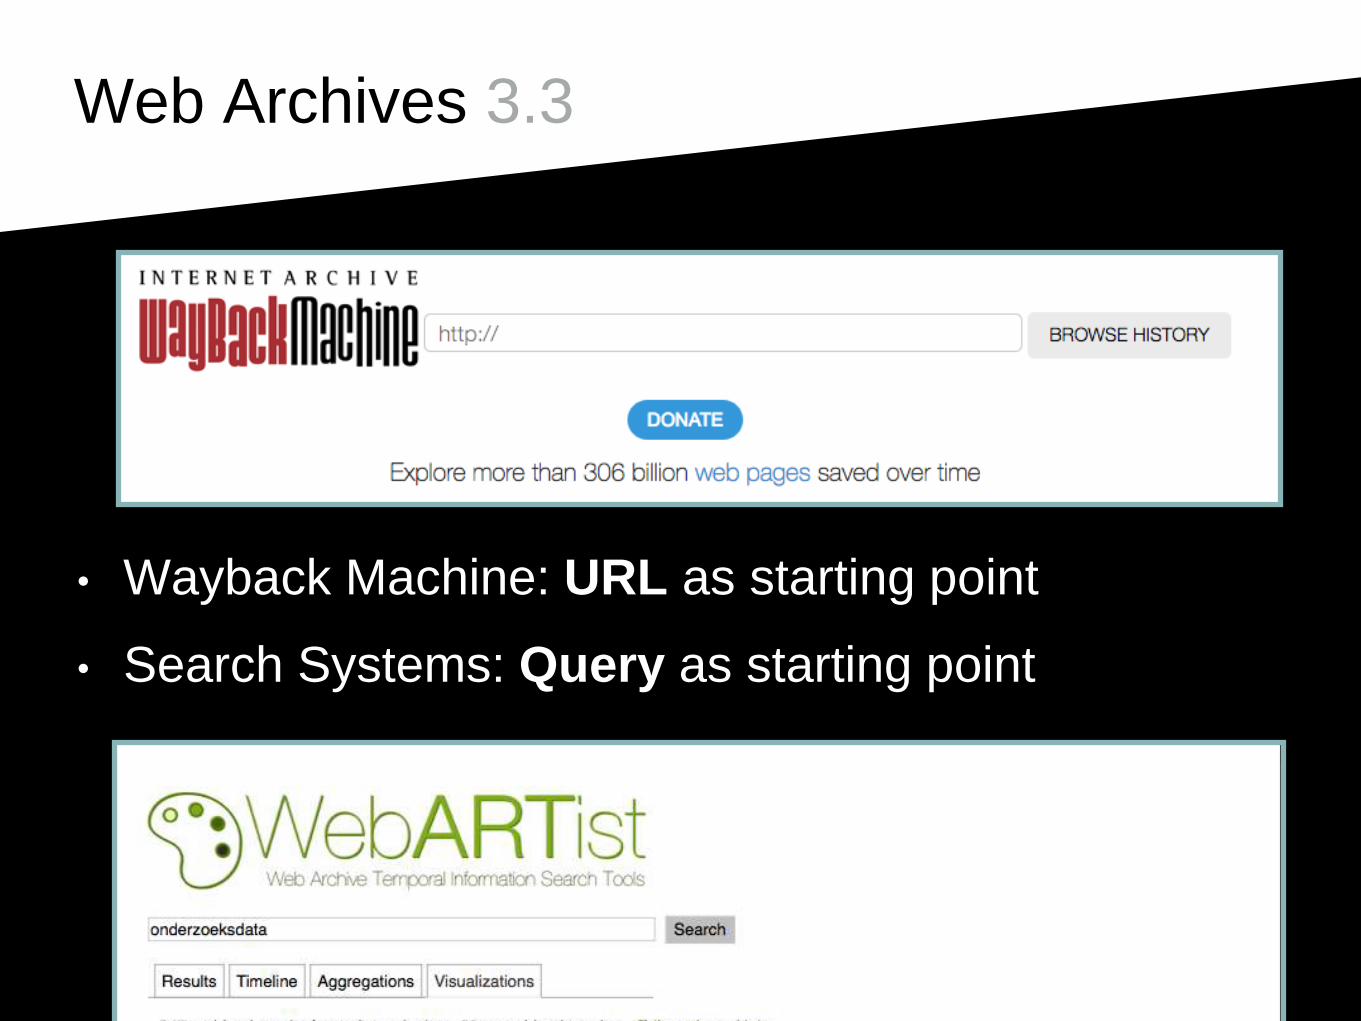
Web Archives 3.3
• Wayback Machine: URL as starting point
• Search Systems: Query as starting point

Assumptions of Wayback
Machine 3.4
• Assumption that you know what you are looking
for…
!!!

Assumptions of search
3.5
• Searching (even exploratory) assumes that you
have an initial idea what you would like to look for
— however rough
image:

Web archive Access
Issues 3.7
• Problems* of
• scale (large size)
• dimensions (temporal and hierarchical)
• Hence, the data is too much and too complex for
regular URL browsing & basic searching (e.g. how
to convey all this in 10 blue links?)

Towards Visualization? 3.8
• Any kind of visual representation of information
designed to enable exploration, discovery,
communication, etc. (Cairo, 2016)
• Visualization - can be used throughout (re)search
process
• initial exploration, get a grasp (exploration)
• as an artefact of ongoing research (discovery)
• as an end product (science communication)

Guiding Questions
3.9
• Can we devise alternatives* to the Query and
URL approach for web archive access?
• To what extent can we provide more visual
approaches for browsing web archives?
[Ahlberg&Shneiderman94]
[Pe
jte
rsen
89]

4. Initial explorations
[Part presented as HuurdemanSamarEtAl16 (IIPC)]

Flickr: koninklijkebibliotheek
Statistics (2016):
•10,000+ websites
•35,000+ harvests
•16+ Terabyte
•Categorized using
UNESCO classification
National Library of the Netherlands: Web archive since 2007

Data: extraction and
processing 4.1
extracting all homepages + 1
level deep
matching with seedlistadding KB metadata
cleaning, processing, data
enrichment (e.g. NER)generate visualizations~900K XML
files
thanks: Thaer Samar

Web sphere
Page element
Web site
Web page
2010 2015
eyefilm.nl
[Brügger][Huurdeman15]

Example: eyefilm.nl (2010-
2015)
redesign redesign
content links images overall

Example: escherinhetpaleis
.nl (2010-2015)
content links images overall

Web sphere
Page element
Web site
Web page
2010 2015
unesco classifications

Changerate
(type of site)
Changes per unesco category (all p/quarter harvests, n=~600, 2009-2015)
MeteorologyLaw & government
History
Sports
Agriculture

Web sphere
Page element
Web site
Web page
2010 2015
nu.nl

Exploring content (news)
per year
2014
2015

Jan’13 Feb’13 Mar’13 Apr’13
May’13 Jun’13 Jul’13 Aug’13
Sep’13 Oct’13 Nov’13 Dec’13

Daily (2012)

5. ‘CollectionXplorer’

CollectionXplorer
Characteristics
• Using d3js as a basis
• “Playful”, short-form development
• Different visualizations as a ‘lens’ to the archive
• As a starting point to rethink web archive access
• How to induce interest, inspiration & curiosity in
the context of web archives?

Clusters color: representations of websites, size: number of crawls
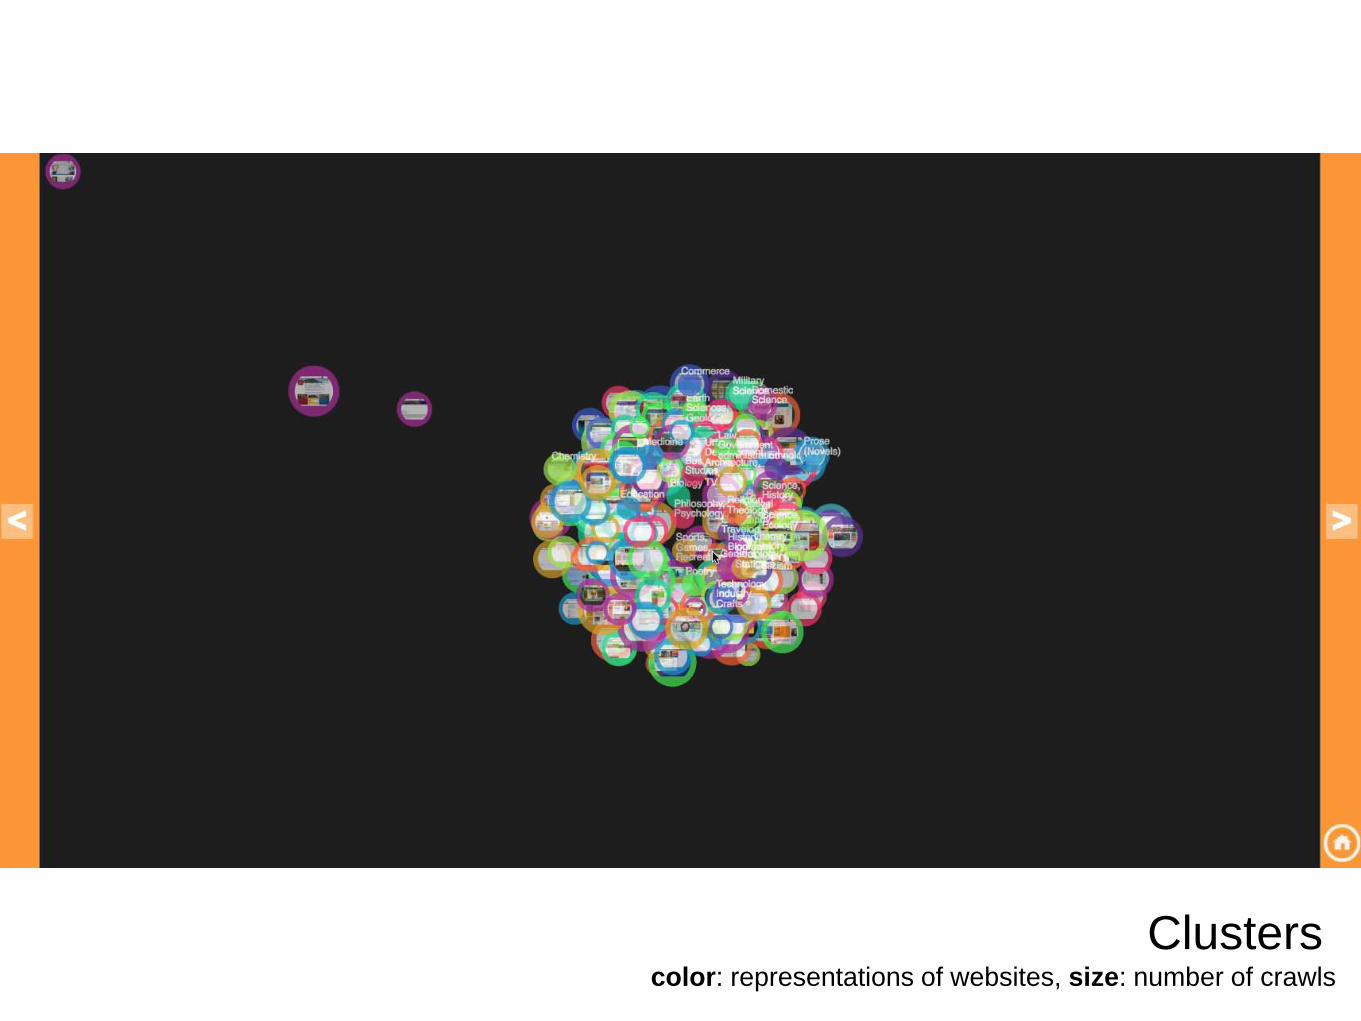
Clusters color: representations of websites, size: number of crawls

Word Cloudssize: number of sites

Bar Chartscolor: unesco category, size: avg change %

Bar Chartscolor: unesco category, size: avg change %

Network (Force-directed)connetions: unesco category, size: number of crawls

Scatterplotshorizontal: category, vertical: user rating (books)
So, lots of opportunitiesdistinct properties of each type of visualization

CollectionXplorer -
some char’istics
• “Playful” - engage potential users, encourage to interact
• Easy to add new types of visualizations
• Various modalities to explore
• Initial testing on touch table (swipe!)
• Next steps: further explore dimensions of the archive
• Develop a “design language”
• Infrastructural demands, user testing. Evaluation.

7. Conclusion

Conclusion
• Looking at initial stages of the complex
(re)search process - open-ended browsing
• Exploring temporal and hierarchical dimensions
• Short-form prototypes - how to visualize web
archive content in “engaging” ways?
• …further infrastructure, dev and testing is needed

Closing off: conveying
complexity
• “I want [people] to use the visualizations I provide
as a starting point for their own explorations”
• They should expose “the complexity, the inner
contradictions, the manifold nature of the
underlying phenomenon. (Moritz Stefaner)
In a web archive context, a simple results list
hides a lot of complexities…

References
• Ben-David A. & Huurdeman H. (2014). Web Archive Search as Research: Methodological and Theoretical Implications. Alexandria Journal, Volume 25, No. 1 (2014)
• Brügger, N. (2013). Historical Network Analysis of the Web. Social Science Computer Review, 31(3), 306–321
• Dougherty, M., & Meyer, E. T. (2014). Community, tools, and practices in web archiving: The state-of-the-art in relation to social science and humanities research needs. Journal of the Association for Information Science and Technology, 65(11), 2195–2209. http://doi.org/10.1002/asi.23099
• Hearst M. A.. Search User Interfaces. Cambridge University Press, 2009.
• Huurdeman, H. C. (2017). Dynamic Support for the Complex Dynamics of the Information Seeking Process, PhD thesis (exp.2017)
• Huurdeman, H. C. (2017). Dynamic Compositions: Recombining Search User Interface Features for Supporting Complex Work Tasks. In SCST@ CHIIR (pp. 21–24).
• Huurdeman, H. C., Wilson, M. L., & Kamps, J. (2016). Active and Passive Utility of Search Interface Features in Different Information Seeking Task Stages. In Proceedings of the 2016 ACM on Conference on Human Information Interaction and Retrieval (pp. 3–12). New York, NY, USA: ACM. https://doi.org/10.1145/2854946.2854957
• Huurdeman, Samar, Kamps, De Vries (2016). Towards Multidimensional Web Archive Access. Presented at IIPC conference ‘16
• Hugo C. Huurdeman and Jaap Kamps (2015). Supporting the Process: Adapting Search Systems to Search Stages. In: S. Kurbanoğlu, S. Špiranec, J. Boustany, E. Grassian, D. Mizrachi, & L. Roy (Eds.), Information Literacy: Moving towards sustainability, Communication in Computer and Information Science series (Vol. 552, pp. 394-404).
• Huurdeman, H. (2015). Towards Research Engines: Supporting Search Stages in Web archives. In Two-day conference at Aarhus University, Denmark.
• Huurdeman, H., & Kamps, J. (2014). From Multistage Information-seeking Models to Multistage Search Systems. In Proceedings of the 5th Information Interaction in Context Symposium (pp. 145–154). New York, NY, USA: ACM.
• C. C. Kuhlthau. Inside the search process: Information seeking from the user’s perspective. JASIS, 42:361–371, 1991.
• B. Shneiderman and C. Pleasant. Designing the user interface: strategies for effective human-computer interaction. Pearson Education, 2005.
• P. Vakkari. A theory of the task-based information retrieval process: a summary and generalisation of a longitudinal study. Journal of Documentation, 57:44–60, 2001.

Acknowledgements
• Thaer Samar & Jaap Kamps & Arjen & others in WebART
• NWO grant
• Colleagues at University of Oslo (Science Lib)
• NB grant
• René Voorburg & Kees Teszelsky at the KB

Chaos & Order
University of Oslo Library
Using visualization as a means to
explore large heritage collections
Hugo Huurdeman @timelessfuture