chap-1-akram.pdf
TRANSCRIPT

7/27/2019 chap-1-Akram.pdf
http://slidepdf.com/reader/full/chap-1-akrampdf 1/18
Asia is recognized as one of the most vulnerable regions to climate
change on the planet. With approximately 60 per cent of world’s
population residing in Asia, this phenomenon presents serious concernsfor policymakers in the region. The present study analyses the impacts
of climate change on economic growth for selected Asian countries
during the period 1972-2009. A growth model has been developed by
incorporating temperature and precipitation as proxies for climate
change in the production function and a fixed effect model (FEM) and
seemingly unrelated regression (SUR) have been used to estimate the
model. The results reveal that economic growth is negatively affected by
changes in temperature, precipitation and population growth whereas
urbanization and human development stimulates economic growth. The
results also indicate that agriculture is the most vulnerable sector to
climate change and manufacturing is the least affected sector.
JEL Classification: Q54, O44, C23, C33.
Key words: Climate change, economic growth, xed effect model, seemingly unrelated
regression.
IS CLIMATE CHANGE HINDERING ECONOMIC GROWTH
OF ASIAN ECONOMIES?
Naeem Akram*
* Federal Urdu University of Arts Science & Technology, Islamabad (e-mail: [email protected]).
Acknowledgment: the paper is a partial outcome of the research project funded by the South Asian
Network for Development and Environmental Economics (SANDEE). I am extremely grateful to SANDEEfor the research grant that enabled me to undertake the present study. My sincere thanks go to Priya
Shyamsundar, Jeffrey Vincent, Jean Marie and Mani Nepal for their valuable suggestions when I was
working with SANDEE. I am also grateful to the anonymous referees as their comments have improved the
paper to a great extent.
1
l anr uoJ t nem pol ev eDc i f i c aP -ai s A Vol. 19, No. 2, December 2012

7/27/2019 chap-1-Akram.pdf
http://slidepdf.com/reader/full/chap-1-akrampdf 2/18
I. INTRODUCTION
A strong correlation exists between energy consumption and economicgrowth. Energy use results in accelerating greenhouse gas (GHG) emissions.
Estimates indicate that approximately 75 per cent of all CO2
emissions have come from
developed countries. These results imply that economic growth depends on energy
usage that leads to environmental degradation. However, economic growth may bring
an initial phase of deterioration but later on, due to the adoption of better abatement
technologies, it might bring some improvement to the quality of the environment
(Grossman and Krueger, 1995; Hitz and Smith, 2004). Recently, accelerating
emissions of GHGs in developing countries, especially in emerging economies, such
as Brazil, China and India, have raised serious concerns about the relationship
between climate change and economic growth. Although climate change may initially
have some positive effects for some developed countries, it will be destructive in the
long run (Hope, 2006).
Moreover, the impacts of climate change are not evenly distributed. The
poorest countries and people feel the adverse impacts of climate change rst and will
suffer the most from them as these countries are more vulnerable to the negative
effects of rising sea level and the impact on water resources, ecosystems, cropproduction, sheries and human health (Stern and others, 2006; Nordhaus, 1991; Tol,
2008; Yohe and Schlesinger, 2002). In less developed countries, a large percentage of
the population is dependent on climate-sensitive sectors and there is low capacity
to develop and implement adaptation strategies. Nevertheless, these countries have
to bear the cost for promotion and adoption of different mitigation strategies
(Adger, 2006). Notably, the impact of mitigation will only be felt in the long run by future
generations (Sathaye, Shukla and Ravindranath, 2006). Similarly, due to limited
adaptive capacities, these countries’ poor communities are more vulnerable to natural
hazards (Smith and Wandel, 2006).
In order to accelerate economic growth and curtail poverty, developing
countries need to expand their industrial development and improve living standards.
As this takes place, emissions of GHG rise, which, in turn, leads to considerable
changes in the climate. Therefore, it is very crucial that a comprehensive study on
Asian countries be conducted to analyse the effects of changing weather patterns
(an indicator of climate change) on economic growth. Despite data limitations, the
present study has attempted to empirically test the relationship between weather
patterns and economic growth.
l anr uoJ t nem pol ev eDc i f i c aP -ai s A Vol. 19, No. 2, December 2012
2

7/27/2019 chap-1-Akram.pdf
http://slidepdf.com/reader/full/chap-1-akrampdf 3/18
The organization of the paper is as follows: after the introduction, section II
presents a brief review of the literature and contains a description of the situation of
climate change in Asia. In section III, a theoretical background of the study is presentedfollowed by a discussion on a model for climate change and economic growth that has
been developed. The empirical model along with the description of data are presented
in section IV. Section V is devoted to a discussion of the estimation results and the last
section concludes the paper in which some policy implications and suggestions for
further research are presented.
II. LITERATURE REVIEW
Although economic analysis of climate change is a comparatively new issue,
numerous studies have estimated the impacts of climate change on economic growth
in different regions of the world. Most of these studies are numerical in nature and a bit
speculative but they do provide a solid foundation for future research.
Due to climate change, some sectors of the economy may grow faster in
comparison to the others and at the same time, the size and composition of some
countries’ gross domestic product (GDP) may change. Climate change also affects thelong-term growth potential of the country. Furthermore, the effects of climate change
are not homogeneous within countries; it was found that agriculture, coastal zones and
elderly people are more heavily affected than their counterparts. (O’Brien, Sygna and
Haugen, 2004; Parry and others, 2007; Lucas and Simone, 2011). According to Stern
and others (2006), in the next fty years, world temperatures are expected to rise
2-3°C. This increase will have severe consequences on economic development as it
will affect water quality, agricultural productivity and human health. It was further
calculated that about 5 per cent of global GDP per annum would be lost by these
impacts. Weitzman (2007) has criticized these ndings by indicating that there areuncertainties associated with the measurement of the impacts of climate change and
the conclusions drawn were based on a very low discount rate.
Dell, Jones and Olken (2008) found that because of climate change, the
growth rate of poor countries would be reduced by 0.6 to 2.9 percentage points.
According to Fankhauser and Tol (2005), climate change affects capital accumulation
and people’s propensity to save, which, in turn, reduces economic growth. By using
different growth model specications, it was found that dynamic effects are relatively
larger as compared to direct or static impacts of climate change. However, Calzadilla,
Pauli and Roson (2007) concluded that extreme weather would result in savings. This
is based on the assumption that in line with expectations that global damage would
increase, people would increase savings to avoid the anticipatory negative effects of
l anr uoJ t nem pol ev eDc i f i c aP -ai s A Vol. 19, No. 2, December 2012
3
7/27/2019 chap-1-Akram.pdf
http://slidepdf.com/reader/full/chap-1-akrampdf 4/18
climate change. Notably, extreme weather is expected to boost investment as well.
According to Lecocq and Shalizi (2007), GDP will be affected indirectly by variations in
demand structure even though there is no direct effect of climate change on it. Climatechange can result in resource scarcity, which could lead to violent conict and
consequently reduce economic growth in the long-run (Zhang and others, 2007; Tol
and Wagner, 2010; Butkiewicz and Yanikkaya, 2005).
Parry and others (2007) projects that a decline in water supplies stored in
glaciers and snow cover will result in water scarcity. If global average temperature
increases by 1.5-2.5°C then approximately 20-30 per cent of plant and animal species
will face the danger of extinction. An increase of temperature in the range of 1-3°C has
the potential to increase food production but an increase in temperature beyond thatwould result in a decline in food production. A rise in sea surface temperature of 1-3°C
would cause more frequent coral bleaching events and widespread mortality, unless
there is thermal adaptation or acclimatization by corals. Sea level rise will negatively
affect the coastal wetlands, including salt marshes and mangroves (Nicholls and Tol,
2006). Projections made by Agrawala and others (2003) reveal that the economy of
Bangladesh is affected by climate change through sea level rise, higher temperatures,
enhanced monsoon precipitation and run-off, potentially reduced dry season
precipitation and an increase in cyclone intensity. This situation has created serioushurdles for the sustainable economic development of the country.
As temperature and precipitation are direct inputs in agricultural production,
many believe that the largest effects of climate change will be on agriculture. However,
under the conditions of climate change, agriculture production rises in the higher
latitudes, partly because of an increase in arable land, and production tends to fall in
the tropics, mainly due to an assumed decline in the availability of water (Cooper, 2000;
Parry and others, 2007). Gregory, Ingram and Brklacich (2005) suggested that climate
change was playing an important role for agriculture but its relative importance variedamong regions as well as among different societal groups within a region. For example,
in southern Africa, climate is among the most frequently cited drivers of food insecurity.
In other regions, such as the Indo-Gangetic Plain of India, other factors, including
inefcient labour, availability and quality of ground water for irrigation, ranked higher
than the direct effects of climate change as a factor inuencing food security. Climate
change can affect food systems in several ways, such as having direct effects on crop
production through changes in rainfall and temperature. Changes in rainfall lead to
drought or ooding, whereas warmer or cooler temperatures will change the length of
the growing season. Both of these will affect food prices and the supply chain
infrastructure.
l anr uoJ t nem pol ev eDc i f i c aP -ai s A Vol. 19, No. 2, December 2012
4
7/27/2019 chap-1-Akram.pdf
http://slidepdf.com/reader/full/chap-1-akrampdf 5/18
Mendelsohn and Dinar (1999) concluded that higher temperatures would
reduce grain yields. They also found that India and Brazil had attempted to minimize
the effects of global warming on agriculture and that individual farmers had played avery crucial role in that regard. Later on Mendelsohn, Dinar and Sanghi (2001) and
Mendelsohn and Williams (2004) found that most of the market sector impacts of
climate change have a hill-shaped relationship with temperature. Global warming will
likely benet cool countries/areas, have modest effects on temperate locations and
negatively affect hot areas.
Despite the importance of livestock to poor people and the expected effects
of climate change on livestock systems, the impacts of climate change on livestock in
developing countries are a relatively neglected research area. Livestock feeds, itsquantity and quality, heat stress, water, livestock diseases and disease vectors and
biodiversity are the major channels through which climate change affects livestock
(Thornton and others, 2009).
Gilbreath (2004), in a discussion of a report of the World Health Organization
(WHO), states that climate change may increase the risk of death and suggests that
most of the diseases common in developing countries are sensitive to climate change.
The discussion also notes that even a proportionally small change in the globalincidence of some diseases could result in signicant public health impacts. It has
been estimated that in some regions, the effects of climate change will increase
the risk of diarrhoea to 10 per cent in 2030 from the 1990 level. Similarly, the degree
of global warming can raise the risk of contracting malaria, leading to expectations
that the disease will likely affect 1 million persons and cause the death of about 27,000
persons by 2030 (McMichael and others, 2004). It has also been found that there is a
correlation between the spread of malaria and climate change in India (Bhattacharya
and others, 2006).
Environmental regulations are generally perceived to impose constraints on
production, which lead to harmful impacts on economic growth. However, it has been
argued that the effects of environmental policy on economic growth vary through
the stages of development (Bretschger and Smulders, 2001; Smulders, Bretschger
and Egli, 2011). Environmental regulations will enhance the prospects for growth
if improved environmental quality increases the productivity of inputs. Because
environmental regulation promotes pollution abatement activities, increasing the
returns to scale and these regulations can also stimulate innovations (Ricci, 2007).
Greiner (2004; 2005) has found that an increase in GHG emissions will negatively
affect the aggregate output and the marginal productivity of capital and that higher
abatement activities might reduce GHG emissions and lead to higher economic
growth. Tol (2009) has also argued that GHG emissions had severely affected economic
5
l anr uoJ t nem pol ev eDc i f i c aP -ai s A Vol. 19, No. 2, December 2012

7/27/2019 chap-1-Akram.pdf
http://slidepdf.com/reader/full/chap-1-akrampdf 6/18
development and called for a higher carbon tax to reduce the emissions.
Asian countries collectively encompass the world’s greatest economic, culturaland ecological diversity. About 60 per cent of the world’s population live in these
countries, making Asia the most populated continent. The total economic activities of
Asia make up about 25 per cent of the world’s GDP (World Bank, 2010). Consequently,
the region is facing many environmental and socioeconomic challenges.
In 2010, Maplecroft released a climate change vulnerability index.1 Out of 170
countries, 16 countries were identied to be in a condition of extreme risk. Among
them, 10 are in Asia. Below is the list of the most vulnerable countries.
Table 1. List of the most vulnerable countries
It is worth mentioning here that the variation in climate and geographic
features among Asian countries is very large. For example, in China and some parts of
India and Pakistan (particularly areas around the Himalayas), winter temperatures are
at or below freezing. On the other hand, South-East Asia and the Pacic islands
generally experience temperatures above 25°C throughout the year. Consistent with
global temperature trends, Asian countries have also been experiencing a warmingtrend in recent decades. Climate modelling indicates an increase in temperature in Asia
by 0.5-2°C by 2030 and 1-7°C by 2070 and predict that arid areas of northern Pakistan
and India and western China are likely to warm more quickly. In addition, models
indicate increasing rainfall during the summer monsoon season and a reduction in
winter rainfall and predict that Asia will also be affected by a rise in the global sea level
of approximately 3-16 cm by 2030 and 7-50 cm by 2070 (Parry and others, 2007).
l anr uoJ t nem pol ev eDc i f i c aP -ai s A Vol. 19, No. 2, December 2012
6
Bangladesh (1)
India (2)
Madagascar (3)
Nepal (4)
Mozambique (5)
Philippines (6)
Haiti (7)
Afghanistan (8)
Zimbabwe (9)
Myanmar (10)
Ethiopia (11)
Cambodia (12)
Viet Nam (13)
Thailand (14)
Malawi (15)
Pakistan (16)
Note: Value in parenthesis is the respective rank of the country.
1 To calculate the vulnerability of 170 countries for the impacts of climate change over the next 30 years,
42 social, economic, and environmental indicators have been used. The index can be downloaded at
www.maplecroft.com.

7/27/2019 chap-1-Akram.pdf
http://slidepdf.com/reader/full/chap-1-akrampdf 7/18
Climate change is resulting in the degradation of land, ecosystems, water and
air quality in Asian countries. It is threatening to undermine food security as well as
causing health problems. Crop yields are estimated to fall by up to 30 per cent and onebillion people may be affected by a water shortage, leading to drought and land
degradation by the 2050s (Christensen and others, 2007; Cruz and others, 2007).
Climate change has also resulted in the melting of the Himalayan glaciers, which in the
short run has raised the risk of mudslides, erosion and ooding. The health impacts
primarily consist of epidemics of malaria, dengue, and other vector-borne diseases
(Martens and others, 1999). In summer, the increase in humid conditions and severe
heat waves can increase the risk of mortality and morbidity in poor communities
(Epstein, Sohar and Shapiro, 1995).
Notably, Asia is dealing with increasing cases of natural hazards, such as
landslides in the Philippines (2006), extreme weather events in China (2006) including
storms, ooding in the east and south, heat and drought in the central and north-eastern
regions, and catastrophic oods in Pakistan (2010 and 2011). The impacts of these
disasters include hunger, disease, loss of income and livelihoods, collateral damage to
infrastructures, all of which affect the survival and well-being of the population.
III. THEORETICAL BACKGROUND
The two most widely used types of approaches for analysing the impacts of
climate change on economic growth are the enumerative approach and the dynamic
approach. In the enumerative approach, the economic impacts of climate change are
analysed separately sector by sector, such as the effects of climate change on
agriculture, the ecosystem or tourism. These effects are evaluated together to obtain
an estimate of the total change in social welfare stemming from climate change
(Nordhaus, 1991; Cline, 1994; Tol, 1995). In this approach, the effects of climatechange are analysed by focusing on only one period. Intertemporal effects are ignored.
These studies, however, have failed to provide information on how climate change may
affect welfare in the long run. This approach also ignores the signicant “horizontal
interlinkages”, such as the interaction of sectoral impacts. It mostly uses computable
general equilibrium (CGE) models and simulation techniques.
In the dynamic approach, different specications of growth models are used
by incorporating the damage function. The Solow-Swan and Ramsey-Cass-Koopmans
models are the most widely used growth models for analysing the impacts of climate
change on economic growth. The Mankiw, Romer and Weil (1992) model is also
applied (Fankhauser and Tol; 2005), but to a lesser degree. In all three of these models,
under the assumption of a constant savings rate, it has been found that if climate
l anr uoJ t nem pol ev eDc i f i c aP -ai s A Vol. 19, No. 2, December 2012
7

7/27/2019 chap-1-Akram.pdf
http://slidepdf.com/reader/full/chap-1-akrampdf 8/18
change has a negative impact on output, then the amount of investment will also be
reduced. In the long run, capital stock and consumption per capita will decline, which will
result in shrinking aggregate demand and will adversely affect GDP. In an endogenousgrowth model, the situation becomes even worse if lower investment (caused by
capital accumulation effect) slows the technical progress and improvements in labour
productivity or human capital accumulation (Lecocq and Shalizi, 2007).
Both of these approaches were used to some extent to conduct the present
study and analyse the impacts of climate change on economic growth and its
components, such as agriculture, manufacturing and services.
Theoretical model
Dell, Jones and Olken (2008) incorporated the climatic variables in the
production function of their model, which was used as the baseline for the present
study. The model provided the theoretical basis for incorporating climate change into
growth equations and the guidelines for decomposition of the impacts of changes in
weather on economic growth.
Consider the production function.
Where Y is GDP, L is labour force, A is technology and can be referred to as labour
productivity and T are the impacts of climate, g is the growth rate of GDP and K is
human capital. Equation (1) captures direct effects of climate change on economic
growth, such as impacts on labour productivity. Equation (2) captures the indirect
(dynamic) effect of climate, such as the impact of climate on other variables that
indirectly inuence GDP. Notably, equation (1) directly relates climate change to GDP
whereas in equation (2), climate changes affect labour productivity, which will, in turn,
affect GDP growth.
l anr uoJ t nem pol ev eDc i f i c aP -ai s A Vol. 19, No. 2, December 2012
8
Yit = eαT A
it L
it K
it(1)it
∆ A it
A it
= gi+ βT
it(2)

7/27/2019 chap-1-Akram.pdf
http://slidepdf.com/reader/full/chap-1-akrampdf 9/18
After taking logs of equation (1) and differencing with respect to time, the
following equation can be derived.
Where git
is the growth rate of output, direct effects of climate change on economic
growth appear through α and indirect effects appear through β while gidenotes the
xed effects.
This equation separately identies the direct and indirect effects of climatechange. Both of these affect GDP growth rate in the initial period. However, when
climate returns to its prior state, direct effect reverses itself. For example, a rise in
temperature may harm agricultural production, but whenever temperature returns to its
normal level the agricultural production once again accelerates. On the other hand, an
indirect effect emerges during climate shocks and their effects persist even in the
normal conditions, such as failure in human capital development resulting in a
permanent deterioration in human capital and economic growth.
IV. EMPIRICAL MODEL AND DESCRIPTION OF DATA
In the light of the theoretical model, the following super reduced form equation
of economic growth will be estimated. The equation is an empirical specication of the
equation (3) of the preceding section.
Where y represents GDP growth rate and hc, pop, ur, tmp and pr denotes human
capital, population growth, urbanization, temperature and precipitation, respectively.
In order to see which sector of the economy is affected more by climatic conditions,
the model is also regressed on the main sectors of GDP, such as agriculture (Ag),
manufacturing (Mn) and services (Sr). The model that is estimated in this regard is the
following:
l anr uoJ t nem pol ev eDc i f i c aP -ai s A Vol. 19, No. 2, December 2012
9
yit = α0 + α1hc it + α2 pop it + α3 ur it + α4 tmp it + α5 pr it + ε it (A)
git
= gi+ ( α + β )T
it– αT
it-1(3)

7/27/2019 chap-1-Akram.pdf
http://slidepdf.com/reader/full/chap-1-akrampdf 10/18
Three different specications are tested: temperature in the rst specication,
precipitation in the second specication, and both temperature and precipitationare used as indicators of climate change in the third specication. The random
effect model and xed effect model technique were considered to estimate model (A).
The Hausman test of endogenity was used to select the suitable technique. For the
estimation of model (B), which is a seemingly unrelated model, the seemingly unrelated
regression (SUR) technique was used.2 Panel data spanning the period 1972-2009 for
the selected Asian countries, namely Bangladesh, India, Indonesia, Malaysia, Pakistan,
the Philippines, Sri Lanka and Thailand, were used.
The selection of an indicator of climate change is an extremely critical issue.
In this regard, GHG emission levels, atmospheric GHG concentration levels, global
mean temperature, sea-level rise and intensity or frequency of extreme events are the
most commonly used indicators.
In the study, annual temperature and precipitation have been selected as an
indicator of the climate change for two reasons. The rst is that the impact literature
can be directly related to a change in mean temperature, such as Parry and others
(2007), Dell, Jones and Olken (2008). The second reason is that changes in meantemperature have a direct relationship with GHG concentrations. However, it is
relatively difcult to relate the other indicators directly to GHG concentrations.
l anr uoJ t nem pol ev eDc i f i c aP -ai s A
1
Vol. 19, No. 2, December 2012
10
Agit = α0 + α1 hc it + α2 pop it + α3 tmp it + α4 pr it + ξ it
Mnit
= α0+ α
1 hc
it + α
2 pop
it + α
3 tmp
it + α
4 pr
it + ψ
it
Srit
= α0+ α
1 hc
it + α
2 pop
it + α
3 tmp
it + α
4 pr
it + δ
it
(B)
2 For details of estimation methodologies see Wooldridge (2002; 2005); Baltagi (2005).

7/27/2019 chap-1-Akram.pdf
http://slidepdf.com/reader/full/chap-1-akrampdf 11/18
A brief description and details of the data used in this study are presented in
table 2.
Table 2. Data sources
V. ESTIMATION RESULTS
Before estimating the empirical model (A), the Hausman test was used to
select the appropriate estimation methodology, which would be either a xed effect
model or a random effect model. The signicant Chi-square test statistics suggest that
the use of a xed effect model would be appropriate instead of using the random effect
model in all three specications.
l anr uoJ t nem pol ev eDc i f i c aP -ai s A
1
Vol. 19, No. 2, December 2012
1/11
S.#
1.
2.
3.
4.
5.
6.
7.
8.
9.
Name of variable
GDP growth rate (y)
Population growth rate
(pop)
Urbanization (ur)
Human capital (hc)
Agriculture (Ag)
Manufacturing (Mn)
Services (Sr)
Temperature (tmp)
Precipitation (pr)
Data source
WDI3
WDI
WDI
Data maintained by Easterly
(2001) and WDI
WDI
WDI
WDI
Terrestrial Air Temperature
and Precipitation database,
Gridded monthly time series
Terrestrial Air Temperature
and Precipitation database,
Gridded monthly time series
Comment
GDP growth rate
Population growth rate
Urban population as percentage
of total population
Secondary school enrolment
Agriculture value addition in US$
Manufacturing value addition in US$
Services value addition in US$
Annual temperature is calculated by
using the monthly data.
Annual precipitation is calculated by
using the monthly data.
3 World Development Indicators.
11
7/27/2019 chap-1-Akram.pdf
http://slidepdf.com/reader/full/chap-1-akrampdf 12/18
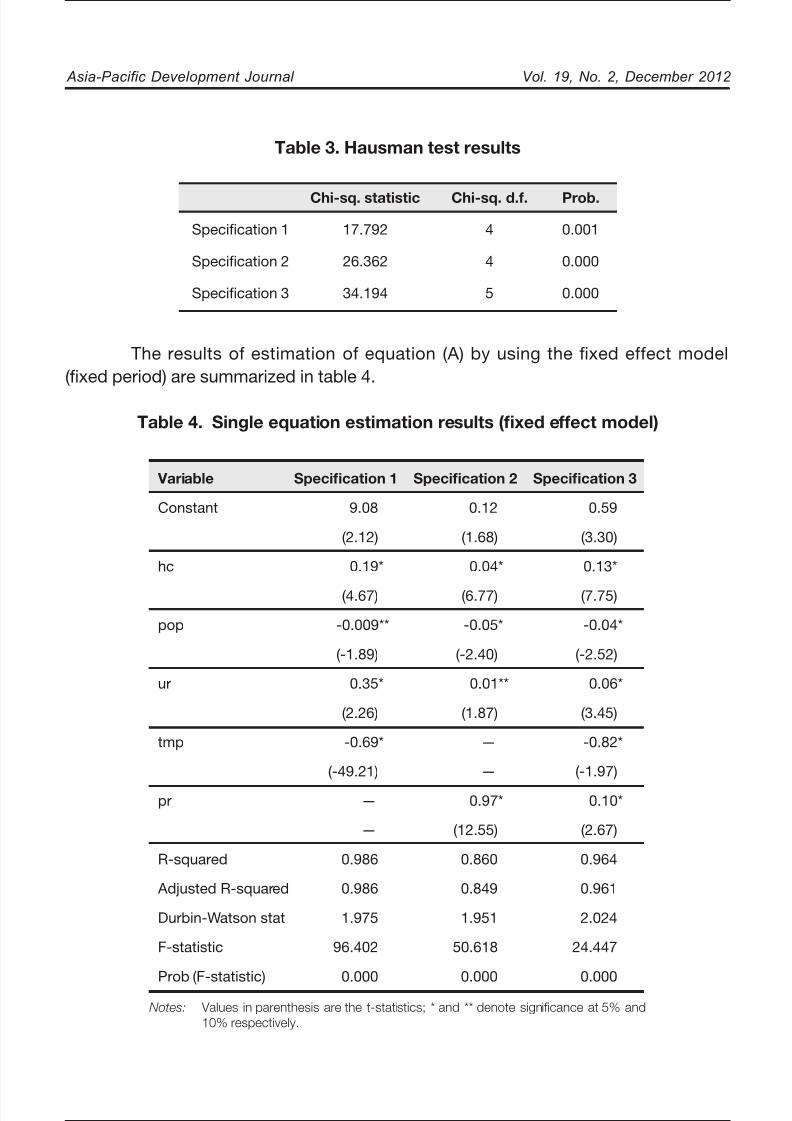
Table 3. Hausman test results
The results of estimation of equation (A) by using the xed effect model
(xed period) are summarized in table 4.
Table 4. Single equation estimation results (fixed effect model)
l anr uoJ t nem pol ev eDc i f i c aP -ai s A
1
Vol. 19, No. 2, December 2012
1/12
Notes: Values in parenthesis are the t-statistics; * and ** denote significance at 5% and
10% respectively.
Specication 1
Specication 2
Specication 3
Chi-sq. statistic
17.792
26.362
34.194
Chi-sq. d.f.
4
4
5
Prob.
0.001
0.000
0.000
Variable
Constant
hc
pop
ur
tmp
pr
R-squared
Adjusted R-squared
Durbin-Watson stat
F-statistic
Prob (F-statistic)
Specification 1
9.08
(2.12)
0.19*
(4.67)
-0.009**
(-1.89)
0.35*
(2.26)
-0.69*
(-49.21)
—
—
0.986
0.986
1.975
96.402
0.000
Specification 2
0.12
(1.68)
0.04*
(6.77)
-0.05*
(-2.40)
0.01**
(1.87)
—
—
0.97*
(12.55)
0.860
0.849
1.951
50.618
0.000
Specification 3
0.59
(3.30)
0.13*
(7.75)
-0.04*
(-2.52)
0.06*
(3.45)
-0.82*
(-1.97)
0.10*
(2.67)
0.964
0.961
2.024
24.447
0.000
12

7/27/2019 chap-1-Akram.pdf
http://slidepdf.com/reader/full/chap-1-akrampdf 13/18
The results reveal that human capital has a positive and signicant impact on
economic growth. This is in accordance with the theory that human development
enhances economic growth. It is also supported by numerous studies on the subject,including, among others, Romer (1986), Barro and Sala-i-Martin (2003) and Naqvi
(2010). The results also support the Malthusian theorem, which states that population
growth leads to slowing economic growth of a country. These ndings are supported
by Coale and Edger (1958). It has also been found that urbanization plays a positive
and signicant role in economic development. Lucas (1988), Shumway and Otterstron
(2001) and Naqvi (2010) also suggest that urbanization has a positive impact
on economic growth. An increase in precipitation has a positive impact while
an increase in temperature will negatively affect economic growth. Hence, changes
in temperature and precipitation negatively affect the economic growth of the selectedcountries. In relative terms, changes in temperature are more harmful for growth
in comparison with precipitation. It may also be noted that the coefcients of
climate-related variables are highest in all the specications, revealing that climate
change is the major factor affecting GDP growth. The diagnostic test suggests the
non-existence of autocorrelation and signicance of the overall model.
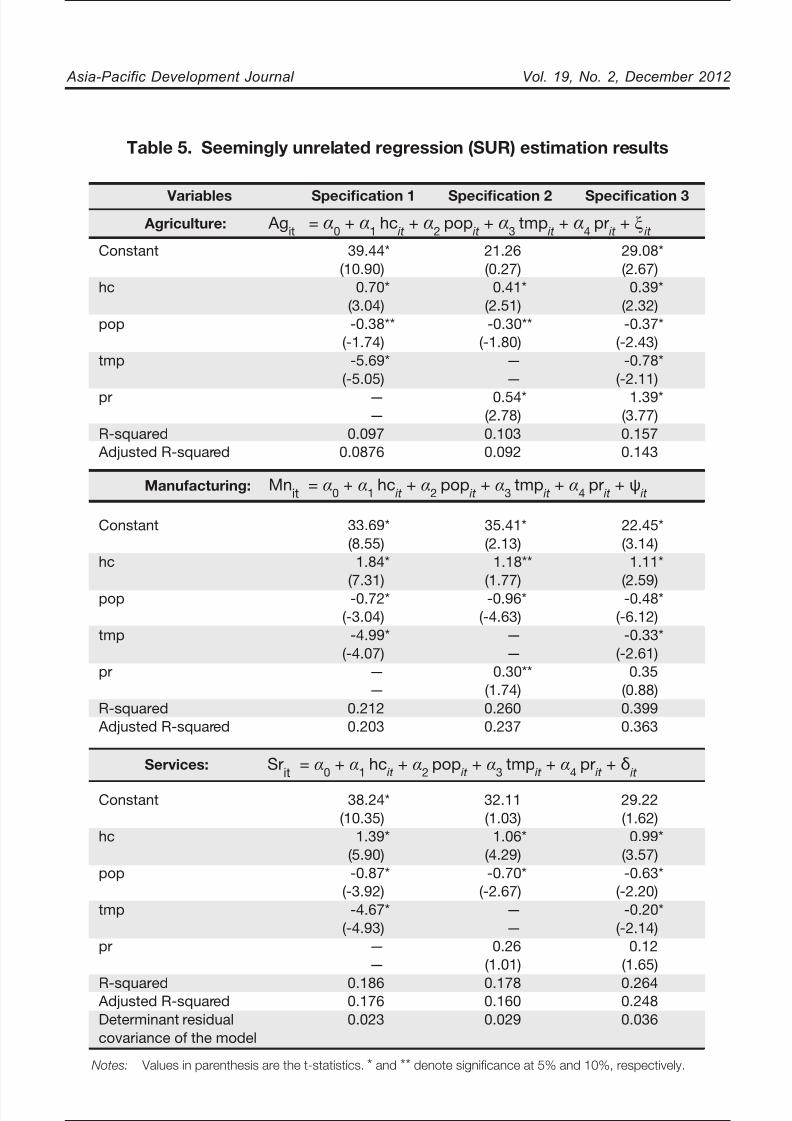
The results of estimating the empirical model (B) - the reduced model of
various sectors of economic growth - by using the seemingly unrelated regression(SUR) are summarized in table 5.
The results show that human capital has a positive relationship with all sectors
of GDP while the other variables, namely population growth, temperature and
precipitation, have a negative and signicant impact on all the sectors. They reveal that
impacts of various variables on different sectors are not evenly distributed. Human
capital stimulates manufacturing the most and agriculture the least. Similarly, in Asia,
population growth rate has the highest negative impact on the services sector and the
negative impacts of the population growth rate are limited to the agriculture sector.It sheds light on the issue that agriculture has a comparatively higher labour absorption
capacity. As far as climate-related effects are concerned, the agriculture sector is the
most adversely affected by a reduction in precipitation in comparison to a rise in
temperature. The severe impacts of climate change on agriculture are highlighted in
earlier studies on the subject including by Reilly (1999) and Mendelsohn and Dinar
(1999).
In the manufacturing and services sectors, precipitation has an insignicant
impact on economic growth. It was also found that both the manufacturing and services
sectors are negatively and signicantly affected by rising temperatures.
l anr uoJ t nem pol ev eDc i f i c aP -ai s A
1
Vol. 19, No. 2, December 2012
1/13
13
7/27/2019 chap-1-Akram.pdf
http://slidepdf.com/reader/full/chap-1-akrampdf 14/18
Table 5. Seemingly unrelated regression (SUR) estimation results
l anr uoJ t nem pol ev eDc i f i c aP -ai s A
1
Vol. 19, No. 2, December 2012
1/14
Variables
Constant
hc
pop
tmp
pr
R-squared Adjusted R-squared
Constant
hc
pop
tmp
pr
R-squared Adjusted R-squared
Constant
hc
pop
tmp
pr
R-squared Adjusted R-squaredDeterminant residualcovariance of the model
Specification 1
39.44*(10.90)
0.70*(3.04)-0.38**
(-1.74)-5.69*
(-5.05)
——
0.0970.0876
33.69*(8.55)1.84*
(7.31)-0.72*
(-3.04)-4.99*
(-4.07)——
0.2120.203
38.24*(10.35)
1.39*(5.90)-0.87*
(-3.92)-4.67*
(-4.93)——
0.1860.1760.023
Specification 2
21.26(0.27)0.41*
(2.51)-0.30**
(-1.80)——
0.54*(2.78)0.1030.092
35.41*(2.13)
1.18**(1.77)-0.96*
(-4.63)——
0.30**(1.74)0.2600.237
32.11(1.03)1.06*
(4.29)-0.70*
(-2.67)——
0.26(1.01)
0.1780.1600.029
Specification 3
29.08*(2.67)0.39*
(2.32)-0.37*
(-2.43)-0.78*
(-2.11)
1.39*(3.77)0.1570.143
22.45*(3.14)1.11*
(2.59)-0.48*
(-6.12)-0.33*
(-2.61)0.35
(0.88)0.3990.363
29.22(1.62)0.99*
(3.57)-0.63*
(-2.20)-0.20*
(-2.14)0.12
(1.65)
0.2640.2480.036
Agriculture: Agit
= α0
+ α1
hc it
+ α2
pop it
+ α3
tmp it
+ α4
pr it
+ ξ it
Mnit
= α0
+ α1
hc it
+ α2
pop it
+ α3
tmp it
+ α4
pr it
+ ψ it
Services: Srit
= α0
+ α1
hc it
+ α2
pop it
+ α3
tmp it
+ α4
pr it
+ δ it
Manufacturing:
Notes: Values in parenthesis are the t-statistics. * and ** denote significance at 5% and 10%, respectively.
14

7/27/2019 chap-1-Akram.pdf
http://slidepdf.com/reader/full/chap-1-akrampdf 15/18
VI. CONCLUSIONS AND POLICY IMPLICATIONS
The present study has carried out panel data research on the relationshipbetween changes in weather patterns (an indicator of climate change) and economic
growth for the Asian economies. The results show that temperature and precipitation
have negative and signicant relationships with GDP growth as well as with the
productivity in agriculture, manufacturing and services sectors. However, the severity
of these negative effects is higher in the agriculture sector as compared to the
manufacturing and services sectors. These results support the ndings of Parry and
others (2007) that an increase in temperature will negatively affect agriculture.
The study results assert that if climate change is not controlled, the economic
growth of these countries will be reduced considerably. Of note, however, Asian
countries alone can do very little with regard to controlling climate change as their
share of GHG emissions in comparison to developed countries is small. Hence, there
is a need for an international policy regarding the adoption of mitigation strategies to
control climate change. The United Nations Framework Convention on Climate
Change4 is an excellent attempt in this regard. The reduction in economic growth will
also result in increasing poverty. Although the poor contribute the least to causing
climate change, they are the most adversely affected by this phenomenon due to theirdependency on agriculture and their limited ability to pay for the resources necessary
to adopt the preventive measures and adaptation strategies. Therefore, control of
climate change is not only important for economic growth of Asian countries but it is
also crucial for poverty alleviation.
It is noteworthy to reiterate that there is a very large variation in climate and
geographic features among the Asian countries. Therefore, further analysis in the
contexts of the spatial variation in the Asia is needed. Single country analysis as well
as studies at the subnational levels should be conducted. In that direction, in thefuture, the study will be extended to explore the impacts of climate change on
economic activities in various provinces of Pakistan and on the various states of India.
l anr uoJ t nem pol ev eDc i f i c aP -ai s A
1
Vol. 19, No. 2, December 2012
1/15
4 United Nations, Treaty Series, vol. 1771, No. 30822.
15

7/27/2019 chap-1-Akram.pdf
http://slidepdf.com/reader/full/chap-1-akrampdf 16/18
l anr uoJ t nem pol ev eDc i f i c aP -ai s A
1
Vol. 19, No. 2, December 2012
REFERENCES
Adger, W. Neil (2006). Vulnerability. Global Environmental Change, vol. 16, No. 3, pp. 268-281.
Agrawala, S., and others (2003). Development and climate change in Bagladesh: focus on coastalooding and the sundarbans. Environment Directorate and Development Co-operationDirectorate. Paris: OECD. Available from www.oecd.org/env/climatechange/21055658.pdf.
Baltagi, B.H. (2005). Econometric Analysis of Panel Data, 3rd ed. West Sussex: John Wiley & Sons.
Barro, R., and X. Sala-i-Martin (2003). Economic Growth, 2nd edition. Cambridge: MIT Press.
Bhattacharya, S., and others (2006). Climate change and malaria in India. Current Science, vol. 90, No. 3,pp. 370-375.
Bretschger, L., and S. Smulders (2001). Explaining Environmental Kuznets Curves: how pollution
induces policy and new technologies. Revised version of Center Discussion Paper,No. 2000.95. Tilburg, Netherlands: Tilburg University.
Butkiewicz, J.L., and H. Yanikkaya (2005). The impact of sociopolitical instability on economic growth:analysis and implications. Journal of Policy Modeling, vol. 27, No. 5, pp. 629-645.
Calzadilla, A., F. Pauli, and R. Roson (2007). Climate change and extreme events: an assessment ofeconomic implications. International Journal of Ecological Economics and Statistics, vol. 7,No. 7, pp. 5-58.
Christensen, J.H., and others (2007). Regional climate projections. I n Climate Change 2007: The
Physical Science Basis. Contribution of Working Group I to the Fourth Assessment Report ofthe Intergovernmental Panel on Climate Change, S. Solomon, and others, eds. Cambridge:Cambridge University Press.
Cline, W.R. (1994). The costs and benets of greenhouse gas abatement. A guide to policy analysis. InThe Economics of Climate Change. Paris: OECD.
Coale, A.J., and M.H. Edgar (1958). Population Growth and Economic Development in Low Income
Countries. Princeton: Princeton University Press.
Cooper, R.N. (2000). International approaches to global climate change. The World Bank Research
Observer, vol. 15, No. 2, pp. 145-172.
Cruz, R.V., and others (2007). Asia climate change 2007: impacts, adaptation and vulnerability. InContribution of Working Group II to the Fourth Assessment Report of the Intergovernmental
Panel on Climate Change. Cambridge: Cambridge University Press.
Dell, M., B.F. Jones, and B.A. Olken (2008). Climate change and economic growth: evidence from thelast half century. Working Paper, No. 14132 . Cambridge, MA: National Bureau of EconomicResearch.
Easterly, W. (2001). The lost decades: developing countries’ stagnation in spite of policy reform1980-1998. Journal of Economic Growth, vol. 6, No. 2, pp. 135-157.
Epstein Y., E. Sohar, and Y. Shapiro (1995). Exceptional heatstroke: a preventable condition. Israel
Journal of Medical Science, vol. 31, No. 7, pp. 454-462.
Fankhauser, S., and R.S. Tol (2005). On climate change and economic growth. Resource and Energy Economics, vol. 27, No. 1, pp. 1–17.
Gilbreath, J. (2004). Climate change: global warming kills. Environmental Health Perspectives, vol. 112,No. 3, p. 160.
1/16
16

7/27/2019 chap-1-Akram.pdf
http://slidepdf.com/reader/full/chap-1-akrampdf 17/18
l anr uoJ t nem pol ev eDc i f i c aP -ai s A
1
Vol. 19, No. 2, December 2012
1/17
Gregory, P.J., J.S.I. Ingram, and M. Brklacich (2005). Climate change and food security, philosophicaltransactions. Biological Sciences, vol. 360, No. 1463, pp. 2139-2148.
Greiner, A. (2004). Anthropogenic climate change in a descriptive growth model. Environment and Development Economics, vol. 9, No. 5, pp. 645-662.
________ (2005). Anthropogenic climate change and abatement in a multi-region world with endogenousgrowth. Ecological Economics, vol. 55, No. 2, pp. 224-234.
Grossman, G.M., and A.B. Krueger (1995). Economic growth and environment. The Quarterly Journal
of Economics, vol. 110, No. 2, pp. 353-377.
Hitz, S., and J.B. Smith (2004). Estimating global impacts from climate change. Global Environmental
Change, vol. 14, No. 3, pp. 201-218.
Hope, C.W. (2006). The marginal impact of CO2 from PAGE2002: an integrated assessment model
incorporating the IPCC’s ve reasons for concern. Integrated Assessment Journal, vol. 6,No. 1, pp. 19-56.
Lecocq, F., and Z. Shalizi (2007). How might climate change affect economic growth in developingcountries? Policy Research Working Paper, No. 4315. Washington, D.C.: World Bank.
Lucas, B., and S. Valente (2011). Climate change and uneven development. The Scandinavian Journal
of Economics, vol. 113, No. 4, pp. 825-845.
Lucas, R.E., Jr. (1988). On the mechanics of economic development. Journal of Monetary Economics,
vol. 22, No. 1, pp. 3-42.
Mankiw, N.G., D. Romer, and D.N. Weil (1992). A contribution to the empirics of economic growth. The
Quarterly Journal of Economics, vol. 107, No. 2, pp. 407-437.Martens P., and others (1999). Climate change and future populations at risk of malaria. Global
Environmental Change, vol. 9, No. 1, pp. 89-107.
McMichael, A., and others (2004). Global climate change. In Comparative Quantification of Health
Risks: Global and Regional Burden of Disease due to Selected Major Risk Factors. Geneva:World Health Organization.
Mendelsohn, R., and A. Dinar (1999). Climate change, agriculture, and developing countries: doesadaptation matter? World Bank Research Observer, vol. 14, No. 2, pp. 277-293.
Mendelsohn, R., A. Dinar, and A. Sanghi (2001). The effect of development on the climate sensitivity of
agriculture. Environment and Development Economics, vol. 6, No. 1, pp. 85-101.Mendelsohn, R., and L. Williams (2004). Comparing forecasts of the global impacts of climate change.
Mitigation and Adaptation Strategies for Global Change, vol. 9, No.4 , pp. 315-333.
Naqvi, Syed Nawab Haider (2010). The Evolution of Development Policy: A Reinterpretation. Oxford:Oxford University Press.
Nicholls, R.J., and R.S.J. Tol (2006). Impacts and responses to sea level rise: a global analysis of theSRES scenarios over the twenty-rst century. Philosophical Transactions of the Royal Society,
vol. 364, No. 1849, pp. 1073-1095.
Nordhaus, W.D. (1991). To slow or not to slow: the economics of the greenhouse effect. Economic
Journal, vol. 101, No. 407, pp. 920-937.
O’Brien, K.L., L. Sygna, and J.E. Haugen (2004). Vulnerable or resilient? A multiscale assessment ofclimate impacts and vulnerability in Norway. Climatic Change, vol. 64, No. 1-2, pp. 193-225.
17

7/27/2019 chap-1-Akram.pdf
http://slidepdf.com/reader/full/chap-1-akrampdf 18/18
l anr uoJ t nem pol ev eDc i f i c aP -ai s A Vol. 19, No. 2, December 2012
Parry, M., and others, eds. (2007). Climate Change 2007: Impacts, Adaptation and Vulnerability. Contribution of Working Group II to the Fourth Assessment Report of the IntergovernmentalPanel on Climate Change. Cambridge: Cambridge University Press.
Reilly, J. (1999). What does climate change mean for agriculture in developing countries? A commenton Mendelsohn and Dinar. World Bank Research Observer, vol. 14, No. 2, pp. 295-305.
Ricci, F. (2007). Channels of transmission of environmental policy to economic growth: a survey of thetheory. Ecological Economics, vol. 60, No. 4, pp. 688-699.
Romer, P. (1986). Increasing returns and long-term growth. Journal of Political Economy, vol. 94, No. 5,pp. 1002-1037.
Sathaye, J., P.R. Shukla, and N.H. Ravindranath (2006). Climate change, sustainable development andIndia: global and national concerns. Current Science, vol. 90, No. 3, pp. 314-325.
Shumway, J., and S. Otterstron (2001). Spatial patterns of migration and income change in themountain west: the dominance of service-based, amenity-rich counties. Professional
Geographer, vol. 53, No. 4, pp. 492-502.
Smit, B., and J. Wandel (2006). Adaptation, adaptive capacity and vulnerability. Global Environmental
Change, vol. 16, No. 3, pp. 282-292.
Smulders, S., L. Bretschger, and H. Egli (2011). Economic growth and the diffusion of clean technologies:explaining Environmental Kuznets Curves. Environmental and Resource Economics, vol. 49,No. 1, pp. 79-99.
Stern, N., and others (2006). Stern Review: the Economics of Climate Change. London: HM Treasury.
Thornton, P.K., and others (2009). The impacts of climate change on livestock and livestock systems indeveloping countries: a review of what we know and what we need to know. Agricultural
Systems, vol. 101, No. 3, pp. 113-127.
Tol, R.S.J. (1995). The damage costs of climate change toward more comprehensive calculations.Environmental and Resource Economics, vol. 5, No. 4, pp. 353-374.
________ (2008). Why worry about climate change? A research agenda. Environmental Values, vol. 17,No. 4, pp. 437-470.
________ (2009). The economic effects of climate change. Journal of Economic Perspectives, vol. 23,No. 2, pp. 29-51.
Tol, R.S.J., and S. Wagner (2010). Climate change and violent conict in europe over the last millennium.Climatic Change, vol. 99, No. 1-2, pp. 65-79.
Weitzman, M. (2007). A review of the Stern Review on the Economics of Climate Change. Journal of
Economic Literature, vol. XLV, pp. 703-724.
Wooldridge, J.M. (2002). Econometric Analysis of Cross Section and Panel Data. London: MIT Press.
________ (2005). Introductory Econometrics: A Modern Approach, 3rd edition. Boston: South-WesternCollege Publishing.
World Bank (2010). World Development Report 2010. Washington, D.C.
Yohe, G.W., and M.E. Schlesinger (2002). The economic geography of the impacts of climate change. Journal of Economic Geography, vol. 2, No. 3, pp. 311-341.
Zhang, D., and others (2007). Climate change and war frequency in Eastern China over the lastmillennium. Human Ecology, vol. 35, No. 4, pp. 403-414.