chap5 - university of south africauir.unisa.ac.za/bitstream/handle/10500/2271/05chapter5.pdf · 142...
TRANSCRIPT

140
CHAPTER 5: Q METHODOLOGY
5.1 INTRODUCTION
This chapter discusses the theoretical foundation of Q methodology and its five parts. It
also highlights its benefits and limitations. Q factor analysis is explained as a procedure
for statistical data analysis.
Q methodology is a research methodology that permits the systematic study of subjectivity
and the communicability of subjective perceptions in a discourse on a specific topic. It
adopts the participant’s point of view and understanding as being central to its investigative
procedures (Goldman 1999:589).
Q methodology was invented by the British physicist/psychologist William Stephenson in
1935, and introduced by him in a letter to the editor of the British scientific journal, Nature
on 24 August 1935. Stephenson was the last assistant to Charles Spearman, a statistical
theorist who first developed factor analysis (Brown 1980a:9). Stephenson was interested
in a way to reveal the subjectivity involved in any situation, for instance, in aesthetic
judgment, poetic interpretation and perceptions of organisational role. (Brown 1996). What
makes Q methodology unique is that all perceptions, concepts, reports of events, music,
literature, etc, can be transformed into operant factors which Q methodology develops. In
other words, definitions of viewpoints are those of the participant’s own subjective
standpoint rather than intuitive or arbitrary (McKeown & Thomas 1988:40).
The following three questions underlie a Q study (Stricklin & Almeida 1999):
• What is the range of communicated ideas in a particular discourse?
• What are the prevalent variations in it?
• How do these variations logically relate to each other?
5.2 Q METHODOLOGY DEFINITIONS

141
Table 5.1 below provides a list of Q methodology definitions.
Table 5.1: Q methodology definitions
Terminology in Q methodology Q methodology definition
Concourse This involves ordinary conversation,
commentary and discourse about everyday
life not restricted to words, but including
collections of paintings, pieces of art,
photographs and even musical selections.
Q sorting This is the process of sorting selected
statements about the concourse in the
participant’s preferred order of preference.
Q sort cards Statements that need to be arranged by
participants are printed individually on Q sort
cards that resemble playing cards. Similar to
well-written survey items, there should only
be one individual statement per Q sort card
written in language familiar to the
participants.
Q sort deck This is the total set of Q sort cards which can
vary between 30 and 100, but is typically
between 50 and 70.
Q sort diagram An enlarged diagram (or board) on which the
statements are arranged in the participant’s
preferred order of preference. Figure 5.1 is
an example of a Q sort diagram.
Rating scale The rating scale according to which
statements are arranged may range from +3
to -3, or +4 or -4, or +5 to -5, depending on

142
the number of statements in the study.
Distribution marker The distribution marker is the +3, +4, etc of
the rating scale.
Q sample This entails the process of selecting or
excluding statements following a scientific
procedure since the whole concourse cannot
be administered because it may consist of
hundreds of statements.
Person-sample This is a group of participants selected from
the people involved in the discourse to sort
selected statements about the concourse in
the participant’s preferred order of
preference.
Score sheet A small version of the Q sort diagram on
which the number of the placement of each
Q sort card of each participant is recorded
for factor analysis.
5.3 THE FIVE PHASES OF A Q STUDY
A Q study generally follows a sequence of five phases. The researcher first collects a
discourse from people involved in it and then selects a sample of statements
representative of the range of communicated ideas in the discourse. Participants are
selected from the people involved in the discourse and asked to sort statements in their
preferred order of importance on a large board, known as the Q sorting process. The
Q sorting process usually occurs in the presence of the researcher. The participants’
sortings of statements are then compared by means of Q factor analysis. Finally, the
results are analysed to establish trends in the discourse (Stricklin & Almeida 1999).
These five phases are explained as follows:
143
5.3.1 Collecting the concourse
In Q methodology the discourse about a specific topic is referred to as a “concourse”81.
A concourse is ordinary conversation, commentary and discourse about everyday life
and includes all communication about a specific topic (Brown 1991). A concourse is not
restricted to words, but might include collections of paintings, pieces of art, photographs
and even musical selections (Denzine 1998; McKeown, Hinks, Stowell-Smith, Mercer &
Forster 1999:255). A concourse may be obtained from both primary and/or secondary
sources. Primary sources include interviews, group discussions and talk shows.
Secondary sources include photographs, newspaper clippings, literature and editorials
(Denzine 1998; McKeown et al 1999:255).
The primary and/or secondary sources from which the concourse can be obtained,
can be further elucidated by means of Q sample types. Q sample types can be divided
into two major types, namely naturalistic and ready-made Q samples.
Naturalistic Q samples are compiled by obtaining written or oral statements on the topic
by the participants who will be involved in the Q sort. This type of sample is beneficial
in that the participant is able to Q sort the Q sort cards much faster and also
understands the statements better. Ready-made Q samples are compiled from sources
other than communication of the participants, for instance, literature or radio shows. In
other words, several subtypes exist, namely quasi-naturalistic Q samples, Q samples
drawn from conventional rating scales, standardised Q sorts and a “hybrid” category
(McKeown & Thomas 1988: 26-27).
Quasi-naturalistic Q samples are similar to those obtained from interviews, but are
developed from sources external to the study, for instance, taking statements from an
interview with an expert on a topic without the expert being included in the study.
81
from the Latin concursus meaning a running together.
144
In some Q studies, statements are borrowed from attitude and attribute scales which
are incorporated into Q samples to establish whether personal meanings held by
participants correspond with the meanings the items are designed to measure.
The use of conventional scales does not impede the discovery of meanings different
from those “built” into the scale.
Statements from naturalistic and ready-made Q samples can be combined to form
hybrid-type Q samples. For instance, in a Q study statements can comprise both
interviews with participants as well as statements from newspaper articles.
McKeown and Thomas (1988:26-27) refer to several standardised Q samples that are
also available, for instance Block’s (1961) adjective Q-set for nonprofessional sorters
(personality assessment) and the Butler-Haigh (1954) Q sample for psychotherapeutic
counselling.
5.3.2 Selecting a sample representative of the range of communicated ideas
in the discourse
It is impossible to administer an entire concourse, which might consist of several
hundreds of statements containing opinions and not facts (Brown 1980a:55). Once
statements about a concourse have been selected, they should be presented in
“miniature”. The researcher thus faces the challenge of compiling statements which are
more or less representative of the concourse (Brown 1980a:187).
Stephenson (1953:63) reiterates the above arguments. He argues that since a
concourse is composed of statements, art objects, descriptions of behaviour or
personality traits it is “impossible to define population universes for them”. To illustrate
his point he refers to a study in which a sample of 60 coloured photographs of vases
were used. No single one was alike. These pictures of vases would never be a
representative sample, but what was achieved was certain “homogeneity” with respect
to the vases - that is, anyone would tend to regard them as of one class. A definite
“heterogeneity” was also achieved because all the vases were different (Stephenson
1953:65).
145
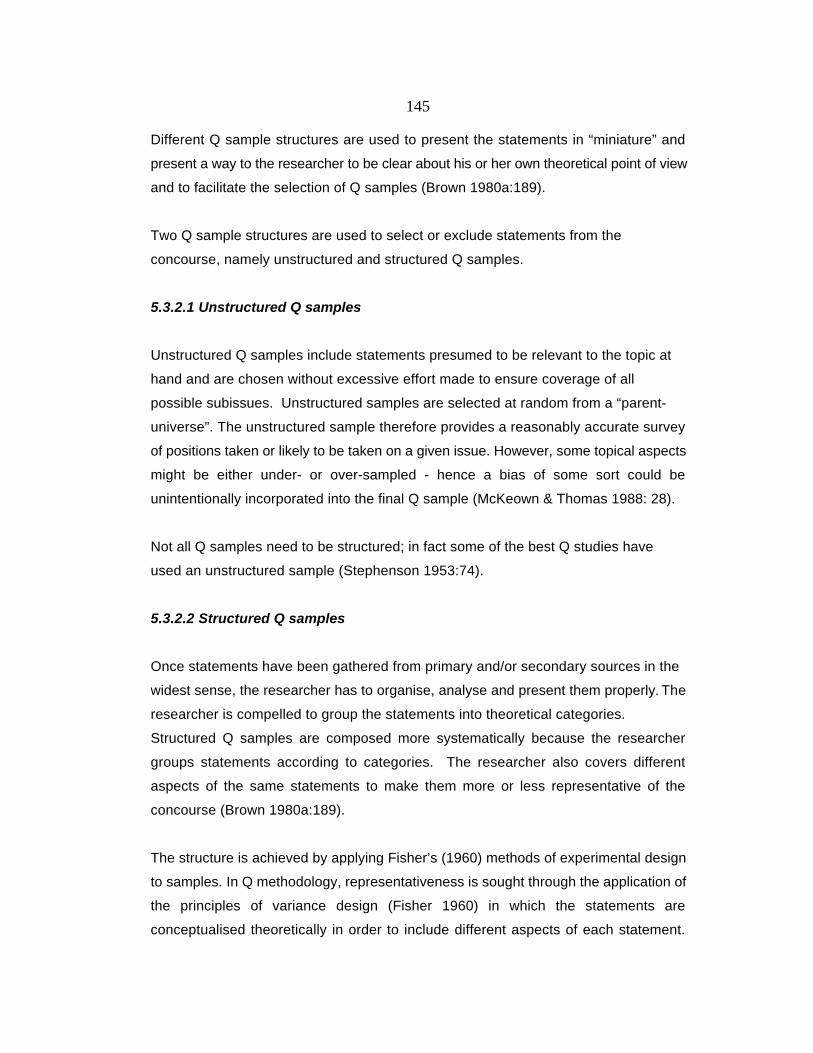
Different Q sample structures are used to present the statements in “miniature” and
present a way to the researcher to be clear about his or her own theoretical point of view
and to facilitate the selection of Q samples (Brown 1980a:189).
Two Q sample structures are used to select or exclude statements from the
concourse, namely unstructured and structured Q samples.
5.3.2.1 Unstructured Q samples
Unstructured Q samples include statements presumed to be relevant to the topic at
hand and are chosen without excessive effort made to ensure coverage of all
possible subissues. Unstructured samples are selected at random from a “parent-
universe”. The unstructured sample therefore provides a reasonably accurate survey
of positions taken or likely to be taken on a given issue. However, some topical aspects
might be either under- or over-sampled - hence a bias of some sort could be
unintentionally incorporated into the final Q sample (McKeown & Thomas 1988: 28).
Not all Q samples need to be structured; in fact some of the best Q studies have
used an unstructured sample (Stephenson 1953:74).
5.3.2.2 Structured Q samples
Once statements have been gathered from primary and/or secondary sources in the
widest sense, the researcher has to organise, analyse and present them properly. The
researcher is compelled to group the statements into theoretical categories.
Structured Q samples are composed more systematically because the researcher
groups statements according to categories. The researcher also covers different
aspects of the same statements to make them more or less representative of the
concourse (Brown 1980a:189).
The structure is achieved by applying Fisher’s (1960) methods of experimental design
to samples. In Q methodology, representativeness is sought through the application of
the principles of variance design (Fisher 1960) in which the statements are
conceptualised theoretically in order to include different aspects of each statement.

146
Structuring Q samples provides a focus and places boundaries on the topic in which the
researcher is interested. The factorial structure is not necessarily a hypothesis for
testing although it can be used as such. In most cases it merely provides a possible
explanation of the resulting factors (Brown 1980a:38).
Where research is extended to include the testing of more than one independent
variable, it is referred to as a factorial design and the independent variables are called
factors. Individual factors may have more than one level or variation. Where two
independent variables are researched, this is referred to as a two-factor design, or with
three independent variables, to a three-factor design, etc. A factorial design can be
described in the following way (Du Plooy 1997:182):
A 2 X 14 X 6 factorial design comprises three factors (the numbers 2, 14 and 6 each
comprises a single factor). The first factor has two levels, the second 14, and the third
factor six. Factorial designs are most commonly used in experimental designs.
In an experimental design model, certain factors are defined with a number of levels
respectively without any replication. However, in Q methodology, the levels are
replicated. Fisher (1960) refers to this as a balanced block design. Levels refer to
elaboration of the factors. In a balanced block design statements are drawn from the
factors in equal numbers and provide a number of groupings (combinations) for each
level. A set of statements cover each of the groupings to make it more or less
representative of the concourse. Not only are the factors “explained”, but all possible
groupings of their levels are also elucidated (Stephenson 1953: 41). Statements are
assigned to each grouping based on the author’s definition of each factor (McKeown &
Thomas 1988: 29).
An experimental design procedure such as that of Fisher provides a reasonable way for
selecting a Q sample theoretically. It also releases the researcher from sampling a large
number of statements, and alternatives to large numbers become available. A structured
Q sample can be a kind of “thought maze” for the participant, in the sense that he or she
has an attitude about each Q sort and rejects or ignores some statements while being

147
positive about others. It also affords the researcher the opportunity to “state his or her
theoretical position explicitly”. In addition, it provides a formula for composing or
replicating a sample of statements that is comprehensive (Brown 1980a:38).
A structured Q sample enables the researcher to focus a Q sample around conclusions
drawn earlier by him or her or somebody else. The method of reasoning can be either
deductive, inductive or both (Brown 1996). In Q methodology, a deductive factorial
design comprises categories and levels that are specified at the outset according to
theory that has been clarified at the beginning. A structured Q sample most commonly
constitutes a deductive factorial design (Stephenson 1953:73).
Inductive factorial designs are unknown at the outset and formulated as statements are
collected. The dimensions that guided the selection of statements were suggested “by
the statements themselves” and were not obvious prior to statement collection
(McKeown & Thomas 1988:28, 30).
Table 5.2 below illustrates a structured Q sample in Q methodology.
Table 5:2: An explanatory table of a structured Q sample in Q methodology
Factors Levels No of levels
X, “Attitudes” (a) Introversion
(b) Extroversion
2
Y, “Mechanism” (c) Conscious 2
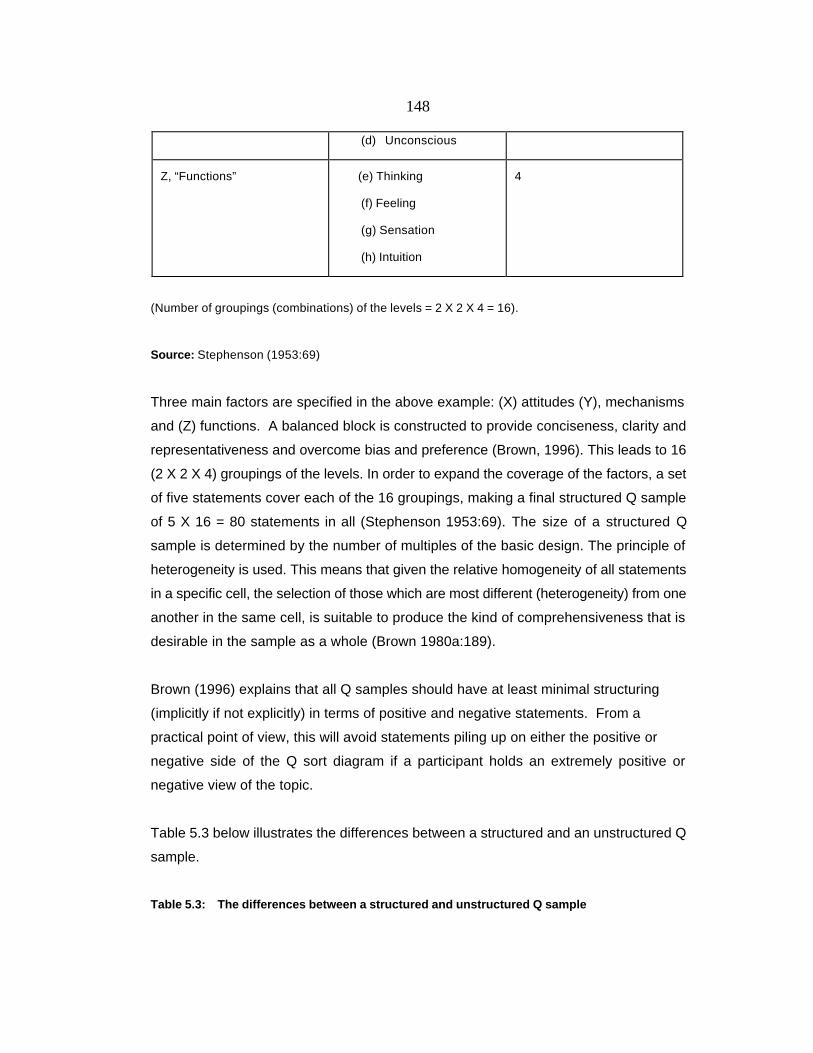
148
(d) Unconscious
Z, “Functions” (e) Thinking
(f) Feeling
(g) Sensation
(h) Intuition
4
(Number of groupings (combinations) of the levels = 2 X 2 X 4 = 16).
Source: Stephenson (1953:69)
Three main factors are specified in the above example: (X) attitudes (Y), mechanisms
and (Z) functions. A balanced block is constructed to provide conciseness, clarity and
representativeness and overcome bias and preference (Brown, 1996). This leads to 16
(2 X 2 X 4) groupings of the levels. In order to expand the coverage of the factors, a set
of five statements cover each of the 16 groupings, making a final structured Q sample
of 5 X 16 = 80 statements in all (Stephenson 1953:69). The size of a structured Q
sample is determined by the number of multiples of the basic design. The principle of
heterogeneity is used. This means that given the relative homogeneity of all statements
in a specific cell, the selection of those which are most different (heterogeneity) from one
another in the same cell, is suitable to produce the kind of comprehensiveness that is
desirable in the sample as a whole (Brown 1980a:189).
Brown (1996) explains that all Q samples should have at least minimal structuring
(implicitly if not explicitly) in terms of positive and negative statements. From a
practical point of view, this will avoid statements piling up on either the positive or
negative side of the Q sort diagram if a participant holds an extremely positive or
negative view of the topic.
Table 5.3 below illustrates the differences between a structured and an unstructured Q
sample.
Table 5.3: The differences between a structured and unstructured Q sample

149
Structured Q sample Unstructured Q sample
Statements are selected purposefullyaccording to categories.
Statements are selected at random from a
“parent-universe” presumed to be relevant to
the topic at hand.
The structure is achieved by applying Fisher’s
(1960) methods of experimental design to
samples .
Statements are selected without an excessive
effort to ensure coverage of all possible
subissues.
It provides conciseness, clarity and
representativeness of the concourse andovercomes bias and preference.
A bias of some sort could be incorporatedunintentionally into the final Q sample.
Subjective points of view are communicableand always advanced from a position of self-reference.
Subjective points of view can becompromised with an external frame ofreference provided by the researcher.
Sources: McKeown & Thomas (1988:7; 37) & Brown (1996)
5.3.2.3 Number of statements for a Q study
Opinions on the number of statements for a Q study still vary among theorists. Kerlinger
(1986) in Denzine (1998), for instance, suggests that the Q sort deck should comprise
at least 60 Q sort cards for the statements to have statistical stability and reliability.
McKeown et al (1999:254) state that the Q sort deck can vary between 30 and 100 Q
sort cards, but is typically between 50 and 70 (McKeown et al 1999:254). Schlinger
(1969:54) argues that the number of statements should not overwhelm the respondents.
She considers 55 to 75 statements as ideal.
A large number of successful studies have been completed with statements numbering
between 49 and 70 statements (for instance, studies by Popovich, Masse & Pitts 2003;
Lipgar 2003). In this study the researcher considers a Q sort deck from 49 to 70 as ideal
in order not to make the Q sorting process too time-consuming.
5.3.2.4 Preparation of the statements for the Q sorting process

150
Once the Q sample has been finalised, the statements need to be prepared for the Q
sorting process. Donner (2001:27) suggests that no list of statements is perfect or has
to be perfect. Of real interest are “the tacit, underlying criteria and perceptions people
use to consider an issue”. However, statements need to be sufficiently broad and clear
to generate these criteria and perceptions and provide the researcher with insights into
them.
Similar to well-written survey items, there should be only one individual
statement per Q sort card written in language familiar to the participants. Each
statement is printed on a separate card to form a valid and reliable Q sort deck
(Denzine 1998). Statements should be pretested on a few participants to ensure clarity
and general comparability. The following are also suggested (Donner 2001:27):
• All statements need to be written in the same style.
• Extreme statements should be avoided.
• Statements need to be “plausible competitors” with one another.
• Double negatives should be avoided.
5.3.3 Selecting participants from people involved in the discourse and asking
them to arrange the sample of ideas in their preferred order of
importance
The third phase involves selecting participants from the people involved in the discourse
and asking them to arrange the sample of ideas in their preferred order of importance.
In Q methodology, participants are selected from people involved in the discourse. This
group of participants is referred to as the person-sample. The person-sample, unlike the
structured Q sample, does not need to be representative of the population. Participants
in Q methodology are sampled theoretically as they are in qualitative research using
nonprobability sampling. When sampled theoretically, participants are purposively
selected with the expectation “that they will hold different points of view on the topic
being studied (Dennis 1986:10). Large numbers, which are so fundamental in social
research, are rendered relatively unimportant in Q methodology because the emphasis

151
is on the nature of the segments of subjectivity that exist and the extent to which they
are similar and dissimilar (Brown 1991).
Enough participants are required to establish the existence of a factor for the purposes
of comparing one factor with another. The results of a Q study are not generalised to
the population, but to a specific factor type - that is a generalisation of a particular
perspective (Brown 1980a:192). Generalisations are valid for other persons of the same
perspective, for instance, for those persons whose views would lead them to load highly
on a factor (Brown 1980a:67). Since factors are “qualitative categories of thought“,
additional participants would have virtually no impact on the factor scores” (Brown
1991).
According to Brown (2004), the strategy for selecting participants should be to obtain
as much diversity as possible on variables such as gender and age. However, the
proportion of the population that belongs in one factor rather than another is not
important in Q methodology. The focus is upon the views that the factors represent
“rather than the group memberships” of the persons comprising the factors. Even
though as much diversity as possible should be included in the person sample, it is not
necessary for the sample to be statistically representative of a specific category, such
as gender or race. The likelihood that all factors at issue will have an opportunity to
show themselves should rather be enhanced (Brown 1999).
Q methodology requires factors to be well defined, for instance, on which four or five
participants are substantially loaded. Usually no more than seven factors and often
fewer emerge from the data in most Q studies – hence the need for a relatively small
number of participants (Brown 2003a; Dennis 1986:11). However, Brown (2003a) states
that because the researcher does not know in advance how many factors there are
going to be, he or she tends to “oversample”. The more factors that eventually turn up,
the larger the number of participants that will be required to provide good factor
definition. However, he emphasises that even though the exact number of participants
required cannot be specified in advance, this does not mean that the figure is arbitrary.
In addition, Brown (2003a) states that whether or not a small number of participants is
152
adequate also depends on the “factorial diversity” of the wider population (which is not
known in advance) as well as on the diversity of the person- sample. Brown (2003a),
however, emphasises that a very large person-sample is “counter-productive” because
“large numbers of Q sorts can smother operant factors that cannot get out from under
the pile”.
Q methodology uses nonprobability sampling techniques to select participants, but
because it typically employs a small number of participants, it also uses either an
intensive or an extensive person-sample, which is based on the condition of instruction
to participants.
The use of an intensive or extensive person-sample depends upon the nature and
purpose of the study (McKeown & Thomas 1988:37).
5.3.3.1 Intensive person-sample
An intensive person-sample requires participants to sort the Q sort cards under many
conditions of instruction. A condition of instruction is a guide to a participant for sorting
the Q sort cards from his or her own point of view. In an intensive person-sample, a
small number of participants, one to about 30 persons, can sort the Q sort cards under
many conditions of instruction. If only one person participates in the study, it is referred
to as a single case study. In a single case study, one participant sorts statements about
a specific topic under different conditions of instruction at different times (Brown 1991).
For instance, a student could be asked for his or her views on an aspect of tuition under
different conditions of instruction at different times to determine whether his or her
subjective perception has changed or remained static over time.
5.3.3.2 Extensive person-sample
In an extensive person-sample many participants sort the Q sort cards under an
identical condition of instruction. Enough participants are required to establish the
existence of a Q factor for the purposes of comparing one factor with another. Brown
(1980b) suggests that 40 to 60 participants are usually adequate, but that, in some
instances, even fewer may be adequate.

153
Table 5.4 below illustrates the differences between an intensive and an extensive
person-sample.
Table 5.4: The differences between an intensive and extensive person-sample
Intensive person-sample Extensive person-sample
Participant(s) are given many conditions of
instructions.
Participants are given only one condition of
instruction.
A small number of participants or even onlyone person can be examined in depth.
Typically uses 40 to 60 participants but fewerin some instances.
Source: McKeown & Thomas (1988:37)
5.3.3.3 Selection of the response format
Once the person-sample has been selected, the researcher must select a response
format. A response format refers to the names chosen for the ranking dimensions. The
ranking dimensions refer to the participant’s viewpoint according to which statements are
sorted, for instance, how agreeable or acceptable statements are. If the researcher
selects “agreement” as the subjective area of interest, participants would be asked to
rank statements using a continuum of “most disagree” and “most agree” (Denzine 1998).
This is important because participants’ negative feelings can be as strong as their
positive ones. Participants are asked to sort the Q sort cards according to those
statements with which they most agree, to those with which they most disagree. The
rating scale may range from +3 to -3, or +4 or -4, or +5 to -5, depending on the number
of statements in the study (Dennis 1986:11).
5.3.3.4 The Q sorting process
Q sorting is the “technical means whereby data are obtained for factoring” (Brown
1980a:17) and is the qualitative data collection technique in Q methodology (Denzine
154
1998). Q sorting requires the participant to sort statements about a topic along a
specific dimension such as “how relevant”, “how interesting”, or “how pleasing” the
statements are, generally in the presence of the researcher (Schlinger 1969:53).
Prior to sorting the cards, participants are given their condition of instruction for the
placement of the cards (Dennis 1986:12). A condition of instruction is a guide to a
participant for sorting the Q sort cards from his or her own point of view (McKeown &
Thomas 1988:30). The researcher needs to decide whether to use a “forced-choice” or
“free-sort” condition of instruction.
a Forced-choice condition of instruction
When given a forced-choice condition of instruction, the participant needs to place the
Q sort cards on a preset enlarged Q sort diagram with a space for each card. He or she
is forced to place each card on the Q sort diagram in terms of, for instance, agreement
and disagreement. The participant could be asked to sort the statements according to
those with which he or she most agrees to those with which he or she most disagrees.
In the case of the forced-choice condition of instruction, the participant is instructed to
commence with the sorting process by initially dividing the statements into a specific
number of piles, for instance three. When three piles are used, those
statements experienced as agreeable are placed in one pile to the right, those as
disagreeable in a second pile to the left and the remainder in a third pile in the
middle. The researcher can also instruct the participant to place a specific number of
statements into each of the three piles.
The rating scale is spread across the top of a flat area such as a desk, and may
range from +3 to -3, or +4 or -4, or +5 to -5, depending on the number of statements.
The distribution is symmetrical about the middle, but usually flatter than a normal
statistical distribution.

155
The participant now follows the procedure outlined below (McKeown & Thomas 1988:31-
33):
He or she spreads the statements under the distribution markers, while maintaining the
general left-centre-right relationships. This facilitates the reading of the statements
contextually and the making of comparisons.
Studying the statements to the right, and in accordance with the distribution, the
participant selects the number of statements called for, for instance, any four
statements with which he or she most agrees, and places them vertically, under the
+5 marker. The order of the statements under the markers is not important because all
four statements beneath the +5 marker will receive the same score when the data are
recorded. Turning now to the left side, the participant studies the statements and
selects four from among those on the left with which he or she most disagrees. These
are placed under the -5 marker. Again, the specific order does not matter.
Returning to the right side, the participant now picks four statements with which he or
she agrees but not as much as the four already selected (located under +5) and
places them under the +4 marker. On second thought, the participant might decide
that a statement selected for +4 is more important than one under +5. He or she is
perfectly free to replace it with another at this or any other time.
Attention reverts to the left side and the process is repeated, with the participant
working toward the middle 0 position, until all of the Q sort statements have been
positioned from left to right. Statements placed under the middle marker (0) are often
the ones left over after all of the positive and negative positions have been filled.
156
The reason for having participants work back and forth is to help them reflect again
on the significance of each statement in relation to the others. Once completed,
the Q sorts should be reviewed, and the participant can make adjustments among
statements, which upon rearrangement, more accurately portray his or her personal
point of view.
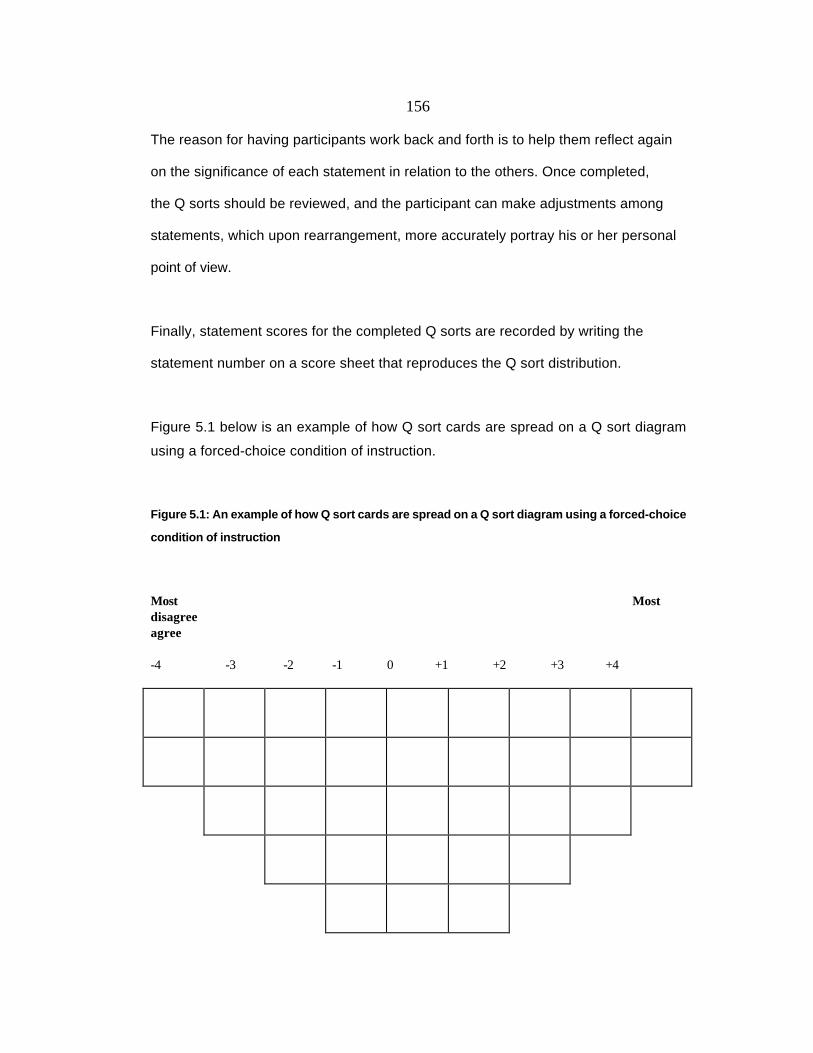
Finally, statement scores for the completed Q sorts are recorded by writing the
statement number on a score sheet that reproduces the Q sort distribution.
Figure 5.1 below is an example of how Q sort cards are spread on a Q sort diagram
using a forced-choice condition of instruction.
Figure 5.1: An example of how Q sort cards are spread on a Q sort diagram using a forced-choice
condition of instruction
Most Mostdisagree agree -4 -3 -2 -1 0 +1 +2 +3 +4
157
When using a forced-choice condition of instruction, researchers “force” participants in
the following ways (Denzine 1998):
• Participants may only use a certain number of piles (heaps of Q sort cards) for
the Q sorting task. In the above example in figure 5.1, nine piles are used, for
instance, from -4 to +4.
• In placing a specific number of statements in each pile, for instance, in the above
example in figure 5.1, participants can only place two cards under the +4 pile
and three under the +3 pile, etc.
• Participants may also be asked to first put the statements into piles. For
instance, participants could be asked to first sort 60 statements into three piles
with each pile containing a specific number of statements. Once this process has
been completed, participants will be instructed to rank-order the statements
within each of the three piles before placing them on the Q sort diagram. This
provides some structure in the task because some participants may experience
the task of simultaneously ranking 60 statements as overwhelming.
b Free-sort condition of instruction
Participants are in no way restricted when given a free-sort condition of instruction.
They are free to place the Q sort cards in as many piles needed for the specific
research problem. They may also place as many or as few Q sort cards under the
distribution markers as they desire. Researchers do not determine in advance the
number of piles to be used for the Q card sorting. The participant could be asked to
sort the statements, according to those with which he or she most agrees to those with
which he or she most disagrees, in any place under the distribution markers.
In the free-sort condition of instruction, participants are asked to read through the
statements first to familiarise themselves with them. They are then allowed to determine
the number of piles to be used for the Q sorting. Once they have decided on the
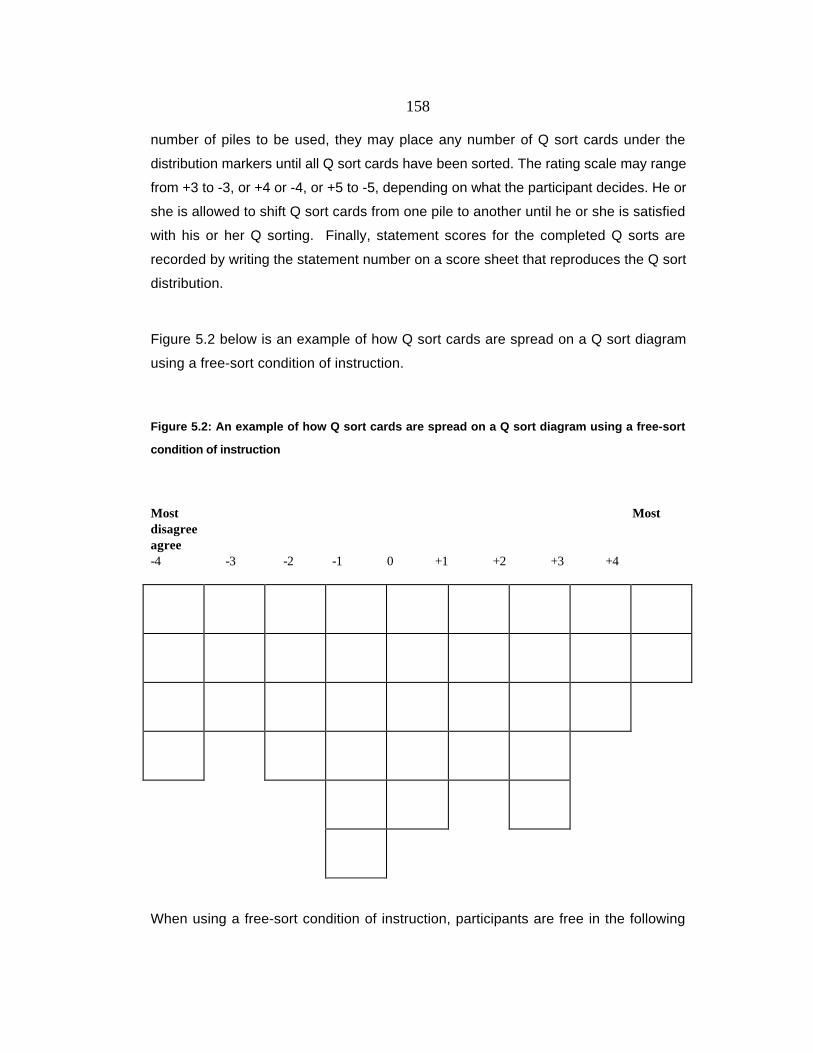
158
number of piles to be used, they may place any number of Q sort cards under the
distribution markers until all Q sort cards have been sorted. The rating scale may range
from +3 to -3, or +4 or -4, or +5 to -5, depending on what the participant decides. He or
she is allowed to shift Q sort cards from one pile to another until he or she is satisfied
with his or her Q sorting. Finally, statement scores for the completed Q sorts are
recorded by writing the statement number on a score sheet that reproduces the Q sort
distribution.
Figure 5.2 below is an example of how Q sort cards are spread on a Q sort diagram
using a free-sort condition of instruction.
Figure 5.2: An example of how Q sort cards are spread on a Q sort diagram using a free-sort
condition of instruction
Most Mostdisagree agree-4 -3 -2 -1 0 +1 +2 +3 +4
When using a free-sort condition of instruction, participants are free in the following

159
ways (Hess & Hink 1959: 84):
• They may use any number of piles for the Q sorting task.
• They may place as many or as few Q sort cards in each pile as they desire. In
the above example in figure 5.2, the specific number of Q sort cards differs in
each pile according to the participant’s decision.
• Participants may sort the Q sort cards in any way they like.
Table 5.5 below reflects the differences between a forced-choice and a free-sort
condition of instruction.
Table 5.5: The differences between a forced-choice and free-sort condition of instruction
Forced-choice condition of instruction Free-sort condition of instruction
The researcher determines in advance the
number of piles to be used for the Q card
sorting.
Participants are allowed to determine how
many piles or categories are needed for the
specific research problem.
Statement sortings are more stable and
discriminating.
Statement sortings are less stable and
discriminating.
Participants become frustrated because theyare forced to place the Q sort cards onspecific places under the distributionmarkers.
Participants’ frustration is lowered becausethey are free to place the Q sort cards at anyplace under the distribution markers.
A participant is compelled to pay closeattention to the statements or items since heor she has to make decisions on theirplacement.
A participant does not pay as close attentionto the statements since he or she can placethem anywhere under the distributionmarkers.

160
This method helps researchers to decreaseresponses by participants.
This method may increase the number ofresponses by participants.
Sources: Block (1955 :487); Denzine (1998); Hess & Hink (1959:83); McKeown (1997)
5.3.4 Formal comparison of the arrangements by participants by means of
factor analysis
The fourth phase in a Q study is to formally compare the arrangements of the
statements by participants by means of factor analysis. In this section, factor analysis
is briefly discussed as well as the way in which it is applied in Q methodology.
5.3.4.1 Factor analysis
Kline (1994:1) explains that factor analysis is a statistical technique widely used in
psychology and the social sciences to simplify complicated data in an orderly way. The
central aim of factor analysis is the “orderly simplification” of a number of interrelated
issues to make sense out of the apparent chaos of the environment (Child 1970:2). In
other words, it is used to uncover the latent structure of a set of variables. It reduces
attribute space from a larger number of variables to a smaller number of factors. When
a group of variables has for some reason, a great deal in common, a factor exists.
According to Kline (1994:5), “a factor is a dimension or construct which is a condensed
statement of the relationships between a set of variables”. Kline (1994:5) also refers to
Royce (1963) who states that a factor is a “construct operationally defined by its factor
loadings”. Factor loadings are the correlations of a variable with a factor or what is
computed in the factor analysis (Kline 1994:5). The technique of correlation is used to
discover these related variables (Child 1970:2).
In the application of factor analysis a distinction needs to be drawn between exploratory
and confirmatory factory analysis.

161
a Exploratory factor analysis
Exploratory factor analysis is the most common form of factor analysis. Its aim is to
uncover the underlying structure of a relatively large set of variables. The researcher
assumes that any indicator variable may be associated with any factor. There is no prior
theory to discern the factor structure of the data (Kline 1994:9).
b Confirmatory factor analysis
According to Kline (1994:10), the aim of confirmatory factor analysis, which was
developed by Joreskog (1973), is to determine if the number of factors and the loadings
of measured variables on them conform to what is expected on the basis of the pre-
established theory. It is used to test hypotheses. The researcher assumes that each
factor is associated with a specified subset of indicator variables. Indicator variables are
selected on the basis of prior theory. Factor analysis is used to establish if they load
as predicted on the expected number of factors (Kline 1994:10).
5.3.4.2 Q factor analysis
In Q factor analysis, the correlations between persons as opposed to variables are
factored. It determines which sets of people cluster together. Q factors load on
individuals rather than on tests. Q factor analysis is sometimes referred to as “inverse
factor analysis” because the normal data matrix is turned on its side (Kline 1994:78). Q
factor analysis rather reflects “functional relatedness” and is more “gestaltist” and
“holistic (Brown 1980a:208).

162
Factor analysis applies to Q methodology in the following way:
a Extraction of factors
Factors are extracted to obtain only the common factors or factors that are of any
interest. Factors which have eigenvalues of more than 1,00 are extracted. Those with
less than this amount are regarded as insignificant and generally of too little interest to
warrant further investigation (Brown 1980a:40). Eigenvalues are the sum of squared
factor loadings for each factor. The percentage of total variance accounted for by each
factor is equal to the eigenvalue divided by the number of variates in the matrix. In Q
methodology, the variates are the number of persons whose responses have been
factored (Brown 1980a:40). Kline (1994:30) explains that the larger the eigenvalue, the
more variance82 is explained by the factor. Although software for Q methodology typically
extracts seven to eight factors to ensure enough variance in the factor, as a rule only
three to four factors have any value.
Q methodology uses centroid factor analysis to extract factors, which is a way of defining
“centers of gravity embedded in a correlation matrix”. A centroid refers to a kind of grand
average of the relationships between all the sorts, because they are represented by their
correlation coefficients (Brown 1980a:40). Kline (1994:3) explains that a correlation is “a
numerical measure of the degree of agreement between two sets of scores”. It runs from +1 to
-1. Full agreement is indicated by +1, 0 indicates no relationship; while –1 indicates complete
disagreement and is known as the correlation coefficient. A correlation coefficient thus refers
to the strength of a relationship between two variables in a population and its values range from
-1 for perfect negative correlation up to +1 for perfect positive correlation between variables
(Berenson & Levine 1996:732). Factor loadings are values expressing each sort’s relationship
with the centroid. Each loading represents a sort’s contribution to the length of the centroid and
can thus be expressed as the correlation of the sort with the centroid (Stricklin & Almeida 1999).
The factoring process commences once a matrix of Q sort correlations is provided (McKeown
82 Variance is a common statistical term and provides an index of the dispersion of scores.

163
& Thomas 1988:49).
A correlation matrix is simply a way through which the data must pass (numerical
treatment) on the way to revealing their factor structure. It indicates in tabular form, the
extent to which each Q sort is correlated or uncorrelated in terms of significant or
insignificant loadings (Brown 1991).
Table 5.6 below is an example of a correlation matrix.
Table 5.6: An example of a correlation matrix
---------------------------------------Sort 1 2 3 4 5 6 ---------------------------------------- 1 0 56 57 56 57 63 2 56 0 73 76 71 81 3 57 73 0 73 72 75 4 56 76 73 0 70 69 5 57 71 72 70 0 79 6 63 81 75 69 79 0
----------------------------------------
Owing to the development of more sophisticated computer programs, the centroid
method (or simple summation method) of factor extraction, for instance, has been
replaced by the principal factor method (Comrey 1973: 51). The principal factor
method is a form of factor analysis which seeks the least number of factors which can
account for the common variance (correlation) of a set of variables (Comrey
1973:76).
Because of sound theoretical reasons, Q methodology still extracts factors using the
centroid (or simple summation) method. It allows for manual rotation in accordance with

164
the researcher’s research problem. Stephenson (1953) wants the researcher to be able
to pursue his or her own rotational solution (for instance, judgmental rotation) to take
the theory into account (Brown 1980a:261). The researcher may, for instance, also have
reasons for selecting a particular Q sample and the person-sample, which the
researcher’s own rotational solution can then highlight.
b Factor loadings
After factor extraction, a column of numbers is generated, one for each Q sort. Each
column represents the loadings of the Q sorts on that factor. These loadings represent
the extent to which each Q sort is associated with each factor (Brown 1991). Factor
loadings are thus correlations between the Q sorts and the factor (Comrey 1973:7).
A factor loading in factor analysis is worth considering for interpretation when it
represents about 10 percent or more of the variance (Child 1970:45).
Participants who do not load significantly on any factor have points of view that are
“idiosyncratric” and cannot be included under any theme depicted in the Q factor
analysis results (Schmolck 1998).
Table 5.7 below is an example of factor loadings.
Table 5.7: An example of factor loadings
----------------------------------------Sort 1 2 3 4 5 6

165
---------------------------------------- Factor 1 66 90 85 78 82 90Factor 2 -10 8 16 4 -18 -22 Factor 3 -9 10 -3 13 1 9 Factor 4 -9 -2 15 12 14 12 Factor 5 4 14 3 19 0 -8 Factor 6 3 2 -5 -11 -10 16 -----------------------------------------
In the above example, all six Q sorts load very high on factor 1 and lower on the other
five factors which make factor 1 the prominent factor. Sort 1 of factors 2, 3 and 4
indicates a negative loading which, in Q methodology, does not have a clear meaning.
All sorts with negative loadings are considered to be in a cluster of their own.
c Rotating factors
“The process of manipulating the reference axes” is known as rotation (Child
1970:52). The factors can be rotated in a number of ways. The researcher rotates
factors in terms of “preconceived ideas, vague notions and prior knowledge about
the topic” (Brown 1991). In Q methodology, the significance level determines
whether there is a factor which is taken into account by the rotation method. A
significance level is usually set equal to or greater than the value of two standard
deviations away from the mean. It is a statistic directly related to the number of items
in the Q sample. As the number of statements increases, the theoretical significance
level decreases. The smaller the number of statements, the higher the theoretical
significance level will be (Stricklin & Almeida 1999).
Once the factors needed to account for the correlations in the correlation matrix are
extracted, the values are arranged in a table referred to as “the matrix of unrotated
loadings”. Unrotated factors tend to be highly complicated factor constructs that relate
to or overlap with many of the variables instead of only a few. This factor matrix is then
rotated into another form that “is mathematically equivalent” to the original unrotated
matrix. However, it represents factor constructs that are often much more useful for
scientific purposes than the unrotated factor constructs (Comrey 1973:7).

166
Q methodology typically uses varimax rotation, followed by judgmental rotation,
depending on the goals of a particular study.
i Varimax rotation
According to Kline (1994:62), the varimax factor rotation, devised by Kaiser (1958;
1959), is strictly mathematical and provides an orthogonal solution. This means that
factors are rotated in such a way that they are always at right angles to each other,
that is, the factors are uncorrelated.
Through an “iterative” 83 process, variance is distributed across the factor structure in
such a way that each sort has the highest degree of association with only one factor, all
sorts and all factors being taken into consideration (Stricklin & Almeida 1999).The
purpose is to maximise “the purity of saturation” of as many Q sorts as possible on one
or the other of the number of factors extracted initially” (McKeown & Thomas 1988:52).
ii Judgmental rotation
Q methodology may use judgmental rotation (also known as graphical rotation or hand
rotation), depending on the goals of the particular study. A researcher may have
specific theoretical goals in mind when using a Q study and may therefore have reasons
for selecting a particular Q sample to provide the Q sorts. For instance, the researcher
83 Number of cycles. Starting from an informed guess about the possible value of communality, amore reliable value is calculated by repeated approximations until the final value alters very littlewith repeated calculations (Child 1970:37).

167
may decide to maximise a specific individual’s Q sort to reveal relationships previously
unrecognised. Another purpose of judgmental rotation can be to account for as many
of the sorts as possible in as few factors as possible (Stricklin & Almeida 1999).
Criticism against judgmental rotation has to do with its subjective nature because the
researcher allegedly rotates and “forces” the data to conform to his or her theory.
However, Brown (1980a:229,165) states that this criticism is unfounded, because “only
those structures can emerge which the data will tolerate”. Judgmental rotation “permits
the observation of reality, represented by the Q sorts performed, from the theoretical
vantage point of the observer”.
The graphic controls allow the researcher to put the theoretical considerations “into
motion”. Interrelationships of the Q sorts are not changed in any way through rotation.
5.3.5 Analysing the results of the factor analysis
The fifth and last phase of a Q study involves analysing the results of the factor
analysis. This is accomplished through the assessment of factor scores and the
interpretation of the factor array as well as the distinguishing and consensus statements.
This section explains factor scores and interpreting the factor array and distinguishing
and consensus statements.
5.3.5.1 Factor scores
A factor score is the score for a statement as a “kind of average” of the scores given
that statement by all of the Q sorts associated with the factor (Brown 1991).
In Q methodology, interpretations are primarily based on the factor scores, in
168
comparison with most research applications in which factor interpretation is based on
factor loadings.
Once the researcher is satisfied with his or her rotations, the software program for
analysis, PQMethod84, is allowed to compute factor scores for a final factor solution.
This means that particular Q sorts are associated with factors.
Before allowing the software program to compute factor scores for a final factor solution,
the researcher marks each Q sort to be associated with factors with an X (known as
flagging – see chapter 6, 6.4.2.4), on the basis of his or her consideration of the
following:
a Pure loadings
A factor rotation often generates mixed Q sort loadings (known as mixed cases)
which are regarded as “factorially impure”. This means that a Q sort has significantly
loaded on two or more factors, which represents a “blend” of the two respective
factor views (Brown 1997a). The researcher needs to present a final solution of as
many purest loadings as possible on a factor to estimate the factor scores. Pure
loadings are pure expressions of the factor and provide a focused view of the point
of view of a specific factor (Brown 2003e).
b Factor reliability
Defining a factor by the number of participants who loaded on it, represents one way
to compute factor scores. The composite reliability of a factor depends on how many
participants define it. A factor should have at least five participants defining it. This
will generate factor reliability of 0,95 (Brown 2000b).
The following formula is built into the PQMethod program:

169
Rxx = 0,80p / [1 + (p-1), 080]
Where 0,80 is the assumed average reliability of the Q sorts comprising the factor, p
is the number of those Q sorts, and Rxx is the test-retest reliability coefficient. When
p = 5 Q sorts defining a factor, the factor reliability is therefore
Rxx = 0,80(5) / [1 + (5-1),80] = 0,9524.
Brown (2000a) further explains that the reliability of a factor is significant because it
enters into the calculation of the standard error of the factor scores:
SEfs = Sx[Sort(1 – Rxx)] where Sx is the standard deviation of the Q sort distribution
(Sx = 1,00 when dealing with normalised factor scores). For n = 5 Q sorts, therefore,
SEfs = ,2182.
According to Brown (2000a), a good result will increase factor reliability. Q
methodology is designed to provide the basis for examining differences in subjective
perspectives - hence only enough individuals are needed for each factor type to
provide the researcher with a clear “reading” of the point of view which that factor
represents. A factor reliability of 0,95 is sufficiently high to obtain a clear reading of
the factor. Adding increasingly responses only “marginally” clarifies the picture.
Brown (2003e) explains that factor reliability provides the researcher with “a kind of
index” of how much confidence can be placed in the factor.
c Size of the factor loading
Since each Q study and context are unique, the researcher’s judgement and
discretion cannot be denied (Brown 2000b). Schmolck (1998) suggests that the
researcher should be creative in his or her detection and elaboration of
unanticipated perspectives.
A researcher should also deliberate the size of the factor loadings of the few
84 The steps followed using the PQMethod software program are discussed in chapter 6.

170
cases/participants on a factor. Loadings can be extremely high because the number
of statements is small or because the Q sample contains simple and unambiguous
statements to which participants respond in highly similar ways, in which case the
factors may reflect “commonplace” or obvious rather than meaningful and interesting
responses.
Brown (2002) suggests that, depending on the number of Q sorts defining a factor
(for instance, only three or four), the researcher may also select Q sorts that load
significantly higher on one factor than on the other, for instance, 0,80 on one factor
and 0,38 on another, even though this will be a mixed loading. The factor with the
high loading will not be “contaminated” too much with the participant’s low loading on
another factor.
d Consideration of Q sorts with low factor reliability
When a theoretically important participant loads very high on one factor and very low
on other factors, it is also recommended that this factor should be examined,
interpreted and compared with other factors, even though no other participant
loaded on that factor. Brown (2001) explains that if a pure factor loading contains
only one participant, it might first be judged unworthy of retention. It should,
however, be retained if the participant is deemed important for theoretical reasons.
5.3.5.2 Interpreting the factor array
Once factor scores have been computed, each factor is presented in the form of a
factor array, that is, a diagram representing overall points of view. Brown (2003c)
explains that Q methodology attempts to explain “entire response patterns” found in
factor arrays that represent “overall points of view”. In other words, the factor blends
elements into an overall “gestalt” that cannot be further reduced. A factor reveals “in
general outline” the thinking of participants with a particular perception. Q
methodology is interested in statements involving integration into overall viewpoints
(which are represented by factors) and not as isolated and independent events
(Brown 2003c).

171
Table 5.8 below is an example of a factor array.
Table 5.8: An example of a factor array
Factor A
-5 -4 -3 -2 -1 0 1 2 3 4 5 -------------------------------------------- 20 11 10 2 3 4 23 1 9 13 21 27 16 15 5 6 8 25 7 17 30 26 31 18 47 14 12 19 41 28 22 32 34 29 48 38 36 35 49 33 24 37 54 40 44 43 50 39 42 53 45 51 52 46
In the above example, the factor array indicates where each statement was placed on
the Q sort diagram with regard to the subjective perceptions of the separate group,
known as factor A. However, it does not indicate the placing of the statements as
members of the specific group because it is possible that the participants do no
necessarily feel the same as the factor indicates.
The researcher studies the factor array for each factor that emerged from the
statistical analysis to ascertain which statements are considered more agreeable
than others. Based on the analysis of the factor array, an appropriate name is given
for each factor identified. In the above example, the factor is characterised by
statements that loaded on +5, -5, +4 and –4 (Brown 1980a:23-24).
There is no set strategy for interpreting a factor array, because it depends on what
the researcher attempts to achieve (Brown 1980a:247).
5.3.5.3 Distinguishing statements
The results of the Q factor analysis will also provide a list of distinguishing
statements. Brown (2003d) emphasises that factors should not be highly correlated
because the higher factors are correlated, the fewer distinctions there will be
between the factor known as distinguishing statements.
172
A distinguishing statement depends on the number of Q sorts defining a factor and
the standard deviation of the Q sort distribution. It receives a significantly different
score from each of the other factors and is treated differently by participants (Brown
2003d). According to Brown (1998), the number of distinguishing statements for
each factor will be different and depend on how many statements receive significantly
different normalised scores from those scores received in other factors. In Q
methodology, the researcher should not only consider statistical criteria, but also use
her or his own judgment in the interpretation.
5.3.5.4 Consensus statements
The results of the Q factor analysis will also provide a list of consensus statements.
Brown (1997b) explains a consensus statement as one in which there is no
significant difference between any factors. It therefore fails to distinguish one factor
from others because all factors may give the same statement the same score.
However, according to Brown (1997b), “just because a statement is singled out as
distinguished or consensual by statistical criteria, does not mean that we are obliged
to accept this as having special theoretical or substantive importance”.
5.4 BENEFITS AND LIMITATIONS OF Q METHODOLOGY
As a research methodology, Q methodology has both benefits and limitations. These are
discussed below.
5.4.1 Benefits of Q methodology
Q methodology is a unique research method that investigates associations, feelings,
opinions and ideas that an individual may have about a topic. Statements are collected
from the participant’s opinion and organised by the participant himself or herself. This
provides greater insight into what an individual feels about a topic (Schlinger 1969:53).
Because of the active involvement of participants, data are highly reliable in that

173
problems with missing data, social desirability, “undecided” responses, or response sets
are “virtually nonexistent”. Since the Q sorting process is done in the presence of the
researcher, he or she becomes more familiar with the participants’ feelings about the
topic (Dennis 1986:5).
Another benefit is its cost-effectiveness. In Q methodology, fewer participants are
required than in most other research methods, which make it less expensive (Dennis
1986:5).
5.4.2 Limitations of Q methodology
As a research methodology, Q methodology also has various limitations. One of the
main limitations is that the Q sorting process is extremely time-consuming (McKeown &
Thomas 1988:34). Both the method and instructions also need to be explained
extensively to participants because they are generally unfamiliar with it. Participants with
limited education also need to be shown how to proceed. Validity can therefore be
affected if the participant’s lack of comprehension leads to misrepresentation (Dennis
1986:6). The time-consuming process of Q sorting can be alleviated by the use of focus
groups which allow various participants to arrange statements on several Q sort
diagrams at the same time. However, much of the qualitative data obtained will be
disregarded when a focus group is conducted which will make the results of the Q
sorting less effective (Denzine 1998).
Q methodology has also been much criticised because it uses a small sample. Results
cannot be generalised to the rest of the population and are limited to different
perceptions only (Schlinger 1969:54).
5.5 SUMMARY
This chapter provided a detailed explanation of the research methodology for this

174
research. The five parts of the theoretical foundation were outlined, and the data
analysis process, known as Q factor analysis, explained. The next chapter, chapter
6, deals with operationalisation.