chapter 1 · chapter 1 introduction ... mathematics and science achievement in the final year of...
TRANSCRIPT

7
Chapter 1INTRODUCTION
OVERVIEW
In 1994-95, the International Association for the Evaluation of EducationalAchievement (IEA) conducted the Third International Mathematics andScience Study (TIMSS) in 41 countries. The IEA is a collaborative of researchinstitutions in 53 education systems1 around the world. Its primary purpose isto conduct large-scale comparative studies of educational achievement and togain a better understanding of the effects of policies and practices onachievement within and across systems of education. Since its inception in1959, the IEA has sponsored more than 15 studies of cross-nationalachievement, including TIMSS — the largest and most ambitious IEA studyconducted to date. TIMSS assessed students in mathematics and science atthree points in the education system — at the end of primary school (third andfourth grades in most countries), at the end of middle or lower-secondaryschool (seventh and eighth grades in most countries), and in the final year ofsecondary school (twelfth grade in most countries). Countries were required toparticipate in the assessment of students at the end of middle school, butcould choose to participate in the other two assessments.
Achievement was measured through written tests of mathematics and scienceachievement taken by students in the third, fourth, seventh, and eighth grades.Students in their final year of secondary school were also tested inmathematics and science literacy. In addition, sub-populations of final-yearstudents who had taken advanced mathematics or physics were tested in thesesubjects. In some countries, students in the fourth and eighth gradescompleted a performance assessment in addition to the written tests.
In the tradition of previous IEA studies, TIMSS sought to describe the contextsin which mathematics and science teaching and learning take place. Toaccomplish this, TIMSS gathered contextual information from students,teachers, and schools; investigated the curricula of the participating countriesthrough an analysis of mathematics and science curriculum guides andtextbooks; and compiled extensive information about the education systems ofthe participating countries. The mathematics and science achievement resultsfor the three student populations, as well as background data collected fromstudents and teachers, have been published in a series of reports.2
1 While most IEA members are countries, some are education systems representing regionswithin countries.
2 Mullis, I.V.S., Martin, M.O., Beaton, A.E., Gonzalez, E.J., Kelly, D.L., and Smith, T.A. (1998).Mathematics and Science Achievement in the Final Year of Secondary School: IEA’s ThirdInternational Mathematics and Science Study (TIMSS). Chestnut Hill, MA: Boston College;Mullis, I.V.S., Martin, M.O., Beaton, A.E., Gonzalez, E.J., Kelly, D.L., and Smith, T.A. (1997).Mathematics Achievement in the Primary School Years: IEA’s Third International Mathematicsand Science Study (TIMSS). Chestnut Hill, MA: Boston College; Martin, M.O., Mullis, I.V.S.,Beaton, A.E., Gonzalez, E.J., Smith, T.A., and Kelly, D.L. (1997). Science Achievement in thePrimary School Years: IEA’s Third International Mathematics and Science Study (TIMSS).Chestnut Hill, MA: Boston College; Beaton, A.E., Mullis, I.V.S., Martin, M.O., Gonzalez, E.J.,
8
C H A P T E R 1
The purpose of this report is to present information about the school contextsfor learning mathematics and science, including school characteristics,policies, and practices. In each of the 41 education systems, the principal ofeach school sampled for the assessment was asked to complete aquestionnaire addressing the school-level instructional context. The report isorganized around five major topics:
• Role and responsibilities of schools and school principals
• School organization and staffing
• Organization for learning mathematics and science
• School resources
• School atmosphere
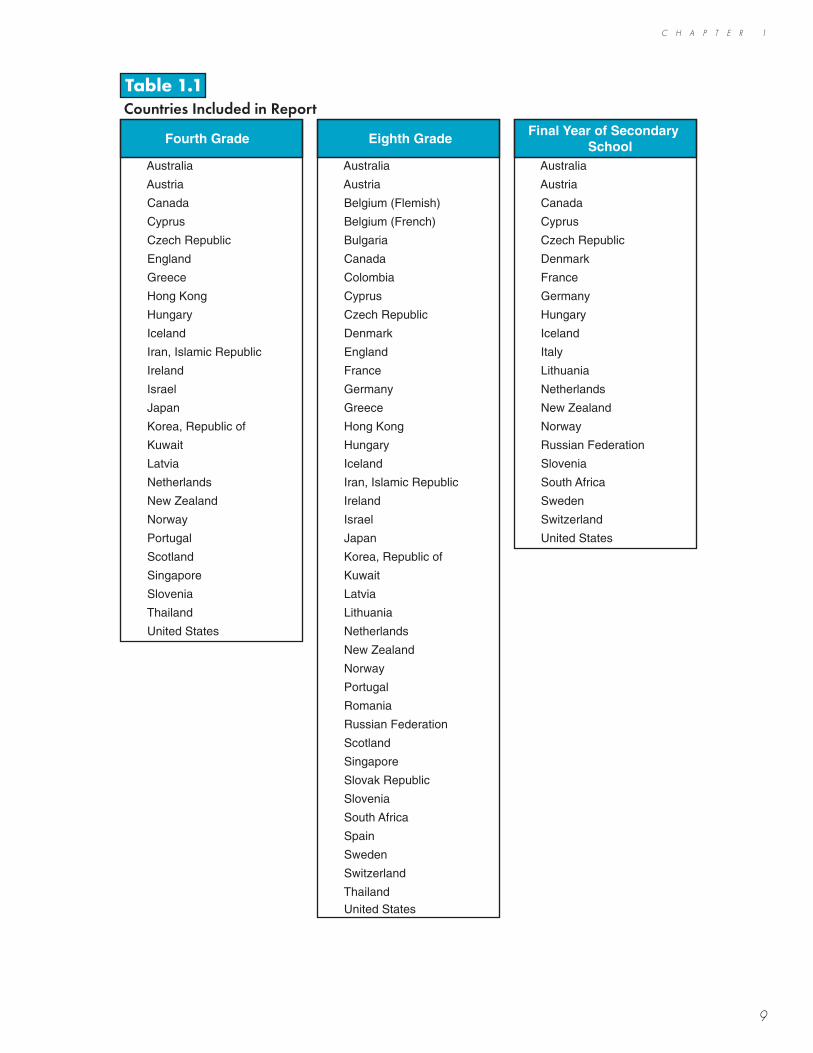
Table 1.1 presents the countries included in this report at each of the threegrade levels.3 Results are reported for the upper grade of the primary schoolstudent population (fourth grade in most countries), the upper grade of themiddle school student population (eighth grade in most countries), and for allstudents in their final year of secondary school (twelfth grade in mostcountries).4 Although there was considerable overlap in the questions asked ofthe school principals, some questions were not administered at all threepopulations.
Kelly, D.L., and Smith, T.A. (1996). Mathematics Achievement in the Middle School Years: IEA’sThird International Mathematics and Science Study (TIMSS). Chestnut Hill, MA: BostonCollege; Beaton, A.E., Martin, M.O., Mullis, I.V.S., Gonzalez, E.J., Smith, T.A., and Kelly, D.L.(1996). Science Achievement in the Middle School Years: IEA’s Third International Mathematicsand Science Study (TIMSS). Chestnut Hill, MA: Boston College.
3Because the characteristics of its sample are not completely known, results for Israel at the finalyear of secondary school are not included in this report. Data for Greece and Latvia from thefinal year of secondary school are not included, as only advanced mathematics or physicsstudents were sampled.
4 Information about population definitions and sampling procedures is provided in Appendix A.
C H A P T E R 1
9
Table 1.1Countries Included in Report
Fourth Grade Eighth GradeFinal Year of Secondary
School Australia Australia Australia
Austria Austria Austria
Canada Belgium (Flemish) Canada
Cyprus Belgium (French) Cyprus
Czech Republic Bulgaria Czech Republic
England Canada Denmark
Greece Colombia France
Hong Kong Cyprus Germany
Hungary Czech Republic Hungary
Iceland Denmark Iceland
Iran, Islamic Republic England Italy
Ireland France Lithuania
Israel Germany Netherlands
Japan Greece New Zealand
Korea, Republic of Hong Kong Norway
Kuwait Hungary Russian Federation
Latvia Iceland Slovenia
Netherlands Iran, Islamic Republic South Africa
New Zealand Ireland Sweden
Norway Israel Switzerland
Portugal Japan United States
Scotland Korea, Republic of
Singapore Kuwait
Slovenia Latvia
Thailand Lithuania
United States Netherlands
New Zealand
Norway
Portugal
Romania
Russian Federation
Scotland
Singapore
Slovak Republic
Slovenia
South Africa
Spain
Sweden
Switzerland
Thailand United States
10
C H A P T E R 1
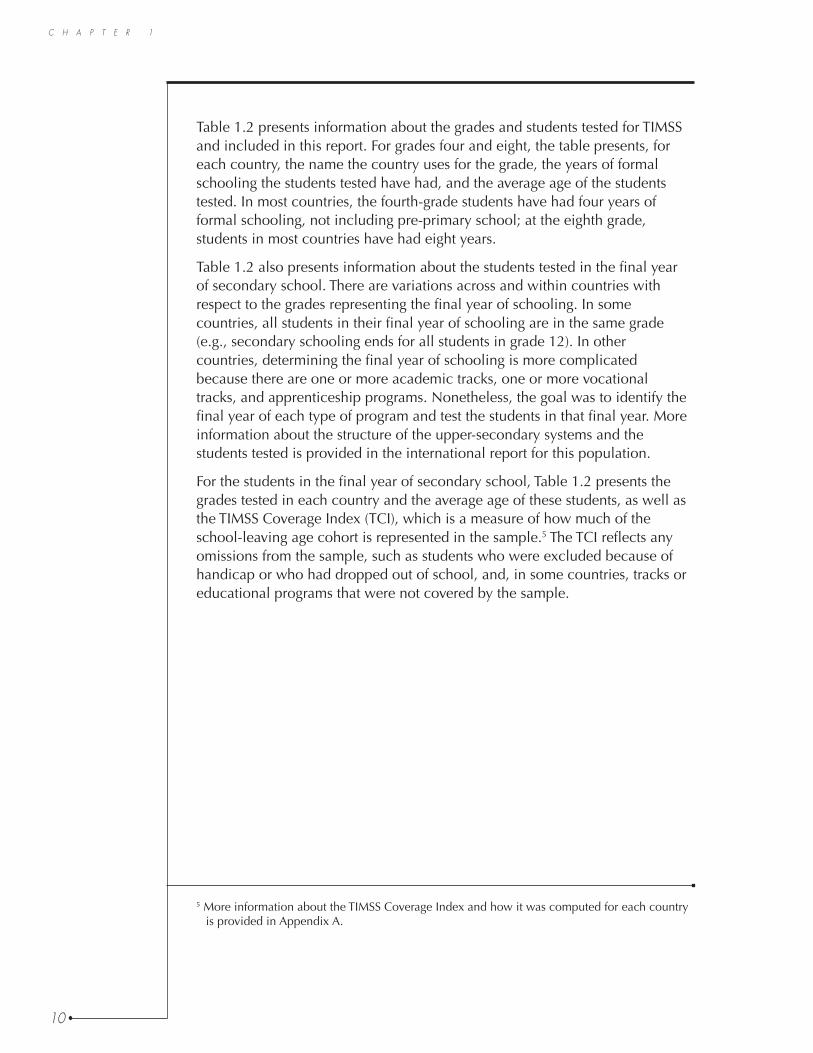
Table 1.2 presents information about the grades and students tested for TIMSSand included in this report. For grades four and eight, the table presents, foreach country, the name the country uses for the grade, the years of formalschooling the students tested have had, and the average age of the studentstested. In most countries, the fourth-grade students have had four years offormal schooling, not including pre-primary school; at the eighth grade,students in most countries have had eight years.
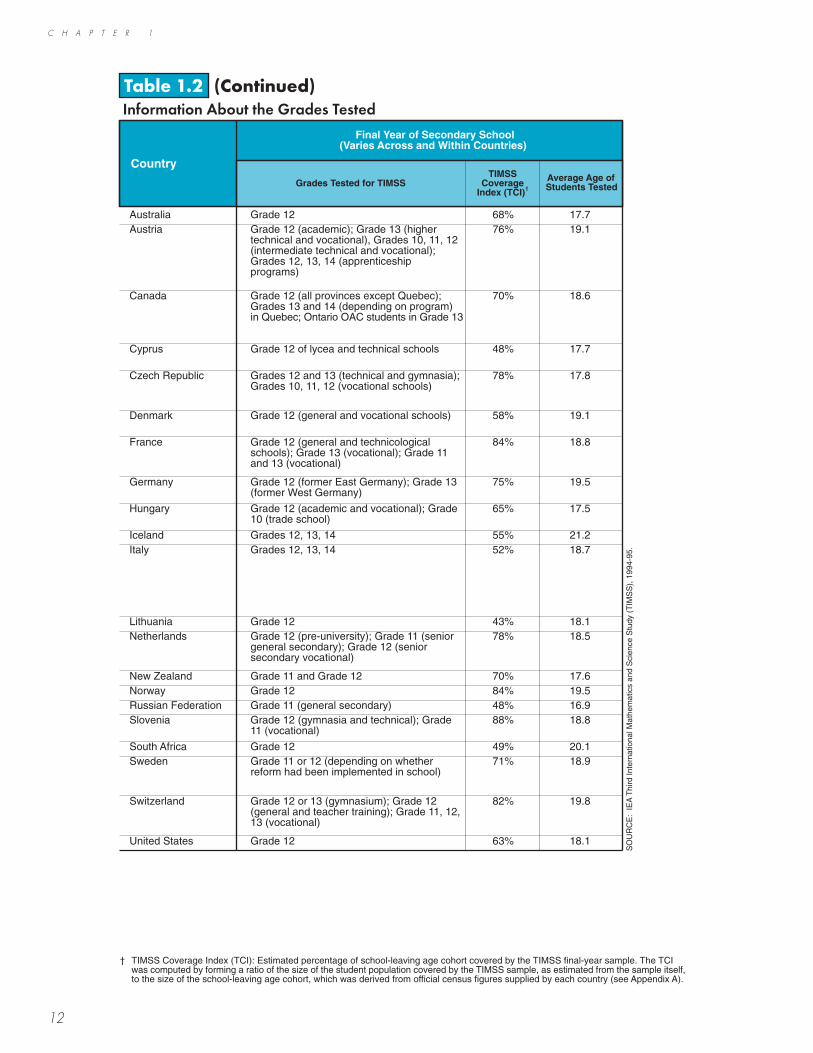
Table 1.2 also presents information about the students tested in the final yearof secondary school. There are variations across and within countries withrespect to the grades representing the final year of schooling. In somecountries, all students in their final year of schooling are in the same grade(e.g., secondary schooling ends for all students in grade 12). In othercountries, determining the final year of schooling is more complicatedbecause there are one or more academic tracks, one or more vocationaltracks, and apprenticeship programs. Nonetheless, the goal was to identify thefinal year of each type of program and test the students in that final year. Moreinformation about the structure of the upper-secondary systems and thestudents tested is provided in the international report for this population.
For the students in the final year of secondary school, Table 1.2 presents thegrades tested in each country and the average age of these students, as well asthe TIMSS Coverage Index (TCI), which is a measure of how much of theschool-leaving age cohort is represented in the sample.5 The TCI reflects anyomissions from the sample, such as students who were excluded because ofhandicap or who had dropped out of school, and, in some countries, tracks oreducational programs that were not covered by the sample.
5 More information about the TIMSS Coverage Index and how it was computed for each countryis provided in Appendix A.

C H A P T E R 1
11
1 Years of Formal Schooling based on the number of years children in the grade level have been in formal schooling, beginning withprimary education (International Standard Classification of Education Level 1). Does not include preprimary education.
2 Australia: Each state/territory has its own policy regarding age of entry to primary school. In four of the eight states/territories studentsin grades 4 and 8 were tested; in the other four states/territories students in grades 5 and 9 were tested.
3 New Zealand: The majority of students begin school on or near their fifth birthday so the “years of formal schooling” vary.
4 Russian Federation: 70% of students in the eighth grade have had 7 years of formal schooling.
A dash (–) indicates that the country did not test students in this grade level or that data are not presented in this report.
Table 1.2Information About the Grades Tested
Fourth Grade(TIMSS Population 1 Upper Grade)
Eighth Grade(TIMSS Population 2 Upper Grade)
Country's Name forGrade Tested
Years of FormalSchooling
Including GradeTested1
Average Age ofStudents Tested
Country's Name forGrade Tested
Years of FormalSchooling
Including GradeTested1
Average Age ofStudents Tested
2 Australia 4 or 5 4 or 5 10.2 8 or 9 8 or 9 14.2Austria 4 4 10.5 4. Klasse 8 14.3Belgium (Fl) – – – 2A & 2P 8 14.1Belgium (Fr) – – – 2A & 2P 8 14.3Bulgaria – – – 8 8 14.0Canada 4 4 10.0 8 8 14.1Colombia – – – 8 8 15.7Cyprus 4 4 9.8 8 8 13.7Czech Republic 4 4 10.4 8 8 14.4Denmark – – – 7 7 13.9England Year 5 5 10.0 Year 9 9 14.0France – – – 4ème (90%) or
4èmeTechnologique
(10%)
8 14.3
Germany – – – 8 8 14.8Greece 4 4 9.6 Secondary 2 8 13.6Hong Kong Primary 4 4 10.1 Secondary 2 8 14.2Hungary 4 4 10.4 8 8 14.3Iceland 4 4 9.6 8 8 13.6Iran, Islamic Rep. 4 4 10.5 8 8 14.6Ireland 4th Class 4 10.3 2nd Year 8 14.4Israel 4 4 10.0 8 8 14.1Japan 4 4 10.4 2nd Grade Lower
Secondary8 14.4
Korea 4th Grade 4 10.3 2nd Grade MiddleSchool
8 14.2
Kuwait 5 5 10.8 9 9 15.3Latvia 4 4 10.5 8 8 14.3Lithuania – – – 8 8 14.3Netherlands 6 4 10.3 Secondary 2 8 14.3
3 New Zealand Standard 3 4.5 - 5.5 10.0 Form 3 8.5 - 9.5 14.0Norway 3 3 9.9 7 7 13.9Portugal 4 4 10.4 Grade 8 8 14.5Romania – – – 8 8 14.6
4 Russian Federation – – – 8 7 or 8 14.0Scotland Year 5 5 9.7 Secondary 2 9 13.7Singapore Primary 4 4 10.3 Secondary 2 8 14.5Slovak Republic – – – 8 8 14.3Slovenia 4 4 10.9 8 8 14.8South Africa – – – Standard 6 8 15.4Spain – – – 8 EGB 8 14.3Sweden – – – 7 7 13.9Switzerland – – – 14.2 (German) 7 7 (French and Italian) 8 8Thailand Primary 4 4 10.5 Secondary 2 8 14.3United States 4 4 10.2 8 8 14.2
Country
SO
UR
CE
: IE
A T
hird
Inte
rnat
iona
l Mat
hem
atic
s an
d S
cien
ce S
tudy
(T
IMS
S),
199
4-95
.
C H A P T E R 1
12
† TIMSS Coverage Index (TCI): Estimated percentage of school-leaving age cohort covered by the TIMSS final-year sample. The TCIwas computed by forming a ratio of the size of the student population covered by the TIMSS sample, as estimated from the sample itself,to the size of the school-leaving age cohort, which was derived from official census figures supplied by each country (see Appendix A).
Table 1.2Information About the Grades Tested
Final Year of Secondary School(Varies Across and Within Countries)
Grades Tested for TIMSSTIMSS
CoverageIndex (TCI)†
Average Age ofStudents Tested
Australia Grade 12 68% 17.7Austria Grade 12 (academic); Grade 13 (higher
technical and vocational), Grades 10, 11, 12(intermediate technical and vocational);Grades 12, 13, 14 (apprenticeshipprograms)
76% 19.1
Canada Grade 12 (all provinces except Quebec);Grades 13 and 14 (depending on program)in Quebec; Ontario OAC students in Grade 13
70% 18.6
Cyprus Grade 12 of lycea and technical schools 48% 17.7
Czech Republic Grades 12 and 13 (technical and gymnasia);Grades 10, 11, 12 (vocational schools)
78% 17.8
Denmark Grade 12 (general and vocational schools) 58% 19.1
France Grade 12 (general and technicologicalschools); Grade 13 (vocational); Grade 11and 13 (vocational)
84% 18.8
Germany Grade 12 (former East Germany); Grade 13(former West Germany)
75% 19.5
Hungary Grade 12 (academic and vocational); Grade10 (trade school)
65% 17.5
Iceland Grades 12, 13, 14 55% 21.2Italy Grades 12, 13, 14 52% 18.7
Lithuania Grade 12 43% 18.1Netherlands Grade 12 (pre-university); Grade 11 (senior
general secondary); Grade 12 (seniorsecondary vocational)
78% 18.5
New Zealand Grade 11 and Grade 12 70% 17.6Norway Grade 12 84% 19.5Russian Federation Grade 11 (general secondary) 48% 16.9Slovenia Grade 12 (gymnasia and technical); Grade
11 (vocational)88% 18.8
South Africa Grade 12 49% 20.1Sweden Grade 11 or 12 (depending on whether
reform had been implemented in school)71% 18.9
Switzerland Grade 12 or 13 (gymnasium); Grade 12(general and teacher training); Grade 11, 12,13 (vocational)
82% 19.8
United States Grade 12 63% 18.1
Country
SO
UR
CE
: IE
A T
hird
Inte
rnat
iona
l Mat
hem
atic
s an
d S
cien
ce S
tudy
(T
IMS
S),
199
4-95
.
(Continued)
13
C H A P T E R 1
TIMSS ACHIEVEMENT RESULTS
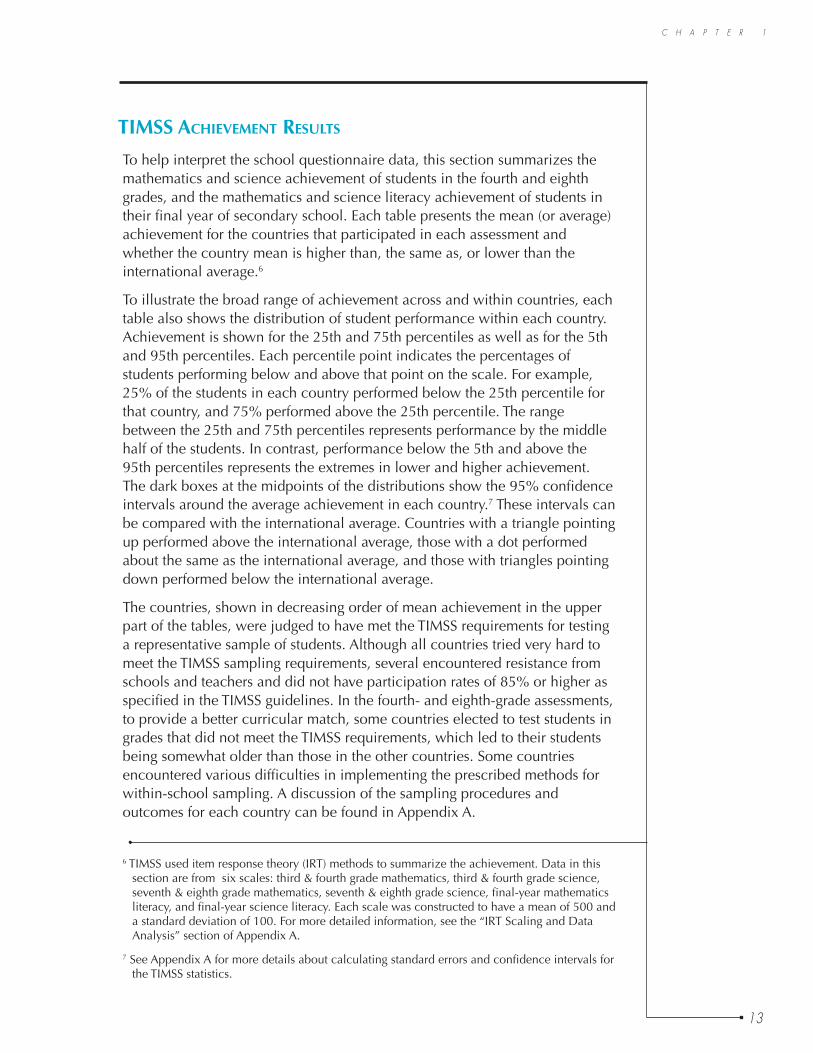
To help interpret the school questionnaire data, this section summarizes themathematics and science achievement of students in the fourth and eighthgrades, and the mathematics and science literacy achievement of students intheir final year of secondary school. Each table presents the mean (or average)achievement for the countries that participated in each assessment andwhether the country mean is higher than, the same as, or lower than theinternational average.6
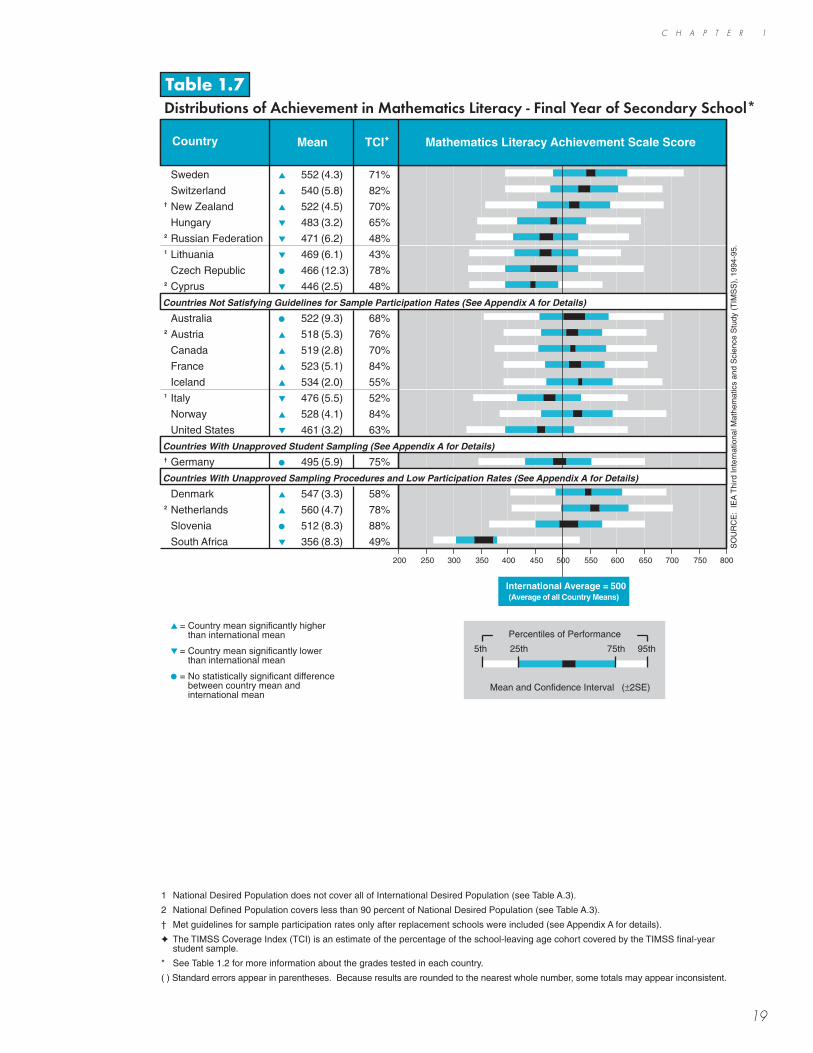
To illustrate the broad range of achievement across and within countries, eachtable also shows the distribution of student performance within each country.Achievement is shown for the 25th and 75th percentiles as well as for the 5thand 95th percentiles. Each percentile point indicates the percentages ofstudents performing below and above that point on the scale. For example,25% of the students in each country performed below the 25th percentile forthat country, and 75% performed above the 25th percentile. The rangebetween the 25th and 75th percentiles represents performance by the middlehalf of the students. In contrast, performance below the 5th and above the95th percentiles represents the extremes in lower and higher achievement.The dark boxes at the midpoints of the distributions show the 95% confidenceintervals around the average achievement in each country.7 These intervals canbe compared with the international average. Countries with a triangle pointingup performed above the international average, those with a dot performedabout the same as the international average, and those with triangles pointingdown performed below the international average.
The countries, shown in decreasing order of mean achievement in the upperpart of the tables, were judged to have met the TIMSS requirements for testinga representative sample of students. Although all countries tried very hard tomeet the TIMSS sampling requirements, several encountered resistance fromschools and teachers and did not have participation rates of 85% or higher asspecified in the TIMSS guidelines. In the fourth- and eighth-grade assessments,to provide a better curricular match, some countries elected to test students ingrades that did not meet the TIMSS requirements, which led to their studentsbeing somewhat older than those in the other countries. Some countriesencountered various difficulties in implementing the prescribed methods forwithin-school sampling. A discussion of the sampling procedures andoutcomes for each country can be found in Appendix A.
6 TIMSS used item response theory (IRT) methods to summarize the achievement. Data in thissection are from six scales: third & fourth grade mathematics, third & fourth grade science,seventh & eighth grade mathematics, seventh & eighth grade science, final-year mathematicsliteracy, and final-year science literacy. Each scale was constructed to have a mean of 500 anda standard deviation of 100. For more detailed information, see the “IRT Scaling and DataAnalysis” section of Appendix A.
7 See Appendix A for more details about calculating standard errors and confidence intervals forthe TIMSS statistics.

14
C H A P T E R 1
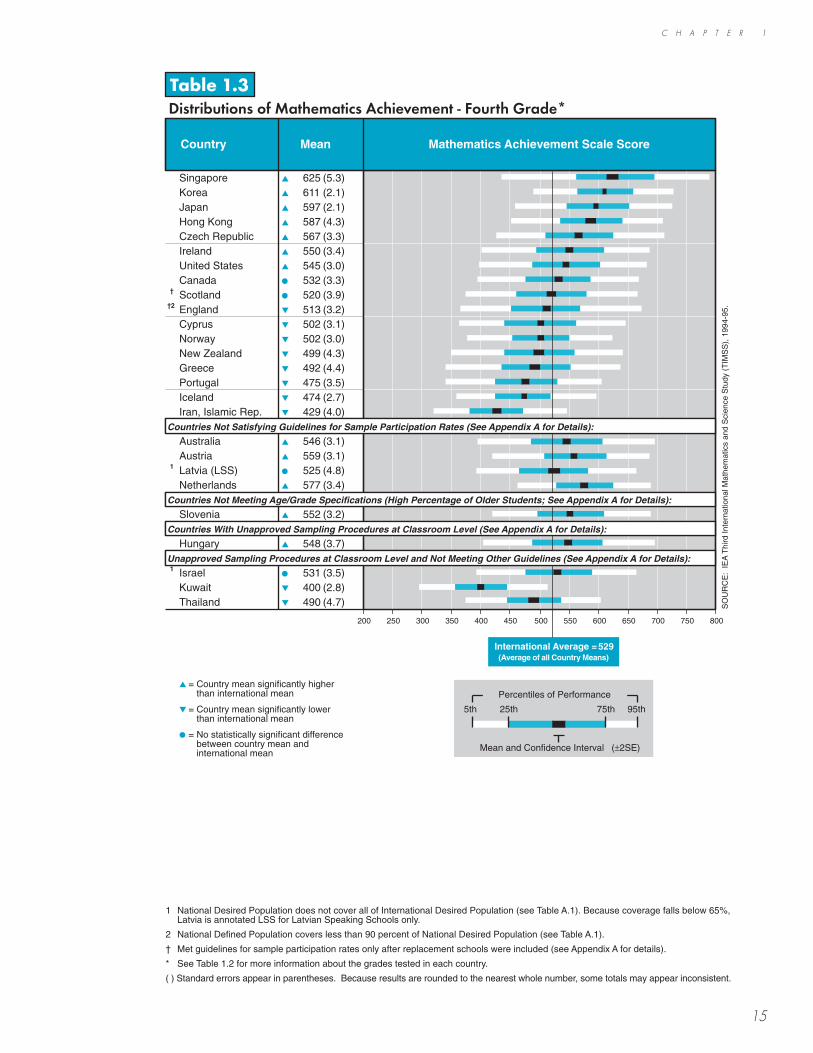
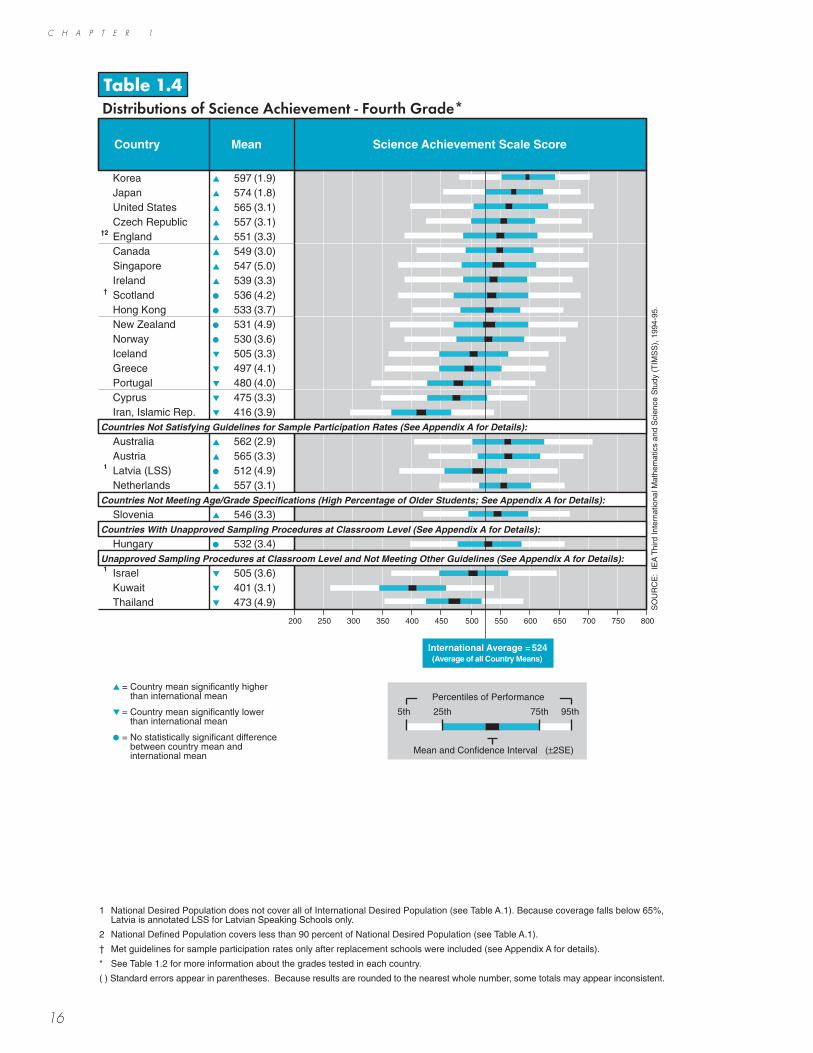
Tables 1.3 and 1.4 present the mathematics and science achievement results,respectively, for students in the fourth grade in 26 countries. As shown in Table1.3, in mathematics at fourth grade, Singapore was the top-performingcountry, followed by Korea, Japan, and Hong Kong. In science, shown in Table1.4, the top-performing countries at fourth grade were Korea, Japan, theUnited States, and Austria.
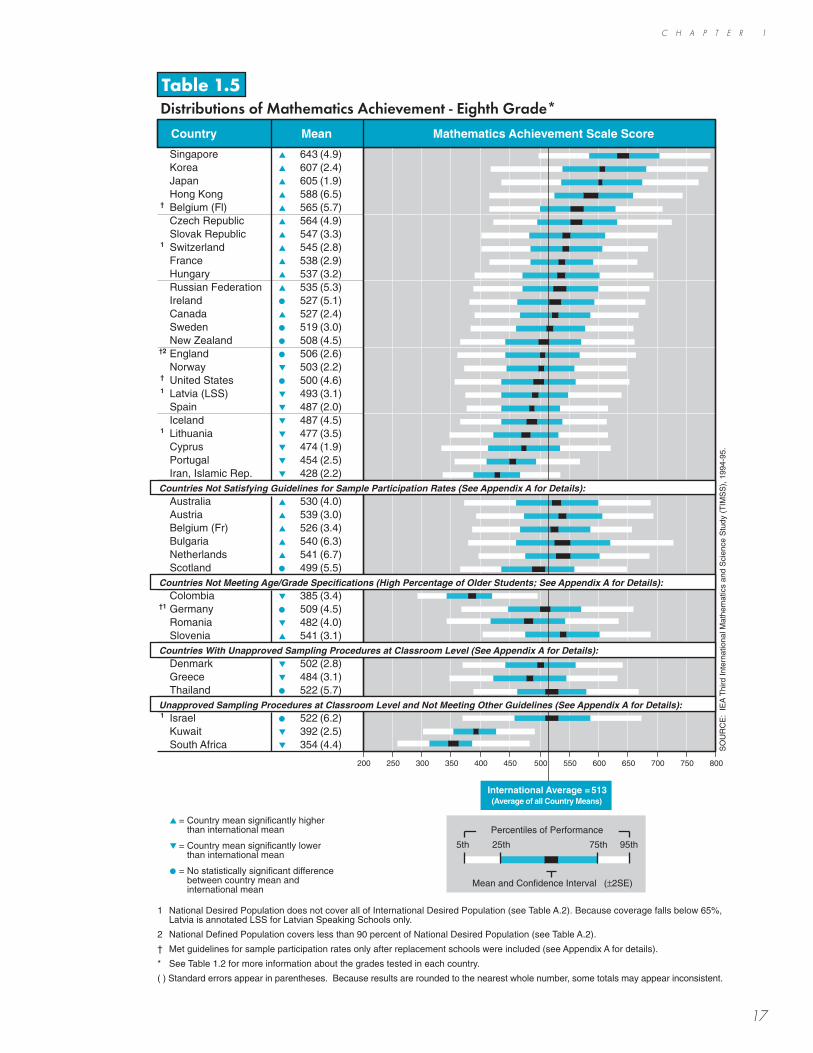
Tables 1.5 and 1.6 present the mathematics and science achievement results,respectively, for students in the eighth grade in 41 countries. As shown inTable 1.5, in mathematics at eighth grade, Singapore was the top-performingcountry, followed by Korea, Japan, and Hong Kong. In science, shown in Table1.6, the top-performing countries at eighth grade were Singapore, the CzechRepublic, Japan, and Korea.
Tables 1.7 and 1.8 present achievement on the mathematics literacy scale andthe science literacy scale, respectively, for students in their final year ofsecondary school in 21 countries. As shown in Table 1.7, in mathematicsliteracy, the top-performing countries were the Netherlands, Sweden,Denmark, and Switzerland. In science literacy, shown in Table 1.8, the top-performing countries were Sweden, the Netherlands, Iceland, and Norway.Not all countries were able to test all students in their final year of secondaryschool, and not all students of school-leaving age are still enrolled in school.Tables 1.7 and 1.8 also present, for each country, a value for the “TIMSSCoverage Index,” or TCI. The TCI is an estimate of the percentage of theschool-leaving age cohort covered by the TIMSS final-year student sample.
C H A P T E R 1
15
1 National Desired Population does not cover all of International Desired Population (see Table A.1). Because coverage falls below 65%,Latvia is annotated LSS for Latvian Speaking Schools only.
2 National Defined Population covers less than 90 percent of National Desired Population (see Table A.1).
† Met guidelines for sample participation rates only after replacement schools were included (see Appendix A for details).
* See Table 1.2 for more information about the grades tested in each country.
( ) Standard errors appear in parentheses. Because results are rounded to the nearest whole number, some totals may appear inconsistent.
Table 1.3Distributions of Mathematics Achievement - Fourth Grade*
Country Mean Mathematics Achievement Scale Score
Singapore � 625 (5.3)Korea � 611 (2.1)Japan � 597 (2.1)Hong Kong � 587 (4.3)Czech Republic � 567 (3.3)Ireland � 550 (3.4)United States � 545 (3.0)Canada � 532 (3.3)
† Scotland � 520 (3.9)†2 England � 513 (3.2)
Cyprus � 502 (3.1)Norway � 502 (3.0)New Zealand � 499 (4.3)Greece � 492 (4.4)Portugal � 475 (3.5)Iceland � 474 (2.7)Iran, Islamic Rep. � 429 (4.0)
Australia � 546 (3.1)Austria � 559 (3.1)
1 Latvia (LSS) � 525 (4.8)Netherlands � 577 (3.4)
Slovenia � 552 (3.2)
Hungary � 548 (3.7)
1 Israel � 531 (3.5)Kuwait � 400 (2.8)Thailand � 490 (4.7)
529
SO
UR
CE
: IE
A T
hird
Inte
rnat
iona
l Mat
hem
atic
s an
d S
cien
ce S
tudy
(T
IMS
S),
199
4-95
.
Country mean significantly higherthan international mean
Country mean significantly lowerthan international mean
No statistically significant differencebetween country mean andinternational mean
� =
� =
� =
International Average =(Average of all Country Means)
200 250 300 350 400 450 500 550 600 650 700 750 800
Unapproved Sampling Procedures at Classroom Level and Not Meeting Other Guidelines (See Appendix A for Details):
Countries With Unapproved Sampling Procedures at Classroom Level (See Appendix A for Details):
Countries Not Meeting Age/Grade Specifications (High Percentage of Older Students; See Appendix A for Details):
Countries Not Satisfying Guidelines for Sample Participation Rates (See Appendix A for Details):
5th 25th 75th 95th
Mean and Confidence Interval (±2SE)
Percentiles of Performance
C H A P T E R 1
16
1 National Desired Population does not cover all of International Desired Population (see Table A.1). Because coverage falls below 65%,Latvia is annotated LSS for Latvian Speaking Schools only.
2 National Defined Population covers less than 90 percent of National Desired Population (see Table A.1).
† Met guidelines for sample participation rates only after replacement schools were included (see Appendix A for details).
* See Table 1.2 for more information about the grades tested in each country.
( ) Standard errors appear in parentheses. Because results are rounded to the nearest whole number, some totals may appear inconsistent.
Table 1.4Distributions of Science Achievement - Fourth Grade*
524S
OU
RC
E:
IEA
Thi
rd In
tern
atio
nal M
athe
mat
ics
and
Sci
ence
Stu
dy (
TIM
SS
), 1
994-
95.
Country mean significantly higherthan international mean
Country mean significantly lowerthan international mean
No statistically significant differencebetween country mean andinternational mean
� =
� =
� =
International Average =(Average of all Country Means)
5th 25th 75th 95th
Mean and Confidence Interval (±2SE)
Percentiles of Performance
Country Mean Science Achievement Scale Score
Korea � 597 (1.9)Japan � 574 (1.8)United States � 565 (3.1)Czech Republic � 557 (3.1)
†2 England � 551 (3.3)Canada � 549 (3.0)Singapore � 547 (5.0)Ireland � 539 (3.3)
† Scotland � 536 (4.2)Hong Kong � 533 (3.7)New Zealand � 531 (4.9)Norway � 530 (3.6)Iceland � 505 (3.3)Greece � 497 (4.1)Portugal � 480 (4.0)Cyprus � 475 (3.3)Iran, Islamic Rep. � 416 (3.9)
Australia � 562 (2.9)Austria � 565 (3.3)
1 Latvia (LSS) � 512 (4.9)Netherlands � 557 (3.1)
Slovenia � 546 (3.3)
Hungary � 532 (3.4)
1 Israel � 505 (3.6)Kuwait � 401 (3.1)Thailand � 473 (4.9)
200 250 300 350 400 450 500 550 600 650 700 750 800
Unapproved Sampling Procedures at Classroom Level and Not Meeting Other Guidelines (See Appendix A for Details):
Countries With Unapproved Sampling Procedures at Classroom Level (See Appendix A for Details):
Countries Not Meeting Age/Grade Specifications (High Percentage of Older Students; See Appendix A for Details):
Countries Not Satisfying Guidelines for Sample Participation Rates (See Appendix A for Details):
C H A P T E R 1
17
1 National Desired Population does not cover all of International Desired Population (see Table A.2). Because coverage falls below 65%,Latvia is annotated LSS for Latvian Speaking Schools only.
2 National Defined Population covers less than 90 percent of National Desired Population (see Table A.2).
† Met guidelines for sample participation rates only after replacement schools were included (see Appendix A for details).
* See Table 1.2 for more information about the grades tested in each country.
( ) Standard errors appear in parentheses. Because results are rounded to the nearest whole number, some totals may appear inconsistent.
Table 1.5Distributions of Mathematics Achievement - Eighth Grade*
SO
UR
CE
: IE
A T
hird
Inte
rnat
iona
l Mat
hem
atic
s an
d S
cien
ce S
tudy
(T
IMS
S),
199
4-95
.
Country mean significantly higherthan international mean
Country mean significantly lowerthan international mean
No statistically significant differencebetween country mean andinternational mean
� =
� =
� =
200 250 300 350 400 450 500 550 600 650 700 750 800
Country Mean Mathematics Achievement Scale Score
Singapore � 643 (4.9)Korea � 607 (2.4)Japan � 605 (1.9)Hong Kong � 588 (6.5)
† Belgium (Fl) � 565 (5.7)Czech Republic � 564 (4.9)Slovak Republic � 547 (3.3)
1 Switzerland � 545 (2.8)France � 538 (2.9)Hungary � 537 (3.2)Russian Federation � 535 (5.3)Ireland � 527 (5.1)Canada � 527 (2.4)Sweden � 519 (3.0)New Zealand � 508 (4.5)
†2 England � 506 (2.6)Norway � 503 (2.2)
† United States � 500 (4.6)1 Latvia (LSS) � 493 (3.1)
Spain � 487 (2.0)Iceland � 487 (4.5)
1 Lithuania � 477 (3.5)Cyprus � 474 (1.9)Portugal � 454 (2.5)Iran, Islamic Rep. � 428 (2.2)
Australia � 530 (4.0)Austria � 539 (3.0)Belgium (Fr) � 526 (3.4)Bulgaria � 540 (6.3)Netherlands � 541 (6.7)Scotland � 499 (5.5)
Colombia � 385 (3.4)†1 Germany � 509 (4.5)
Romania � 482 (4.0)Slovenia � 541 (3.1)
Denmark � 502 (2.8)Greece � 484 (3.1)Thailand � 522 (5.7)
1 Israel � 522 (6.2)Kuwait � 392 (2.5)South Africa � 354 (4.4)
513International Average =(Average of all Country Means)
5th 25th 75th 95th
Mean and Confidence Interval (±2SE)
Percentiles of Performance
Countries Not Satisfying Guidelines for Sample Participation Rates (See Appendix A for Details):
Countries Not Meeting Age/Grade Specifications (High Percentage of Older Students; See Appendix A for Details):
Countries With Unapproved Sampling Procedures at Classroom Level (See Appendix A for Details):
Unapproved Sampling Procedures at Classroom Level and Not Meeting Other Guidelines (See Appendix A for Details):

C H A P T E R 1
18
1 National Desired Population does not cover all of International Desired Population (see Table A.2). Because coverage falls below 65%,Latvia is annotated LSS for Latvian Speaking Schools only.
2 National Defined Population covers less than 90 percent of National Desired Population (see Table A.2).
† Met guidelines for sample participation rates only after replacement schools were included (see Appendix A for details).
* See Table 1.2 for more information about the grades tested in each country.
( ) Standard errors appear in parentheses. Because results are rounded to the nearest whole number, some totals may appear inconsistent.
Table 1.6Distributions of Science Achievement - Eighth Grade*
SO
UR
CE
: IE
A T
hird
Inte
rnat
iona
l Mat
hem
atic
s an
d S
cien
ce S
tudy
(T
IMS
S),
199
4-95
.
Country mean significantly higherthan international mean
Country mean significantly lowerthan international mean
No statistically significant differencebetween country mean andinternational mean
� =
� =
� =
200 250 300 350 400 450 500 550 600 650 700 750 800
Country Mean Science Achievement Scale Score
Singapore � 607 (5.5)Czech Republic � 574 (4.3)Japan � 571 (1.6)Korea � 565 (1.9)Hungary � 554 (2.8)
†2 England � 552 (3.3)† Belgium (Fl) � 550 (4.2)
Slovak Republic � 544 (3.2)Russian Federation � 538 (4.0)Ireland � 538 (4.5)Sweden � 535 (3.0)
† United States � 534 (4.7)Canada � 531 (2.6)Norway � 527 (1.9)New Zealand � 525 (4.4)Hong Kong � 522 (4.7)
1 Switzerland � 522 (2.5)Spain � 517 (1.7)France � 498 (2.5)Iceland � 494 (4.0)
1 Latvia (LSS) � 485 (2.7)Portugal � 480 (2.3)
1 Lithuania � 476 (3.4)Iran, Islamic Rep. � 470 (2.4)Cyprus � 463 (1.9)
Australia � 545 (3.9)Austria � 558 (3.7)Belgium (Fr) � 471 (2.8)Bulgaria � 565 (5.3)Netherlands � 560 (5.0)Scotland � 517 (5.2)
Colombia � 411 (4.1)†1 Germany � 531 (4.8)
Romania � 486 (4.7)Slovenia � 560 (2.5)
Denmark � 478 (3.1)Greece � 497 (2.2)Thailand � 525 (3.7)
1 Israel � 524 (5.7)Kuwait � 430 (3.7)South Africa � 326 (6.6)
5th 25th 75th 95th
Mean and Confidence Interval (±2SE)
Percentiles of Performance
516International Average =(Average of all Country Means)
Countries Not Satisfying Guidelines for Sample Participation Rates (See Appendix A for Details):
Countries Not Meeting Age/Grade Specifications (High Percentage of Older Students; See Appendix A for Details):
Countries With Unapproved Sampling Procedures at Classroom Level (See Appendix A for Details):
Unapproved Sampling Procedures at Classroom Level and Not Meeting Other Guidelines (See Appendix A for Details):
C H A P T E R 1
19
1 National Desired Population does not cover all of International Desired Population (see Table A.3).
2 National Defined Population covers less than 90 percent of National Desired Population (see Table A.3).
† Met guidelines for sample participation rates only after replacement schools were included (see Appendix A for details).
✦ The TIMSS Coverage Index (TCI) is an estimate of the percentage of the school-leaving age cohort covered by the TIMSS final-yearstudent sample.
* See Table 1.2 for more information about the grades tested in each country.
( ) Standard errors appear in parentheses. Because results are rounded to the nearest whole number, some totals may appear inconsistent.
Table 1.7Distributions of Achievement in Mathematics Literacy - Final Year of Secondary School*
SO
UR
CE
: IE
A T
hird
Inte
rnat
iona
l Mat
hem
atic
s an
d S
cien
ce S
tudy
(T
IMS
S),
199
4-95
.
Country mean significantly higherthan international mean
Country mean significantly lowerthan international mean
No statistically significant differencebetween country mean andinternational mean
� =
� =
� =
200 250 300 350 400 450 550 600 650 700 750 800
5th 25th 75th 95th
Mean and Confidence Interval (±2SE)
Percentiles of Performance
Sweden � 552 (4.3) 71%
Switzerland � 540 (5.8) 82%† New Zealand � 522 (4.5) 70%
Hungary � 483 (3.2) 65%2 Russian Federation � 471 (6.2) 48%1 Lithuania � 469 (6.1) 43%
Czech Republic � 466 (12.3) 78%2 Cyprus � 446 (2.5) 48%
Australia � 522 (9.3) 68%2 Austria � 518 (5.3) 76%
Canada � 519 (2.8) 70%
France � 523 (5.1) 84%
Iceland � 534 (2.0) 55%1 Italy � 476 (5.5) 52%
Norway � 528 (4.1) 84%
United States � 461 (3.2) 63%
† Germany � 495 (5.9) 75%
Denmark � 547 (3.3) 58%2 Netherlands � 560 (4.7) 78%
Slovenia � 512 (8.3) 88%
South Africa � 356 (8.3) 49%
500International Average =(Average of all Country Means)
500
Countries Not Satisfying Guidelines for Sample Participation Rates (See Appendix A for Details)
Countries With Unapproved Student Sampling (See Appendix A for Details)
Countries With Unapproved Sampling Procedures and Low Participation Rates (See Appendix A for Details)
Country Mean TCI✦ Mathematics Literacy Achievement Scale Score

C H A P T E R 1
20
1 National Desired Population does not cover all of International Desired Population (see Table A.3).
2 National Defined Population covers less than 90 percent of National Desired Population (see Table A.3).
† Met guidelines for sample participation rates only after replacement schools were included (see Appendix A for details).
✦ The TIMSS Coverage Index (TCI) is an estimate of the percentage of the school-leaving age cohort covered by the TIMSS final-yearstudent sample.
* See Table 1.2 for more information about the grades tested in each country.
( ) Standard errors appear in parentheses. Because results are rounded to the nearest whole number, some totals may appear inconsistent.
Table 1.8Distributions of Achievement in Science Literacy - Final Year of Secondary School*
SO
UR
CE
: IE
A T
hird
Inte
rnat
iona
l Mat
hem
atic
s an
d S
cien
ce S
tudy
(T
IMS
S),
199
4-95
.
Country mean significantly higherthan international mean
Country mean significantly lowerthan international mean
No statistically significant differencebetween country mean andinternational mean
� =
� =
� =
200 250 300 350 400 450 550 600 650 700 750 800
5th 25th 75th 95th
Mean and Confidence Interval (±2SE)
Percentiles of Performance
Country Mean TCI✦ Science Literacy Achievement Scale Score
Sweden � 559 (4.4) 71%† New Zealand � 529 (5.2) 70%
Switzerland � 523 (5.3) 82%
Czech Republic � 487 (8.8) 78%2 Russian Federation � 481 (5.7) 48%
Hungary � 471 (3.0) 65%1 Lithuania � 461 (5.7) 43%2 Cyprus � 448 (3.0) 48%
Australia � 527 (9.8) 68%2 Austria � 520 (5.6) 76%
Canada � 532 (2.6) 70%
France � 487 (5.1) 84%
Iceland � 549 (1.5) 55%1 Italy � 475 (5.3) 52%
Norway � 544 (4.1) 84%
United States � 480 (3.3) 63%
† Germany � 497 (5.1) 75%
Denmark � 509 (3.6) 58%2 Netherlands � 558 (5.3) 78%
Slovenia � 517 (8.2) 88%
South Africa � 349 (10.5) 49%
500International Average =(Average of all Country Means)
500
Countries Not Satisfying Guidelines for Sample Participation Rates (See Appendix A for Details)
Countries With Unapproved Student Sampling (See Appendix A for Details)
Countries With Unapproved Sampling Procedures and Low Participation Rates (See Appendix A for Details)