chapter 1 data collection · 2017-10-21 · any subset of the population. 3. individual 4....
TRANSCRIPT

Copyright © 2013 Pearson Education, Inc.
1
Chapter 1
Data Collection
Section 1.1
1. Statistics is the science of collecting, organizing, summarizing and analyzing information in order to draw conclusions and answer questions. In addition, statistics is about providing a measure of confidence in any conclusions.
2. The population is the group to be studied as defined by the research objective. A sample is any subset of the population.
3. Individual
4. Descriptive; Inferential
5. Statistic; Parameter
6. Variables
7. 18% is a parameter because it describes a population (all of the governors).
8. 72% is a parameter because it describes a population (the entire class).
9. 32% is a statistic because it describes a sample (the high school students surveyed).
10. 10.0% is a statistic because it describes a sample (the youths surveyed).
11. 0.366 is a parameter because it describes a population (all of Ty Cobb’s at-bats).
12. 39 years, 11 months, 15 days is a parameter because it describes a population (all the men who have walked on the moon).
13. 23% is a statistic because it describes a sample (the 6,076 adults studied).
14. 44% is a statistic because it describes a sample (the 100 adults interviewed).
15. Qualitative 16. Quantitative
17. Quantitative 18. Qualitative
19. Quantitative 20. Quantitative
21. Qualitative 22. Qualitative
23. Discrete 24. Continuous
25. Continuous 26. Discrete
27. Continuous 28. Continuous
29. Discrete 30. Continuous
31. Nominal 32. Ordinal
33. Ratio 34. Interval
35. Ordinal 36. Nominal
37. Ratio 38. Interval
39. The population consists of all teenagers 13 to 17 years old who live in the United States. The sample consists of the 1,028 teenagers 13 to 17 years old who were contacted by the Gallup Organization.
40. The population consists of all bottles of Coca-Cola filled by that particular machine on October 15. The sample consists of the 50 bottles of Coca-Cola that were selected by the quality control manager.
41. The population consists of all of the soybean plants in this farmer’s crop. The sample consists of the 100 soybean plants that were selected by the farmer.
42. The population consists of all households within the United States. The sample consists of the 50,000 households that are surveyed by the U.S. Census Bureau.
43. The population consists of all women 27 to 44 years of age with hypertension. The sample consists of the 7,373 women 27 to 44 years of age with hypertension who were included in the study.
44. The population consists of all full-time students enrolled at this large community college. The sample consists of the 128 full-time students who were surveyed by the administration.

Chapter 1: Data Collection
Copyright © 2013 Pearson Education, Inc.
2
45. Individuals: Motorola Droid X, Motorola Droid 2, Apple iPhone 4, Samsung Epic 4G, Samsung Captivate. Variables: Weight (ounces), Service Provider, Depth (inches). Data for weight: 5.47, 5.96, 4.8, 5.5, 4.5 (ounces); Data for service provider: Verizon, Verizon, ATT, Sprint, ATT; Data for depth: 0.39, 0.53, 0.37, 0.6, 0.39 (inches). The variable weight is continuous; the variable service provider is qualitative; the variable depth is continuous.
46. Individuals: 3 Series, 5 Series, 6 Series, 7 Series, X3, Z4 Roadster Variables: Body Style, Weight (lb), Number of Seats Data for body style: Coupe, Sedan, Convertible, Sedan, Sport utility, Coupe; Data for weight: 3362, 4056, 4277, 4564, 4012, 3505m (lb); Data for number of seats: 4, 5, 4, 5, 5, 2. The variable body style is qualitative; the variable weight is continuous; the variable number of seats is discrete.
47. Individuals: Alabama, Colorado, Indiana, North Carolina, Wisconsin. Variables: Minimum age for Driver’s License (unrestricted); mandatory belt-use seating positions, maximum allowable speed limit (rural interstate) in 2007. Data for minimum age for driver’s license: 17, 17, 18, 16, 18; Data for mandatory belt-use seating positions: front, front, all, all, all; Data for maximum allowable speed limit (rural interstate) 2007: 70, 75, 70, 70, 65 (mph.) The variable minimum age for driver’s license is continuous; the variable mandatory belt-use seating positions is qualitative; the variable maximum allowable speed limit (rural interstate) 2007 is continuous (although only discrete values are typically chosen for speed limits.)
48. Individuals: Apple iPod Touch, Zune HD, SanDisk Sansa Clip+, Sony X-Series Walkman, Apple iPod Nano. Variables: Rating, Memory (GB), Audio Playback Time (hours). Data for rating: Outstanding, Excellent,
Excellent, Excellent, Very Good; Data for memory: 32, 32, 4, 16, 8 (GB); Data for audio playback time: 40, 33, 15, 33, 24 (hours). The variable rating is qualitative; the variable memory is discrete (because memory ultimately comes down to a finite number of bits available); the variable audio playback time is continuous (playback time is measured, but the data have been rounded to the nearest whole hour.)
49. (a) The research objective is to determine if adolescents who smoke have a lower IQ than nonsmokers.
(b) The population is all adolescents aged 18-21. The sample consisted of 20,211 18-year-old Israeli military recruits.
(c) Descriptive statistics: The average IQ of the smokers was 94, and the average IQ of nonsmokers was 101.
(d) The conclusion is that individuals with a lower IQ are more likely to choose to smoke.
50. (a) The research objective is to determine if the application of duct tape is as effective as cryotherapy in the treatment of common warts.
(b) The population is all people with warts. The sample consisted of 51 patients with warts.
(c) Descriptive statistics: 85% of patients in group 1 and 60% of patients in group 2 had complete resolution of their warts.
(d) The conclusion is that duct tape is significantly more effective in treating warts than cryotherapy.
51. (a) The research objective is to determine the proportion of adult Americans who believe the Federal government wastes 51 cents or more of every dollar.
(b) The population is all adult Americans aged 18 years or older.
(c) The sample is the 1026 American adults aged 18 years or older that were surveyed.

Section 1.1: Introduction to the Practice of Statistics
Copyright © 2013 Pearson Education, Inc.
3
(d) Descriptive statistics: Of the 1026 individuals surveyed, 35% indicated that 51 cents or more is wasted.
(e) From this study, one can infer that many Americans believe the Federal government wastes much of the money collected in taxes.
52. (a) The research objective is to determine what proportion of the population of employees in the United States are currently participating in the employer sponsored automatic payroll deduction for a 401(k) plan to save for retirement.
(b) The population is all employees in the United States.
(c) The sample is all employees in the United States.
(d) Descriptive statistics: 27% of the 1172 employees surveyed indicated that they were participating in the employer sponsored automatic payroll deduction for a 401(k) plan to save for retirement.
(e) The conclusion is that the majority of employees do not participate in the employer sponsored automatic payroll deduction for a 401(k) plan to save for retirement
53. Jersey number is nominal (the numbers generally indicate a type of position played). However, if the researcher feels that lower caliber players received higher numbers, then jersey number would be ordinal since players could be ranked by their number.
54. (a) Nominal; the ticket number is categorized as a winner or a loser.
(b) Ordinal; the ticket number gives an indication as to the order of arrival of guests.
(c) Ratio; the implication is that the ticket number gives an indication of the number of people attending the party.
55. (a) The research question is to determine the role that TV watching by children younger than 3 plays in future attention problems for the children.
(b) The population of interest is all children under the age of 3 years.
(c) The sample consisted of the 967 children whose parents answered questions about TV habits and behavior issues.
(d) Descriptive statistic: The risk of attention problems five years later doubled for each hour per day kids under 3 watched violent child-oriented programs.
(e) Inference: Children under the age of 3 years should not watch television. If they do watch, it should be educational and not violent child-oriented entertainment. Shows that are violent double the risk of attention problems for each additional hour watched each day. Even educational programs can result in a substantial risk for attention problems.
56. Quantitative variables are numerical measures such that meaningful arithmetic operations can be performed on the values of the variable. Qualitative variables describe an attribute or characteristic of the individual that allows researchers categorize the individual.
57. The values of a discrete random variable result from counting. The values of a continuous random variable result from a measurement.
58. The four levels of measurement of a variable are nominal, ordinal, interval, and ratio. Examples: Nominal—brand of clothing; Ordinal—size of a car (small, mid-size, large); Interval—temperature (in degrees Celsius); Ratio—number of students in a class (Examples will vary.)
59. We say data vary, because when we draw a random sample from a population, we do not know which individuals will be included. If we were to take another random sample, we would have different individuals and therefore different data. This variability affects the results of a statistical analysis because the results would differ if a study is repeated.
60. The Process of Statistics is to (1) identify the research objective, which means to determine what should be studied and what we hope to learn; (2) collect the data needed to answer the research question, which is typically done by taking a random sample from a population; (3) describe the data, which is done by presenting descriptive statistics; and (4) perform inference, in which the results are generalized to a larger population.
Chapter 1: Data Collection
Copyright © 2013 Pearson Education, Inc.
4
61. Age could be considered a discrete random variable. A random variable can be “discretized” by allowing, for example, only whole numbers to be recorded.
Section 1.2
1. The response variable is the variable of interest in a research study. An explanatory variable is a variable that affects (or explains) the value of the response variable. In research, we want to see how changes in the value of the explanatory variable affect the value of the response variable.
2. An observational study uses data obtained by studying individuals in a sample without trying to manipulate or influence the variable(s) of interest. In a designed experiment, a treatment is applied to the individuals in a sample in order to isolate the effects of the treatment on a response variable. Only an experiment can establish causation between an explanatory variable and a response variable. Observational studies can indicate a relationship, but cannot establish causation.
3. Confounding exists in a study when the effects of two or more explanatory variables are not separated. So any relation that appears to exist between a certain explanatory variable and the response variable may be due to some other variable or variables not accounted for in the study. A lurking variable is a variable not accounted for in a study, but one that affects the value of the response variable.
4. The choice between an observational study and an experiment depends on the circumstances involved. Sometimes there are ethical reasons why an experiment cannot be conducted. Other times the researcher may conduct an observational study first to validate a belief prior to investing a large amount of time and money into a designed experiment. A designed experiment is preferred if ethics, time, and money are not an issue.
5. Cross-sectional studies collect information at a specific point in time (or over a very short period of time). Case-control studies are retrospective (they look back in time). Also, individuals that have a certain characteristic (such as cancer) in a case-control study are
matched with those that do not have the characteristic. Case-control studies are typically superior to cross-sectional studies. They are relatively inexpensive, provide individual level data, and give longitudinal information not available in a cross-sectional study.
6. A cohort study identifies the individuals to participate and then follows them over a period of time. During this period, information about the individuals is gathered, but there is no attempt to influence the individuals. Cohort studies are superior to case-control studies because cohort studies do not require recall to obtain the data.
7. There is a perceived benefit to obtaining a flu shot, so there are ethical issues in intentionally denying certain seniors access to the treatment.
8. A retrospective study looks at data from the past either through recall or existing records. A prospective study gathers data over time by following the individuals in the study and recording data as they occur.
9. This is an observational study because the researchers merely observed existing data. There was no attempt by the researchers to manipulate or influence the variable(s) of interest.
10. This is an experiment because the researchers intentionally changed the value of the explanatory variable (medication dose) to observe a potential effect on the response variable (cancer growth).
11. This is an experiment because the explanatory variable (teaching method) was intentionally varied to see how it affected the response variable (score on proficiency test).
12. This is an observational study because no attempt was made to influence the variable of interest. Voting choices were merely observed.
13. This is an observational study because the survey only observed preference of Coke or Pepsi. No attempt was made to manipulate or influence the variable of interest.
14. This is an experiment because the researcher intentionally imposed treatments on individuals in a controlled setting.

Section 1.2: Observational Studies vs. Designed Experiments
Copyright © 2013 Pearson Education, Inc.
5
15. This is an experiment because the explanatory variable (carpal tunnel treatment regimen) was intentionally manipulated in order to observe potential effects on the response variable (level of pain).
16. This is an observational study because the conservation agents merely observed the fish to determine which were carrying parasites. No attempt was made to manipulate or influence any variable of interest.
17. (a) This is a cohort study because the researchers observed a group of people over a period of time.
(b) The response variable is whether the individual has heart disease or not. The explanatory variable is whether the individual is happy or not.
(c) There may be confounding due to lurking variables. For example, happy people may be more likely to exercise, which could affect whether they will have heart disease or not.
18. (a) This is a cross-sectional study because the researchers collected information about the individuals at a specific point in time.
(b) The response variable is whether the woman has nonmelanoma skin cancer or not. The explanatory variable is the daily amount of caffeinated coffee consumed.
(c) It was necessary to account for these variables to avoid confounding due to lurking variables..
19. (a) This is an observational study because the researchers simply administered a questionnaire to obtain their data. No attempt was made to manipulate or influence the variable(s) of interest. This is a cross-sectional study because the researchers are observing participants at a single point in time.
(b) The response variable is body mass index. The explanatory variable is whether a TV is in the bedroom or not.
(c) Answers will vary. Some lurking variables might be the amount of exercise per week and eating habits. Both of these variables can affect the body mass index of an individual.
(d) The researchers attempted to avoid confounding due to lurking variables by taking into account such variables as ‘socioeconomic status’.
(e) No. Since this was an observational study, we can only say that a television in the bedroom is associated with a higher body mass index.
20. (a) This is on observational study because the researchers merely observed the individuals included in the study. No attempt was made to manipulate or influence any variable of interest. This is a cohort study because the researchers identified the individuals to be included in the study, then followed them for a period of time (7 years).
(b) The response variable is weight gain. The explanatory variable is whether the individual is married/cohabitating or not.
(c) Answers will vary. Some potential lurking variables are eating habits, exercise routine, and whether the individual has children.
(d) No. Since this is an observational study, we can only say that being married or cohabitating is associated with weight gain.
21. Answers will vary. This is a prospective, cohort observational study. The response variable is whether the worker had cancer or not and the explanatory variable is the amount of electromagnetic field exposure. Some possible lurking variables include eating habits, exercise habits, and other health related variables such as smoking habits. Genetics (family history) could also be a lurking variable. This was an observational study, and not an experiment, so the study only concludes that high electromagnetic field exposure is associated with higher cancer rates. The author reminds us that this is an observational study, so there is no direct control over the variables that may affect cancer rates. He also points out that while we should not simply dismiss such reports, we should consider the results in conjunction with results from future studies. The author concludes by mentioning known ways (based on extensive study) of reducing cancer risks that can currently be done in our lives.

Chapter 1: Data Collection
Copyright © 2013 Pearson Education, Inc.
6
22. This is a cross-sectional study since individuals were observed at a specific point in time. Although information was gathered at two different times, individuals were not followed over a time period, nor did they have to rely on recall for information. That is, the study was neither prospective nor retrospective.
Some lurking variables that were accounted for are cultural differences and parents’ education level.
23. (a) The research objective is to determine whether lung cancer is associated with exposure to tobacco smoke within the household.
(b) This is a case-controlled study because there is a group of individuals with a certain characteristic (lung cancer but never smoked) being compared to a similar group without the characteristic (no lung cancer and never smoked). The study is retrospective because lifetime residential histories were compiled and analyzed.
(c) The response variable is whether the individual has lung cancer or not. This is a qualitative variable.
(d) The explanatory variable is the number of “smoker years”. This is a quantitative variable.
(e) Answers will vary. Some possible lurking variables are household income, exercise routine, and exposure to tobacco smoke outside the home.
(f) The conclusion of the study is that approximately 17% of lung cancer cases among nonsmokers can be attributed to high levels of exposure to tobacco smoke during childhood and adolescence. No, we cannot say that exposure to household tobacco smoke causes lung cancer since this is only an observational study. We can, however, conclude that lung cancer is associated with exposure to tobacco smoke in the home.
(g) An experiment involving human subjects is not possible for ethical reasons. Researchers would be able to conduct an experiment using laboratory animals, such as rats.
Section 1.3
1. The frame is a list of all the individuals in the population.
2. Simple random sampling occurs when every possible sample of size n has an equally likely chance of occurring.
3. Sampling without replacement means that no individual may be selected more than once as a member of the sample.
4. Random sampling is a technique that uses chance to select individuals from a population to be in a sample. It is used because it maximizes the likelihood that the individuals in the sample are representative of the individuals in the population. In convenience sampling, the individuals in the sample are selected in the quickest and easiest way possible (e.g. the first 20 people to enter a store). Convenience samples likely do not represent the population of interest because chance was not used to select the individuals.
5. Answers will vary. We will use one-digit labels and assign the labels across each row (i.e. Pride and Prejudice – 0, The Sun Also Rises – 1, and so on). Starting at row 5, column 11, and proceeding downward, we obtain the following labels: 8, 4, 3 In this case, the 3 books in the sample would be As I Lay Dying, A Tale of Two Cities, and Crime and Punishment. Different labeling order, different starting points in Table I in Appendix A, or use of technology will likely yield different samples.
6. Answers will vary. We will use one-digit labels and assign the labels across each row (i.e. Mady – 0, Breanne – 1, and so on). Starting at row 11, column 06, and then proceeding downward, we obtain the following labels: 1, 5 In this case, the two captains would be Breanne and Payton. Different labeling order, different starting points in Table I in Appendix A, or use of technology will likely yield different results.
7. (a) {616, 630}, {616, 631}, {616, 632}, {616, 645}, {616, 649}, {616, 650}, {630, 631}, {630, 632}, {630, 645}, {630, 649}, {630, 650}, {631, 632}, {631, 645}, {631, 649}, {631, 650}, {632, 645}, {632, 649}, {632, 650}, {645, 649}, {645, 650}, {649, 650}

Section 1.3: Simple Random Sampling
Copyright © 2013 Pearson Education, Inc.
7
(b) There is a 1 in 21 chance that the pair of courses will be EPR 630 and EPR 645.
8. (a) {1, 2}, {1, 3}, {1, 4}, {1, 5}, {1, 6}, {1, 7}, {2, 3}, {2, 4}, {2, 5}, {2, 6}, {2, 7}, {3, 4}, {3, 5}, {3, 6}, {3, 7}, {4, 5}, {4, 6}, {4, 7}, {5, 6}, {5, 7}, {6, 7}
(b) There is a 1 in 21 chance that the pair The United Nations and Amnesty International will be selected.
9. (a) Starting at row 5, column 22, using two-digit numbers, and proceeding downward, we obtain the following values: 83, 94, 67, 84, 38, 22, 96, 24, 36, 36, 58, 34,.... We must disregard 94 and 96 because there are only 87 faculty members in the population. We must also disregard the second 36 because we are sampling without replacement. Thus, the 9 faculty members included in the sample are those numbered 83, 67, 84, 38, 22, 24, 36, 58, and 34.
(b) Answers will vary depending on the type of technology used. If using a TI-84 Plus, the sample will be: 4, 20, 52, 5, 24, 87, 67, 86, and 39.
Note: We must disregard the second 20 because we are sampling without replacement.
10. (a) Starting at row 11, column 32, using four-digit numbers, and proceeding downward, we obtain the following values: 2869, 5518, 6635, 2182, 8906, 0603, 2654, 2686, 0135, 7783, 4080, 6621, 3774, 7887, 0826, 0916, 3188, 0876, 5418, 0037, 3130, 2882, 0662,…. We must disregard 8906, 7783, and 7887 because there are only 7656 students in the population. Thus, the 20 students included in the sample are those numbered 2869, 5518, 6635, 2182, 0603, 2654, 2686, 0135, 4080, 6621, 3774, 0826, 0916, 3188, 0876, 5418, 0037, 3130, 2882, and 0662.
(b) Answers may vary depending on the type of technology used. If using a TI-84 Plus, the sample will be: 6658, 4118, 9, 4828, 3905, 454, 2825, 2381, 495, 4445, 4455, 5759, 5397, 7066, 3404, 6667, 5074, 3777, 3206, 5216.
11. (a) Answers will vary depending on the technology used (including a table of random digits). Using a TI-84 Plus graphing calculator with a seed of 17 and the labels provided, our sample would be North Dakota, Nevada, Tennessee, Wisconsin, Minnesota, Maine, New Hampshire, Florida, Missouri, and Mississippi.
(b) Repeating part (a) with a seed of 18, our sample would be Michigan, Massachusetts, Arizona, Minnesota, Maine, Nebraska, Georgia, Iowa, Rhode Island, Indiana.
12. (a) Answers will vary depending on the technology used (including a table of random digits). Using a TI-84 Plus graphing calculator with a seed of 98 and the labels provided, our sample would be Jefferson, Carter, Madison, Obama, Pierce, Buchanan, Ford, Clinton.
(b) Repeating part (a) with a seed of 99, our sample would be L. B. Johnson, Truman, Pierce, Garfield, Obama, Grant, George H. Bush, T. Roosevelt.

Chapter 1: Data Collection
Copyright © 2013 Pearson Education, Inc.
8
13. (a) The list provided by the administration serves as the frame. Number each student in the list of registered students, from 1 to 19,935. Generate 25 random numbers, without repetition, between 1 and 19,935 using a random number generator or table. Select the 25 students with these numbers.
(b) Answers will vary.
14. (a) The list provided by the mayor serves as the frame. Number each resident in the list supplied by the mayor, from 1 to 5832. Generate 20 random numbers, without repetition, between 1 and 5832 using a random number generator or table. Select the 20 residents with these numbers.
(b) Answers will vary.
15. Answers will vary. Members should be numbered 1 – 32, though other numbering schemes are possible (e.g. 0 – 31). Using a table of random digits or a random-number generator, four different numbers (labels) should be selected. The names corresponding to these numbers form the sample.
16. Answers will vary. Employees should be numbered 1 – 29, though other numbering schemes are possible (e.g. 0 – 28). Using a table of random digits or a random-number generator, four different numbers (labels) should be selected. The names corresponding to these numbers form the sample.
Section 1.4
1. Stratified random sampling may be appropriate if the population of interest can be divided into groups (or strata) that are homogeneous and non-overlapping.
2. Systematic sampling does not require a frame.
3. Convenience samples are typically selected in a nonrandom manner. This means the results are not likely to represent the population. Convenience samples may also be self-selected, which will frequently result in small portions of the population being overrepresented.
4. Cluster sample
5. Stratified sample
6. False. In a systematic random sample, every kth individual is selected from the population.
7. False. In many cases, other sampling techniques may provide equivalent or more information about the population with less “cost” than simple random sampling.
8. True. When the clusters are heterogeneous, the heterogeneity of each cluster likely resembles the heterogeneity of the population. In such cases, fewer clusters with more individuals from each cluster are preferred.
9. True. Because the individuals in a convenience sample are not selected using chance, it is likely that the sample is not representative of the population.
10. False. With stratified samples, the number of individuals sampled from each strata should be proportional to the size of the strata in the population.
11. Systematic sampling. The quality-control manager is sampling every 8th chip.
12. Cluster sampling. The commission tests all members of the selected teams (clusters).
13. Cluster sampling. The airline surveys all passengers on selected flights (clusters).
14. Stratified sampling. The congresswoman samples some individuals from each of three different income brackets (strata).
15. Simple random sampling. Each known user of the product has the same chance of being included in the sample.
16. Convenience sampling. The radio station is relying on voluntary response to obtain the sample data.
17. Cluster sampling. The farmer samples all trees within the selected subsections (clusters).
18. Stratified sampling. The school official takes a sample of students from each of the four grades (strata).
19. Convenience sampling. The research firm is relying on voluntary response to obtain the sample data.
20. Systematic sampling. The presider is sampling every 5th person attending the lecture.

Section 1.4: Other Effective Sampling Methods
Copyright © 2013 Pearson Education, Inc.
9
21. Stratified sampling. Shawn takes a sample of measurements during each of the four time intervals (strata).
22. Simple random sampling. Each club member has the same chance of being selected for the survey.
23. The numbers corresponding to the 20 clients selected are 16 , 16 25 41+ = , 41 25 66+ = , 66 25 91+ = , 91 25 116+ = , 141, 166, 191, 216, 241, 266, 291, 316, 341, 366, 391, 416, 441, 466, 491.
24. Since the number of clusters is more than 100, but less than 1000, we assign each cluster a three-digit label between 001 and 795. Starting at row 8, column 38 in Table I of Appendix A, and proceeding downward, the 10 clusters selected are numbered 763, 185, 377, 304, 626, 392, 315, 084, 565, and 508. Note that we discard 822 and 955 in reading the table because we have no clusters with these labels. We also discard the second occurrence of 377 because we cannot select the same cluster twice.
25. Answers will vary. To obtain the sample, number the Democrats 1 to 16 and obtain a simple random sample of size 2. Then number the Republicans 1 to 16 and obtain a simple random sample of size 2. Be sure to use a different starting point in Table I or a different seed for each stratum.
For example, using a TI-84 Plus graphing calculator with a seed of 38 for the Democrats and 40 for the Republicans, the numbers selected would be 6, 9 for the Democrats and 14, 4 for the Republicans. If we had numbered the individuals down each column, the sample would consist of Haydra, Motola, Engler, and Thompson.
26. Answers will vary. To obtain the sample, number the managers 1 to 8 and obtain a simple random sample of size 2. Then number the employees 1 to 21 and obtain a simple random sample of size 4. Be sure to use a different starting point in Table I or a different seed for each stratum.
For example, using a TI-84 Plus graphing calculator with a seed of 18 for the managers and 20 for the employees, the numbers selected would be 4, 1 for the managers and 20, 3, 11, 9 for the employees. If we had numbered the individuals down each column, the sample would consist of Carlisle, Lindsey, Weber, Bryant, Hall, and Gow.
27. (a) 4502
90.04 9050
N
n= = → ; Thus, 90k = .
(b) Randomly select a number between 1 and 90. Suppose that we select 15. Then the individuals to be surveyed will be the 15th, 105th, 195th, 285th, and so on up to the 4425th employee on the company list.
28. (a) 945035
7269.5 7269130
N
n= = → ; Thus,
7269k = .
(b) Randomly select a number between 1 and 7269. Suppose that we randomly select 2000. Then we will survey the individuals numbered 2000, 9269, 16,538, and so on up to the individual numbered 939,701.
29. Simple Random Sample: Number the students from 1 to 1280. Use a table of random digits or a random-number generator to randomly select 128 students to survey.
Stratified Sample: Since class sizes are similar, we would
want to randomly select 128
432
=
students from each class to be included in the sample.
Cluster Sample: Since classes are similar in size and makeup, we would want to randomly
select 128
432
= classes and include all the
students from those classes in the sample.

Chapter 1: Data Collection
Copyright © 2013 Pearson Education, Inc.
10
30. No. The clusters were not randomly selected. This would be considered convenience sampling.
31. Answers will vary. One design would be a stratified random sample, with two strata being commuters and noncommuters, as these two groups each might be fairly homogeneous in their reactions to the proposal.
32. Answers will vary. One design would be a cluster sample, with classes as the clusters. Randomly select clusters and then survey all the students in the selected classes. However, care would need to be taken to make sure that no one was polled twice. Since this would negate some of the ease of cluster sampling, a simple random sample might be the more suitable design.
33. Answers will vary. One design would be a cluster sample, with the clusters being city blocks. Randomly select city blocks and survey every household in the selected blocks.
34. Answers will vary. One appropriate design would be a systematic sample, clocking the speed of every tenth car, for example.
35. Answers will vary. Since the company already has a list (frame) of 6,600 individuals with high cholesterol, a simple random sample would be an appropriate design.
36. Answers will vary. Since a list of all the households in the population exists, a simple random sample is possible. Number the households from 1 to N, then use a table of random digits or a random-number generator to select the sample.
37. (a) For a political poll, a good frame would be all registered voters who have voted in the past few elections since they are more likely to vote in upcoming elections.
(b) Because each individual from the frame has the same chance of being selected, there is a possibility that one group may be over- or underrepresented.
(c) By using a stratified sample, the strategist can obtain a simple random sample within each strata (political party) so that the number of individuals in the sample is proportionate to the number of individuals in the population.
38. Random sampling means that the individuals chosen to be in the sample are selected by chance. Random sampling minimizes the chance that one part of the population is over- or underrepresented in the sample. However, it cannot guarantee that the sample will accurately represent the population.
39. Answers will vary.
40. Answers will vary.
Section 1.5
1. A closed question is one in which the respondent must choose from a list of prescribed responses. An open question is one in which the respondent is free to choose his or her own response. Closed questions are easier to analyze, but limit the responses. Open questions allow respondents to state exactly how they feel, but are harder to analyze due to the variety of answers and possible misinterpretation of answers.
2. A certain segment of the population is underrepresented if it is represented in the sample in a lower proportion than its size in the population.
3. Bias means that the results of the sample are not representative of the population. There are three types of bias: sampling bias, response bias, and nonresponse bias. Sampling bias is due to the use of a sample to describe a population. This includes bias due to convenience sampling. Response bias involves intentional or unintentional misinformation. This would include lying to a surveyor or entering responses incorrectly. Nonresponse bias results when individuals choose not to respond to questions or are unable to be reached. A census can suffer from response bias and nonresponse bias, but would not suffer from sampling bias.
4. Nonsampling error is the error that results from undercoverage, nonresponse bias, response bias, or data-entry errors. Essentially, it is the error that results from the process of obtaining and recording data. Sampling error is the error that results because a sample is being used to estimate information about a population. Any error that could also occur in a census is considered a nonsampling error.

Section 1.5: Bias in Sampling
Copyright © 2013 Pearson Education, Inc.
11
5. (a) Sampling bias. The survey suffers from undercoverage because the first 60 customers are likely not representative of the entire customer population.
(b) Since a complete frame is not possible, systematic random sampling could be used to make the sample more representative of the customer population.
6. (a) Sampling bias. The survey suffers from undercoverage because only homes in the southwest corner have a chance to be interviewed. These homes may have different demographics than those in other parts of the village.
(b) Assuming that households within any given neighborhood have similar household incomes, stratified sampling might be appropriate, with neighborhoods as the strata.
7. (a) Response bias. The survey suffers from response bias because the question is poorly worded.
(b) The survey should inform the respondent of the current penalty for selling a gun illegally and the question should be worded as: “Do you approve or disapprove of harsher penalties for individuals who sell guns illegally?” The order of “approve” and “disapprove” should be switched from one individual to the next.
8. (a) Response bias. The survey suffers from response bias because the wording of the question is ambiguous.
(b) The question might be worded more specifically as: “How many hours per night do you sleep, on average?”
9. (a) Nonresponse bias. Assuming the survey is written in English, non-English speaking homes will be unable to read the survey. This is likely the reason for the very low response rate.
(b) The survey can be improved by using face-to-face or phone interviews, particularly if the interviewers are multi-lingual.
10. (a) Nonresponse bias.
(b) The survey can be improved by using face-to-face or phone interviews, or possibly through the use of incentives.
11. (a) The survey suffers from sampling bias due to undercoverage and interviewer error. The readers of the magazine may not be representative of all Australian women, and advertisements and images in the magazine could affect the women’s view of themselves.
(b) A well-designed sampling plan not in a magazine, such as a cluster sample, could make the sample more representative of the population.
12. (a) The survey suffers from sampling bias due to a bad sampling plan (convenience sampling) and possible response bias due to misreported weights on driver’s licenses.
(b) The teacher could use cluster sampling or stratified sampling using classes throughout the day. Each student should be weighed to get a current and accurate weight measurement.
13. (a) Response bias due to a poorly worded question.
(b) The question should be reworded in a more neutral manner. One possible phrasing might be: “Do you believe that a marriage can be maintained after an extramarital relation?”
14. (a) Sampling bias. The frame is not necessarily representative of all college professors.
(b) To remedy this problem, the publisher could use cluster sampling and obtain a list of faculty from the human resources departments at selected colleges.
15. (a) Response bias. Students are unlikely to give honest answers if their teacher is administering the survey.
(b) An impartial party should administer the survey in order to increase the rate of truthful responses.
16. (a) Response bias. Residents are unlikely to give honest answers to uniformed police officers if their answer would be seen as negative by the police.

Chapter 1: Data Collection
Copyright © 2013 Pearson Education, Inc.
12
(b) An impartial party should administer the survey in order to increase the rate of truthful responses.
17. No. The survey still suffers from sampling bias due to undercoverage, nonresponse bias, and potentially response bias.
18. The General Social Survey uses random sampling to obtain individuals who take the survey, so the results of their survey are more likely to be representative of the population. However, it may suffer from response bias since the survey is conducted by personal interview rather than anonymously on the Internet. The online survey, while potentially obtaining more honest answers, is basically self-selected so may not be representative of the population, particularly if most respondents are clients of the family & wellness center seeking help with health or relationship problems.
19. It is very likely that the order of these two questions will affect the survey results. To alleviate the response bias, either question B could be asked first, or the order of the two questions could be rotated randomly.
20. It is very likely that the order of these two questions will affect the survey results. To alleviate the response bias, the order of the two questions could be rotated randomly. Prohibit is a strong word. People generally do not like to be prohibited from doing things. If the word must be used, it should be offset by the word “allow.” The use of the words “prohibit” and “allow” should be rotated within the question.
21. The company is using a reward in the form of the $5.00 payment and an incentive by telling the reader that his or her input will make a difference.
22. The two choices need to be rotated so that any response bias due to the ordering of the questions is minimized.
23. For random digit dialing, the frame is anyone with a phone (whose number is not on a do-not-call registry). Even those with unlisted numbers can still be reached through this method. Any household without a phone, households on the do-not-call registry, and homeless individuals are excluded. This could result in
sampling bias due to undercoverage if the excluded individuals differ in some way than those included in the frame.
24. Answers will vary. The use of caller ID has likely increased nonresponse bias of phone surveys since individuals may not answer calls from numbers they do not recognize. If individuals with caller ID differ in some way from individuals without caller ID, then phone surveys could also suffer from sampling bias due to undercoverage.
25. It is extremely likely, particularly if households on the do-not-call registry have a trait that is not part of those households that are not on the registry.
26. There is a higher chance that an individual at least 70 years of age will be at home when an interviewer makes contact.
27. Some non-sampling errors presented in the article as leading to incorrect exit polls were poorly trained interviewers, interviewer bias, and over representation of female voters.
28. – 32. Answers will vary.
33. The Literary Digest made an incorrect prediction due to sampling bias (an incorrect frame led to undercoverage) and nonresponse bias (due to the low response rate).
34. Answers will vary. (Gallup incorrectly predicted the outcome of the 1948 election because he quit polling weeks before the election and missed a large number of changing opinions.)
35. (a) The population of interest is all vehicles that travel on the road (or portion of the road) in question.
(b) The variable of interest is the speed of the vehicles.
(c) The variable is quantitative.
(d) Because speed has a ‘true zero’, it is at the ratio level of measurement.
(e) A census is not feasible. It would be impossible to obtain a list of all the vehicles that travel on the road.
(f) A sample is feasible, but not a simple random sample (since a complete frame is impossible). A systematic random sample would be a feasible alternative.

Section 1.6: The Design of Experiments
Copyright © 2013 Pearson Education, Inc.
13
(g) Answers will vary. One bias is sampling bias. If the city council wants to use the cars of residents who live in the neighborhood to gauge the prevailing speed, then individuals who are not part of the population were in the sample (likely a huge portion), so the sample is not representative of the intended population.
36. It is difficult for a frame to be completely accurate, since populations tend to change over time and there can be a delay in identifying individuals who have joined or left the population.
37. Nonresponse can be addressed by conducting callbacks or offering rewards.
38. Trained, skillful interviewers can illicit responses from individuals and help them give truthful responses.
39. Conducting a presurvey with open questions allows the researchers to use the most popular answers as choices on closed-question surveys.
40. Answers will vary. Phone surveys conducted in the evening may result in reaching more potential respondents; however some of these individuals could be upset by the intrusion.
41. Provided the survey was conducted properly and randomly, a high response rate will provide more representative results. When a survey has a low response rate, only those who are most willing to participate give responses. Their answers may not be representative of the whole population.
42. The order of questions on a survey should be carefully considered, so the responses are not affected by previous questions.
43. There is more than one type of CD. This can be interpreted as a medium used to store music or information electronically: a compact disk. It could also be understood as a special type of savings account: a certificate of deposit.
44. Higher response rates typically suggest that the sample represents the population well. Using rewards can help increase response rates, allowing researchers to better understand the population. There can be disadvantages to offering rewards as incentives. Some people
may hurry through the survey, giving superficial answers, just to obtain the reward.
Section 1.6
1. (a) An experimental unit is a person, object, or some other well-defined item upon which a treatment is applied.
(b) A treatment is a condition applied to an experimental unit. It can be any combination of the levels of the explanatory variables.
(c) A response variable is a quantitative or qualitative variable that measures a response of interest to the experimenter.
(d) A factor is a variable whose effect on the response variable is of interest to the experimenter. Factors are also called explanatory variables.
(e) A placebo is an innocuous treatment, such as a sugar pill, administered to a subject in a manner indistinguishable from an actual treatment.
(f) Confounding occurs when the effect of two explanatory variables on a response variable cannot be distinguished.
2. Replication occurs when each treatment is applied to more than one experimental unit.
3. In a single-blind experiment, subjects do not know which treatment they are receiving. In a double-blind experiment, neither the subject nor the researcher(s) in contact with the subjects knows which treatment is received.
4. Completely randomized; matched-pair
5. Blocking
6. True
7. (a) The researchers used an innocuous treatment to account for effects that would result from any treatment being given (i.e. the placebo effect). The placebo is the flavored water that looks and tastes like the sports drink. It serves as the baseline for which to compare the results when the noncaffeinated and caffeinated sports drinks are administered.

Chapter 1: Data Collection
Copyright © 2013 Pearson Education, Inc.
14
(b) Being double-blind means that neither the cyclists nor the researcher administering the treatments knew when the cyclists were given the caffeinated sports drink, the noncaffeinated sports drink, or the flavored-water placebo. Using a double-blind procedure is necessary to avoid any intentional or unintentional bias due to knowing which treatment is being given.
(c) Randomization is used to determine the order of the treatments for each subject.
(d) The population of interest is all athletes or individuals involved in prolonged exercise. The sample consists of the 16 highly trained cyclists studied.
(e) There are three treatments in the study: caffeinated sports drink, noncaffeinated sports drink, and a flavored-water placebo.
(f) The response variable is total work completed.
(g) A repeated-measure design takes measurements on the same subject using multiple treatments. A matched-pairs design is a special case of the repeated-measures design that uses only two treatments.
8. (a) The researchers used an innocuous treatment to account for effects that would result from any treatment being given (i.e. the placebo effect). The placebo is a drug that looks and tastes like topiramate and serves as the baseline against which to compare the results when topiramate is administered.
(b) Being double-blind means that neither the subject nor the researcher in contact with the subjects knows whether the placebo or topiramate is being administered. Using a double-blind procedure is necessary to avoid any intentional or unintentional bias due to knowing which treatment is being given.
(c) The subjects were randomly assigned to the treatment groups (either the placebo or topiramate).
(d) The population is all men and women aged 18 to 65 years diagnosed with alcohol dependence. The sample is the 371 men and women aged 18 to 65 years diagnosed with alcohol dependence who participated in the 14-week trial.
(e) There are two treatments in the study: 300 mg of topiramate or a placebo daily
(f) The response variable is the percentage of heavy drinking days.
_____________________________________________________________________________________________
9. (a) The response variable is the achievement test scores.
(b) Some factors are teaching methods, grade level, intelligence, school district, and teacher. Fixed: grade level, school district, teacher. Set at predetermined levels: teaching method.
(c) The treatments are the new teaching method and the traditional method. There are 2 levels of treatment.
(d) The factors that are not controlled are dealt with by random assignment into the two treatment groups.
(e) Group 2, using the traditional teaching method, serves as the control group.
(f) This experiment has a completely randomized design.
(g) The subjects are the 500 first-grade students from District 203 recruited for the study.

Section 1.6: The Design of Experiments
Copyright © 2013 Pearson Education, Inc.
15
(h)
Random assignmentof students
to treatments
Group 1:250 students
Group 2:250 students
Treatment 1:New method
Treatment 2:Traditional method
Compareachievement
test score
10. (a) The response variable is the proportion of subjects with a cold.
(b) Some factors are gender, age, geographic location, overall health, and drug intervention. Fixed: gender, age, location Set at predetermined levels: drug intervention
(c) The treatments are the experimental drug and the placebo. There are 2 levels of treatment.
(d) The factors that are not controlled are dealt with by random assignment into the two groups.
(e) This experiment has a completely randomized design.
(f) The subjects are the 300 adult males aged 25 to 29 who have the common cold.
(g)
Random assignment
of malesto treatments
Group 1:150 males
Group 2:150 males
Treatment 1:Experimental drug
Treatment 2:Placebo
Compareproportion of subjectswith colds
11. (a) This experiment has a matched-pairs design.
(b) The response variable is the level of whiteness.
(c) The explanatory variable is the whitening method. The treatments are Crest Whitestrips Premium in addition to brushing and flossing, and just brushing and flossing alone.
(d) Answers will vary. One other possible factor is diet. Certain foods and tobacco products are more likely to stain teeth. This could impact the level of whiteness.
(e) Answers will vary. One possibility is that using twins helps control for genetic factors such as weak teeth that may affect the results of the study.
12. (a) This experiment has a matched-pairs design.
(b) The response variable is the difference in test scores.
(c) The treatment is the mathematics course.

Chapter 1: Data Collection
Copyright © 2013 Pearson Education, Inc.
16
13. (a) This experiment has a completely randomized design.
(b) The population being studied is adults with insomnia.
(c) The response variable is the terminal wake time after sleep onset (WASO).
(d) The explanatory variable is the type of intervention. The treatments are cognitive behavioral therapy (CBT), muscle relaxation training (RT), and the placebo.
(e) The experimental units are the 75 adults with insomnia.
(f)
Random assignment
of adultsto treatments
Group 1:25 adults
Group 3:25 adults
Treatment 1:CBT
Treatment 3:Placebo
Compareterminal wake
time after sleep onset
Group 2:25 adults
Treatment 2:RT
14. (a) This experiment has a completely randomized design.
(b) The population being studied is adult outpatients diagnosed as having major depression and having a baseline Hamilton Rating Scale for Depression (HAM-D) score of at least 20.
(c) The response variable is the change in the HAM-D over the treatment period.
(d) The explanatory variable is the type of drug. The treatments are St. John’s wort extract and the placebo.
(e) The experimental units are the 200 adult outpatients diagnosed with depression.
(f) The control group is the placebo group.
(g)
Random assignmentof patients
to treatments
Group 1:100 patients
Group 2:100 patients
Treatment 1:St. John’s
wort extract
Treatment 2:Placebo
Comparechange in HAM-D
score
15. (a) This experiment has a completely randomized design.
(b) The population being studied is adults over 60 years old and in good health.
(c) The response variable is the standardized test of learning and memory.
(d) The factor set to predetermined levels (explanatory variable) is the drug. The treatments are 40 milligrams of ginkgo 3 times per day and the matching placebo.
Section 1.6: The Design of Experiments
Copyright © 2013 Pearson Education, Inc.
17
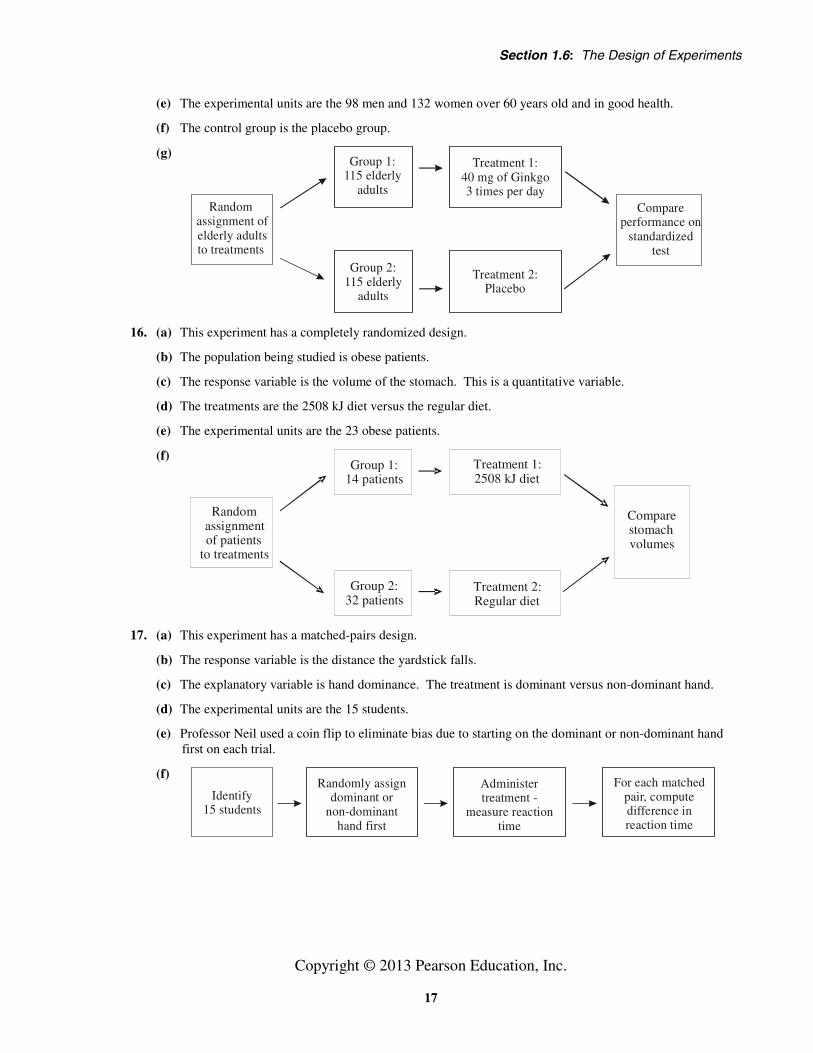
(e) The experimental units are the 98 men and 132 women over 60 years old and in good health.
(f) The control group is the placebo group.
(g)
Random assignment of elderly adultsto treatments
Group 1:115 elderly
adults
Group 2:115 elderly
adults
Treatment 1:40 mg of Ginkgo3 times per day
Treatment 2:Placebo
Compareperformance on
standardizedtest
16. (a) This experiment has a completely randomized design.
(b) The population being studied is obese patients.
(c) The response variable is the volume of the stomach. This is a quantitative variable.
(d) The treatments are the 2508 kJ diet versus the regular diet.
(e) The experimental units are the 23 obese patients.
(f)
17. (a) This experiment has a matched-pairs design.
(b) The response variable is the distance the yardstick falls.
(c) The explanatory variable is hand dominance. The treatment is dominant versus non-dominant hand.
(d) The experimental units are the 15 students.
(e) Professor Neil used a coin flip to eliminate bias due to starting on the dominant or non-dominant hand first on each trial.
(f)
Identify 15 students
Randomly assigndominant or
non-dominanthand first
For each matchedpair, computedifference inreaction time
Administertreatment -
measure reaction time
Random assignmentof patients
to treatments
Group 1:14 patients
Group 2:32 patients
Treatment 1:2508 kJ diet
Treatment 2:Regular diet
Comparestomachvolumes

Chapter 1: Data Collection
Copyright © 2013 Pearson Education, Inc.
18
18. (a) This experiment has a matched-pairs design.
(b) The response variable is the distance the ball is hit.
(c) The explanatory variable is the shaft type. The treatment is graphite shaft versus steel shaft.
(d) The experimental units are the 10 golfers.
(e) The golf pro used a coin flip to eliminate bias due to the type of shaft used first.
(f)
Identify 10 golfers
Randomly assigngraphite orsteel first
For each matchedpair, computedifference in
distance
Administertreatment -
measure distance
19. (a) This experiment has a randomized block design.
(b) The response variable is the score on the recall exam.
(c) The explanatory variable is the type of advertising. The treatments are print, radio, and television.
(d) Level of education is the variable that serves as the block.
(e)
300 volunteers:120 high school
120 college60 advanced
Block 1:High School
Block 2:College
Group 1:40 volunteers
Group 2:40 volunteers
Group 3:40 volunteers
Group 1:40 volunteers
Group 2:40 volunteers
Group 3:40 volunteers
Group 1:20 volunteers
Group 2:20 volunteers
Group 3:20 volunteers
Block 3:Advanced
Television
Radio
Television
Radio
Television
Radio
Comparerecall
Comparerecall
Comparerecall

Section 1.6: The Design of Experiments
Copyright © 2013 Pearson Education, Inc.
19
20. (a) This experiment has a randomized block design.
(b) The response variable is the total number of truancies.
(c) The explanatory variable is the type of intervention. The treatments are no intervention, positive reinforcement, and negative reinforcement.
(d) Income is the variable that serves as the block.
(e)
300 volunteers:120 low income
132 middle income48 upper income
Block 1:Low income
Block 2:Middle income
Group 1:40 volunteers
Group 2:40 volunteers
Group 3:40 volunteers
Group 1:44 volunteers
Group 2:44 volunteers
Group 3:44 volunteers
Group 1:16 volunteers
Group 2:16 volunteers
Group 3:16 volunteers
Block 3:Upper income
Negativereinforcement
Positivereinforcement
Nointervention
Comparecumulative
hours oftruancy
Negativereinforcement
Positivereinforcement
Nointervention
Negativereinforcement
Positivereinforcement
Nointervention
Comparecumulative
hours oftruancy
Comparecumulative
hours oftruancy
_____________________________________________________________________________________________
21. Answers will vary. Using a TI-84 Plus graphing calculator with a seed of 195, we would pick the volunteers numbered 8, 19, 10, 12, 13, 6, 17, 1, 4, and 7 to go into the experimental group. The rest would go into the control group. If the volunteers were numbered in the order listed, the experimental group would consist of Ann, Kevin, Christina, Eddie, Shannon, Randy, Tom, Wanda, Kim, and Colleen.
22. (a) This experiment has a completely randomized design.
(b) Answers will vary. Using a TI-84 Plus graphing calculator with a seed of 223, we would pick the volunteers numbered 6, 18, 13, 3, 19, 14, 8, 1, 17, and 5 to go into group 1.
23. Answers will vary. A completely randomized design is likely the best.
24. Answers will vary. A completely randomized design is likely the best.
25. Answers will vary. A matched-pairs design matched by type of exterior finish is likely the best.

Chapter 1: Data Collection
Copyright © 2013 Pearson Education, Inc.
20
26. Answers will vary. A matched-pairs design matched by car model is likely the best.
27. Answers will vary. A randomized block design blocked by type of car is likely the best.
28. Answers will vary. A randomized block design blocked by gender is likely the best.
29. (a) The response variable is blood pressure.
(b) Three factors that have been identified are daily consumption of salt, daily consumption of fruits and vegetables, and the body’s ability to process salt.
(c) The daily consumption of salt and the daily consumption of fruits and vegetables can be controlled. The body’s ability to process salt cannot be controlled. To deal with variability of the body’s ability to process salt, randomize experimental units to each treatment group.
(d) Answers will vary. Three levels of treatment might be a good choice – one level below the recommended daily allowance, one equal to the recommended daily allowance, and one above the recommended daily allowance.
30. Answers will vary.
31. Answers will vary.
32. Completely Randomized Design The researcher would randomly assign each subject to either drink Coke or Pepsi. The response variable would be whether the subject likes the soda or not. Preference rates would be compared at the end of the experiment. The subject would be blinded, but the researcher would not. Therefore, this would be a single-blind experiment.
Randomlyassign subjectsto colas
Group 2(half thesubjects)
Group 1(half thesubjects)
Coke
Pepsi
Comparepreferencerates
Matched-Pairs Design The researcher would randomly determine whether each subject drinks Coke first or Pepsi first. To avoid confounding, subjects should eat
something bland between drinks to remove any residual taste. The response variable would be either the proportion of subjects who prefer Coke or the proportion of subjects who prefer Pepsi. This would also be a single-blind experiment since the subject would not know which drink was first but the researcher would. The matched-pairs design is likely superior.
IdentifySubjects
Randomlyassign Cokeor Pepsifirst
Administertreatments -measure preference
For eachmatchedpair,determinewhich colais preferred.
33. (a) The research objective is to determine if nymphs of Brachytron pretense will control mosquitoes.
(b) The experiment is a completely randomized design.
(c) The response variable is mosquito larvae density. This is a discrete (because the larvae are counted), quantitative variable.
(d) The researchers controlled the introduction of nymphs of Brachytron pretense into water tanks containing mosquito larvae by setting the factor at predetermined levels. The treatments are nymphs added or no nymphs added.
(e) Some other factors that may affect the larvae of mosquitoes are temperature, amount of rainfall, fish, presence of other larvae, and sunlight.
(f) The population is all mosquito larvae in all breeding places. The sample consists of the mosquito larvae in the ten 300-liter outdoor, open concrete water tanks.
(g) During the study period, mosquito larvae density changed from 7.34 to 0.83 to 6.83 larvae per dip in the treatment tanks. The mosquito larvae density changed from 7.12 to 6.83 to 6.79 larvae per dip in the control tanks.
(h) The researchers controlled the experiment by first clearing the ten tanks of all non-mosquito larvae, nymphs, and fish so that only mosquito larvae were left in the tanks. Five tanks were treated with 10 nymphs of Brachytron pretense, while five tanks were left untreated, serving as a control group for baseline comparison.
Consumer Reports®: Emotional “Aspirin”
Copyright © 2013 Pearson Education, Inc.
21
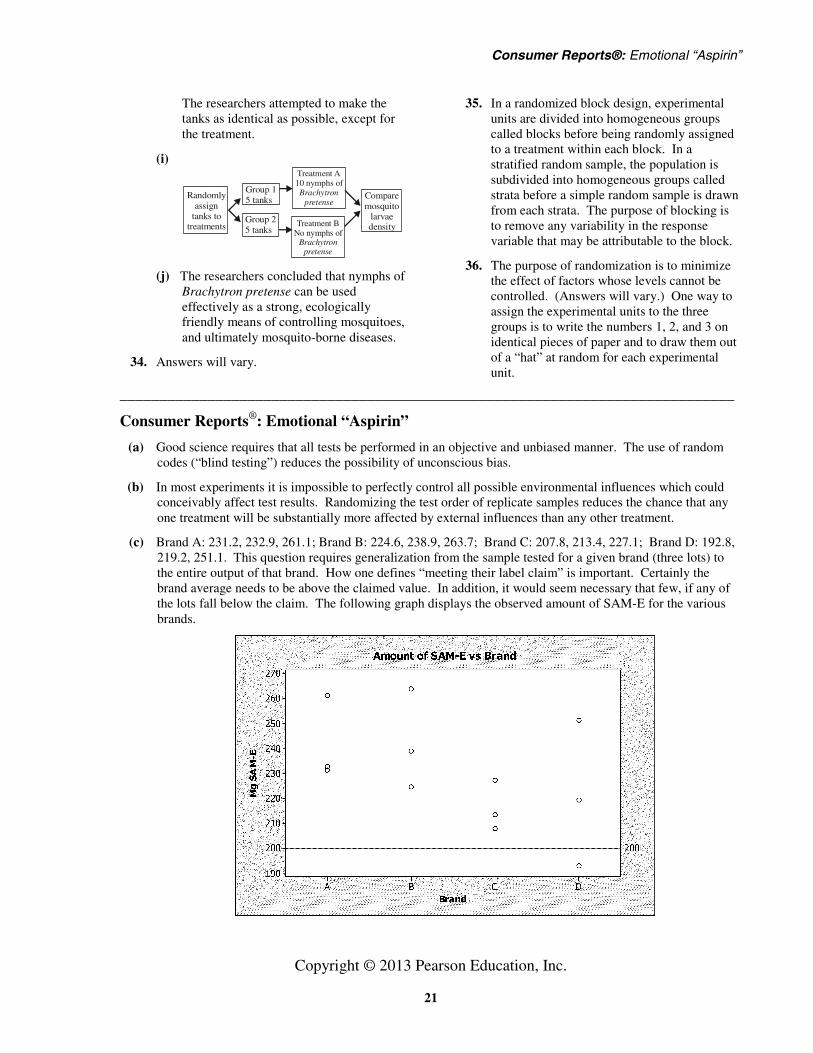
The researchers attempted to make the tanks as identical as possible, except for the treatment.
(i)
Randomlyassign
tanks totreatments
Group 25 tanks
Group 15 tanks Compare
mosquitolarvaedensity
Treatment A10 nymphs ofBrachytron
pretense
Treatment BNo nymphs of
Brachytronpretense
(j) The researchers concluded that nymphs of Brachytron pretense can be used effectively as a strong, ecologically friendly means of controlling mosquitoes, and ultimately mosquito-borne diseases.
34. Answers will vary.
35. In a randomized block design, experimental units are divided into homogeneous groups called blocks before being randomly assigned to a treatment within each block. In a stratified random sample, the population is subdivided into homogeneous groups called strata before a simple random sample is drawn from each strata. The purpose of blocking is to remove any variability in the response variable that may be attributable to the block.
36. The purpose of randomization is to minimize the effect of factors whose levels cannot be controlled. (Answers will vary.) One way to assign the experimental units to the three groups is to write the numbers 1, 2, and 3 on identical pieces of paper and to draw them out of a “hat” at random for each experimental unit.
_____________________________________________________________________________
Consumer Reports®: Emotional “Aspirin”
(a) Good science requires that all tests be performed in an objective and unbiased manner. The use of random codes (“blind testing”) reduces the possibility of unconscious bias.
(b) In most experiments it is impossible to perfectly control all possible environmental influences which could conceivably affect test results. Randomizing the test order of replicate samples reduces the chance that any one treatment will be substantially more affected by external influences than any other treatment.
(c) Brand A: 231.2, 232.9, 261.1; Brand B: 224.6, 238.9, 263.7; Brand C: 207.8, 213.4, 227.1; Brand D: 192.8, 219.2, 251.1. This question requires generalization from the sample tested for a given brand (three lots) to the entire output of that brand. How one defines “meeting their label claim” is important. Certainly the brand average needs to be above the claimed value. In addition, it would seem necessary that few, if any of the lots fall below the claim. The following graph displays the observed amount of SAM-E for the various brands.
Chapter 1: Data Collection
Copyright © 2013 Pearson Education, Inc.
22
Brands A and B clearly appear to meet their label claim as all samples are well above the target of 200mg. The brand C average is the closest of the four to the target, but the three observations are the most consistent of any brand, suggesting that it too meets its label claim. Brand D is the most variable of the brands and has one observation below 200mg. Even though the sample mean is above 200, the lack of consistency suggests some chance that a larger sample could average below 200 or that a high proportion of lots might be below 200.
(d) Step 1: Identify the problem to be solved. Consumer Reports® would like to determine if the amount of SAM-E contained in several representative brands meets the label claims. Therefore, the response will be the amount of SAM-E (mg) in the pills.
Step 2: Determine the explanatory variables that affect the response variable. Some explanatory variables that affect the amount of SAM-E measured: Brand, lot from which pills are obtained, and testing mechanism.
Step 3: Determine the number of experimental units. In this experiment, we will measure the amount of SAM-E in 12 orders (4 brands) of mood-changing pills.
Step 4: Determine the level of the explanatory variables: We list the explanatory variables and their levels. • Brand – We wish to determine the difference (if any) in the amount SAM-E as follows: Brand A: 3 orders Brand B: 3 orders Brand C: 3 orders Brand D: 3 orders
• Lot from which pills are obtained – Variability in the amount of SAM-E could possibly occur depending on the lot from which the pills are drawn. To account for this, we randomly select the samples from different lots.
• Testing mechanism – The measurement of SAM-E obtained could vary depending on the accuracy of the testing mechanism. We can control this somewhat by using the same testing approach for each order of pills. We also randomize the order in which the pills are tested. We also assign random codes to the various brands so that the
laboratory will not know the manufacturer it is testing, which helps to avoid bias.
Step 5: Conduct the experiment. (a) We determine the order in which the pills will be tested. (b) We determine the amount of SAM-E for each order of pills.
Step 6: Test the claim. We analyze the data to determine whether the manufacturers are meeting their label claims.
Chapter 1 Review Exercises
1. Statistics is the science of collecting, organizing, summarizing and analyzing information in order to draw conclusions.
2. The population is the group of individuals that is to be studied.
3. A sample is a subset of the population.
4. An observational study uses data obtained by studying individuals in a sample without trying to manipulate or influence the variable(s) of interest. Observational studies are often called ex post facto studies because the value of the response variable has already been determined.
5. In a designed experiment, a treatment is applied to the individuals in a sample in order to isolate the effects of the treatment on the response variable.
6. The three major types of observational studies are (1) Cross-sectional studies, (2) Case-control studies, and (3) Cohort studies.
Cross-sectional studies collect data at a specific point in time or over a short period of time. Cohort studies are prospective and collect data over a period of time, sometimes over a long period of time. Case-controlled studies are retrospective, looking back in time to collect data either from historical records or from recollection by subjects in the study. Individuals possessing a certain characteristic are matched with those that do not.
7. The process of statistics refers to the approach used to collect, organize, analyze, and interpret data. The steps are (1) Identify the research objective (2) Collect the data needed to answer the research question. (3) Describe the data. (4) Perform inference.

Chapter 1 Review Exercises
Copyright © 2013 Pearson Education, Inc.
23
8. The three types of bias are sampling bias, nonresponse bias, and response bias. Sampling bias occurs when the techniques used to select individuals to be in the sample favor one part of the population over another. Bias in sampling is reduced when a random process is to select the sample. Nonresponse bias occurs when the individuals selected to be in the sample that do not respond to the survey have different opinions from those that do respond. This can be minimized by using call-backs and follow-up visits to increase the response rate. Response bias occurs when the answers on a survey do not reflect the true feelings of the respondent. This can be minimized by using trained interviewers, using carefully worded questions, and rotating questions and answer selections.
9. Nonsampling errors are errors that result from undercoverage, nonresponse bias, response bias, and data-entry errors. These errors can occur even in a census. Sampling errors are errors that result from the use of a sample to estimate information about a population. These include random error and errors due to poor sampling plans, and result because samples contain incomplete information regarding a population.
10. The steps in conducting an experiment are:
(1) Identify the problem to be solved. Gives direction and indicates the variables of interest (referred to as the claim).
(2) Determine the factors that affect the response variable. List all variables that may affect the response, both controllable and uncontrollable.
(3) Determine the number of experimental units. Determine the sample size. Use as many as time and money allow.
(4) Determine the level of each factor. Factors can be controlled by fixing their level (e.g. only using men) or setting them at predetermined levels (e.g. different dosages of a new medicine). For factors that cannot be controlled, random assignment of units to treatments helps average out the effects of the uncontrolled factor over all treatments.
(5) Conduct the experiment. Carry out the experiment using an equal number of units for each treatment. Collect and organize the data produced.
(6) Test the claim. Analyze the collected data and draw conclusions.
11. ‘Number of new automobiles sold at a dealership on a given day’ is quantitative because its values are numerical measures on which addition and subtraction can be performed with meaningful results. The variable is discrete because its values result from a count.
12. ‘Weight in carats of an uncut diamond’ is quantitative because its values are numerical measures on which addition and subtraction can be performed with meaningful results. The variable is continuous because its values result from a measurement rather than a count.
13. ‘Brand name of a pair of running shoes’ is qualitative because its values serve only to classify individuals based on a certain characteristic.
14. 73% is a statistic because it describes a sample (the 1011 people age 50 or older who were surveyed).
15. 69% is a parameter because it describes a population (all the passes thrown by Chris Leak in the 2007 Championship Game).
16. Birth year has the interval level of measurement since differences between values have meaning, but it lacks a true zero.
17. Marital status has the nominal level of measurement since its values merely categorize individuals based on a certain characteristic.
18. Stock rating has the ordinal level of measurement because its values can be placed in rank order, but differences between values have no meaning.
19. Number of siblings has the ratio level of measurement because differences between values have meaning and there is a true zero.
20. This is an observational study because no attempt was made to influence the variable of interest. Sexual innuendos and curse words were merely observed.

Chapter 1: Data Collection
Copyright © 2013 Pearson Education, Inc.
24
21. This is an experiment because the researcher intentionally imposed treatments (experimental drug vs. placebo) on individuals in a controlled setting.
22. This was a cohort study because participants were identified to be included in the study and then followed over a period of time (over 26 years) with data being collected at regular intervals (every 2 years).
23. This is convenience sampling since the pollster simply asked the first 50 individuals she encountered.
24. This is a cluster sample since the ISP included all the households in the 15 randomly selected city blocks.
25. This is a stratified sample since individuals were randomly selected from each of the three grades.
26. This is a systematic sample since every 40th tractor trailer was tested.
27. (a) Sampling bias; undercoverage or nonrepresentative sample due to a poor sampling frame. Cluster sampling or stratified sampling are better alternatives.
(b) Response bias due to interviewer error. A multi-lingual interviewer could reduce the bias.
(c) Data-entry error due to the incorrect entries. Entries should be checked by a second reader.
28. Answers will vary. Using a TI-84 Plus graphing calculator with a seed of 1990, and numbering the individuals from 1 to 21, we would select individuals numbered 14, 6, 10, 17, and 11. If we numbered the businesses down each column, the businesses selected would be Jiffy Lube, Nancy’s Flowers, Norm’s Jewelry, Risky Business Security, and Solus, Maria, DDS.
29. Answers will vary. The first step is to select a random starting point among the first 9 bolts produced. Using row 9, column 17 from Table I in Appendix A, he will sample the 3rd bolt produced, then every 9th bolt after that until a sample size of 32 is obtained. In this case, he would sample bolts 3, 12, 21, 30, and so on until bolt 282.
30. Answers will vary. The goggles could be numbered 00 to 99, then a table of random digits could be used to select the numbers of the goggles to be inspected. Starting with row 12, column 1 of Table 1 in Appendix A and reading down, the selected labels would be 55, 96, 38, 85, 10, 67, 23, 39, 45, 57, 82, 90, and 76.
31. (a) To determine the ability of chewing gum to remove stains from teeth
(b) Experimental design
(c) Completely randomized design
(d) Percentage of stain removed
(e) Type of stain remover (gum or saliva); Qualitative
(f) The 64 stained bovine incisors
(g) The chewing simulator could impact the percentage of the stain removed
(h) Gum A and B remove significantly more stain
32. (a) Matched-pairs
(b) Reaction time; Quantitative
(c) Alcohol consumption
(d) Food consumption; caffeine intake
(e) Weight, gender, etc.
(f) To act as a placebo to control for the psychosomatic effects of alcohol
(g) Alcohol delays the reaction time significantly in seniors for low levels of alcohol consumption; healthy seniors that are not regular drinkers.
33. (a) This experiment has a randomized block design.
(b) The response variable is the exam grade.
(c) The factor ‘Notecard use’ is set at predetermined levels. The treatments are ‘with notecard’ and ‘without notecard’.
(d) The experimental units are the instructor’s statistics students.

Chapter 1 Test
Copyright © 2013 Pearson Education, Inc.
25
(e)
Divide studentroster by
course type
Block 1:Online
Block 2:Web Enhanced
Group 1:Half of class
Group 2:Other half
Group 1:Half of class
Group 2:Other half
Group 1:Half of class
Group 2:Other half
Block 3:Traditional
Notecard
No notecard
Compareexamgrades
Compareexamgrades
Compareexamgrades
Notecard
No notecard
Notecard
No notecard
34. Answers will vary. Since there are ten digits (0 – 9), we will let a 0 or 1 indicate that (a) is to be the correct answer, 2 or 3 indicate that (b) is to be the correct answer, and so on. Beginning with row 1, column 8 of Table 1 in Appendix A, and reading downward, we obtain the following: 2, 6, 1, 4, 1, 4, 2, 9, 4, 3, 9, 0, 6, 4, 4, 8, 6, 5, 8, 5 Therefore, the sequence of correct answers would be: b, d, a, c, a, c, b, e, c, b, e, a, d, c, c, e, d, c, e, c
35. (a) Answers will vary. One possible diagram is shown below.
Randomlyassign to
commercialtype
Humorous(25 subjects)
Serious(25 subjects)
Comparepercentrecall
(b) Answers will vary. One possible diagram is shown below.
Randomlyassign women to commercial
type
Humorous(15 subjects)
Serious(15 subjects)
Comparepercentrecall
Randomlyassign men
to commercialtype
Humorous(10 subjects)
Serious(10 subjects)
Comparepercentrecall
Divideby
gender
36. A matched-pairs design is an experimental design where experimental units are matched up so they are related in some way.
In a completely randomized design, the experimental units are randomly assigned to one of the treatments. The value of the response variable is compared for each treatment. In a matched-pairs design, experimental units are matched up on the basis of some common characteristic (such as husband-wife or twins). The differences between the matched units are analyzed.
37. Answers will vary.
38. Answers will vary.
Chapter 1 Test 1. Collect information, organize and summarize
the information, analyze the information to draw conclusions, provide a measure of confidence in the conclusions drawn from the information collected.
2. The process of statistics refers to the approach used to collect, organize, analyze, and interpret data. The steps are (1) Identify the research objective (2) Collect the data needed to answer the research question. (3) Describe the data. (4) Perform inference.

Chapter 1: Data Collection
Copyright © 2013 Pearson Education, Inc.
26
3. The time to complete the 500-meter race in speed skating is quantitative because its values are numerical measurements on which addition and subtraction have meaningful results. The variable is continuous because its values result from a measurement rather than a count. The variable is at the ratio level of measurement because differences between values have meaning and there is a true zero.
4. Video game rating is qualitative because its values classify games based on certain characteristics but arithmetic operations have no meaningful results. The variable is at the ordinal level of measurement because its values can be placed in rank order, but differences between values have no meaning.
5. The number of surface imperfections is quantitative because its values are numerical measurements on which addition and subtraction have meaningful results. The variable is discrete because its values result from a count. The variable is at the ratio level of measurement because differences between values have meaning and there is a true zero.
6. This is an experiment because the researcher intentionally imposed treatments (brand-name battery versus plain-label battery) on individuals (cameras) in a controlled setting. The response variable is the battery life.
7. This is an observational study because no attempt was made to influence the variable of interest. Fan opinions about the asterisk were merely observed. The response variable is whether or not an asterisk should be placed on Barry Bonds’ 756th homerun ball.
8. A cross-sectional study collects data at a specific point in time or over a short period of time; a cohort study collects data over a period of time, sometimes over a long period of time (prospective); a case-controlled study is retrospective, looking back in time to collect data.
9. An experiment involves the researcher actively imposing treatments on experimental units in order to observe any difference between the treatments in terms of effect on the response variable. In an observational study, the researcher observes the individuals in the study without attempting to influence the response variable in any way. Only an experiment will allow a researcher to establish causality.
10. A control group is necessary for a baseline comparison. This accounts for the placebo effect which says that some individuals will respond to any treatment. Comparing other treatments to the control group allows the researcher to identify which, if any, of the other treatments are superior to the current treatment (or no treatment at all). Blinding is important to eliminate bias due to the individual or experimenter knowing which treatment is being applied.
11. The steps in conducting an experiment are (1) Identify the problem to be solved, (2) Determine the factors that affect the response variable, (3) Determine the number of experimental units, (4) Determine the level of each factor, (5) Conduct the experiment, and (6) Test the claim.
12. Answers will vary. The franchise locations could be numbered 01 to 15 going across. Starting at row 7, column 14 of Table I in Appendix, and working downward, the selected numbers would be 08, 11, 03, and 02. The corresponding locations would be Ballwin, Chesterfield, Fenton, and O’Fallon.
13. Answers will vary. Using the available lists, obtain a simple random sample from each stratum and combine the results to form the stratified sample. Start at different points in Table I or use different seeds in a random number generator. Using a TI-84 Plus graphing calculator with a seed of 14 for Democrats, 28 for Republicans, and 42 for Independents, the selected numbers would be: Democrats: 3946, 8856, 1398, 5130, 5531, 1703, 1090, and 6369 Republicans: 7271, 8014, 2575, 1150, 1888, 3138, and 2008 Independents: 945, 2855, and 1401
14. Answers will vary. Number the blocks from 1 to 2500 and obtain a simple random sample of size 10. The blocks corresponding to these numbers represent the blocks analyzed. All trees in the selected blocks are included in the sample. Using a TI-84 Plus graphing calculator with a seed of 12, the selected blocks would be numbered 2367, 678, 1761, 1577, 601, 48, 2402, 1158, 1317, and 440.

Chapter 1 Test
Copyright © 2013 Pearson Education, Inc.
27
15. Answers will vary. 600
42.8614
≈ , so we let
42k = . Select a random number between 1 and 42 which represents the first slot machine inspected. Using a TI-84 Plus graphing calculator with a seed of 132, we select machine 18 as the first machine inspected. Starting with machine 18, every 42nd machine thereafter would also be inspected (60, 102, 144, 186, …, 564).
16. In a completely randomized design, the experimental units are randomly assigned to one of the treatments. The value of the response variable is compared for each treatment. In a randomized block design, the experimental units are first divided according to some common characteristic (such as gender). Then each experimental unit within each block is randomly assigned to one treatment. Within each block the value of the response variable is compared for each treatment, but not between blocks. By blocking, we prevent the effect of the blocked variable from confounding with the treatment.
17. (a) Sampling bias due to voluntary response.
(b) Nonresponse bias due to the low response rate.
(c) Response bias due to poorly worded questions.
(d) Sampling bias due to poor sampling plan (undercoverage).
18. (a) The response variable is the lymphocyte count.
(b) The treatment is space flight.
(c) This experiment has a matched-pairs design.
(d) The experimental units are the 4 members of Skylab.
(e)
Measurelymphocytecount per
cubicmillimeter
1 day beforeliftoff
Applytreatment
(space flight)
Measurelymphocytecount afterspace flight
Computedifference
inlymphocyte
count
19. (a) This experiment has a completely randomized design.
(b) The response variable is the level of dermatitis improvement.
(c) The factor set to predetermined levels is the topical cream concentration. The treatments are 0.5% cream, 1.0% cream, and a placebo (0% cream).
(d) The study is double-blind if neither the subjects, nor the person administering the treatments, are aware of which topical cream is being applied.
(e) The control group is the placebo (0% topical cream).
(f) The experimental units are the 225 patients with skin irritations.
(g)
20. (a) This was a cohort study because participants were identified to be included in the study and then followed over a long period of time with data being collected at regular intervals (every 4 years).
(b) The response variable is bone mineral density. The explanatory variable is weekly cola consumption.
(c) The response variable is quantitative because its values are numerical measures on which addition and subtraction can be performed with meaningful results.
(d) The researchers observed values of variables that could potentially impact bone mineral density (besides cola consumption) so their effect could be isolated from the variable of interest.
(e) Answers will vary. Some possible lurking variables that should be accounted for are smoking status, alcohol consumption, physical activity, and calcium intake (form and quantity).
Randomlyassign patients
to creams
0.5% cream (75 patients)
Placebo(75 patients)
Compareimprovement
in skinirritation
1.0% cream(75 patients)
Chapter 1: Data Collection
Copyright © 2013 Pearson Education, Inc.
28
(f) The study concluded that women who consumed at least one cola per day (on average) had a bone mineral density that was significantly lower at the femoral neck than those who consumed less than one cola per day. The study cannot claim that increased cola consumption causes lower bone mineral density because it is only an observational study. The researchers can only say that increased cola consumption is associated with lower bone mineral density.
Case Study: Chrysalises for Cash Reports will vary. The reports should include the
following components:
Step 1: Identify the problem to be solved. The entrepreneur wants to determine if there are differences in the quality and emergence time of broods of the black swallowtail butterfly depending on the following factors: (a) early brood season versus late brood season; (b) carrot plants versus parsley plants; and (c) liquid fertilizer versus solid fertilizer.
Step 2: Determine the explanatory variables that affect the response variable. Some explanatory variables that may affect the quality and emergence time of broods are the brood season, the type of plant on which the chrysalis grows, fertilizer used for plants, soil mixture, weather, and the level of sun exposure.
Step 3: Determine the number of experimental units. In this experiment, a sample of 40 caterpillars/butterflies will be used.
Step 4: Determine the level of the explanatory variables:
•Brood season – We wish to determine the differences in the number of deformed butterflies and in the emergence times depending on whether the brood is from the early season or the late season. We use a total of 20 caterpillars/butterflies from the early brood season and 20 caterpillars/butterflies from the late brood season.
•Type of plant – We wish to determine the differences in the number of deformed butterflies and in the emergence times depending on the type plant on which the caterpillars are placed. A total of 20 caterpillars are placed on carrot plants and 20 are placed on parsley plants.
•Fertilizer – We wish to determine the differences in the number of deformed butterflies and in the emergence times depending on the type of fertilizer used on the plants. A total of 20 chrysalises grow on plants that are fed liquid fertilizer and 20 grow on plants that are fed solid fertilizer.
•Soil mixture – We control the effects of soil by growing all plants in the same mixture.
•Weather – We cannot control the weather, but the weather will be the same for each chrysalis grown within the same season. For chrysalises grown in different seasons, we expect the weather might be different and thus part of the reason for potential differences between seasons. Also, we can control the amount of watering that is done.
•Sunlight exposure – We cannot control this variable, but the sunlight exposure will be the same for each chrysalis grown within the same season. For chrysalises grown in different seasons, we expect the sunlight exposure might be different and thus part of the reason for potential differences between seasons.
Step 5: Conduct the experiment.
(a) We fill eight identical pots with equal amounts of the same soil mixture. We use four of the pots for the early brood season and four of the pots for the late brood season.
For the early brood season, two of the pots grow carrot plants and two grow parsley plants. One carrot plant is fertilized with a liquid fertilizer, one carrot plant is fertilized with a solid fertilizer, one parsley plant is fertilized with the liquid fertilizer, and one parsley plant is fertilized with the solid fertilizer. We place five black swallowtail caterpillars of similar age into each of the four pots.
Similarly, for the late brood season, two of the pots grow carrot plants and two grow parsley plants. One carrot plant is fertilized with a liquid fertilizer, one carrot plant is fertilized with a solid fertilizer, one parsley plant is fertilized with the liquid fertilizer, and one parsley plant is fertilized with the solid fertilizer. We place five black swallowtail caterpillars of similar age into each of the four pots.
(b) We determine the number of deformed butterflies and in the emergence times for the caterpillars/butterflies from each pot.

Case Study: Chrysalises for Cash
Copyright © 2013 Pearson Education, Inc.
29
Step 6: Test the claim. We determine whether any differences exist depending on season, plant type, and fertilizer type.
Conclusions:
Early versus late brood season: From the data presented, more deformed butterflies occur in the late season than in the early season. Five deformed butterflies occurred in the late season while only one occurred in the early season. Also, the emergence time seems to be longer in the early season than in the late season. In the early season, all but one of the twenty emergence times were between 6 and 8 days. In the late season, all twenty of the emergence times were between 2 and 5 days.
Parsley versus carrot plants: From the data presented, the plant type does not seem to affect the number of deformed butterflies that occur. Altogether, three deformed butterflies occur from parsley plants and three deformed butterflies occur from the carrot plants. Likewise, the plant type does not seem to affect the emergence times of the butterflies.
Liquid versus solid fertilizer: From the data presented, the type of fertilizer seems to affect the number of deformed butterflies that occur. Five deformed butterflies occurred when the solid fertilizer was used while only one occurred when the liquid fertilizer was used. The type of fertilizer does not seem to affect emergence times.