chapter 1: graphs, functions, and models 1... · chapter 1: graphs, functions & models topic 2:...
TRANSCRIPT
1 | P a g e
Chapter 1: Graphs, Functions, and Models
Topic 1: Basics of Functions – p. 162
- Homework: p. 176 #1-38 Even
Topic 2: Restricted Domains – NOT IN BOOK
- Homework: Worksheet
Topic 3: Difference Quotient – p. 193
- Homework: p. 198 #71-86
Topic 4: Identifying Key Features of a Graph – p. 181
- Homework: p. 195 & 196 #1-48 Even
Topic 5: Shifts in Graphs – p. 229
- Homework: p. 241 &242 #1-44 Even
Topic 6: Combinations & Composite Functions – p. 246
- Homework: p. 258 #51-71 Even
Topic 7: Inverse Functions – p. 261
- Homework: p. 269 & 270 #1-50 Even
Topic 8: Circles – p. 273
- Homework: p. 280 #1-52 Even
2 | P a g e
Name: __________________________________________________________ Date: _________________________ Period: _________
Chapter 1: Graphs, Functions & Models
Topic 1: Basics of Functions
Relations & Functions
A relation is a relationship between sets of information. It is a set of ordered pairs.
Recall:
Domain: the set of all x-values.
Range: the set of all y-values.
Example: Consider the relation that has as its inputs the months of the year and as its outputs the number of days
in each month. In this case, the number of days is a function of the month of the year. Assume this function is
restricted to non-leap years.
Write the set that represents this function’s domain:
Write the set that represents this function’s range:
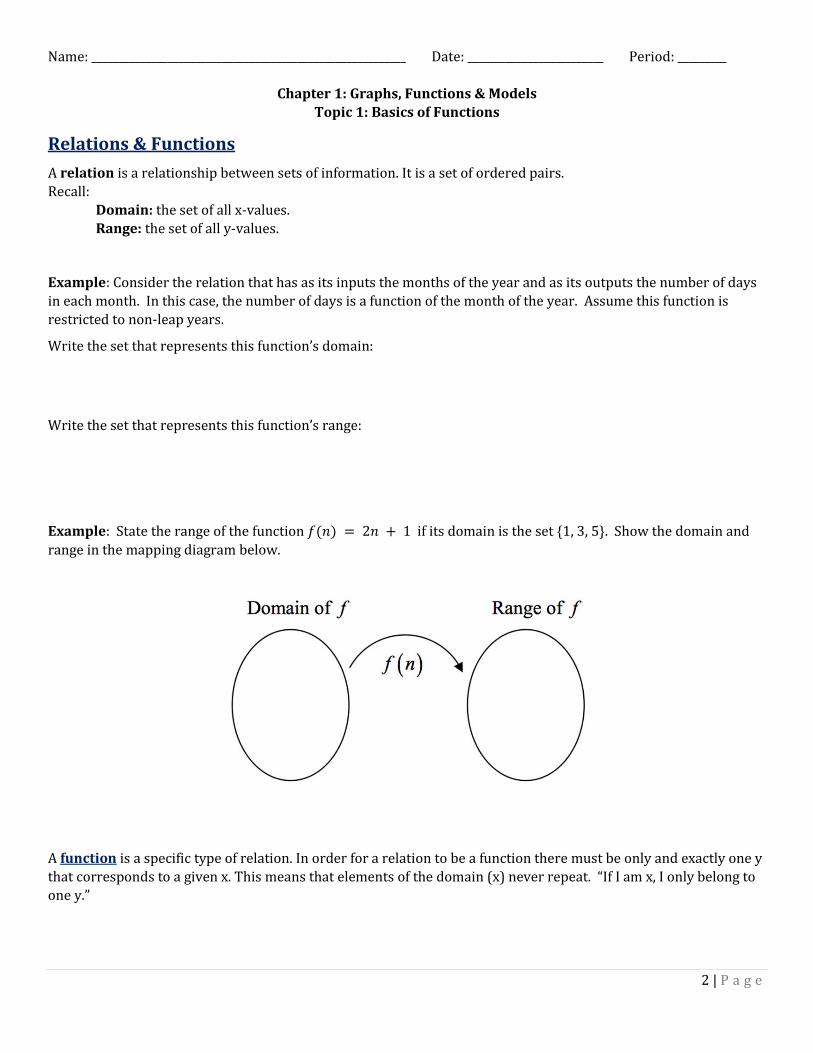
Example: State the range of the function if its domain is the set {1, 3, 5}. Show the domain and
range in the mapping diagram below.
A function is a specific type of relation. In order for a relation to be a function there must be only and exactly one y
that corresponds to a given x. This means that elements of the domain (x) never repeat. “If I am x, I only belong to
one y.”
3 | P a g e
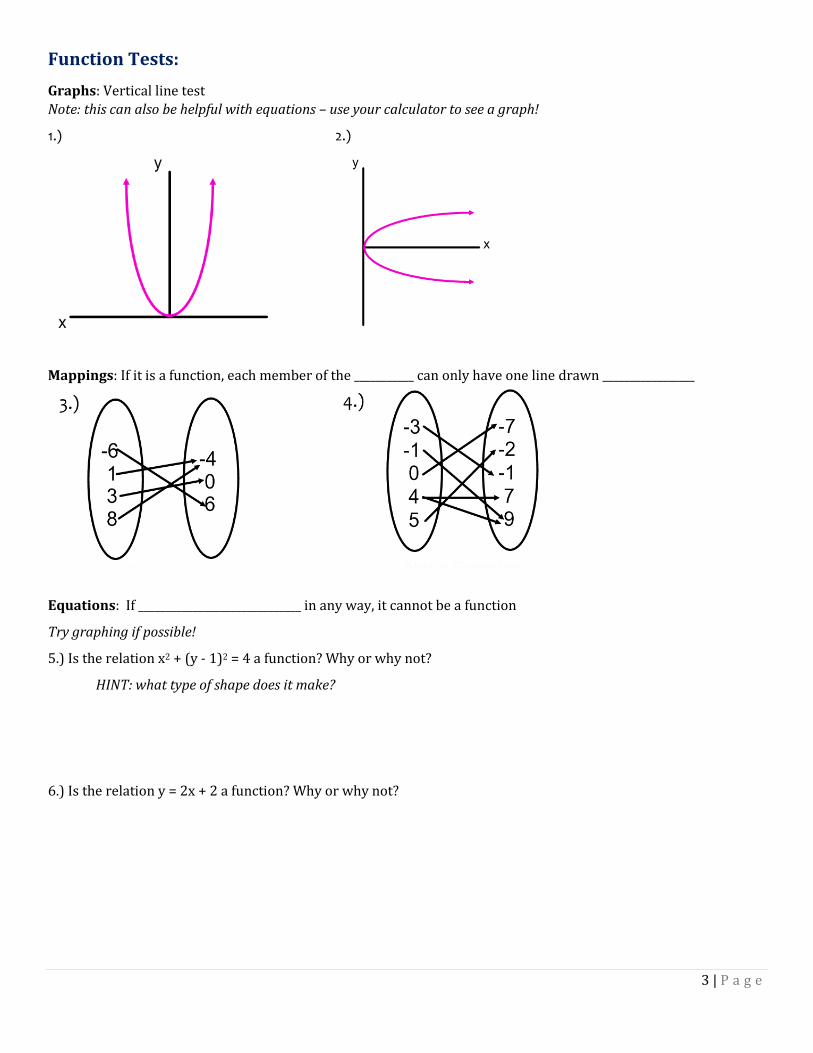
Function Tests:
Graphs: Vertical line test
Note: this can also be helpful with equations – use your calculator to see a graph!
1.) 2.)
Mappings: If it is a function, each member of the ___________ can only have one line drawn _________________
Equations: If ______________________________ in any way, it cannot be a function
Try graphing if possible!
5.) Is the relation x2 + (y - 1)2 = 4 a function? Why or why not?
HINT: what type of shape does it make?
6.) Is the relation y = 2x + 2 a function? Why or why not?
4 | P a g e
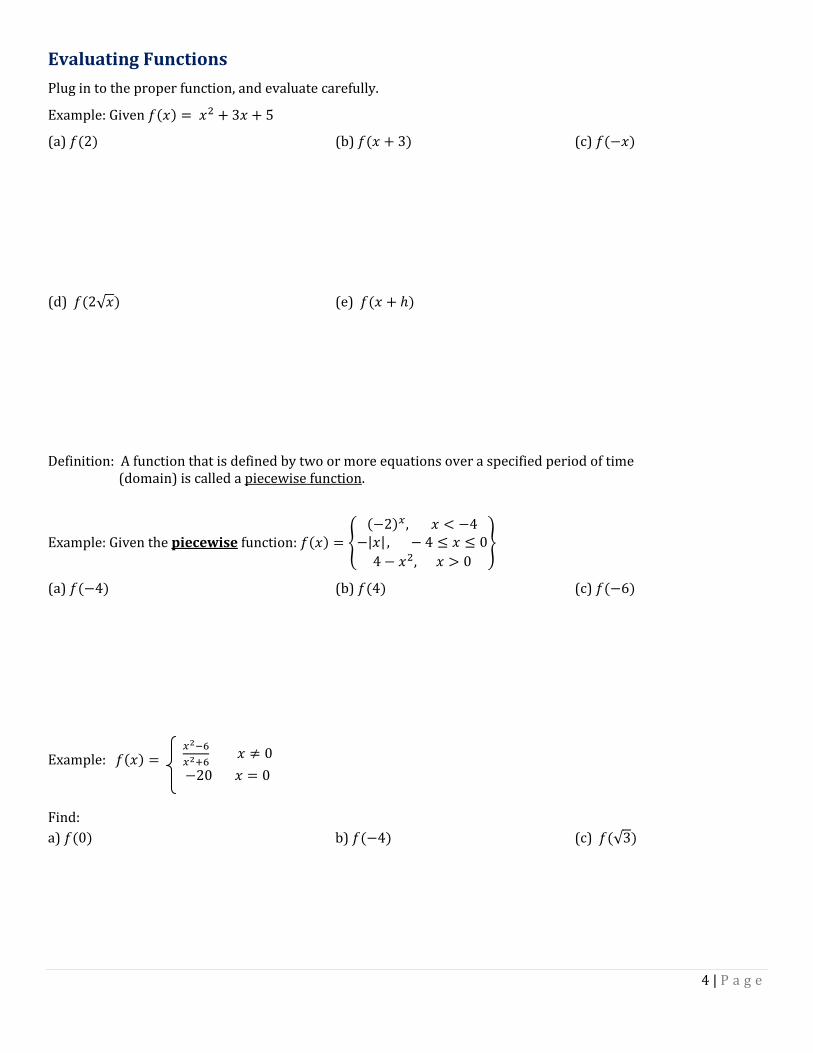
Evaluating Functions
Plug in to the proper function, and evaluate carefully.
Example: Given
(a) (b) (c)
(d) (e)
Definition: A function that is defined by two or more equations over a specified period of time (domain) is called a piecewise function.
Example: Given the piecewise function:
(a) (b) (c)
Example:
Find:
a) b) (c)
5 | P a g e
Name: __________________________________________________________ Date: _________________________ Period: _________
Chapter 1: Graphs, Functions & Models
Topic 2: Restricted Domains
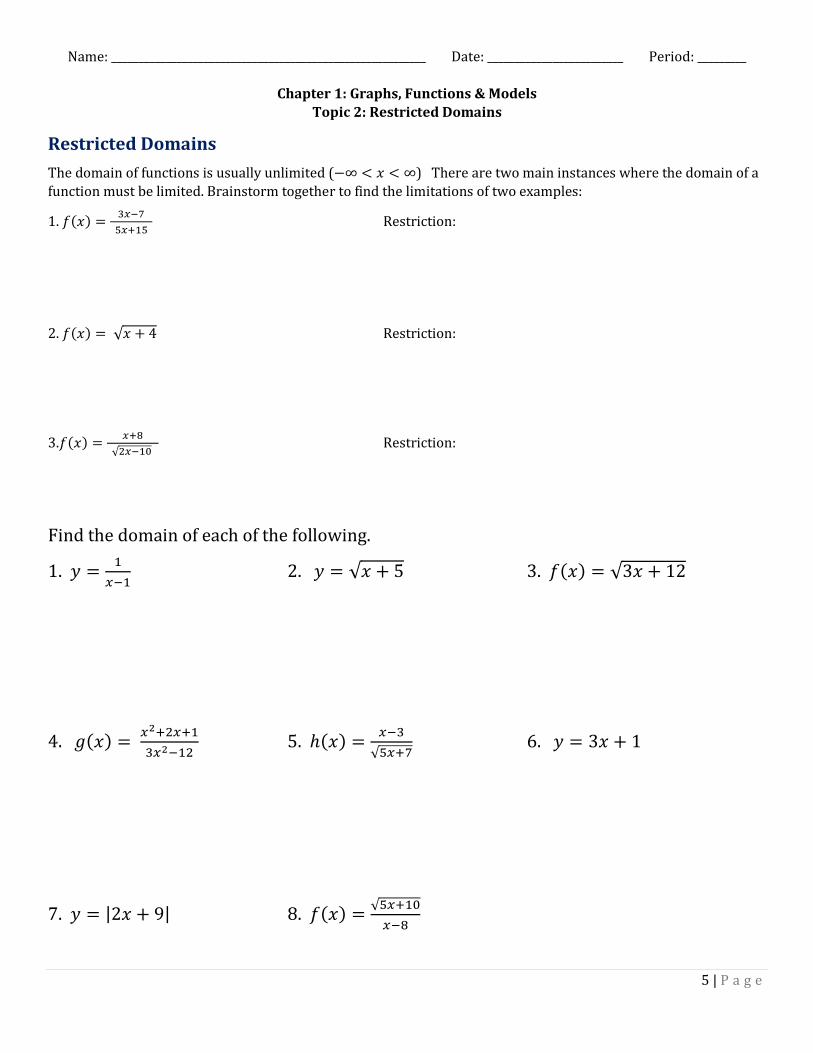
Restricted Domains
The domain of functions is usually unlimited ( ) There are two main instances where the domain of a
function must be limited. Brainstorm together to find the limitations of two examples:
1.
Restriction:
2. Restriction:
3.
Restriction:
Find the domain of each of the following.
1.
2. 3.
4.
5.
6.
7. 8.
6 | P a g e
Name: __________________________________________________________ Date: _________________________ Period: _________
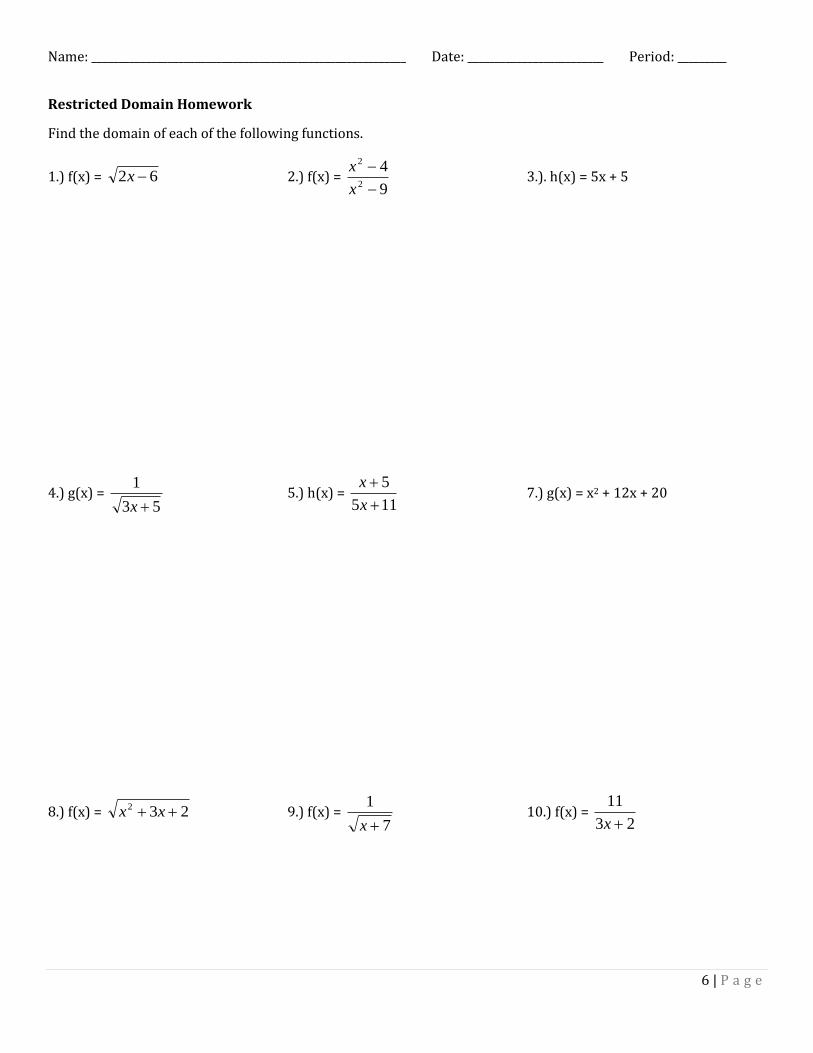
Restricted Domain Homework
Find the domain of each of the following functions.
1.) f(x) = 62 x 2.) f(x) = 9
42
2
x
x 3.). h(x) = 5x + 5
4.) g(x) = 53
1
x 5.) h(x) =
115
5
x
x 7.) g(x) = x2 + 12x + 20
8.) f(x) = 232 xx 9.) f(x) = 7
1
x 10.) f(x) =
23
11
x
7 | P a g e
Name: __________________________________________________________ Date: _________________________ Period: _________
Chapter 1: Graphs, Functions & Models
Topic 3: Difference Quotient
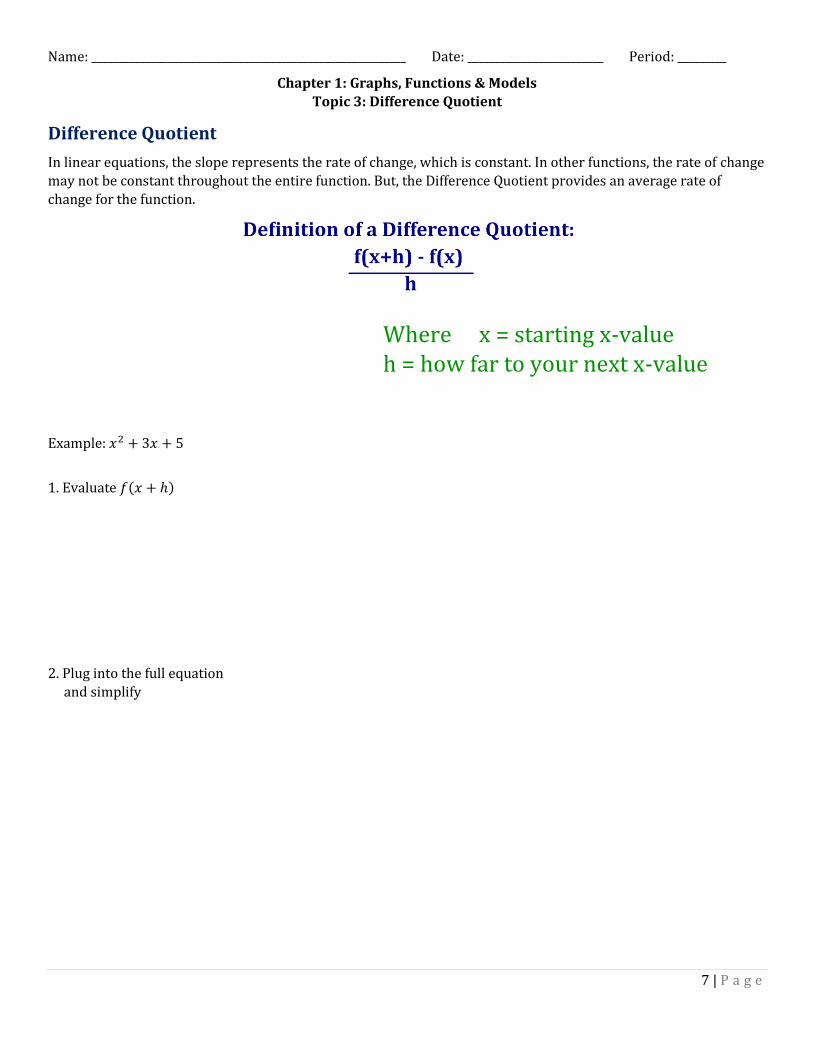
Difference Quotient
In linear equations, the slope represents the rate of change, which is constant. In other functions, the rate of change
may not be constant throughout the entire function. But, the Difference Quotient provides an average rate of
change for the function.
Where x = starting x-value h = how far to your next x-value
Example:
1. Evaluate
2. Plug into the full equation
and simplify

8 | P a g e
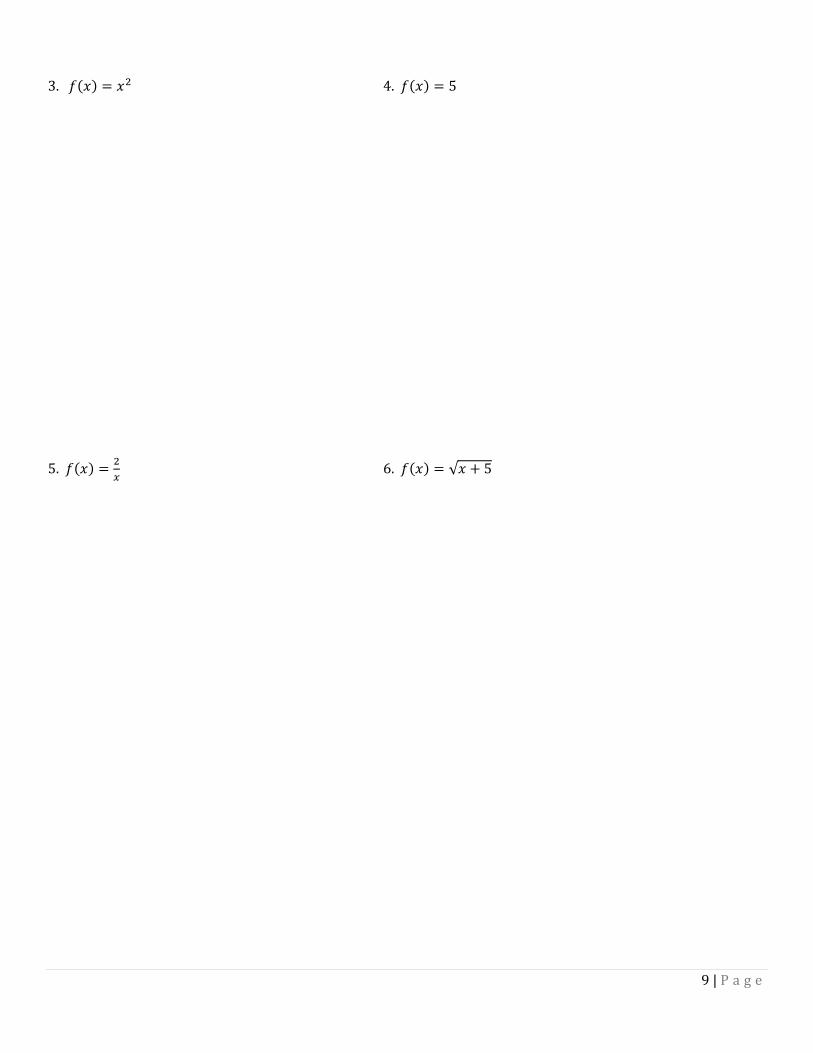
Example:
Find and simplify the difference quotient.
1. 2.
9 | P a g e
3. 4.
5.
6.
10 | P a g e
Name: __________________________________________________________ Date: _________________________ Period: _________
Chapter 1: Graphs, Functions & Models
Topic 4: Identifying Key Features of a Graph
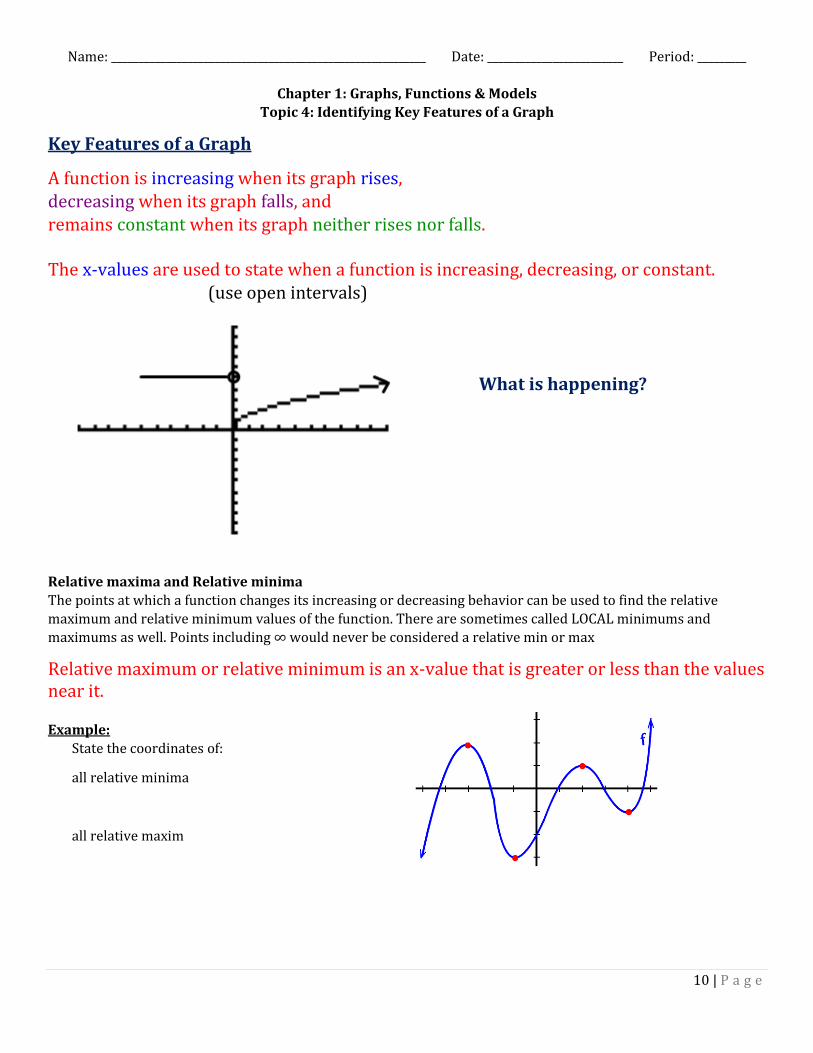
Key Features of a Graph
A function is increasing when its graph rises, decreasing when its graph falls, and remains constant when its graph neither rises nor falls. The x-values are used to state when a function is increasing, decreasing, or constant. (use open intervals)
What is happening?
Relative maxima and Relative minima
The points at which a function changes its increasing or decreasing behavior can be used to find the relative
maximum and relative minimum values of the function. There are sometimes called LOCAL minimums and
maximums as well. Points including would never be considered a relative min or max
Relative maximum or relative minimum is an x-value that is greater or less than the values near it.
Example:
State the coordinates of:
all relative minima
all relative maxim
11 | P a g e
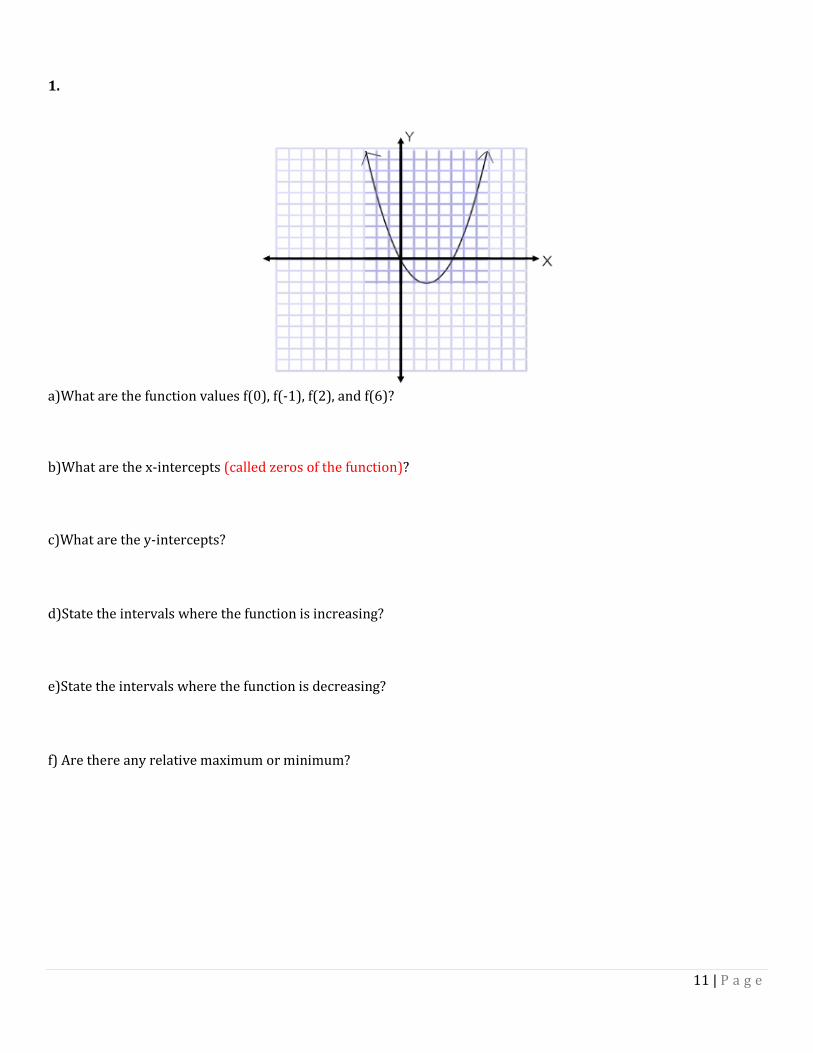
1.
a)What are the function values f(0), f(-1), f(2), and f(6)?
b)What are the x-intercepts (called zeros of the function)?
c)What are the y-intercepts?
d)State the intervals where the function is increasing?
e)State the intervals where the function is decreasing?
f) Are there any relative maximum or minimum?
12 | P a g e
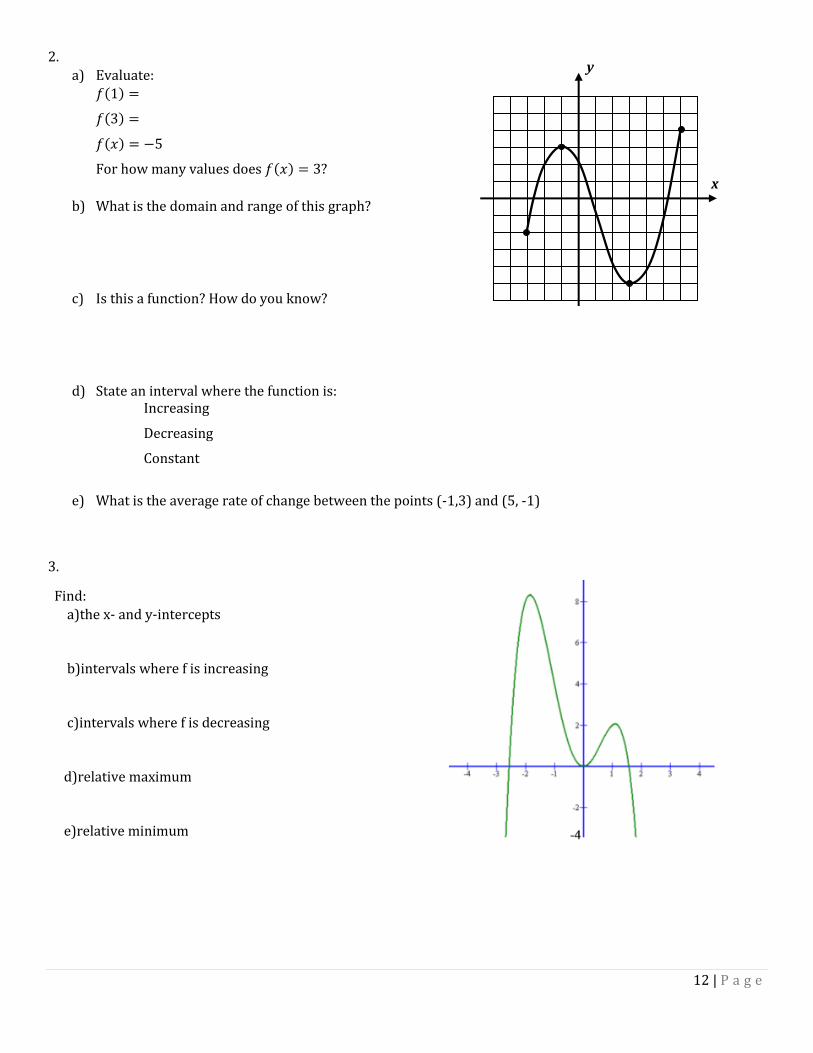
2.
a) Evaluate:
For how many values does ?
b) What is the domain and range of this graph?
c) Is this a function? How do you know?
d) State an interval where the function is: Increasing
Decreasing
Constant
e) What is the average rate of change between the points (-1,3) and (5, -1)
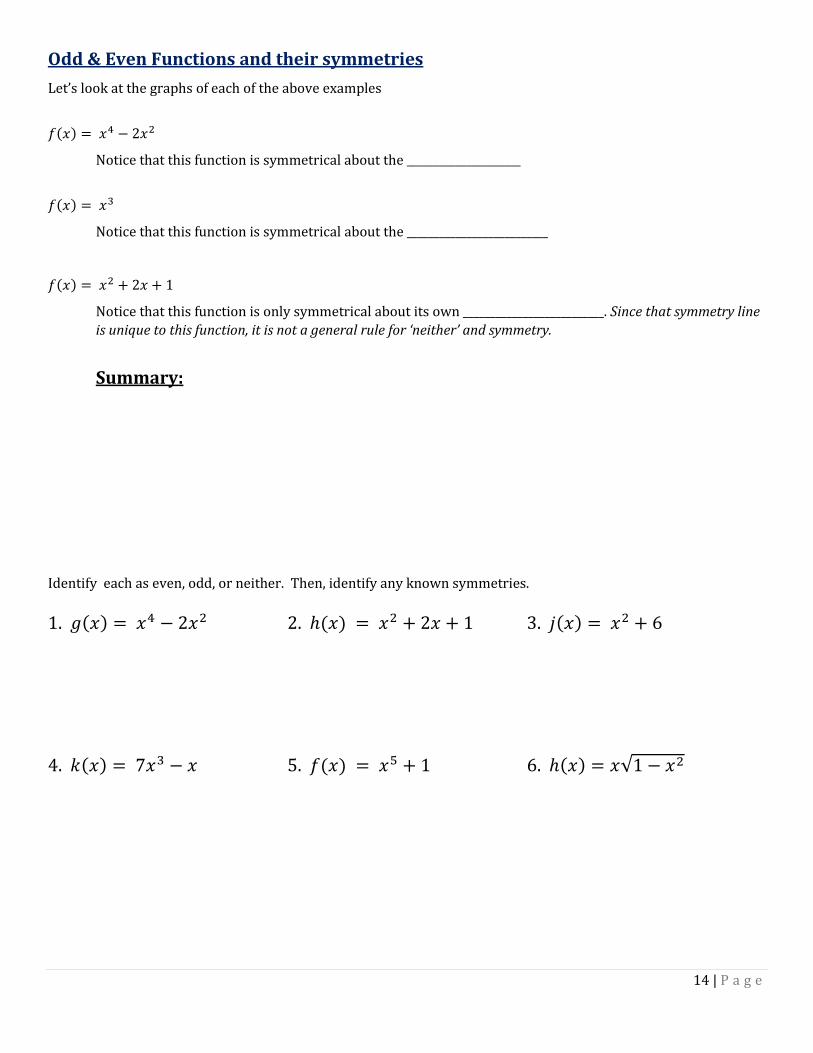
3.
Find:
a)the x- and y-intercepts
b)intervals where f is increasing
c)intervals where f is decreasing
d)relative maximum
e)relative minimum
y
x

13 | P a g e
Real Life Examples in Graphic Form
The function models the average number of paid vacation day workers receive each year nationwide, as shown in the graph.
a) About how many vacation days does an employee receive after 5 years?
b) After roughly how many years will an employee be receiving 20 days of vacation per year?
c) Describe the general trend shown by the graph.
Odd & Even Functions (or neither!)
Definitions: A function is EVEN if
The equation does not change if is replaced with
A function is ODD if
Every term in the equation changes sign when replaced with –
If neither of these statements is true, then the function is neither odd nor even.
Examples:
Evaluate
If it matches exactly: EVEN
If it doesn't: Test ODD?
Maybe Neither?
14 | P a g e
Odd & Even Functions and their symmetries
Let’s look at the graphs of each of the above examples
Notice that this function is symmetrical about the _____________________
Notice that this function is symmetrical about the __________________________
Notice that this function is only symmetrical about its own __________________________. Since that symmetry line
is unique to this function, it is not a general rule for ‘neither’ and symmetry.
Summary:
Identify each as even, odd, or neither. Then, identify any known symmetries.
1. 2. 3.
4. 5. 6.
15 | P a g e
Name: __________________________________________________________ Date: _________________________ Period: _________
Chapter 1: Graphs, Functions & Models
Topic 5: Shifts in Graphs
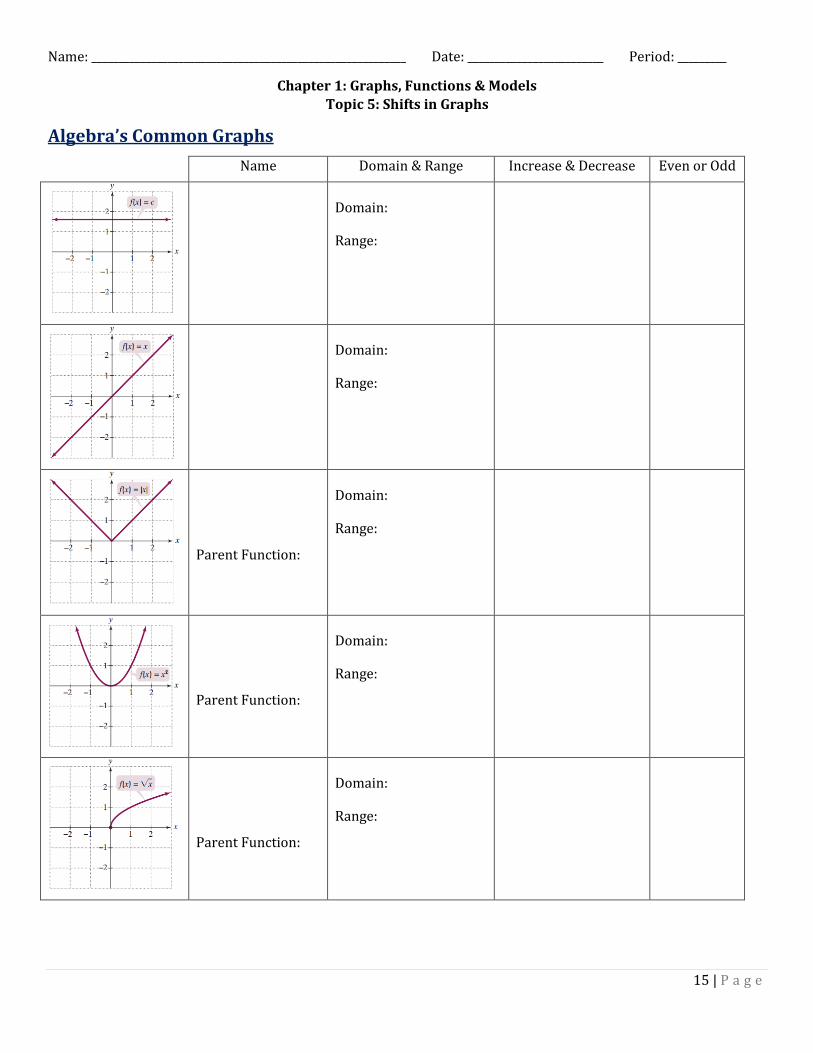
Algebra’s Common Graphs
Name Domain & Range Increase & Decrease Even or Odd
Domain:
Range:
Domain:
Range:
Parent Function:
Domain:
Range:
Parent Function:
Domain:
Range:
Parent Function:
Domain:
Range:
16 | P a g e
Parent Function:
Domain:
Range:
Parent Function:
Domain:
Range:
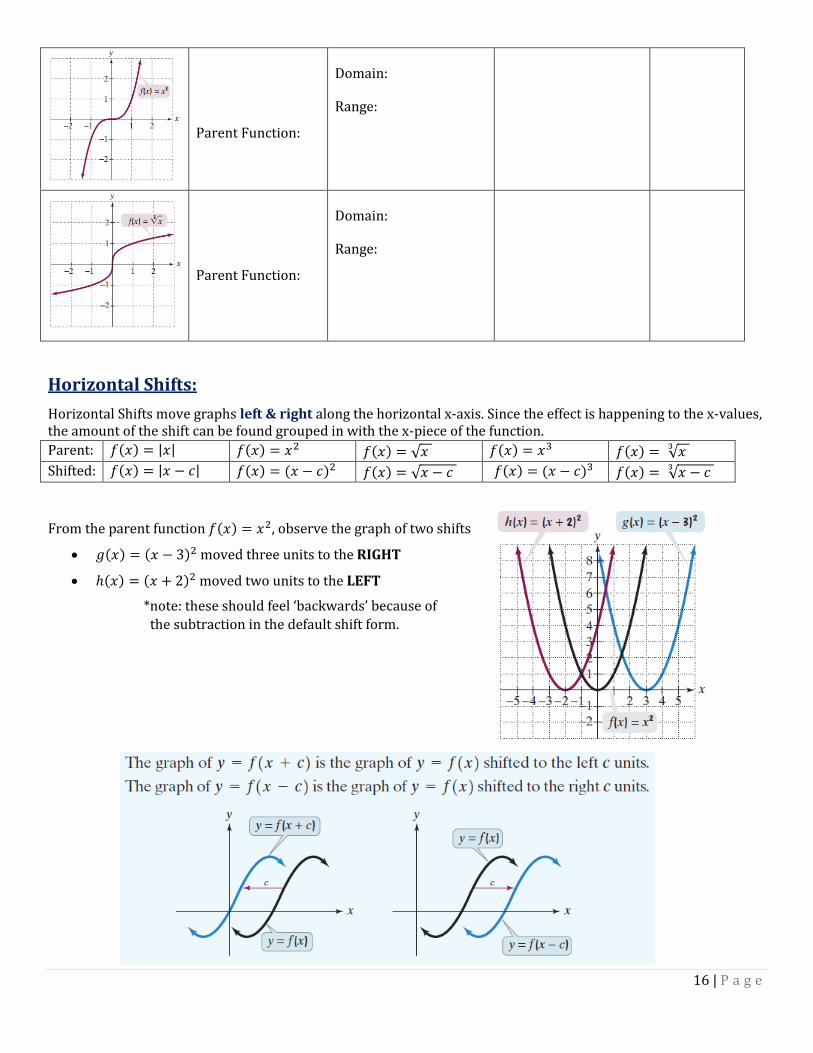
Horizontal Shifts:
Horizontal Shifts move graphs left & right along the horizontal x-axis. Since the effect is happening to the x-values, the amount of the shift can be found grouped in with the x-piece of the function.
Parent:
Shifted:
From the parent function , observe the graph of two shifts
moved three units to the RIGHT
moved two units to the LEFT
*note: these should feel ‘backwards’ because of
the subtraction in the default shift form.
17 | P a g e
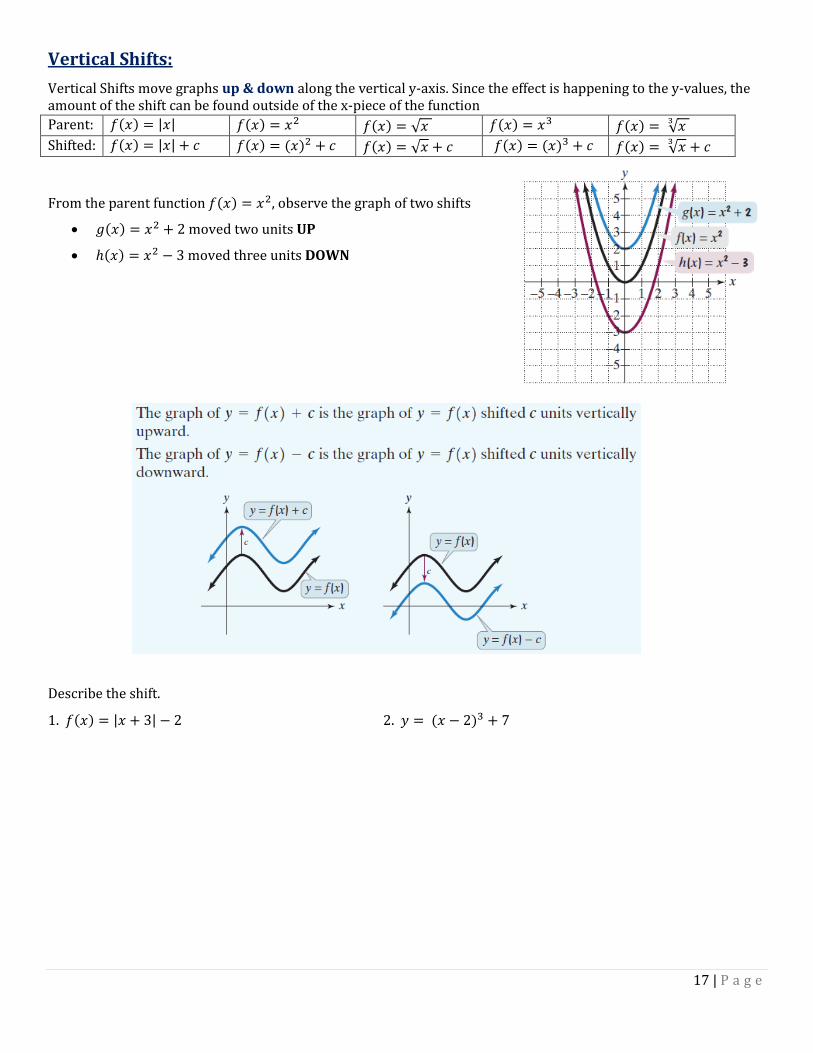
Vertical Shifts:
Vertical Shifts move graphs up & down along the vertical y-axis. Since the effect is happening to the y-values, the amount of the shift can be found outside of the x-piece of the function
Parent:
Shifted:
From the parent function , observe the graph of two shifts
moved two units UP
moved three units DOWN
Describe the shift.
1. 2.

18 | P a g e
Reflections of Graphs:
A negation in the function can cause the graph to reflect in an axis. Which axis depends on which part of the function is negated.
Parent:
Reflect in X-AXIS:
Reflect in Y-AXIS:
Compare two types of reflection from the parent graph
Reflection in the x-axis Reflection in the y-axis
The entire radical is negated Just the x is negated
19 | P a g e
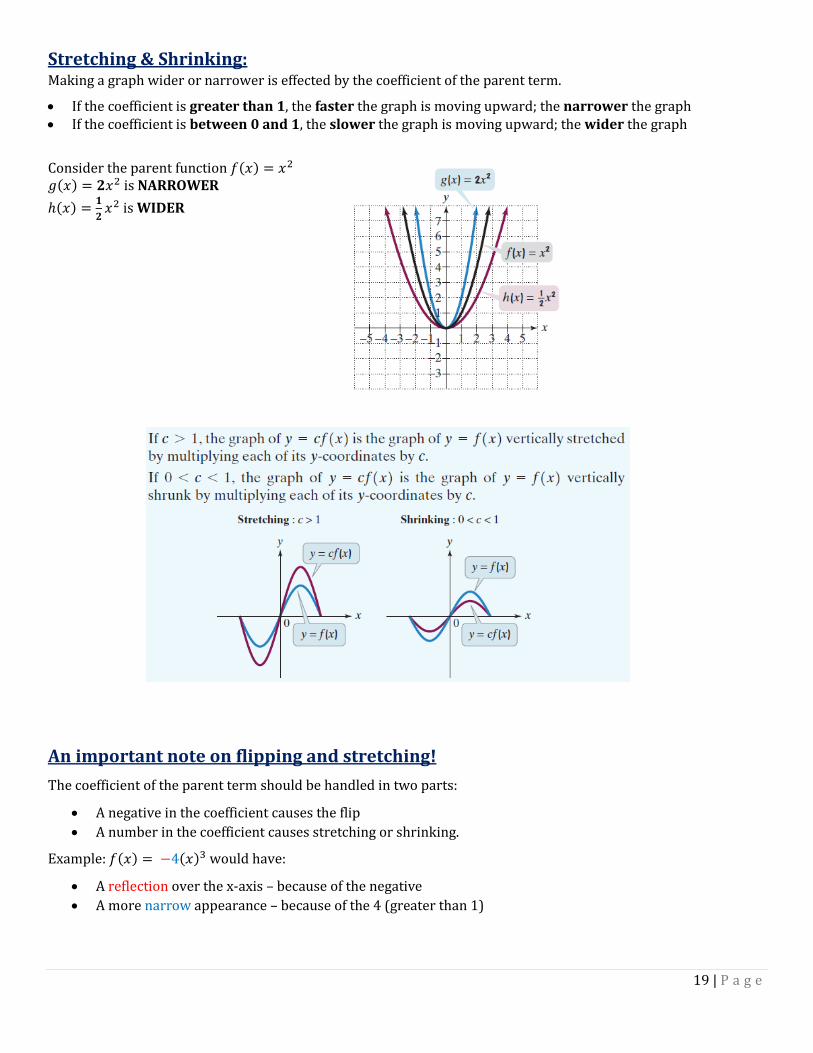
Stretching & Shrinking: Making a graph wider or narrower is effected by the coefficient of the parent term.
If the coefficient is greater than 1, the faster the graph is moving upward; the narrower the graph If the coefficient is between 0 and 1, the slower the graph is moving upward; the wider the graph
Consider the parent function is NARROWER
is WIDER
An important note on flipping and stretching!
The coefficient of the parent term should be handled in two parts:
A negative in the coefficient causes the flip
A number in the coefficient causes stretching or shrinking.
Example: would have:
A reflection over the x-axis – because of the negative
A more narrow appearance – because of the 4 (greater than 1)
20 | P a g e
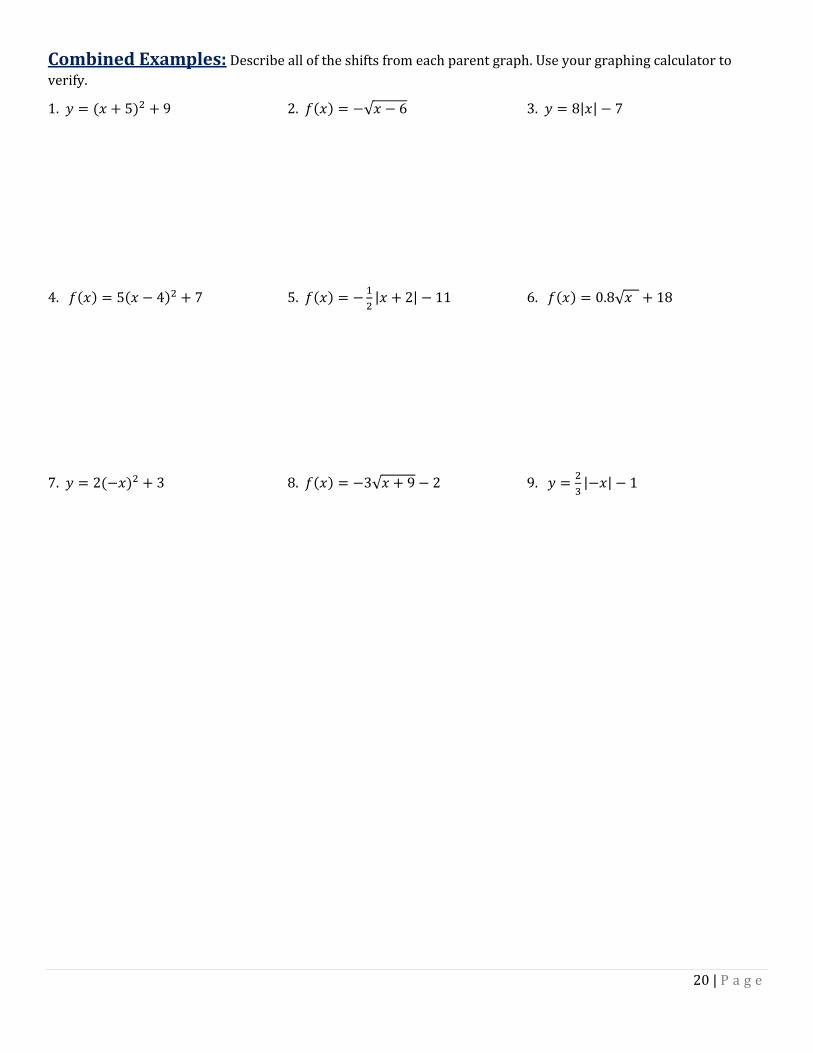
Combined Examples: Describe all of the shifts from each parent graph. Use your graphing calculator to
verify.
1. 2. 3.
4. 5.
6.
7. 8. 9.
21 | P a g e
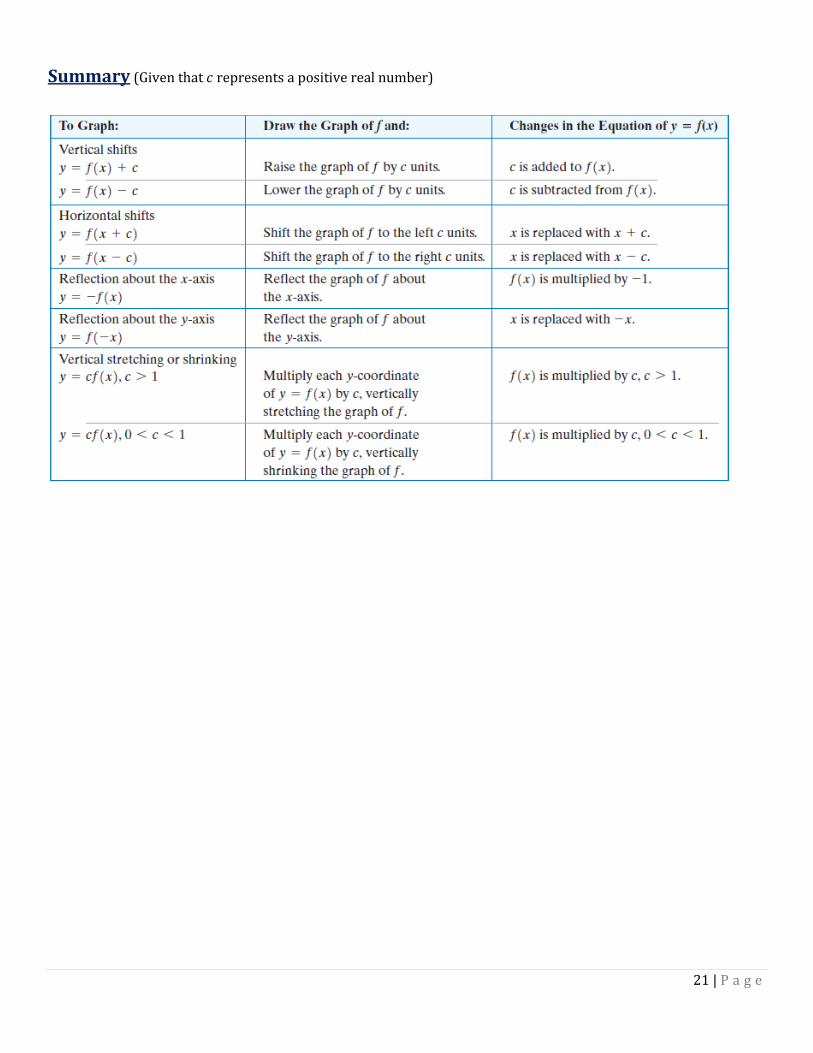
Summary (Given that represents a positive real number)

22 | P a g e
Name: __________________________________________________________ Date: _________________________ Period: _________
Chapter 1: Graphs, Functions & Models
Topic 6: Combinations & Composite Functions
Recall Function Notation:
Compare: Equation: Function Notation: Read out-loud as “f of x equals 2x+1” Examples with inputs:
1.) Given , – , and find each value: (a) (b)
(c)
Examples with outputs:
2.) Given
, find x such that
3.) If and , what is the value of x? 4.) Given , find x such that .
23 | P a g e
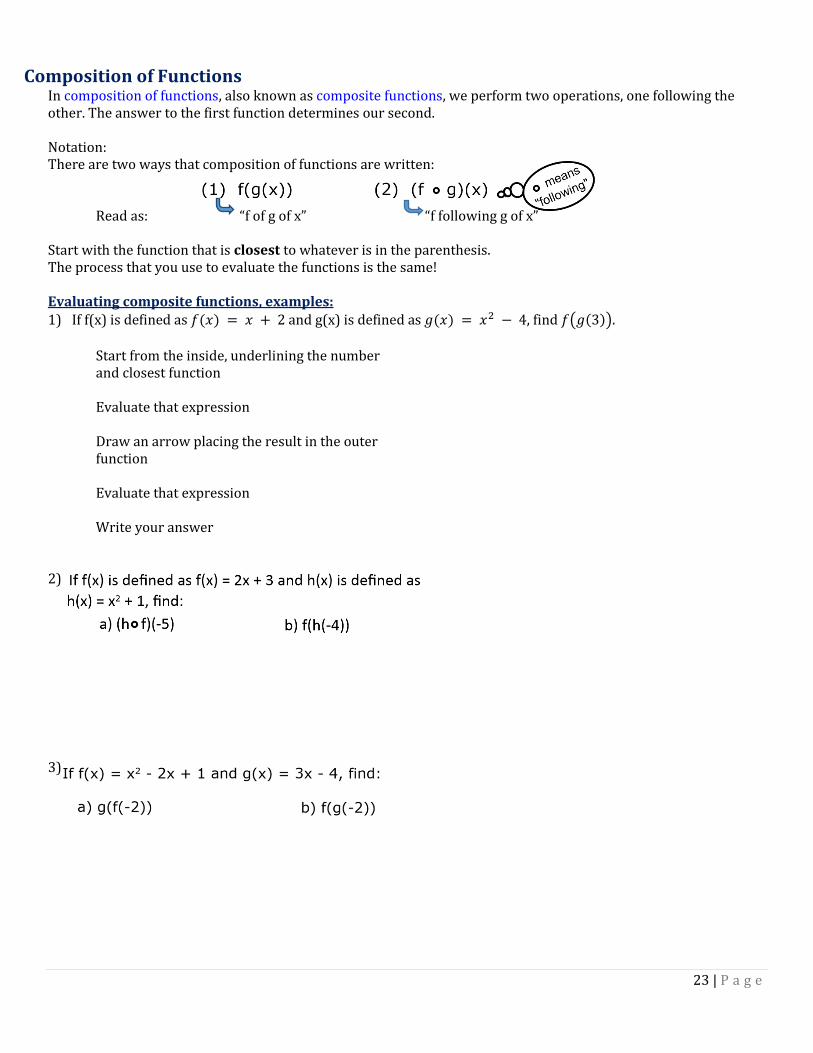
Composition of Functions In composition of functions, also known as composite functions, we perform two operations, one following the other. The answer to the first function determines our second. Notation: There are two ways that composition of functions are written: Read as: “f of g of x” “f following g of x” Start with the function that is closest to whatever is in the parenthesis. The process that you use to evaluate the functions is the same! Evaluating composite functions, examples: 1) If f(x) is defined as and g(x) is defined as , find .
Start from the inside, underlining the number and closest function Evaluate that expression Draw an arrow placing the result in the outer function Evaluate that expression Write your answer
2) 3)
24 | P a g e
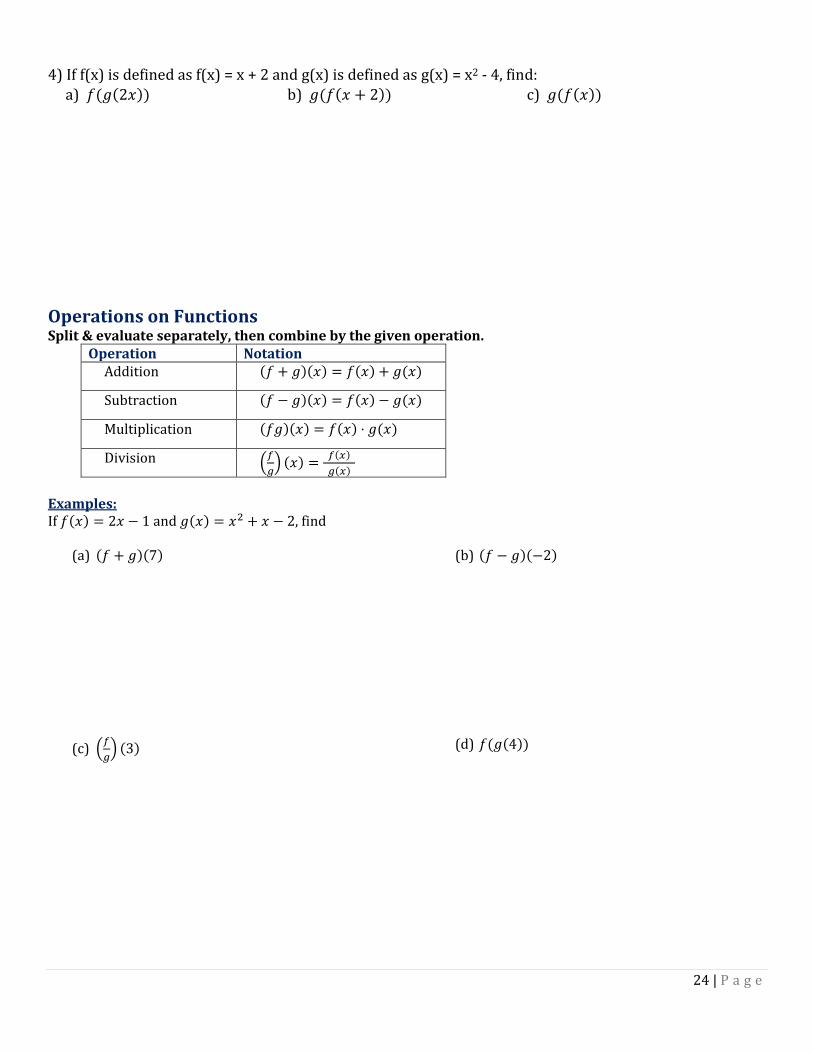
4) If f(x) is defined as f(x) = x + 2 and g(x) is defined as g(x) = x2 - 4, find: a) b) c)
Operations on Functions Split & evaluate separately, then combine by the given operation.
Operation Notation Addition
Subtraction
Multiplication
Division
Examples: If and , find
(a) (b)
(c)
(d)
25 | P a g e
Name: __________________________________________________________ Date: _________________________ Period: _________
Chapter 1: Graphs, Functions & Models
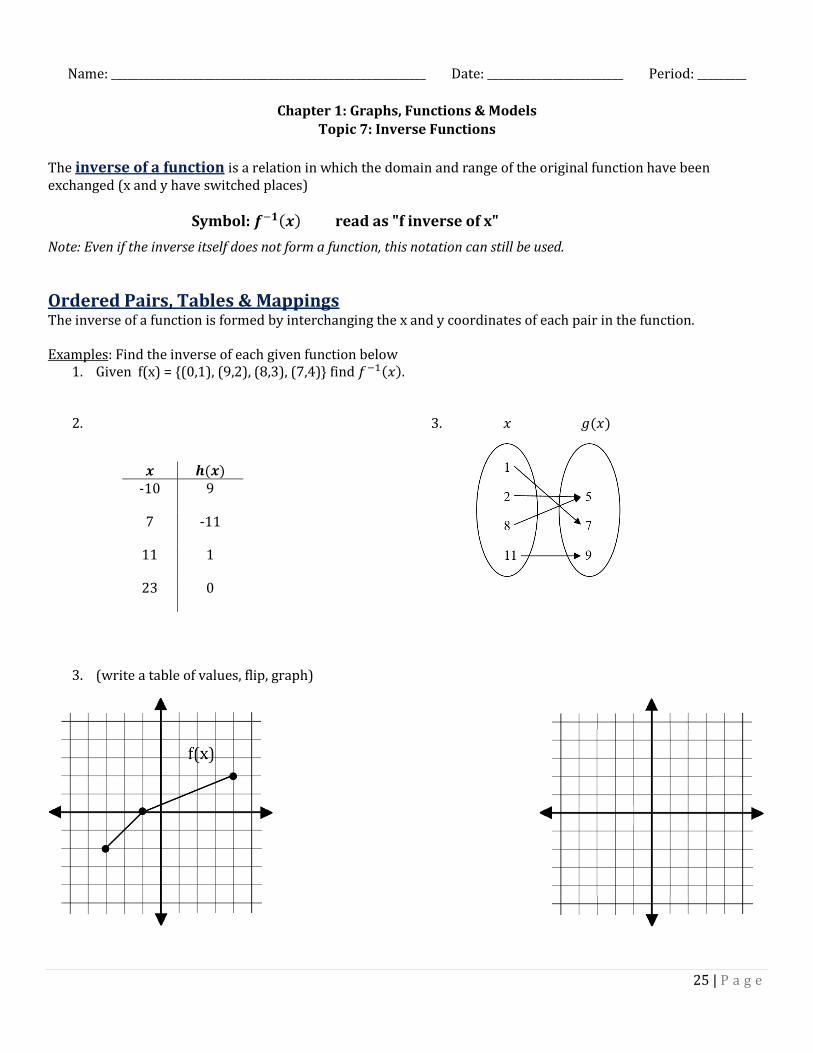
Topic 7: Inverse Functions
The inverse of a function is a relation in which the domain and range of the original function have been exchanged (x and y have switched places)
Symbol: read as "f inverse of x"
Note: Even if the inverse itself does not form a function, this notation can still be used.
Ordered Pairs, Tables & Mappings The inverse of a function is formed by interchanging the x and y coordinates of each pair in the function. Examples: Find the inverse of each given function below
1. Given f(x) = {(0,1), (9,2), (8,3), (7,4)} find .
2. 3.
3. (write a table of values, flip, graph)
-10 9
7 -11
11 1
23 0

26 | P a g e
Equations The process is still mainly switching the x & y values. But, in equation form, we need to re-solve for y to have the function in proper form.
Example: Find the inverse of if – a) Express the function as y b) Switch x and y to form the inverse c) Solve for y d) Express in inverse notation
Examples:
1. 2.
3.
4. 5. 6.
7.
8. 9.
27 | P a g e
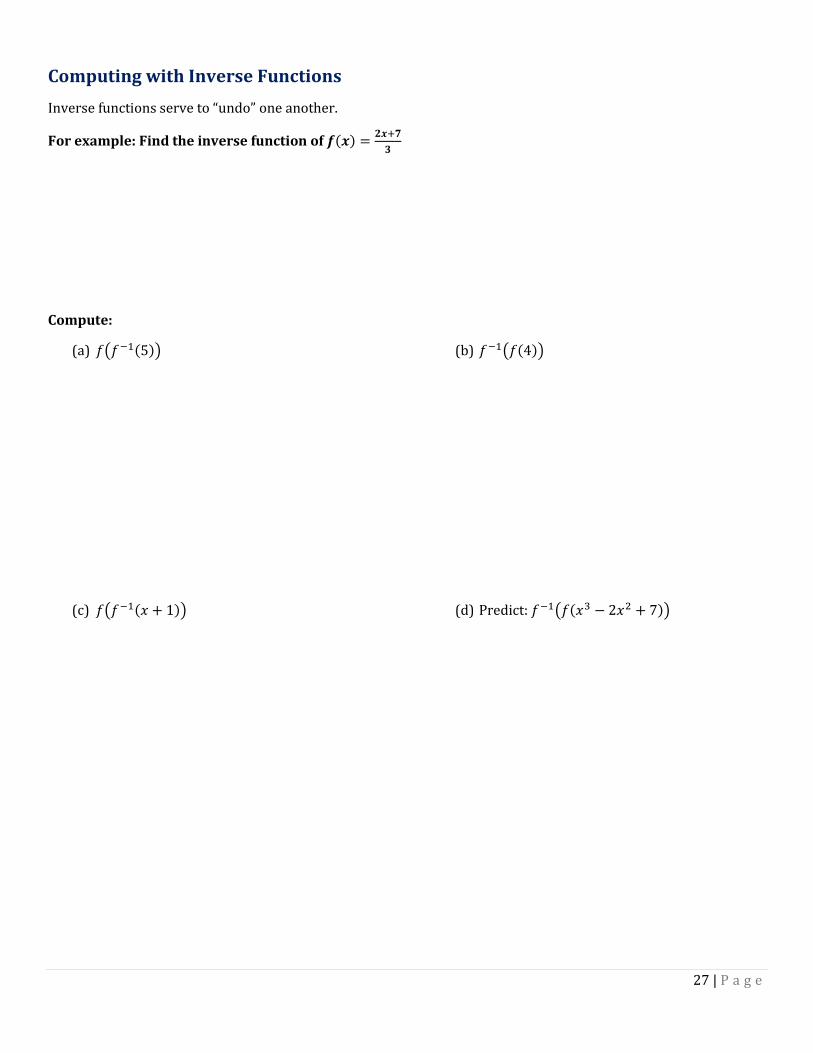
Computing with Inverse Functions
Inverse functions serve to “undo” one another.
For example: Find the inverse function of
Compute:
(a) (b)
(c) (d) Predict:
28 | P a g e
Name: __________________________________________________________ Date: _________________________ Period: _________
Chapter 1: Graphs, Functions & Models
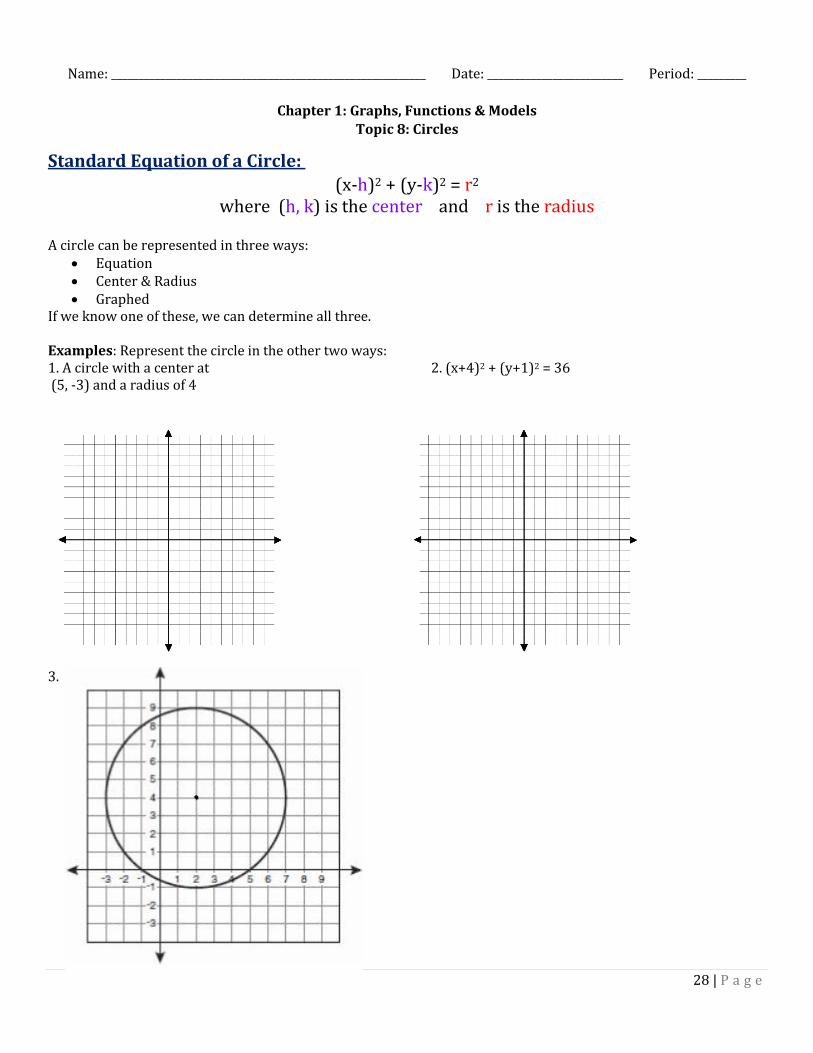
Topic 8: Circles
Standard Equation of a Circle:
(x-h)2 + (y-k)2 = r2 where (h, k) is the center and r is the radius
A circle can be represented in three ways: Equation Center & Radius Graphed
If we know one of these, we can determine all three. Examples: Represent the circle in the other two ways: 1. A circle with a center at 2. (x+4)2 + (y+1)2 = 36 (5, -3) and a radius of 4 3.

29 | P a g e
General Equation of a Circle:
x2 + y2 + Dx + Ey + F = 0
To convert from general form to standard form:
Examples: Rewrite the equation in standard form and identify the center and radius.
1. 2.
3. 4.
Rearrange: Put the x's together and the y's together. Move the constant. Complete the square: Twice. Once for x's, once for y's. Clean up.