chapter 1 introduction 1.1 introductionwiredspace.wits.ac.za/jspui/bitstream/10539/18794/1/chapter...
TRANSCRIPT

CHAPTER 1
INTRODUCTION
1.1 Introduction
Export Processing Zones (EPZs) are broadly defined as industrial estates specialising in
manufacturing for export which create distinctive arrangements allowing firms that
specialise in exports to qualify for a liberal regulatory framework such as duty-free
imported inputs. In their modern form, EPZs have been in operation since 1958, when the
Shannon Free Zone Industry was established in Ireland. South-East Asian countries were,
however, the first to successfully implement EPZs in the 1960s. In 1970 there were fewer
than 10 countries with EPZs. When Mauritius decided to create an EPZ in 1970, it was
therefore something of a pioneer of a relatively untested concept, especially in Africa.
Despite the obstacles that Mauritius faced and the initial existence of an unpromising
combination of sugar exports funding an inward-looking Import Substitution Strategy
(ISI), the Mauritius EPZ became a model of successful EPZ implementation in the 1980s,
for other countries south to emulate.
1.2 Importance of the study
As a result of the successes of EPZ which this thesis measures in terms of the ratio of
manufacturing exports to GDP (x/GDP) and growth rates of GDP, a fairly large literature
has emerged on Mauritius’s EPZ, although many elements of the successful
implementation and the economic impact of the EPZ remain unexplored.
This thesis seeks to add to the understanding of these issues, especially by analysing in
depth how the EPZ contributed to the economic growth of Mauritius. The thesis also seeks
to shed further light on why Mauritius succeeded where many others had failed. Many
countries in Africa have tried to set up an EPZ, but, despite launching these EPZs later than
Mauritius under arguably more favourable conditions, they have not been as successful as
Mauritius. Examples of sub-Saharan countries that have adopted EPZs are Togo (1989),
Namibia (1996), Kenya (1990) and Cameroon (1990).

2
South Africa established Industrial Development Zones (IDZs) only in 2002, which are
similar to EPZs, and more than ten years after their implementation only two zones are
fully operational. Although South Africa seems to offer more incentives and a much better
infrastructure than Mauritius did during the 1970s, the IDZs have not experienced the
exceptional take-off that was characteristic of the Mauritius EPZ. This may however be
influenced by the less favourable international environment that now prevails.
This study will address more comprehensively than previous work, the question of why
Mauritius was able to implement an EPZ as early as 1970 with subsequent great success.
The thesis will add to development literature on the importance of EPZs and which trade
theory best explains EPZ successes. It investigates whether EPZs on their own can
guarantee economic success and, finally, whether the post-preference (post-Multi-Fibre
Agreement) era will lead to a reversal of the gains the Mauritius EPZ generated in the past,
as many have argued. The results of the analysis will provide an indication of whether
Mauritius can adopt a strategy that will not only limit the negative impacts of preference
removal, but also bring opportunities for a reorientation and revival of the sector.
1.3 Outline of chapters
To answer these questions, it must first be known how the EPZ was created. This thesis
will thus start off in Chapter 2 with an in-depth analysis of the decision to create an EPZ
in Mauritius and what made this creation successful compared to other countries that tried
the same strategy. Chapter 2 will focus on the political economy factors that provided an
environment conducive to the creation of an EPZ in Mauritius. It is noted that political
economy has gained momentum amongst economists recently, as it helps to explain the
interaction between political institutions and the economic system and strategy.
Mauritius has been recognised as a uniquely successful example of EPZ implementation.
Several authors have discussed the Mauritius ‘miracle’ and the success of the EPZ. Many
of them have touched on political economy factors behind the success of the EPZ, but no
one explanation appears to be convincing on its own. Chapter 2 will add to existing
literature by attempting to bring together previous studies into a convincing and integrated
explanation. It will also be based on recent developments in the political economy literature
which identify and pull together a number of factors. The political economy factors will be

3
identified that were present in Mauritius prior to and after independence and it be will
ascertained whether our integrated approach could provide a framework to explain the
uniquely successful creation of the Mauritian EPZ.
Chapter 3 will first give an overview of the impact of the EPZ on the main economic
indicators of Mauritius and establish whether the EPZ was the main driver of Mauritian
growth in the early 1980s. This chapter will then try to identify, from a trade theory
perspective, the causal factors in the success of the EPZ in Mauritius. Existing literature on
the Mauritius EPZ has not interrogated trade theories to see which ones could be used to
explain the EPZ’s success. This chapter will try to address this shortcoming by proceeding
with an analysis to establish whether neoclassical or new trade theories best explain the
Mauritius story.
For instance, if Mauritius followed the path predicted by the Hecksher-Ohlin (H-O) model,
the country would have specialised in the production of those goods that use the factor of
production in which the country had a comparative advantage (e.g. the sugarcane
plantations, which make use of abundant agricultural labour, and perhaps the tourism
sector, which had good potential for the country) and import those products in which it did
not have a comparative edge, in this case manufactured goods from the USA and EU.
Therefore, Mauritius would have continued with the sugar sector, in which it had a
comparative advantage in terms of labour, rather than introduce the EPZ, which according
to the H-O model would create a distortion and lead to inefficiency. It will become clear
whether the H-O model in practical terms did fit the Mauritian reality in terms of
employment in the EPZ, which would increase but only at the expense of a decrease in
revenue and employment in the sugar sector, and also lead to a fall in the real economic
growth as inefficiencies set in.
If the H-O model proves unable to explain the EPZ story in Mauritius, alternative trade
theories will be tested to see whether they are better able to explain the EPZ story in
Mauritius. In particular, ‘new trade theories’ will be tested, especially the one produced by
Krugman and Venables, which incorporates the effects of transport costs and wages on the
gains from trade.

4
The chapter will then proceed with an analysis of the factor(s) identified from the chosen
theory, which could have been the determining factors for the success of EPZ in Mauritius.
Having identified the factors that contributed to the EPZ take-off in Mauritius and
eventually the Mauritius ‘miracle’, the next chapter, Chapter 4, will use cross-country data
covering 80 countries to examine whether from a broad perspective there is an association
between EPZ implementation and success. The question is: does EPZ lead to success or
vice versa (i.e. is it successful countries that implement EPZ)? There are a number of
theories and models that are suggestive about the nature of the association and causal
direction between EPZs and economic success, but the researcher has not come across any
study that uses extensive cross-country analysis to uncover empirically whether there is
such an association or not.
Through a series of empirical tests we will try to fill this gap by investigating the
association between success and EPZ from different angles. First, the types of countries
that decided to implement an EPZ will be analysed. To do this, the chapter uses probit
estimations, which will provide an indication of the characteristics of EPZ countries five
years prior to the implementation of the EPZ i.e. at period (t-5). From this estimation it will
be clear whether the EPZ countries were already set to perform well with or without an
EPZ.
Next, the Ordinary Least Square (OLS) estimates are examined to test the relationship
between success and an EPZ and between success and other factors identified as the other
exogenous (control) factors. Taking the other exogenous factors into consideration will
bring the data set down from 80 to 38 countries, because of data availability issues.
Whether there is selection bias in choosing the 38 countries from the list of the initial 80
countries will be tested.
The next step will be to question the potential endogeneity of EPZs and whether another
factor or factors are biasing upwards the effect of EPZs on success in the OLS tests. It will
also be investigated whether only certain exceptional countries with exceptional
characteristics chose the EPZ, and whether EPZ made a difference in terms of the success
measures.

5
Lastly, it will be investigated whether differences in the incentives offered by EPZs and
the types of incentives could provide an explanation of which EPZs are successful and
which are not. The results of the chapter will give a clear indication as to whether there is
an association between EPZ and success, and if there is not, it might strengthen the
argument that the EPZ’s contribution to the success of Mauritius was exceptional.
Chapter 5 will look at what happened to the Mauritius EPZ with the creation of the World
Trade Organisation after which the Multi-Fibre Agreement (MFA) was gradually phased
out, culminating in the complete removal of all preferences in 2005. Existing reviews of
the effects of MFA phase-out usually acknowledge net welfare losses for countries such as
Mauritius, where performance indicators such as exports and employment should be
adversely affected. To prevent any hasty conclusions, the chapter will consider two
possible consequences of the removal of preferences. Many analysts predict that the
removal of preferences will lead to total collapse of the manufacturing sector in Mauritius.
Others argue that Mauritius had developed such resilience that it was able to withstand the
counter-effects of preferences being taken away. An analysis of the two main performance
indicators for Mauritius – namely, exports and employment for the period 2000-2010, will
be undertaken and how different products have been affected in different ways will be
studied. We will analyse whether those products that were under preferences prior to 2005
did in fact experience a sudden fall in performance indicators after the preferences had
been removed. Next, a comparison of the exports of countries which had EPZs similar to
Mauritius will be carried out to provide a list of countries that have or will become direct
competitors to Mauritius in the more deregulated global trading environment.
The difference-in-difference (DID) estimation will then be used to compare the textile and
apparel sectors in Mauritius with other sectors in order to obtain the real effects of the
removal of the preferences. The estimation will compare changes of the product groups
Textile/Yarn/Fabrics and Apparel (Nos 3 and 4) with the other sectors in the Mauritian
manufacturing sector. The treatment group will be group 3+4, while the control group will
be the other sectors taken together. The simplest way would be to compute the average
treatment groups and control groups over the two time periods. One of the groups is
exposed to a treatment (preferences) in the first period, but not in the second period. The

6
second group is not exposed to the treatment during either period. In the case where the
same units within a group are observed in each time period, the average gain in the second
(control) group is subtracted from the average gain in the first (treatment) group. This
removes biases in the first period comparisons between the treatment and control group
that could be the result of permanent differences between those groups, as well as biases
from comparisons over time in the treatment group that could be the result of trends.
To confirm the DID results, a linear regression will be used to verify the average difference
between the treatment and control groups across time (from 2001-2008). This method
would be a way to eliminate fixed factors that might have an impact between treatment and
control groups.
Chapter 6 will bring together the main findings of the previous chapters and provide
answers to the main research sub-questions of the thesis. The chapter will also provide
some recommendations on the way forward.
1.4 Literature review
This section first reviews the literature on the political economy perspective to explain the
Mauritius EPZ. Existing literature on trade theories is then looked at, which will establish
for the later analysis of which one theory best explains the success of the EPZ in Mauritius.
Theories and models that are suggestive about the nature of the association between EPZs
and economic success are then regarded. Finally, existing studies on the effects of the
Multi-Fibre Agreement (MFA) phase-out are reviewed.
1.4.1 Previous studies on the political economy of Mauritius
Several authors have discussed the success of the Mauritius EPZ. Bowman (1991) argues
that unlike many developing countries, political power in Mauritius is balanced by
economic power. This plurality of power, he believes, is at the core of the success of
democracy in Mauritius. Brautigam (1997) is explicit on the role of institutions to explain

7
Mauritius’s success. She argues that democracy was achieved in Mauritius through the
inclusion of the major social actors (ethnic groups) in the reform process. She also
maintains that choices cannot be a function purely of such interests. The independent role
of ideas and ideology has to be acknowledged. Subramanian and Roy (2001) highlight the
importance of institutional quality in explaining Mauritius’s relative success. Subramanian
(2009) on his own goes further by critically evaluating four factors that have been advanced
as explanations for Mauritius’s growth success: the initial conditions, openness to trade,
foreign direct investment and institutions. Subramanian (2009) also turns to ethnic
diversity to explain the exceptional performance of Mauritius. Frankel (2010) recognises
that Mauritius made the correct policy decisions, which he attributes both to the deliberate
choices of individuals and to effective political institutions. All the above studies have
explained through different approaches the success in creating the EPZ in Mauritius. The
role of institutions and the inclusive political system are mentioned the most as factors
providing the necessary conditions for the EPZ to be implemented successfully.
Many of the political economy factors behind the success of the EPZ have been uncovered,
but no one explanation appears to be convincing on its own. The way forward would be to
pull together all the above factors into a convincing integrated explanation. Such an
explanation would be based on recent developments in the political economy literature,
which identify and pull together a number of causal factors. The first of these studies that
will be analysed is by Acemoglu and Robinson (2012). They argue that some countries are
poor because they are governed by a narrow elite, whose rule is characterised by a
concentration of political power and where the wealth created is shared only by those who
are very close to those in power. Poor countries are poor because those who rule them
choose deliberately – not by mistake or in ignorance – to create poverty. Differences
between rich and poor countries come down to differences in economic and political
institutions. Therefore, the choice of political and economic institutions will determine
whether countries encourage or impede economic growth. The politics of institutions is
therefore central to the quest for understanding the reasons behind the success or failure of
nations.

8
Lin (2009) argues that while the importance of institutions is undeniable, the question of
sudden and sustained growth periods in some countries remains unanswered. Lin (2009)
sees continuous technological upgrading as the most important engine for a country’s
economic growth, and relates to this the notion that ideas are the most vital determinants
of a country’s growth. Lin (2009) also identifies the government as the most important
institution in any country. He says that people have to understand the leadership and
motivation of the political leaders who run the government. Qian (2001), on the other hand,
explains the unprecedented economic growth of China through its institutional reform and
how the transitional institutions of markets, firms and government worked in China.
According to Qian (2001), there is a need to broaden our perspective on institutions. Qian
(2001) analyses the successful reforms as well as the failure of Chinese institutional
reforms. The most notable successful reform, which is similar to the Mauritius case, is
market liberalisation through the ‘dual-track’ approach under which prices were liberalised
at the margin, while quotas were maintained. We had two tracks: the plan track and market
track.
Based on previous studies and recent literature, Chapter 2 will identify the political
economy factors which facilitated the creation of the EPZ in Mauritius. It will provide a
better understanding and insight on the first research sub-question of the thesis, which is:
‘what are the political economy factors that created the enabling environment for the
creation of the successful EPZ in Mauritius?’
1.4.2 Trade theories that may best explain the Mauritius EPZ story
Existing literature on the Mauritius EPZ has not specifically interrogated trade theories to
see which one could be used to explain the success of EPZ in Mauritius. Madani (1999)
points out that success will depend critically on the factor intensity of the two sectors. He
assumes that when small underdeveloped countries have a comparative advantage in
labour-intensive industries and protect their capital-intensive sectors, then an EPZ will
reduce the country’s welfare. Madani’s assessment is based on the model developed by
Hamada (1974) in his analysis of the economic implications of EPZs. Hamada states that
an EPZ does not necessarily improve consumption possibilities in the developing country.
He therefore concludes through the use of the H-O model that with the establishment of an

9
EPZ the potential consumption possibility for a country does not improve despite the
introduction of more investment. On top of that, labour is taken away from the more
productive sector (agriculture) to the capital-intensive sector (manufacturing).
New trade theory by Krugman and Venables was developed to explain the aspects of the
real world that the H-O model failed to consider in explaining trade between nations. The
World Trade Report (2008) asserts that in the 1980s, data set on trade at firm level became
available and showed considerable differences among firms, which led to alternative trade
theories which would attempt to produce new theoretical explanations for the shortcomings
of the H-O model with its problematic assumptions, such as no transport costs,
homogenous products, constant returns to scale and perfect competition.
The new trade theory assumed imperfect competition and increasing returns to scale, as
well as intra-industry trade and rather than focusing on factor endowments only to explain
trade, Krugman and Venables (1995) focus on geographical concentration of varieties, i.e.
different countries producing different varieties and then trading them. The Krugman and
Venables (1995) model most clearly incorporates the effects of transport costs and wages
on the gains from trade.
In Chapter 3, an in depth analysis is firstly provided on the contribution of EPZ to the
Mauritian economy at the time of its take-off. The chapter will then review the neoclassical
and new trade theories to determine which one of them is more appropriate to explain the
factors behind the success of EPZ in Mauritius.
1.4.3 Association between EPZs and economic success
There are a number of theories and models that are suggestive about the nature of the
association between EPZs and economic success. For most neoclassical economists, EPZs
can only be viewed as a second-best option. The best option will always be complete
liberalisation. However, Cling (2001) has provided an overview of economists who take a
different view from the majority and show that the creation of EPZs improves a country's
wellbeing. New growth theorists tend to take a more positive view than neoclassical
economists, as they stress the possible external effects of an EPZ on the host economy,
such as learning effects, human capital development and demonstration effects. By

10
recognising the importance of these positive externalities, new growth theorists point to
important gains for host countries that successfully implement EPZs (Johansson & Nilsson,
1997). Tyler (2009), using the endogenous growth framework of new growth economics,
analyses the empirical effects of the adoption of an EPZ policy on the growth of countries.
The analysis incorporates the use of EPZs in the empirical estimates of a growth equation
and demonstrates a positive and significant relationship between the use of EPZs and
economic growth. Radelet (1999) observes that success in manufactured exports has been
nearly synonymous with rapid economic development. Although he is an advocate of EPZ
leading to economic success, he also points to the general importance of the broader
policies and underlying preconditions that are needed to encourage growth in manufactured
exports. This suggests that countries that have successfully implemented the types of EPZs
that led to increases in manufacturing exports were already performing well.
Using empirical analysis, Chapter 4 will demonstrate the direction of the association
between EPZ and success and whether it is the adoption of EPZs that leads to success, or
economic success leads to the adoption of EPZs, or if there are other contributing factors
to success.
1.4.4 The effects of MFA phase-out and the Agreement on Textiles and Clothing
Francois and Spinanger’s (2004) study points out that the MFA was a preference system,
which helped other developing countries at the expense of India and China. The potential
for Chinese and Indian exports after 2005 would therefore mean lost market share for most
of the other suppliers in the developing world, who produced at a higher cost. UNCTAD
(2005) suggests that the end of the MFA will change the location of Foreign Direct
Investors and cause FDI to leave countries that previously enjoyed quota access and move
to countries with lower wages or other production advantages. The World Bank (2009)
suggests that the end of the MFA may mean a decrease in both exports and FDI in countries
affected by this regime change. Wacziarg and Wallack (2004) examine the inter-sectoral
employment effects for 25 liberalisation episodes in a set of developing and transition
economies. At the 3-digit level the employment effects of trade liberalisation are
pronounced. Wacziarg and Wallack (2004) also report that a liberalisation episode five

11
years in the past will reduce the two-year growth in manufacturing employment in a
country by 4.02 percentage points. Revenga (1997) finds small employment effects for
Mexico and small employment effects are found in other studies as well. Currie and
Harrison (1997) provide evidence as to why such employment effects might be small. They
analyse data from Morocco and find that the impact of trade on wages and employment
depends on the degree of imperfections in the output market. For competitive markets in
which profit margins are small, import penetration reduces employment. By contrast, for
those markets with larger profit margins, virtually no change occurs in wages or
employment. These results led the World Bank (2009) to conclude that, at least for these
cases, increased trade exposure was positive.
Chapter 5 will start by noting that with the creation of the World Trade Organisation
(WTO) and the complete removal of preferences, the future of the Mauritian EPZ, in
particular the textiles and clothing sector (which constitutes the bulk of EPZ exports),
seemed very uncertain. Most studies related to the removal of preferences on textiles and
clothing generally reveal welfare losses for countries such as Mauritius. Chapter 5 will
analyse the evolution of the Mauritian manufacturing sector and its various product groups
during and after the removal of preferences to see whether there was actually a sudden fall
in exports and employment (the two performance indicators), and whether that fall was
specific to textile and clothing products once the preferences had been removed.
References
Acemoglu, D. & Robinson, J.A. (2012). “Why Nations Fail, The Origins of Power,
Prosperity and Poverty”. London: Profile Books.
Bowman, L.W. (1991). “Mauritius: Democracy and Development in the Indian Ocean”.
London: Westview Press.

12
Brautigam, D. (1997). “Institutions, Economic Reform and Democratic Consolidation in
Mauritius”. Comparative Politics, Vol. 30, No. 1 (October): 45-62.
Cling, J.P & Letilly, G. (2001). “Export Processing Zones: A Threatened Instrument for
Global Economy Insertion”, DIAL Working Paper No: 2001/17, CIPRE Research Unit,
cited in the World Bank, Special Economic Zones: Performance, Lessons Learned, and
Implications for Zone Development, (Washington, DC: World Bank, April 2008), p.12.
Currie, J. and Harrison, A. E. (1997). “Sharing the Costs: The Impact of Trade Reform on
Capital and Labor in Morocco.” Journal of Labor Economics 15 (3): S44–71.
Francois, J. and Spinanger, D. (2004). “Liberalizing quotas on textiles and clothing: has
the ATC actually worked?” 7th Annual Conference on Global Economic Analysis, June 17-
19 2004, Washington, DC.
Frankel, Jeffery A. (2010). “Mauritius: African Success Story.” NBER Working Paper No.
16569, Cambridge, MA: National Bureau of Economic Research.
Hamada, K. (1974). “An Economic Analysis of the Duty-Free Zone”. Journal of
International Economics, 4: 225-241.
Johansson, H. and Nilsson, L. (1997). “Export processing zones as catalysts”. World
Development, 25(12): 2115-28.
Krugman, P. (1995). Development, Geography and Economic Theory, Cambridge (MA):
MIT Press.
Krugman, P. and Venables, A. (1995). “Globalization and the Inequality of Nations”. The
Quarterly Journal of Economics, Vol. 110, No. 4: 857-880.

13
Lin, Justin Yifu (2009). Economic Development and Transition: Thought, Strategy and
Viability. New York: Cambridge University Press.
Madani, Dorsati (1999). “A Review of the Role and Impact of Export Processing Zones”.:
Washington D.C: World Bank.
Qian, Yingyi (2001). “How Reform Worked in China”. Paper read at Department of
Economics, University of California.
Radelet, S. (1999). “Manufactured exports, export platforms, and economic growth.”
Cambridge, MA: HIID. Mimeo, available at
http://www.cid.harvard.edu/caer2/htm/content/papers/confpubs/paper43/paper43.pdf
Revenga, A. (1997). “Employment and Wage Effects of Trade Liberalization: The Case of
Mexican Manufacturing.” Journal of Labor Economics, 15 (3): S20–S43.
Subramanian, A. & Roy, D. (2001). “Who can explain the Mauritian Miracle: Meade,
Romer, Sachs or Rodrik?”. IMF Working Paper, available at
http://www.iie.com/publications/papers/subramanian0701imf.pdf.
Subramanian, A. (2009). “The Mauritian Success Story and its Lessons.” UNU-WIDER
Research Paper. World Institute for Development Economic Research (UNU-WIDER).
Available at http://ideas.repec.org/p/unu/wpaper/rp2009-36.html.
Tang, V. (2008). “Zoning in on South Africa’s Industrial Development Zones.” School
of Economics & Finance, University of KwaZulu-Natal – TIPS Annual Forum October
2008.
Tyler, W. and Negrete, A. (2009). “Economic Growth and Export Processing Zones: An
Empirical Analysis of Policies to Cope with Dutch Disease”, LASA 2009 Congress, Rio
de Janeiro.

14
United Nations Conference on Trade and Development (UNCTAD) (2005), “TNCs and
the Removal of Textiles and Clothing Quotas”. UNCTAD/ITE/IIA/2005/1. New York and
Geneva: United Nations.
Wacziarg, R. and Wallack, J.S, (2004). “Trade Liberalization and Intersectoral Labor
Movements.” Journal of International Economics 64 (2): 411–39.
World Bank (2009). “International Bank for Reconstruction and Development:
Globalisation, Wages and the Quality of Jobs-Five Country Studies”. Washington D.C:
World Bank.
World Trade Report (2008). “Trade in a Globalized World”. Geneva: World Trade
Organisation Secretariat.
CHAPTER 2
THE CREATION OF THE MAURITIUS EXPORT PROCESSING ZONE
FROM A POLITICAL ECONOMY PERSPECTIVE
2.1 Introduction

15
Political economy broadly brings together economics, law and political science to explain
how political institutions (especially. the state) operate in relation to the economic system
and how these institutions affect the economic outcomes within a country. Political
institutions create, enforce and apply laws in the country. Mainstream political economy
approaches tend to assume that voters, politicians and bureaucrats take self-interested
analyses of how competing interests strive for power and control over limited resources,
and examines how public policy is created and implemented within this framework
(Tullock 2008). According to Alesina (2007), in recent years political economy has gained
popularity because it sheds light on complex processes such as economic reforms, the
interaction of political institutions and economic outcomes, all of which are both political
and economic phenomena.
In this chapter the adoption of an Export Processing Zone (EPZ) in Mauritius will be
explained from a political economy perspective. The chapter will also seek to understand
why the country successfully implemented the EPZ strategy. As a contribution to the
existing literature on the Mauritius EPZ story, the chapter brings together a range of
existing explanations to form an integrated political economy framework.
The chapter will show that the role of inclusive institutions, ideas, ethnic diversity, luck,
leadership and the choice of a dual-track economic strategy make up a broad framework
within which the creation of the EPZ in Mauritius can be explained, while the role of
compromise-based politics is also of major importance.
At the time of independence in 1968, the Mauritius government inherited from the colonial
power a poor country that relied on the sugar mono-crop and used an industrialisation
strategy based on Import Substitution Industrialisation (ISI). This was not helping the
economy to move forward on the growth path. This chapter analyses the gradual movement
of Mauritius away from the ISI – while still retaining part of it – towards the establishment
of an Export Processing Zone (EPZ) which would become the engine of economic
development of Mauritius during the 1980s. The outline of the chapter is as follows: It
starts with a review of previous studies on the political economy of Mauritius which
outlines how different authors have explained the success of Mauritius. The next section
defines the recent approaches to explaining the EPZ story, based principally on inclusive

16
institutions. To formulate the approach, recent studies on political economy which have
examined the growth of developing nations from different perspectives – namely, those by
Acemoglu and Robinson, and Lin and Qian – have been drawn from to explain the
economic growth of nations.
Thereafter a brief factual overview is given of the history of Mauritius prior to
independence, which will explore the recent history of the island to see how institutions
emerged, and what kinds of institutions were created by the French and British colonisation
of Mauritius. The overview will also consider why ethnic politics mattered when the
Indians, Africans, Chinese, etc. came to Mauritius. It will also look at when and how the
political elite emerged and what the ethnic considerations were at the time of independence.
This is followed by a descriptive analysis of the economic strategy of Mauritius prior to
and after independence. Starting with the sugar mono-crop strategy, the colonial
government attempted to diversify through the Import Substitution Industrialisation (ISI)
strategy in 1964. At the time of independence, Mauritius chose to keep the ISI strategy,
even though it was not providing the expected results, while at the same time moving the
economy towards the EPZ.
The final section analyses the EPZ story in Mauritius from a political economy perspective.
It draws on the factors that jointly provided the framework to explain the successful
creation of the EPZ in Mauritius.
2.2 Previous studies on the political economy of Mauritius
Mauritius has been recognised as a uniquely successful example of EPZ implementation.
Several authors have therefore discussed the Mauritius ‘miracle’ and the success of the
EPZ. Their contributions to the debate on the Mauritius story are discussed next in
chronological order, starting with the earliest publications.
During the early 1990s when Mauritius was reaping the full benefit of its ‘economic
miracle’, academics started to show increasing interest in the Mauritius story. Bowman

17
(1991) is one of the first to explain the Mauritius miracle with a tentative attempt to look
at it from apolitical economy perspective. He expresses the view that though the unique
ethnic composition of Mauritius could be a causal factor behind Mauritius’s success, ethnic
diversity cannot provide the full explanation. He argues that it is necessary to look beyond
ethnicity for the overall economic, social and political structures which tie society together
into one coherent whole. These institutions determine how ethnicity will play out in policy
decisions.
Bowman (1991) also argues that unlike many developing countries, political power in
Mauritius was balanced by economic power. This plurality of power, he believes, is at the
core of the success of democracy in Mauritius. A strong opposition and a lively press have
also contributed to the deepening of democracy.
Brautigam (1997) focuses more explicitly on the role of institutions in her attempt to
explain Mauritius’s success. She argues that democracy was achieved in Mauritius through
the inclusion of the major social actors (ethnic groups) in the reform process. As a
consequence, successive governments were able and willing to compensate losers, reward
cooperation and maintain reform coalitions. She argues that it is critical to understand why
and how particular institutions were chosen, and why political actors in Mauritius agreed
to abide by the rules they crafted when similar rules in so many African countries have
been suspended. While she agrees that economic interests played a role, she maintains that
choices cannot purely be a function of such interests. The independent role of ideas and
ideology has to be acknowledged. Shared ideologies can shape peoples’ perception of their
interests, increase trust and cooperation (social capital), and facilitate difficult economic
policy reforms.
Subramanian and Roy (2001) suggest that the success of the EPZ can, on the surface, be
explained by the financial incentives provided to EPZ firms by the Mauritian government.
However, a deeper analysis of the political economy factors behind the implementation of
this EPZ leads the authors to draw on the ‘idea’ concept introduced by Romer (1992).
Romer argues that initially Mauritius successfully imported ideas from foreigners, which
led them to choose and structure the EPZ in a certain way. The EPZ then made investment
attractive to foreigners, who in turn brought new productivity-enhancing ‘ideas’ into

18
Mauritius. Subramanian and Roy question this argument by pointing out that the
introduction of EPZs was not unique to Mauritius. EPZ facilities were also set up in other
African countries, including Senegal, Madagascar and Cameroon. These countries were
not nearly as successful as Mauritius. Therefore, to explain the success of Mauritius we
need to go beyond the mere importing of ideas.
Subramanian and Roy highlight the importance of institutional quality in explaining
Mauritius’s relative success. Mauritius ranks well above the average African country with
respect to all indices of institutional quality, political as well as economic. They argue that
EPZs have failed in most countries because institutions and governance have not been able
to manage the corruption and inefficiency that tend to undermine the performance of EPZs
in other countries. They maintain that the well-paid Mauritian civil service, which emerged
from the political bargain between the political and economic elites at independence, is the
key to explaining the low levels of corruption and inefficiency in Mauritius’s EPZ
programme.
Subramanian (2009) takes it further by critically evaluating the four factors that have been
advanced as explanations for Mauritius’s growth success: the initial conditions, openness
to trade, foreign direct investment and institutions.
He argues that the excellent performance of Mauritius during the 1980s cannot be attributed
to favourable initial conditions, as Mauritius was far worse off on almost all indicators
except human capital than the average African economy back in 1968.
With regard to the openness strategy, Subramanian (2009) highlights the ‘heterodox
opening’ strategy, which segmented the export and import sectors. Mauritius ensured that
the returns from exports were high and prevented the restrictive trade regime prevailing in
the rest of the economy from spilling over to this sector. The high returns of the export
sector ensured that domestic resources were not diverted to the inefficient domestic sector.
The institutional mechanism for achieving the so-called segregation of the export sector
from the importing sector was the creation of the EPZ with a lot of policy instruments as
incentives – for example, duty-free access, tax incentives and flexible labour market
conditions. Mauritius thus managed to maintain a balance of incentives between the export-
and import-competing sectors. This was achieved through a high level of intervention in

19
both imports and exports. On the one hand, imports were restricted through high trade
barriers to protect domestic producers practising Import Substitution Industrialisation (ISI).
On the other, extensive support was provided to exporters by means of the EPZ to offset
the inefficiencies associated with import substitution.
In his paper Subramanian (2009) further questions Romer’s arguments about importing
ideas, by adding that the Mauritius EPZ sector – unlike many other countries – had a
substantial local presence. So it was not merely foreign ideas that provided the basis for
the success of the Mauritian EPZ.
He again stresses that these factors are proximate rather than underlying causes of
Mauritian growth success. The favourable trade environment and the creation of an EPZ
were not unique to Mauritius.
It seems that strong institutions may provide a good explanation for the success of the
Mauritian EPZ. Since independence, Mauritius has been a democracy with strong
participatory institutions. However, econometric tests undertaken by Subramanian (2009)
reveal that even if institutions are included, there is still a significant unexplained
component of Mauritian growth.
To account for this gap, Subramanian (2009) turns to diversity to explain the exceptional
performance of Mauritius. Diversity had three important benefits, he argues: it was a
movement of communities or diaspora that turned out to have important linkages with the
rest of the world, thus creating positive externalities for the country; it forced the need for
economic balance between groups. This explains, for example, the preservation of the
sugar industry, which remained under the control of the white community. It also forced
the need for participatory political institutions that were important in maintaining stability,
law and order, the rule of law and mediating conflict.
Fowler (2009) notes that countries that have pursued two-track gradualist reform paths
have successfully proved that there is no uniform way of approaching growth. The
preferences that Mauritius gained from trade agreements with the EU and USA led to large
profits. These were partially reinvested in tourism, manufacturing and basic infrastructure.
However, Fowler notes that there was a clear disincentive against diversification within the
20
market. The government of Mauritius then intervened and offered as many incentives as
possible to attract businesses to the EPZ.
Frankel (2010) recognises that Mauritius made many good policy decisions that
contributed to the country’s success – namely, the establishment of the EPZ, diplomacy
regarding trade preferences from Britain, Europe and the USA, spending on education and
later free education and facilitation of business. He attributes these policies both to the
deliberate choices of individuals and to effective political institutions – namely an
appropriate parliamentary system, no expropriation of the elites at the time of
independence, no single elite group dominating others, no army, and a vigorous opposition
and media. However, he argues that any country can in principle adopt effective institutions
and strong policies at any time. What was unique about Mauritius, the Seychelles and Cape
Verde, for that matter, was that they did not have any indigenous populations. Everyone
came from somewhere else.
How does that make them different from other countries? Frankel (2010) provides two
plausible angles: migrants’ self-select for vigour and initiative, and they pass these traits
on to their descendants; or most countries have nativist factions, children of the soil who
resent newcomers regardless of their merits – or perhaps because of their merits. Thus, if
everyone came from somewhere else, nobody could claim special privileges. This creates
a unique combination of ethnicities and as a result the Franco-Mauritians were willing to
trade off their past dominance of political power for guarantees under a post-independence
system that they would keep their sugar plantations. Indo-Mauritians now had the political
power and the Sino-Mauritian community developed businesses through their links with
their country of origin.
The role of institutions and the importance of inclusive political power emerge as the
dominant explanations for the establishment and successful implementation of the
Mauritian EPZ. The ‘heterodox opening’ (dual-track approach) with intervention in both
exports and imports was clearly important as it allowed the state to balance the vested
interests of economic power with those of political power.
As a result, the Franco-Mauritians would retain their economic power in the form of sugar
plantations and the ISI businesses, while the Indo-Mauritian community would benefit

21
from jobs in the civil service as part of the transfer of rents from the sugar plantations to
the government. Furthermore, part of the sugar plantations owned by Franco-Mauritians
would be sold to the Indo-Mauritian community when the Franco-Mauritians community
decided to move towards the ISI and EPZ. As for the Sino-Mauritian and Creole
populations, they would become the owners of the first EPZ companies, and many of their
employees would be the poor members of their respective communities, which helped to
address the unemployment problem in the country.
Had the government chosen to go the route of nationalisation, most of the Franco-
Mauritians would have left the country. Similarly, if a policy of complete liberalisation was
adopted and the ISI abandoned, the Franco-Mauritian elites – who had the economic means
to adjust and cope with liberalisation – would have benefited, but this would have been at
the expense of the new bourgeoisie that was just developing in the Indo-Mauritian
community as a result of the ISI. The interests of the new bourgeoisie, which was the
political support base of the Labour Party, would have been jeopardised. Finally, if the
status quo was maintained with the reinforcement of the sugar plantation industry, it would
have brought in all the elements, making for political instability in the young and fragile
nation. Frustration from within the broad Indian community would possibly have led to
Mauritius becoming a failed state, like so many African countries that achieved
independence at around the same time. Therefore, the careful use of a strategy to protect
vested interests while at the same time broadening the base for the creation of larger elite,
together with other factors, provided the necessary conditions that were important for the
successful creation of the EPZ.
Many of the political economy factors behind the success of the EPZ have been uncovered,
but no one explanation appears to be convincing on its own. The way forward must be to
pull together all of these strands towards an integrated framework. Such an explanation
must, furthermore, be based on recent developments in the political economy discourse
which identifies and brings together a number of factors. The factors that played a role
were: inclusive institutions and the protection of vested interests, ideas, ethnic diversity,
luck, the leadership role of the political elite and the choice of dual-track economic strategy.
All these factors considered together, even though some may be seen as more important

22
than others, will explain the choice of the EPZ for Mauritius and its successful
implementation.
2.3 Recent approaches to understanding EPZs
What is being argued in this part of the chapter is the need for a theoretical framework
within which we will evaluate the impact of each of the causal factors identified in the
creation of the EPZ in Mauritius. The previous section has identified some of the factors,
but has not provided a theoretical framework within which these factors can be integrated.
After an individual analysis of each causal factor, a framework will be proposed which will
show that the different factors in their combination has created the conditions and enabling
environment for the EPZ in Mauritius. In this way a more comprehensive political
economy explanation for the EPZ successes achieved in Mauritius will be provided.
The theoretical framework through which the factors will be analysed will be drawn from
recent studies on political economy, where the authors explain the economic growth of
nations from different perspectives.
The first of these studies that sets the framework for a theory on inclusive institutions and
protection of interests was developed by Acemoglu and Robinson (2012). They argue that
some countries are poor because they are governed by a narrow elite whose rules are
characterised by a concentration of political power and where the wealth created is shared
only by those who are very close to those in power. Poor countries are poor because those
who rule choose deliberately, not by mistake or in ignorance, to create poverty. Differences
between rich and poor countries come down to differences in economic and political
institutions, the rules and regulations by which the economy operates, and the incentives
for motivating the population to work.
The authors outline the contrasting examples of economic institutions of South and North
Korea, and the United States and Latin America. South Korea and the USA have inclusive
economic institutions that encourage economic activity, productivity and economic
prosperity. Protection of private property is central to attracting investors and business
activities. Also included in the concept of inclusive economic institutions is the rule of law,
which includes the role of the state in imposing order, preventing corruption and enforcing

23
contracts between private parties as well as the restrictions the law places on the power of
the state. Through a comparative study of different countries, the theory developed by
Acemoglu and Robinson (2012) demonstrates that successful countries which have
inclusive economic institutions create inclusive markets. This in turn gives the population
the freedom to pursue activities they are best suited for but also provides a level playing
field, giving everyone an equal opportunity. On the other hand, countries that choose the
path of extractive economic institutions would force people to work in specific sectors
regardless of their skills and there is also a lack of property rights for all but the narrow
elite.
The second important component of the theory is that the type of political institutions that
countries choose will determine whether they will remain poor. These institutions can
either be extractive or inclusive. If the distribution of power is narrow and unconstrained,
then the political institutions are absolutist or extractive – where those who are in power
would be able to set up economic institutions to enrich themselves and increase their power
at the expense of the rest of the population. In contrast to this, we have inclusive political
institutions that distribute power broadly in society and subject it to constraints. Instead of
being vested in a single individual or narrow group, political power is controlled by a broad
coalition of many groups. But for it to work, the power of the State needs to be sufficiently
centralised and strong.
Therefore, the choice of political and economic institutions will determine whether
countries encourage or impede economic growth. The politics of institutions is central to
the quest for understanding the reasons behind the success or failure of nations. Inclusive
political institutions in support of inclusive economic institutions lead to sustained
prosperity.
A very important issue behind the success of inclusive institutions is embracing what
Schumpeter called ‘creative destruction’ through technological innovation. Innovation
makes societies prosperous, but at the same time it leads to replacement of the old with the
new and the destruction of economic privileges and political power of certain elites.
Therefore, for sustained economic growth we need new technologies and methods of doing
things, which will come from newcomers, i.e. a new ‘breed’ of entrepreneurs or innovators

24
who come from outside the existing elites. This new ‘breed’ will bring in innovative ideas
and technologies that will benefit the broader society instead of only a limited few.
Inevitably the privileges of some existing elites will be lost, as the newcomers enlarge the
base of those benefiting from the innovations. And if all this is carried out within the
framework of ‘inclusive institutions’, we will have new ideas coming from different
quarters within the society, which will lead to a broadening of elites and the economy. Of
course, one should naturally expect resistance from conservative elites whose power and
privileges are threatened.
Acemoglu and Robinson (2012) also analyse the role of the media in the development of
inclusive institutions. According to them, the media can help in the empowerment of
societies by giving information about whether there are economic and political abuses by
those in power. The media plays an important role in informing the public and coordinating
their demands against forces that are trying to undermine or hamper the creation of
inclusive institutions. However, this will only be translated into meaningful changes when
the broader section of the society is mobilised to carry through political changes, but does
so not for sectarian reasons or to take control of extractive institutions, but rather to
transform extractive institutions into inclusive ones.
Lin (2009) argues that while the importance of institutions is undeniable, the question of
sudden and sustained growth in some countries remains unanswered. Taking the examples
of Europe in the late nineteenth century and Japan, and the Asian tigers after the Second
World War – which all succeeded in achieving rapid growth during their transition periods
– he discusses the reason behind the fact that although these countries have succeeded,
most other developing and transitional countries have failed to fully exploit such potential.
While summarising the literature of what previous economists have proposed as the
fundamental determinants of economic performance – namely: luck, geography, history,
institutions and culture - Lin (2009) sees continuous technological upgrading as the most
important engine for a country’s economic growth. Related to this is the notion that ideas
are the most vital determinants of a country’s growth. Lin’s (2009) perspective is in line
with the new growth theory advocated by Romer, which stresses that with the right ideas a
developing country will be able to exploit the advantages of backwardness and achieve

25
growth. However, Lin (2009) modifies this argument by pointing out that, globally,
dominant ideas which are derived from development successes in advanced countries are
not applicable to developing nations. Successful governments facilitated the adoption of
industries and technologies suited to their comparative advantage and determined by their
endowment structure at every phase of their development strategies, rather than focusing
on the dominant social thinking based on a strategy of modernisation through heavy
industry.
Lin (2009) also identifies the government as the most important institution in any country.
If the government makes good use of its powers, it can gradually reform the country by
providing better incentives for workers and businesses, improve the macro-economic
variables and provide better resource allocation for the country. The policies adopted by
the government are therefore key to the success or failure of the economy’s development
strategy. In the same vein, Lin (2009) posits that we have to understand the leadership and
motivation of the political leaders who run the government. The political leaders’
motivations are not necessarily selfish, especially not those leaders who fought for their
nation’s independence.
Through a detailed account of the success of the East Asian economies, Lin (2009)
highlights that the success involved an element of luck and that resource availability and a
long-established civilisation are not necessarily conditions for economic success. It is
possible for a nation to take a new turn if it is fortunate to have the right leadership at the
right time. The success or failure of economic policies in a country, however, need not be
a matter of destiny, if its political leaders know what policies are right for the nation.
Qian (2001), on the other hand, explains the unprecedented economic growth of China on
the basis of its institutional reforms and how the transitional institutions of markets, firms
and government worked in China. The study demonstrates that China, despite the absence
of many conventional institutions such as the rule of law and secure property rights, has
managed to grow at an impressive rate. According to Qian (2001), there is a need to
broaden our perspective on institutions. The Chinese case shows that during the transition
period, economic growth does not require perfect institutions, but even imperfect and
sensible institutions can bring the required growth. The argument put forward by Qian
26
(2001) is that institutional developments need to fit into the initial conditions and be made
compatible with the interest of the ruling power. This is in contrast with most African
countries’ institutions, which were imported and thus at odds with the political culture and
the population, and incompatible with the ambitions of the political leadership. To illustrate
the gradual manner in which the reforms were introduced in China, Qian (2001) indicates
that China’s reform succeeded without complete liberalisation, without privatisation and
without democratisation.
Qian (2001) analyses the successful reforms and failure of the Chinese institutional
reforms. The most notable successful reform, which is similar to the Mauritius case, is
market liberalisation through the ‘dual-track’ approach under which prices were liberalised
at the margin while quotas were maintained. There were two tracks: the plan track and the
market track. Under the plan track, economic agents are assigned rights to and obligations
for fixed quantities of goods at fixed prices as specified in the pre-existing plan, but at the
same time a market track is introduced according to which economic agents participate in
the market at free market prices, provided they fulfil their obligations under the plan track.
This meant that planned quantities continue to be delivered at plan prices, but additional
quantity above that is sold at market prices. The two-track approach provided for economic
efficiency, while at the same time keeping the quotas, which was compatible with the
interests of the ruling group. In this case the prevailing conditions and the role of existing
institutions play an important role in the implementation of the reforms.
2.4 Integrating these insights into a comprehensive political economy approach
for Mauritius
Based on the above theories, it is argued first of all that institutions played a significant
role in the choice and implementation of the EPZ in Mauritius. The role of democracy in
restraining the power of elites, the constitution, the protection of private property, social
welfare, government policies towards macroeconomic stability and measures to attract
private entrepreneurs and investors all worked together towards making Mauritius function
in an inclusive political and economic institutional framework. With this framework in
place, Mauritius was able to avoid political instability, contrary to the prophecy of doom
for Mauritius from renowned Noble Laureate James Meade. The role of the press and the

27
strong opposition also helped to maintain a vibrant, stable democracy, which gave investors
the confidence to choose the Mauritian EPZ.
Furthermore, with the creation of the EPZ Mauritius did not experience the big bang
process of creative destruction that Acemoglu and Robinson (2012) assume as being part
of inclusive institutions. The movement towards the EPZ was gradual, as the government
moved slowly towards the new sector and was wise enough to keep the old elites happy by
maintaining the ISI and sugar plantation.
Next, Lin’s (2009) view on the vital importance of ideas will be applied to the creation of
the EPZ in Mauritius. The idea of creating an EPZ in Mauritius came from Prof. Lim Fat,
whose successive visits to Taiwan generated the idea that the concept could also be adapted
for Mauritius. This idea was supported by the government, although a movement towards
EPZ was not the dominant social view at the time. The easiest route would have been
nationalisation and not some kind of privatisation. With Lim Fat’s idea and the
government’s role as a facilitator, the EPZ was successfully implemented in Mauritius.
Using Lin’s (2009) perspective on the leadership role of government, it will be noted that
the newly independent government of Mauritius showed good leadership in its decision to
affiliate itself to the Organisation of African Unity, which would later give Mauritius
access to export its EPZ products duty-free and quota-free to the European market through
the ACP/EU Agreement.
The luck factor will also be introduced, since Mauritius was lucky enough to have a unity
government barely one year after independence. The political leaders were also
ideologically inclined towards Fabian socialism, which favoured a strong partnership
between the private and public sectors. This ideological inclination at such a time helped
in the quick decision to implement the EPZ successfully, especially if it is taken into
consideration that the trend among newly independent nations during the early 1970s was
towards nationalisation.
Finally, Qian (2001) highlights the importance of the dual-track approach, keeping Import
Substitution Industrialisation (ISI), while simultaneously implementing the EPZ. This

28
strategy kept the ruling elite satisfied, while also diversifying the economy towards a new
engine of growth.
All of the factors mentioned provided the enabling environment to produce the successful
launch and implementation of the Mauritius EPZ. What distinguishes this approach from
other studies is that although these factors are recognised as important in the
implementation of the EPZ in Mauritius, it is shown that compromise-based politics
underpinned all these factors
2.5 History of Mauritius prior to independence
To understand the complexity of the Mauritian society at the time of independence and the
functioning political and institutional structure, one needs to go back to the history of the
country. With this perspective as the background, a better position will be gained to analyse
the political and economic strategies put forward by the political elite at the time of
independence.
According to Selvon (2001), the Portuguese discovered Mauritius around the year 1500.
The island was uninhabited and rich in ambergris, ebony and ivory. The Portuguese did
not show any real interest in settling on the island because they did not find the resources
they were looking for, namely, precious stones, precious metals, spices or silk. They did,
however, use Mauritius for occasional stop-overs on their way to the East.
The Dutch were next to occupy the island from 1598. They named it Mauritius after the
President of the Dutch Republic, Prince Maurice of Nassau. They found Mauritius a safe,
uninhabited island, useful for Dutch ships going to and from the Far East around the Cape
of Good Hope. The Dutch formally colonised the island in 1638. However, they did not
occupy the island with the intention of developing the country. They had a more extractive
strategy in mind, aimed at depleting the ebony forests and ambergris. When these were
considerably depleted, they destroyed their plantations and buildings and left the island in
1658, concluding that Mauritius did not yield sufficient profits. They also estimated that
no other colonial power would be interested in the island. The only people who remained

29
were runaway slaves. The Dutch then came back in 1664, but finally abandoned the island
completely in 1710.
The French took possession of Mauritius in 1715, but only began to settle there in 1721
after renaming it ‘Isle de France’. The French came with a slightly more inclusive
approach, as they quickly started building the first religious institutions on the island.
Slaves from Madagascar were sent to the island, as were a number of Indians. During the
French period, especially when Mahe de Labourdonnais was governor of the island from
1735 to 1740, Mauritius became a stable and promising colony. He created several
businesses and started sugar production on a commercial basis. He also initiated the
refining of sugar with machines imported from France. He built the first major non-
religious institutions on the island – namely, the city of Port Louis and the Government
House. He encouraged workers to become entrepreneurs and turned Port Louis into one of
the most important harbours in the Indian Ocean. After him, other French governors put in
place the judicial system, i.e. the Code Napoleon (which remains in Mauritian law today).
They also created the police force and established the first school in Mauritius.
Selvon (2001) notes that towards the end of French rule the white colonisers were divided
socially into capitalists, ‘negotiants’(traders and businessmen), urban artisans and rural
cultivators. These French descendants were faring rather well and independently of France,
and a clear Mauritian identity was being expressed to protect their interests. The coloured
population also began to develop a sense of Mauritian identity.
In 1810, after the battle of Grand Port, the British took possession of the island and renamed
it Mauritius. It remained a British colony until independence in 1968. Apart from some of
the French settlers who returned to France, a number of the affluent colonists remained.
They had also refrained from actively defending the country against the British invasion.
The British on their side offered generous terms of capitulation to the white French
colonists, by offering to respect the country’s laws and customs. The use of the French
language was to continue and the Catholic religion would remain. In addition, the slavery
system was maintained for a while and discrimination against coloureds continued. In
response, coloureds developed a sense of opposition to the white colonists.

30
The significant feature of the transition from French to British colonial rule was the
peaceful transfer of power, whereby the institutions created by the French would be
preserved and even reinforced, and where the interests of the white French colonisers
would be maintained. This led to a healthy relationship between the old and new elites.
The first British governor was Farquhar, who believed in free trade and the expansion of
agricultural activities. He created the first Colonial Bank in 1813. Farquhar provided fiscal
incentives and the modernisation of techniques and equipment for agriculture. He
abolished duties on importation of agricultural machinery and during his reign, carts which
were previously pulled by slaves were now dragged by mules, asses and bullocks. There
was increasing use of machinery to replace human labour. He also improved the road
networks on the island. Even after his departure to Britain in 1823, he continued to promote
the interests of the Mauritius sugar industry. He lobbied for the reduction of duty on
Mauritian sugar imports to Britain, which resulted in the Mauritian duty set at the same
level as West Indian duties. This gave a boost to the Mauritian sugar industry. Following
this development, the plantation community moved readily towards sugar plantation,
cutting down forests and uprooting other crops to replace them with sugar.
As a result of this, the country needed new sources of labour. It turned to India and China
for cheap labour as early as 1825. By the time slavery was abolished in 1835, many of the
plantation slaves had left the sugar estates. Teelock (2001) notes that once slaves were
freed, they refused to work on sugar plantations for the low wages on offer. Planters were
able to deal with this by turning to indentured labourers from India. Approximately 453,000
labourers were recruited from India and they came in two phases – from 1834 to 1838, and
from 1843 to1880.
Not all Asians were confined to working on the sugar plantations, however. Some became
small planters, while others made up a growing urban bourgeoisie. In contrast to the elite
among the free population (coloured and ex-slaves) who had arisen to positions in the civil
service through education, the Asian urban bourgeoisie – made up of Indians and Chinese
– had a distinctly commercial character. There was also an Asian rural bourgeoisie. The
rural bourgeoisie tended to follow the path that free people had followed earlier, namely
education as a ladder to social and economic advancement. The Asian rural bourgeoisie

31
who acquired Western-style education rose up the social ladder much faster and emerged
as political leaders.
At the end of the 19th century there was a movement to reform the constitution to extend
the electoral vote. This movement was driven by the coloured population, who had over
the years been using their position of social equity to become educated, claimed inheritance
property from whites and entered the top ranks of government service.
The political consciousness of Indo-Mauritians only really awakened at the beginning of
the 20th century. The visit of Mahatma Gandhi to Mauritius in 1901 is viewed as the catalyst
to the awakening of Indo-Mauritian political consciousness. He sent Indian lawyer Manilall
Doctor to raise the social consciousness of the Indian community. Manilall Doctor left in
1911 after having successfully sown the seeds of opposition and Mauritians began to take
up the cause of indentured labourers.
The movement for independence for Mauritius needs to be placed in the international
context which had begun to impinge on most African and Asian countries in the late 19th
century. This was increased with the economic crisis that occurred in British colonial
territories, while World War II gave further impetus to the movement, as Britain was no
longer able to maintain a vast empire (Teelock, 2001).
The colonial power ranked Mauritius as a complicated territory which needed a complex
central government because of its small size and the diverse ethnic composition of its
population. The kind of political system that the British were thinking for Mauritius would
have to take into consideration the issue of adequate representation of minorities in a
system of democratic elections based on universal suffrage.
Mauritian historians have followed three different approaches to the issue of the struggle
for independence. The first is an ethnically-based approach, according to which all Hindus,
who represented the majority of the voting population, were associated with the Labour
Party and would fight for independence, while the Parti Mauricien (later PMSD)
representing the Creoles (Afro-Mauritians), coloured and whites were against
independence and in favour of some kind of association with the British. Ethnic politics

32
was very much present during the 1960s in Mauritius, which culminated in racial riots in
1967, just one year before independence.
The second approach is the class-based approach, seeing the movement for independence
as a class struggle between the plantation owners represented by the PMSD and the
emerging Indo-Mauritian bourgeoisie represented by the Labour Party.
The third approach was that Mauritius was becoming increasingly expensive to maintain
as a colony, especially if we take into consideration the fact that the British Empire was
faced with a severe economic crisis. Thus, granting independence was the most
economically profitable option for the British.
As regards the political structure of Mauritius prior to independence, Selvon (2001) gives
a clear summary of the political currents prevailing in Mauritius at that time, which
consisted of three main tendencies:
(i) The socialist current represented by the Labour Party, which consisted in 1948 of a
programme of nationalisation of sugar estates and a radical Gandhian approach to socio-
economic and cultural development. The approach of the Labour Party changed, however,
as the country got nearer to independence. It became more conciliatory with British
traditions, scrapped the nationalisation programme and opted for a mixed economy with
free enterprises, plus a substantial welfare state and universal suffrage.
(ii) The oligarchic current, which wanted to stop the constitutional evolution to self-
government and independence. They finally accepted independence in 1968 without
creating much of a problem and were very cooperative after independence. This group was
essentially composed of whites and supported by rich sugar barons and various politicians
from a liberal background. Selvon (2001) notes that the oligarchs were led by two Franco-
Mauritian leaders – namely, Fernand Leclezio and Maurice Martin. The oligarchic faction
would be completely wiped off the political landscape after the 1948 elections. It adapted
by means of pragmatic arrangements with the PMSD and Labour Party and eventually
helped them to form coalition governments after independence, and well into the 1980s.
The new Indo-Mauritian bourgeoisie ended up cohabiting very well with the white sugar
planters.

33
(iii) The centrist-elitist liberal current from which the founder of the Labour Party, Dr Curé,
broke away to start defending Indian immigrants and subsequently form the Labour Party
in 1936. The centrists were the first to challenge the oligarchs on their own ground since
the beginning of the parliamentary system in 1886.
Eventually Mauritius would experience its first real two-party system in 1952 with the
creation of the Ralliement Mauricien, which provided the Labour Party with its first serious
political adversary after the fall of the oligarchs had left a vacuum in Mauritian politics.
At the time of independence the British left Mauritius with a vibrant democracy, a strong
opposition and, more importantly, a fully developed Westminster-style system of
parliament. In addition, the dominant Labour Party had over the years undergone reforms
which ensured it would not adopt radical nationalistic tendencies. Therefore, the legacies
of British rule provided the country with a political and economic system which
encouraged the development of inclusive institutions on the island.
Acemoglu and Robinson (2012) attribute the economic successes largely to the evolution
of historical institutions. It should be noted that Mauritius achieved political centralisation
under the Labour Party, and later on through the unity government. They had a constitution
at the time of independence, which made provision for the protection of private property,
good governance and the rule of law, as well as a Westminster-style parliament where all
members of the community would be represented. These institutions have functioned well
since the beginning of their independence to this day. The orientation of the economy was
also towards a mixed economy, with free enterprise constituting a significant portion of
economic activity. Thus, at the time of independence Mauritius had a history of inclusive
economic and political institutions, and all the necessary conditions were in place for this
to continue.
2.6 Descriptive analysis of the economic strategy adopted by Mauritius prior to
and after independence
2.6.1 Diversification through import substitution
In the early 1960s when the Mauritian economy was still heavily dependent on the revenues
generated by sugar exports, the government appointed a Royal Commission headed by

34
Prof. J.E. Meade to assess the state of the economy. The commission’s report stressed that
Mauritius needed an economic diversification strategy if it wanted to avoid social and
political unrest and, ultimately, economic bankruptcy. The commission also took note of
important barriers to economic development (YeungLamKo, 1998). The commission
pointed out the absence of mineral resources, the smallness of the domestic market and the
remoteness of the island from sources of raw materials and from foreign markets. Finally,
apart from the sugar industry, the rest of the Mauritian economy suffered from a shortage
of management and technical skills, as well as capital for investment purposes (World
Bank, 1978). Despite this, the Meade Report (1961) advised Mauritius to industrialise in
order to be able to cope with the pressing population and unemployment problems. The
government duly adopted an Import Substituting Industrialisation (ISI) strategy
(YeungLamKo, 1998).
To encourage manufacturing activities, legislation was passed in 1964 which provided a
host of fiscal and other incentives for setting up ISI industries. Companies or industries set
up within the ISI legal framework were issued with ‘Development Certificates’ and were
known as DC companies. They were protected from external competition in the traditional
sense through protective tariffs and import quotas.
YeungLamKo (1998) gives some of the following fiscal and financial advantages that were
given to companies which were awarded Development Certificates (DCs):
(i) protective import duties for infant industries
(ii) suspension of import duties on materials and equipment not locally
available
(iii) import quota protection of up to 80% of the market
(iv) long-term loans at favourable rates from the Development Bank of
Mauritius for up to 50% of long-term capital employed
(v) free repatriation of profits.
Although the DC strategy led to the establishment of some industrial undertakings, it did
not lead to the reduction of unemployment. In fact, Hein (1989) states that between 1964

35
and 1968 only 1,200 jobs were created in DC industries and the labour force was growing
at a faster rate than jobs were being created.
When Mauritius gained independence from the British in 1968, the prospects of economic
growth and development looked bleak. Commission leader and Nobel Prize winning
economist James Meade was pessimistic about Mauritius’s future prospects. The country
faced high levels of poverty, low economic growth and rapid population growth. Meade
reported that ‘heavy population pressure must inevitably reduce real income per head
below what it might otherwise be. That surely is bad enough in a community that is full of
political conflict … In the absence of other remedies, it must lead either to unemployment
(exacerbating the scramble for jobs between Indians and Creoles) or to even greater
inequalities (stocking up still more the envy felt by the Indian and Creole underdog for the
Franco-Mauritian top dog). The outlook for peaceful development is poor.’
Real GDP growth rates for the economy were erratic and never exceeded 5% during the
period 1964-1970. This erratic growth is attributed principally to the fact that GDP growth
depended heavily on the price of sugar on the world market, while adverse or favourable
weather conditions affected the production of sugar each year. The real average GDP
growth rate was at an alarming -1.07%. Negative real growth rates were recorded for three
years during that seven-year period, as shown in Table 2.1.
Table 2.1 Real GDP growth and sugar prices, production and exports
Year Real GDP
growth rate
(%)
World raw
sugar price
(cents per
pound
USD)
Sugar
production in
Mauritius
(000 tons)
Sugar exports
from Mauritius
(000 tons)
1963 - 8.50 -
1964 -9.44 5.87 -
1965 4.41 2.12 664 578
1966 -4.45 1.86 562 571
1967 4.33 1.99 638 531
1968 -8.15 1.98 597 578
1969 4.93 3.37 669 592

36
1970 0.85 3.75 576 582
Sources: (i) Mauritius, National Accounts
(ii) Bowman (1991) p. 107)
(iii) Online (http://www.ers.usda.gov/Briefing/Sugar/Data/Table 03.xls)
The continued importance of the sugar sector during this period is proof that the ISI strategy
was not generating the expected results. This failure of the ISI experience pushed the newly
independent government to explore the possibility of implementing export-oriented
policies. They could see that such policies had been successfully implemented by other
island economies, such as Hong Kong, Singapore and Taiwan.
The ISI strategy was based on the idea that infant industries needed protection from foreign
competition before they could mature. The popularity of this policy was strengthened by
the shift after World War II to ‘much greater reliance on the State, propelled by the
emergence in the west of both the welfare state and Keynesian interventionism’ (Yergin,
2002).
The main advantages that ISI strategy was supposed to bring were increases in domestic
employment, more resilience in the face of a global economic environment prone to shocks
(such as recessions and depressions) and reducing the disadvantages of being distant from
major markets. However, if not properly applied, the ISI strategy could create inefficient
and obsolete industries and a focus on industrial development may leave out poorer local
communities stuck in rural-based traditional economies.
The main reasons for the failure of the strategy were those that had largely been identified
by the Royal Commission. They included ‘the lack of capital, shortage of skilled workers
and lack of enterprise and risk-taking regarding new industrial activities’ (YeungLamKo,
1998).
Therefore, at independence the new government was faced with clear options for the
country’s industrialisation as a way to get out of poverty. It could either continue with the
ISI strategy – which was not bringing the expected results – or it could move towards an

37
export-orientation strategy. Alternatively, it could find a compromise and apply both
strategies at once.
2.6.2 The move of Mauritius towards export orientation
At the time that the Mauritian government was grappling with these policy choices,
evidence was emerging about successful export-orientated industrialisation (EOI)
strategies adopted by some countries. The business community in Mauritius was becoming
increasingly aware of this knowledge and newspapers in Mauritius were increasingly
mentioning the successful export industries in Puerto Rico and Taiwan (Hein, 1989).
Edouard Lim Fat, professor in Engineering at the University of Mauritius, who came from
an industrialist family with close ties to the Parti Mauricien, visited Taiwan on a fact-
finding mission to get first-hand experience of the Export Processing Zone (EPZ) that had
been launched there. The EPZ created distinctive arrangements where firms specialising in
exports would qualify for duty-free imported inputs regardless of their location on the
island (the background on the EPZ concept is provided in the Annexure at the end of this
chapter). Prof. Lim Fat was impressed by what he had found in the Taiwanese Kaohsiung
Export Processing Zone (KEPZ). Moreover, Taiwan was a most interesting case for
Mauritius because the islands shared many similarities, such as an important agricultural
sector, relative smallness of the domestic market, and no indigenous raw materials.
When he returned, Lim Fat (1969) argued that the benefits of introducing an EPZ in
Mauritius similar to the KEPZ would be significant. Some of the benefits of an EPZ that
he highlighted were:
(i) a source of income
(ii) solution to the unemployment problem
(iii) development of skills in labour and management and the availability of a
trained pool of labour
(iv) introduction of foreign know-how
(v) development of supporting industries outside the zone

38
(vi) increased economic activity
(vii) improved balance of payment.
Enterprises were thought to be keen to join the EPZ because they would have better access
to capital, exemption from certain taxes, speedy setting up of operations, eased foreign
exchange controls, guarantee of freedom from nationalisation, and liberal industrial and
labour regulations.
Therefore Lim Fat (1969) concluded that, considering the success of the KEPZ and of the
similarity in social and economic backgrounds between Mauritius and Taiwan, a similar
experiment should be launched in Mauritius.
The government of Mauritius agreed. The EPZ Act was passed in 1970, creating distinctive
arrangements where firms specialising in exports would qualify for duty-free imported
inputs regardless of their location on the island. The idea, as mentioned before, initially
came from Taiwan, but many of the details of the scheme were adapted from Hong Kong
and Singapore (World Bank, 1992). The EPZ Act was adopted with the objective of
attracting, promoting and increasing the manufacture of export products through the EPZ.
Mauritius therefore gradually turned to an export-led strategy, which began with the setting
up of the EPZ in 1970. The government had not, however, totally given up on ISI, and
firms that qualified as DC firms continued to receive protection.
ISI protection covered a wide range of manufactured products – ranging from beer,
margarine, soap, paint, canned food, glasses, plastic pipes, biscuits and garments to name
only a few. Firms that fell under the EPZ scheme, by contrast, were more concentrated
within the textiles and clothing sector. By the mid-1980s textiles and clothing constituted
as much as 80% of investment and exports and 90% of employment in the EPZ sector
(Fowdar, 1991).
The contribution of the EPZ manufacturing sector to GDP increased gradually during the
early stages of its setting up. The agricultural sector, however, continued to remain the
major contributor to the economic growth of Mauritius throughout the 1970s.
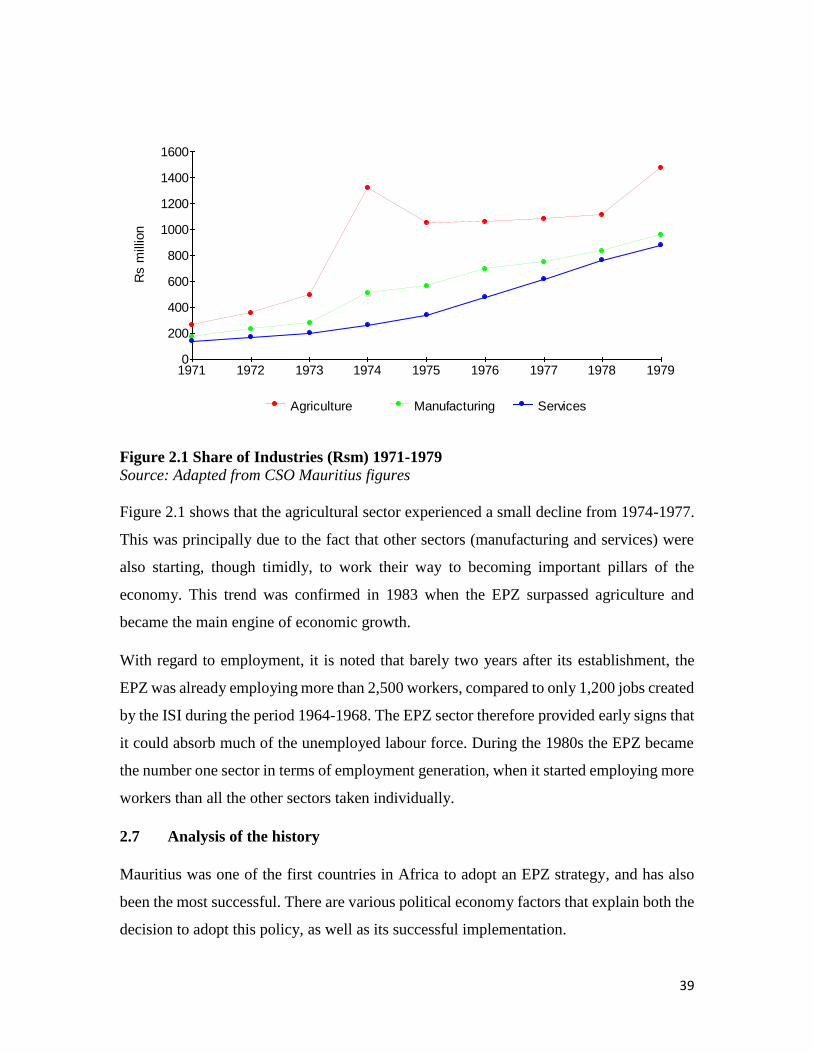
39
0
200
400
600
800
1000
1200
1400
1600
1971 1972 1973 1974 1975 1976 1977 1978 1979
Rs m
illio
n
Agriculture Manufacturing Services
Figure 2.1 Share of Industries (Rsm) 1971-1979
Source: Adapted from CSO Mauritius figures
Figure 2.1 shows that the agricultural sector experienced a small decline from 1974-1977.
This was principally due to the fact that other sectors (manufacturing and services) were
also starting, though timidly, to work their way to becoming important pillars of the
economy. This trend was confirmed in 1983 when the EPZ surpassed agriculture and
became the main engine of economic growth.
With regard to employment, it is noted that barely two years after its establishment, the
EPZ was already employing more than 2,500 workers, compared to only 1,200 jobs created
by the ISI during the period 1964-1968. The EPZ sector therefore provided early signs that
it could absorb much of the unemployed labour force. During the 1980s the EPZ became
the number one sector in terms of employment generation, when it started employing more
workers than all the other sectors taken individually.
2.7 Analysis of the history
Mauritius was one of the first countries in Africa to adopt an EPZ strategy, and has also
been the most successful. There are various political economy factors that explain both the
decision to adopt this policy, as well as its successful implementation.

40
In the previous section, we analysed in detail the types of institutions that Mauritius
inherited from its colonisers. The Dutch were the first colonisers and adopted a solely
extractive strategy of depleting the resources of the island before leaving it for good. The
French, on the other hand, left a legacy of formal institutions for the landowning elite and
the French language, which is the most widely-used language on the island to this day. The
British brought a number of important inclusive institutions such as democracy, a
Westminster-style of parliament, the rule of law and a constitution that guaranteed the
protection of private property. They also inculcated the notion of good governance. The
existence of these institutions and the inclusive approach adopted by the government of
independent Mauritius combined in complex ways with other factors – such as ideas, luck,
leadership, the choice of a dual-track economic strategy, the ethnic diversity of the
population and compromise-based politics – provided the framework within which the EPZ
was successfully created in Mauritius.
2.7.1 The inclusive institutions of Mauritius at independence
At the time of independence the ruling party was the Labour Party, under the leadership of
Seewoosagur Ramgoolam, which was in coalition with the CAM (Comite Action
Musulman) and the IFB (Independence Forward Bloc). This alliance, supported by Hindus
and Muslims, narrowly won the independence elections in 1967 with 56% of the votes
against the Parti Mauricien, which had the support of the country’s minorities and in
particular the white land owners and Creoles. Although the Labour Party-CAM-IFB
alliance obtained the majority and formed the government, the newly elected government
was worried that social tensions might hamper the development of the country, which was
divided strictly along communal/ethnic lines.
In 1969, in the name of national unity, Prime Minister Ramgoolam formed an alliance with
the opposition, Parti Mauricien (which later became the Parti Mauricien Social Democrate)
headed by Gaetan Duval, and with this alliance all ethnic groups were represented in
government. This reduced significantly the possibility of ethnic clashes and the
government could then use all its resources to think about the economic development of
Mauritius. Mauritian ethnic groups tend to feel secure and place their trust in the

41
government of the day only if someone from their community is a member of the cabinet.
Every government since independence has made it a point to have, as far as possible, all
communities represented in the cabinet.
Bowman (1991) confirms that the impetus for forming the unity government was Prime
Minister Ramgoolam’s perception that economic development would be easier with a
broad-based government, where power would not be confined to only the small elite with
absolute power. When the coalition unity government was announced, the cabinet was
expanded from 10 to 21 members. The Parti Mauricien was given seven Ministries,
including some core ministries – namely, the Ministries of External Affairs, Tourism and
Emigration, Commerce and Industry, and Economic Planning and Development.
The unity government brought together the socialist background of the Labour Party with
the liberal ideals of the wealthy Franco-Mauritian landowners, the Sino-Mauritians and
Creoles. This socialist-liberal coalition worked in Mauritius principally due to the fact that
the Labour Party under the leadership of Ramgoolam was more inclined towards moderate
socialism of the Fabian social democratic variety committed to a public-private partnership
within the context of a modern welfare state supporting market-sustained institutions
(Rodrik, 2003).
In following this course, the government was, in fact, promoting a model based on inclusive
economic institutions, as advocated by Acemoglu and Robinson (2012), whereby the
private sector was given full support and incentives to operate. Chapter 2 of the
Constitution of Mauritius (1968), under the title ‘Protection of Fundamental Rights and
Freedoms of the Individual’, recognises the rights of the individual to protection of the
privacy of his home and other property and from the deprivation of property without
compensation. Chapter 2 also stipulates the ‘provisions to secure protection of the law’. By
so doing, the newly independent Mauritius was sending a clear message to potential
investors that they could safely invest in the country and that the constitution and the laws
of the country would ensure that their properties were protected and the rule of law was
applied.
The Constitution of 1968 also made provision under the section on ‘Community’ for eight
additional seats in the National Assembly for the inclusion of minorities, which ensures the
42
representation of ethnic groups – called the ‘best losers’ system’ – whereby an independent
electoral commission appoints up to eight losing candidates to each new National
Assembly to represent ‘under-represented’ ethnic groups. The institutionalisation of under-
represented ethnic groups secured a place for all minorities in the country and every
community had the impression that it would be included in the development process of the
country.
Furthermore, political and economic power, which was concentrated in the hands of the
British and Franco-Mauritians prior to independence, was adjusted after 1968 – with the
political power now moving to the majority Indo-Mauritian community. In addition, the
slowly adopted inclusive political approach put in place an institutional arrangement that
felt non-threatening to Mauritius’s diverse communities, while an electoral system based
on multiparty democracy meant that the rulers of the day were accountable to the masses
of people.
The Westminster system ensured the existence of a parliamentary opposition. After the
unity government was formed, a new extra-parliamentary opposition – the Mauritius
Militant Movement (MMM) – emerged in 1970-1971 and was able to offer people an
alternative to the Labour Party. The country also has an independent press which, against
all odds, has been able to provide a counter-balance and act as a watchdog over those in
power.
The unity government also encouraged a policy of ‘unity in diversity’, i.e. unity without
uniformity and diversity without fragmentation, meaning that while recognising that the
different components of the rainbow nation came from different ethnic and cultural
backgrounds, the philosophy was that they should all work towards a common goal for the
advancement of the country. As an example, since independence almost all the major
festivals that are celebrated in most of the Asian and European countries are now national
festivals in Mauritius with an official holiday for the whole country. Thus the celebration
of Hindu festivals like Mahashivaratri, Diwali and Ganesh Chaturthi, along with the
Islamic festivals like Id-ul-Fitr and the Christian festivals like Christmas and even the
Chinese New Year are all national holidays. This policy of trying to include every
community and ethnic group in the development process and the constitution of the
43
national unity government in 1969 significantly reduced the possibility of the ethnic
conflicts that Meade had predicted.
Since independence, Mauritius has been rated very high on institutional democracy indices.
For instance, out of the forty-six countries that had at least one operational EPZ during the
1980s, only eight African countries had EPZs (Kreye, 1987). This brings us down to only
seven potential competitors to Mauritius in the EPZ during the early stages of
implementation. These potential competitors were Ghana, Liberia, Morocco, Egypt,
Senegal, Togo and Tunisia. Out of these countries, it would be interesting to have a look
at their contemporary political history to see how politically stable each of them was for
potential investors.
Without political stability and a broad consensus on policies, it is very unlikely that an
economy will thrive. Although local politics has been very animated since independence,
Mauritius was one amongst the few African countries that were able to maintain political
stability and a fully functional democracy. Mauritius has remained a stable country, with
no major political upheavals and has thus attracted investors during the crucial stages of
the setting up of the EPZ and the subsequent take-off, which has brought comparative
advantages over their neighbouring competitors who are well-endowed with natural
resources.
To undertake a study of the quality of Mauritian democracy over the years compared to the
other African countries mentioned, the analysis provided by Polity IV (2009) will be used,
which examines concomitant qualities of democratic and autocratic authority in governing
institutions. It provides a spectrum of governing authority that ranges from fully
institutionalised autocracies through mixed or incoherent authority regimes to fully
institutionalised democracies. The Polity Score illustrates the regime’s authority spectrum
on a 21-point scale ranging from -10 (hereditary monarchy) to +10 (consolidated
democracy). Applying the Polity Score for Mauritius from 1968-2008, Polity IV provides
the following graph on the Authority Trends for Mauritius:

44
0
2
4
6
8
10
75 76 77 78 79 80 81 82 83 84 85 86 87 88 89 90 91 92 93 94 95
Mauritius
Figure 2.2 Authority Trends: Mauritius (1975-1995) Source: Adapted from Polity IV Project (2009). 1
This shows that ‘authority trends’ in Mauritius were already very high during the 1970s, at
around +9 on a scale from -10 to +10 and reached +10 in 1983, which means that in 1983
Mauritius was a fully institutionalised democracy. The maturity of Mauritian democracy
proved to be a causal factor in the success of EPZ, whereby investors did not have much
difficulty in choosing the most stable country among the eight African countries previously
mentioned, when a decision to invest had to be taken. To illustrate this, the trends for the
other seven African countries as compared to Mauritius will be examined.
1 The graph tracks the country’s annual Polity Scores with vertical thresholds for democracy (+6
and above) and Autocracy (-6 and below).

45
(10)
(5)
0
5
10
75 76 77 78 79 80 81 82 83 84 85 86 87 88 89
Mauritius Ghana Morocco
Egypt Senegal
(10)
(5)
0
5
10
75 76 77 78 79 80 81 82 83 84 85 86 87 88 89 90 91 92 93 94 95
Mauritius Togo
Tunisia Liberia
Figure 2.3 Authority Trends (1975-1995)
Source: Adapted from Polity IV Project (2009).
It can be seen that Mauritius was far more democratic and politically stable than the other
seven African countries with EPZs operating under the Lomé Convention, which was a
preferential arrangement with Europe that benefited African, Caribbean and Pacific (ACP)
countries (more on this in the next chapter). The democratic nature of the institutions in
Mauritius became more evident after 1983, when Mauritius attained +10 on the Polity
Score, while all the other seven countries were still autocracies scoring -6 or less on the
46
Polity Score. Democracy and political stability thus provided the Mauritius EPZ with
something unique that its competitors in Africa did not possess.
2.7.2 The idea of an EPZ in Mauritius
Instead of relying on geographical and historical factors to determine which way to move
the economy, the diversification of the Mauritian economy towards the EPZ could be
explained using Lin’s (2009) ‘ideas’ theory, which stipulates that with the right ideas, not
necessarily the ones prevailing in the dominant social thinking of the time, a country will
be able to exploit the advantages of backwardness and achieve dynamic growth.
Mauritius as a newly independent non-aligned socialist country in 1969 had to look for a
quick way to address its main economic problem of unemployment, which the ISI strategy
had failed to address. It also had to look for a better development strategy that would have
to take the economy out of underdevelopment and onto the path of sustained growth and
development. Prof. Lim Fat was instrumental in introducing the idea of export-orientated
industrialisation (EOI) as an alternative strategy and was able to get the blessing of the
government to undertake a fact-finding mission to Taiwan’s Kaohsiung Export Processing
Zone (KEPZ).
Lim Fat (1969) has explained in detail how the idea of EPZs came to him as a result of
what he saw during his fact-finding mission. KEPZ was essentially meant for enterprises
engaged in manufacturing, assembling of export products and servicing enterprises for
storage, transport and packing. Exports from KEPZ were mainly electronic products,
garments, knitted and woven goods, as well as plastic, leather and rubber products.
Less than a decade after commencing operation, KEPZ was already contributing
importantly to the indirect exports and development of Taiwan. By bringing in foreign
managerial and technical know-how, the zone had helped train the local population and as
a result a pool of technical experts was soon operating in Taiwan.
Lim Fat identified many similarities between the social and economic structures of Taiwan
and Mauritius, and recommended that a similar experience be tried in Mauritius. On his
return to Mauritius, he expressed with passion the idea that the solution to the country’s
economic problems was through the introduction of an EPZ. He was able to convince the
47
government of the urgency of creating the Mauritian EPZ. As an active member of the
private sector, he had the political support of the Parti Mauricien, which coincidentally had
been attributed the portfolio of the Ministry of Industry, following the reshuffling of the
cabinet after the establishment of the unity government. His political connections
facilitated access to the corridors of power and made it easier for him to convince the
government. But, as mentioned earlier, the Prime Minister and the government for that
matter were never against the idea of the EPZ. They only needed to be convinced of its
workability before committing to a shift in economic strategy.
The EPZ Act was passed in 1970 with the objective of attracting, promoting and increasing
the manufacture of export products. The idea was original in the sense that adopting an
EPZ at that time was not the dominant social view of the day. Most countries, especially
African countries that had gained independence during the 1960s and early 1970s, were
more inclined to move towards nationalistic and anti-colonial policies that would take away
power from existing elites in a drastic way.
2.7.3 The rapid adoption of the EPZ in Mauritius: The luck factor
During an interview that was conducted with Prof. Lim Fat, he raised an issue that had not
generally been recognised as important in the success of the Mauritian EPZ. He explained
that he had been a passionate advocate of the rapid adoption of the EPZ, but had he been
an accountant or an economist, he might have been able to assess the numerous economic
pitfalls of the new EPZ and consequently been more cautious by advising a more moderate
approach. In his own words, therefore, his ‘naivety’ turned out to be a lucky factor that
contributed to the rapid adoption of the EPZ at an opportune moment. This factor should,
however, not be exaggerated, as the wholehearted support and leadership role played by
the government was probably the decisive factor in the rapid and effective adoption of the
EPZ.
2.7.4 The leadership role of government
As soon as Parliament passed the EPZ Act, the leadership of the unity government quickly
organised a large official mission to promote the Mauritius EPZ in Singapore, Malaysia
and Hong Kong. The mission was headed by Deputy Prime Minister Gaetan Duval and

48
included the Minister of Industry, senior officials and Prof. Lim Fat. This high-level
delegation of both the government and private sector committed to the EPZ impressed the
Far East business community giving them the confidence to invest in it.
From a foreign policy perspective, the quick adoption of an export-orientated strategy is
also linked to the country’s choice of its continental and regional affiliations, since
Mauritius joined the Organisation of African Unity. The OAU would later on, as a group,
obtain preferences from the USA and EU through conventions such as the Lomé
Convention. This proved to be a determining factor in the eventual success of the EPZ.
In contrast to many African countries that gained independence during the same period as
Mauritius, the government of Mauritius rejected ideological affiliations, refusing to be tied
to the Eastern or Western blocs during the Cold War years. The then Prime Minister
Seewoosagur Ramgoolam decided instead, soon after independence in 1968, to go for a
policy of non-alignment in the field of international relations as a member of the Non-
Aligned Movement (NAM). He also joined organisations like the African and Malagasy
Organisation (OCAM) and the OAU, as well as the Commonwealth in 1968.
Commonwealth membership proved to be important because when Great Britain became
a member of the European Economic Community (EEC) in 1973, it brought up for
discussion its preferential trading arrangement with 20 Commonwealth countries of the
African, Caribbean and Pacific region, which included Mauritius. As a result of these
discussions, Mauritius joined the Yaounde Convention in 1971 (as an associate member
because of its affiliation to OCAM), which culminated in the Lomé Convention in 1975.
The Lomé Convention of 1975 was a treaty envisaging wide-ranging economic cooperation
between the nine countries of the EEC and 46 Third World countries of the African, the
Caribbean and the Pacific (ACP). The original members of the EEC were as follows:
Belgium, France, West Germany, Italy, Luxembourg and the Netherlands. Denmark,
Ireland and the United Kingdom joined later in 1973 (Garrity, 1977).
As a member of the ACP group of countries, Mauritius received under the 1975 Lomé
Convention the right to duty-free and quota-free exports to the EEC (now the European
Union). That would open the door for those foreign investors, especially Asian investors
49
(who had to pay 17% duties to enter the European market), to enter the European market
through Mauritius.
Despite the fact that two thirds of the Mauritian population have roots in India and fewer
Mauritians have ties to Africa, Mauritius has since independence persistently identified
itself with Africa. Bowman (1991:151) mentions that during a state visit of the president
of Tanzania, Dr Julius Nyerere, to Mauritius in 1974, Prime Minister Ramgoolam
commented: ‘We belong to OCAM and the OAU. In other words, we belong to Africa,
without in any way wrenching ourselves away from India and Europe. We intend to give
support to our African brethren in their efforts to secure the full emancipation of the
peoples of that great continent.’
According to government officials who were present during the period that Mauritius
joined the OAU, it is believed that the country’s motivation to join the African group of
nations was based on:
(i) First and foremost there was the geographical factor, Mauritius being
located much closer to the African continent than to mainland Asia;
(ii) Leaders of the time supported African liberation movements throughout the
continent and believed that the time had come to rid the continent of
colonialism. As a matter of fact, Prime Minister Ramgoolam was a firm
proponent of democratically elected governments of the people, for the
people and by the people and had very good relations with African freedom
fighters;
(iii) Mauritius knew that in terms of geopolitics and economic positioning, the
fact that the country became part of the OAU would increase its chances to
negotiate successfully through the OAU with the European countries for
economic advantages and preferences. The unity and solidarity that African
nations were embracing is regarded as a model to this day for the rest of the
world; and
(iv) Last but not least, although Mauritius maintained privileged and strong
brotherly bilateral relations with India, where the majority of its forefathers

50
came from, the division that characterised the Asian region, with a weak
Association of South East Asian Nations (ASEAN) mostly represented by
the East Asian tigers, was not very attractive to the young Mauritian nation
of mostly Indian descent. The South Asian Association for Regional
Cooperation (SAARC), which consists of member states of Indian descent
– namely Bangladesh, Bhutan, Maldives, Nepal, Pakistan, India and Sri
Lanka – would be created only in 1985, which is more than 20 years after
the OAU.
The move to join the OAU proved to be beneficial over time, as it enabled Mauritius to
obtain preferential access to the EEC market through the Lomé Convention. This process
could arguably be attributed to the foresight and leadership role played by Mauritian
leaders, but there was probably an element of luck involved as well.
2.7.5 The dual-track approach
Although Mauritius moved to adopt the EPZ, it must be remembered that the country
retained the protectionist policies of ISI. Apart from the revenue benefits of keeping the
ISI, it is noted that this was probably a wise decision to accommodate the interests of the
elites operating under the Development Certificates. Table 2.2 gives an indication of the
types of firms and the ethnic groups that operated under Development Certificates through
a sample of 50 firms from the 1960s and early 1970s.
(i) There was a wide range of manufactured products, such as beer, margarine, pickles,
soap, paint, edible oil, cosmetics, canned food, glasses, plastic pipes, biscuits,
garments, toothpaste detergents, shoes, mattress, rolled steel and metal, to name
just a few.
(ii) About 50% of these DC companies operated in the capital (Port Louis) and the rest
in the other towns. Only one company operated in the village of Calebasse. This is
a clear indication that villages were left out of the import substitution strategy,
meaning that only the Indo-Mauritians from the urban bourgeoisie were obtaining
DC certificates.

51
(iii) It is furthermore noted that out of the 50 companies, 32 i.e. 64%, were owned by
the Franco-Mauritian elite who were also controlling the other sectors of the
economy. There were 8 Hindu companies (16%), 5 Muslim (10%) and 5 Sino-
Mauritian companies (10%). The Indo-Mauritian community in total had about a
quarter of DC companies. The biggest share of these ISI industries went to the
Franco-Mauritian elite.
Table 2.2 Firms under Development Certificates
Company name Address Entry into
operation date
Population group
Crown Cork Industries Ltd Port Louis 12.10.70 Franco-Mauritian
Food Canners Ltd Port Louis 01.07.72 Franco-Mauritian
Miroverre Ltd Moka 27.09.62 Franco-Mauritian
Mayfair Company Ltd Moka 01.07.66 Franco-Mauritian
Perfection Dry Cleaners Ltd Port Louis 01.07.65 Franco-Mauritian
Mauritius Steam Navigation Co
Ltd
Port Louis
01.04.65 Franco-Mauritian
Plastic Pipes & Products Ltd Port Louis 16.09.74 Franco-Mauritian
Blymetal Ltd Port Louis Franco-Mauritian
Grewals Mauritius Ltd Belle Village 31.10.61 Franco-Mauritian
Mauritius Biscuit Making Co Ltd B.Village 01.11.71 Indo-Mauritian Hindu
Margarine Industries Ltd Quatre Bornes 01.08.67 Indo-Mauritian Muslim
Desbro International Ltd Port Louis 22.08.68 Franco-Mauritian
F.D.G Garments Industries Ltd Port Louis 01.05.70 Franco-Mauritian
Mauritius Cosmetics Ltd Vacoas 01.07.67 Indo-Mauritian Hindu
Nova Industries Ltd Port Louis 06.01.69 Indo-Mauritian Muslim
Plastic Industry (Mauritius) Ltd Port Louis 01.06.72 Franco-Mauritian
Paper Converting Co Ltd Vacoas 02.10.67 Indo Mauritians-Hindu
Blychem Ltd Port Louis Franco-Mauritian
Mauritius Gloves & Suitcases Ltd B. Village 01.12.71 Sino-Mauritian
Detergents Ltd Plaine Lauzun 01.02.72 Franco-Mauritian
Taylor Smith & Co Ltd (Eng div) Port Louis 01.03.71 Franco-Mauritian
Food & Allied Industries Ltd Moka 22.04.66 Franco-Mauritian
Standard Continuous Sty Ltd Pailles 01.09.69 Franco-Mauritian
Beekun Industrial Ltd Port Louis Indo-Mauritian Hindu
Blytronics Ltd Port Louis Franco-Mauritian
Mauritius Oil Refineries Ltd Port Louis 20.11.68 Franco-Mauritian
Resiglas Ltd Calebasse 18.01.66 Franco-Mauritian
I.M Sayed (plyform) Port Louis 02.11.70 Indo-Mauritian Muslim
Bata Shoe Company (Mauritius)
Ltd
Port Louis
07.12.64 Sino-Mauritian

52
Mauritius Confectionary &
Biscuits Ltd
Port Louis
07.04.69 Franco-Mauritian
Mauritius Farms Ltd Curepipe 01.12.74 Franco-Mauritian
Rubber Industries Ltd Port Louis 01.05.69 Indo-Mauritian Hindu
Mauritius Stationery
Manufacturers Ltd
Port Louis
01.06.71 Franco-Mauritian
Gaz Carbonique Ltd Phoenix 10.10.61 Franco-Mauritian
GRD Industries Tulsidas Ltd Port Louis Indo-Mauritian Hindu
Ste Mcienne de navigation Port Louis 17.01.69 Franco-Mauritian
Zenith Enterprises Ltd Port Louis 01.05.72 Sino-Mauritian
Cernol Chemicals Ltd Port Louis 07.09.70 Franco-Mauritian
Butter & Dairy Enterprises Ltd Phoenix Indo-Mauritian Hindu
A.S Henry Ltd (Cat Colomba) Curepipe 01.07.67 Franco-Mauritian
Soap & Allied Industries Ltd
(Currimjee Group)
Plaine Lauzun
01.11.66 Indo-Mauritian Muslim
Mauvilac & Co Ltd Pailles 01.01.65 Franco-Mauritian
Light Industries Manufacturing Co
Ltd
Port Louis
19.01.70 Indo-Mauritian Muslim
Anthurium & Orchids Ltd Vacoas 01.04.67 Franco-Mauritian
Mauritius Breweries Ltd Phoenix 16.07.63 Franco-Mauritian
Mauritius Fishing Development
Company Ltd
Port Louis
07.11.65 Franco-Mauritian
Retreaders Ltd. Cassis 01.07.65 Franco-Mauritian
Jet Industries Ltd Port Louis 01.04.68 Indo-Mauritian Hindu
Gary Industries Ltd Port Louis 01.07.66 Sino-Mauritian
Aluminium Enterprises Ltd Port Louis 01.04.71 Sino-Mauritian
Source: Central Statistics Office, Mauritius and other sources (Enterprise Mauritius and
M/Industry)
Although not very successful, the DC strategy led to the establishment of a certain number
of industrial activities in the economy and helped elites to diversify their production base,
as well as create new businesses among the Indo-Mauritian population.
Despite the fact that ISI was not bringing the expected results, the national unity
government was effectively implementing a policy that corresponded to Qian’s (2001)
dual-track approach, in which second-best policy options are pursued in the interests of
stability, unity and a smooth transition.
Prominent among the Hindu-Muslim elites operating under the Development Certificates
within the ISI framework were the Dookun and Currimjee families. The Dookun family

53
started Mauritius Cosmetics Limited in 1965 for local production of the toothpaste brand
Blendax under licence from Procter & Gamble (http://deramann.com/mcl.php). Currimjee
Jeewanjee & Company Limited as a trading company was established as early as 1890 in
Mauritius and was dealing in the import of foodstuffs and commodities as well as the export
of sugar. Trading and commerce remained the main activities of Currimjee Jeewanjee &
Co Ltd until the company started diversifying actively into retail activities in the 1960s and
into services in the 1980s (http://www.currimjee.com/journey). Most of these pioneer
families were almost certainly politically close to the Labour government that would rule
independent Mauritius from 1968. It is practically impossible to obtain formal evidence of
their support to the Labour Party, but it is widely and publicly known that these pioneer
families made a substantial financial contribution to the Labour Party’s independence
campaign. The fact remains that it was in their interest to support the party fighting for
independence in the hope that after independence, more economic opportunities would
become available to Indo-Mauritian businessmen in an economy so far controlled
exclusively by the Franco-Mauritian elite.
Furthermore, it is to be noted that contrary to the situation where more than 60% of
ownership of ISI companies was concentrated in the hands of Franco-Mauritians, at the
very start of the EPZ we can see that they were controlled principally by the Sino-
Mauritians, who owned more than 40% of EPZ companies in 1972. Though the Sino-
Mauritian and Franco-Mauritian presence will later remain dominant in this sector, during
the 1980s all population groups eventually became part and parcel of the success of the
EPZ. Table 2.3 shows employment for the first EPZ enterprises in Mauritius.
Table 2.3 The first EPZ enterprises in Mauritius and their employment
Year Companies April
1971
December
1971 1972
1970 L.P.S. Ltd. (diamond cutting & polishing) 9 70 116
Resultant (Mauritius) Ltd. (industrial gloves) 153 6 402
Career Co (Mauritius) Ltd. (Wigs) 260 324 0
Vettex (Mauritius) Ltd. (garments) 100 83 114

54
Suzy Toys Ltd. (toys and games) 30 74 173
1971 Floréal Knitwear (Mauritius) (knitwear) - 300 678
Cie. Des Maquettes José Ramart (model boats) - 68 70
Mauritius Foods Ltd. (pickles, relishes and soups) - 26 30
Classic Design (Pty) Ltd. (reproduction of antique
furniture) - 13 23
Elcom Ltd. (electronic) - 4 17
1972 Orkay Synthetics Ltd. (fibre processing) - - 10
Overseas Gloves Factory Ltd. (gloves) - - 65
Southern Cross Diamond Co Ltd. (synthetic diamond
abrasive grit) - - 18
Compagnie Mauricienne de Meuble et du Rotin
(rattan furniture) - - 17
International Wigs (wigs) - - 23
Textile Industries Ltd. (garments) - - 700
Compagnie Mauricienne Commerciale (ladies’ and
children’s garments) - - 30
Proton Ltd. (peanut flour) - - 12
Micro Electronics (electronic components) - - 22
Overseas Marine Products Ltd. (dried sharks fins) - - 10
TOTAL EMPLOYEES 552 968 2530
Source: The Times London, 5 March 1975. Courtesy Lim Fat.2
2.7.6 Ethnic diversity and culture as a determinant of economic development
Mauritian society is made up of different ethnic groups which were divided as follows in
1972 (CSO Mauritius figures): Indo-Mauritians (66.4% – consisting of Hindus 50.3% and
2 From Table 2 it is noted that, as explained by Fane-Pinoe (2008), Suzy Toys set up by Lim Fat
was the first company to operate in the EPZ in 1970. He was in partnership with H. Bauer, a German
investor. Resultant created by Tang of Hong Kong and Career Wigs also started operation in 1970.
Shortly afterwards, R. Seeyave and the Hutchinson Group of Hong Kong set up Floreal Knitwear,
the Ah Chuen family started Textiles Industries Ltd with Hong Kong Partners, and other Hong
Kong pioneers started Crystal Knitwear, Overseas Gloves and Afrasia. We also had Jose Ramart
with boat models. Therefore the Sino-Mauritians and those from the General Population category
would be the first local people to enter the EPZ. Other communities of the Mauritian nation would
also join from 1975 onwards.

55
Muslims 16.1%), General Population (30.7% – consisting mainly of Creoles (people of
African descent 23%) and the rest composed of Franco-Mauritian (2%) and coloureds) and
Sino-Mauritians (2.9%). English is the official language, while French is widely used as
the spoken language.
Abramovitz (1995) sees culture – which includes beliefs, values, preferences and trust – as
shaping the attitudes of people towards work, adding that a country’s culture determines
its economic performance. While it was very difficult to come up with a specific work
culture for Mauritians at the time of independence, as it is made up of so many ethnicities
with different values and attitudes, we can argue on the diaspora connections of Mauritius
to explain the culture hypothesis. Brautigam (2005) emphasises the diaspora and how it
helped operationalise the EPZ in its early stages. She gives a very good account of how the
Chinese diaspora played a determining role in the successful setting up of the EPZ in
Mauritius. Prof. Lim Fat, who – as mentioned before – was the first person to seriously
think that the EPZ could be successfully implemented in Mauritius, had his in-laws in
Taiwan. Even before being mandated by the government to go on an official exploratory
mission to Taiwan, the Lim Fat family were already paying regular visits to their family in
Taiwan. It is in this family context that Prof. Lim Fat seized the opportunity to look at how
the EPZ was functioning in Taiwan, which had already reached an advanced stage. After
the introduction of the EPZ in Mauritius, the Lim Fat family were among the first
Mauritians to set up an EPZ factory in Mauritius with a partner from Hong Kong, which
opened the way for others from that region.
Since then, Brautigam (2005) explains, many Sino-Mauritians began to use their personal
contacts in the Far East to promote investment and joint ventures between the Far East and
Mauritius. Another example of these links is the story of another important Sino-Mauritian
family, the Ah Chuen family. Sir Jean Ah Chuen, former Minister of Local Government
from 1970-1976, would also be one of the pioneers of the EPZ, together with the Lim Fat
family. Sir Jean had some of his family members settled in Hong Kong, and a brother-in-
law from Hong Kong was also appointed as the Honorary Consul of Mauritius there. Using
these contacts, the Ah Cheun family set up several EPZ factories and joint ventures in
Mauritius, operated by Hong Kong firms. During the first few years of operation of the

56
EPZ, 60% of capital investment came from Hong Kong, and the rest from Taiwan,
Malaysia and Singapore (Brautigam, 2005). The first industrialists exclusively from Hong
Kong came from the Esquel Group, which is one of the world's leading producers of
premium cotton apparel. ‘Based in Hong Kong with production facilities in China,
Malaysia, Vietnam, Mauritius and Sri Lanka, the group manufactures for some of the
world's best known brands, including Tommy Hilfiger, Hugo Boss, Nike and major
retailers such as Marks & Spencer’ (http://www.esquel.com/en).
After the Sino-Mauritian diaspora, who were the pioneers of the Mauritian EPZ, some
Franco-Mauritians sugar barons also became interested in joining the textile industry. The
Dalais family created Floreal Knitwear, Tim Taylor with Cobra, Francois de Grivel with
Festival and the Lamusse and Espitalier Noel groups. The first Indo-Mauritians to enter the
textile export industry were the Currimjee Group with Bonair Industries. It is to be noted
that the Currimjee Group were already operating under Development Certificates,
producing soap under the name of Soap and Allied Industries Ltd. Similar to the Currimjee
family, there were many businessmen who owned DC firms under the ISI strategy but also
invested in the EPZ. They had the advantage of being already familiar with industrialisation
and factory work, which made it easier for them to shift or diversify in the EPZ, compared
to those who did not have prior knowledge or experience in industry.
2.7.7 Towards an Integrated Framework to explain the Mauritian EPZ
Rodrick (2013) has argued that the factor that enabled reform in countries such as China
and South Korea was not a reconfiguration of political power, but the emergence of new
strategies. He further mentions that economic changes often happen not when vested
interests are defeated, but when different strategies are used to pursue those same interests.
The study of the political economy and the political institutions that it develops is therefore
central to our understanding of who gains and who loses from the status quo in attempting
to make sense of policies adopted by the government.
Having said this, the EPZ story in Mauritius could be explained using a framework in which
all the factors mentioned are intertwined with each other and the pursuit of vested interests
prevailed in the making of policy decisions. At the time of independence the Indo-

57
Mauritians who fought hard for a Labour government to be elected were expecting an end
to the status quo of being ruled economically by the narrow Franco-Mauritian elite. When
the decision was taken to adopt the EPZ, notwithstanding the economic reasoning behind
the EPZ creation such as diversification of the economy and attracting FDI to induce
economic growth, the EPZ was the only viable strategy, as Brautigm (1997) argues, to
increase employment and meet the demands of the most vocal constituents –the Indo-
Mauritians and Creoles – without directly attacking the base of privilege of the powerful
elites, the Franco-Mauritians. The government, rather than fighting against the plantation
owners, encouraged them to join the EPZ by putting high export taxes on sugar, which led
many of them to establish EPZ factories on the island and sell off some of their plantations
to the Indo-Mauritians. The development of the EPZ institution fitted well with the
economic needs of the country and was compatible with the interests of the ruling power.
Thus, at a very early stage the government decided to satisfy its constituents by moving
towards inclusive political institutions, where instead of power being vested in a narrow
group, the government would encourage a broad coalition of many groups to share power.
The inclusive institutions of democracy, the British-style parliament and a constitution
which stressed the protection of property rights were a guarantee that there would be no
expropriation of the Franco-Mauritians sugar plantations. This helped in securing the
support of Franco-Mauritians.
This strategy also made it possible for Mauritius to promote new elites without having to
undergo the process of ‘creative destruction’, as the sugar plantation elites kept their
privileges, while newcomers were benefiting from the advantages offered by the ISI and
EPZ. This led to an increase in the number and ethnic composition of the elites.
The same reasoning can be used to explain the choice of institutionalising communal
representation in parliament by adopting a ‘best losers’ system’, which was a way to
guarantee to minorities that the government institution was politically inclusive. This need
to provide guarantees to the minority was especially important at that time, because the
nation was still very fragile following the traumatising experience of communal riots just
one year before independence.
58
Moreover, the dual-track approach, as outlined by Qian (2001), well describes the policy
that Mauritius adopted when it decided to move towards liberalisation through the adoption
of the EPZ for the political reasons mentioned, while keeping the protectionist ISI in place
to satisfy the Franco-Mauritian elites, the new Indo-Mauritian and Sino-Mauritian elites,
who were the political power base of the Labour and PMSD parties. From this perspective,
it becomes clearer that the vested interests of all stakeholders were being preserved in the
process, which explains why there were no major demonstrations/upheavals when these
economic strategies were adopted.
As regards the idea of an EPZ and how it came about, though we could agree that the
insistence of Prof. Lim Fat to push hard for the implementation of the EPZ was done in the
broad economic interest of Mauritius, self-interest prevailed once more. We should bear in
mind the fact that Prof. Lim Fat got the idea while visiting his relatives in Taiwan and he
would be one of the first Mauritians to set up an EPZ company in Mauritius. Had Prof. Lim
Fat been a member of another community without relatives in Taiwan and had his interest
to do business personally in the EPZ not been that pronounced, it is questionable whether
the idea of the EPZ would ever have materialised in Mauritius at such an early stage.
On the diplomatic front, again, notwithstanding the visionary move of the Prime Minister
of Mauritius to join the OAU, which eventually helped Mauritius in gaining preferential
access for its EPZ products in the EU and US markets as part of the EU/ACP partnership,
the foreign policy decision of Mauritius to join the OAU was also taken in the context of
showing the Creole community (whose ancestors came from Africa) that they were also
being catered for and were part and parcel of independent Mauritius. Had Mauritius
decided to incline more towards India and Asia, the Creole community would have felt that
the government was reluctant for Mauritius to be linked to Africa. Thus indirectly, the
newly independent government was trying to secure the Creole community, which was
opposed to independence, and inviting them to join in the efforts towards nation building.
Thus, though we recognise the causality of the political economy factors, namely inclusive
institutions, ideas, luck, leadership, the dual-track economic strategy and ethnic diversity
in the choice of creating an EPZ in Mauritius, there was also a strong component of

59
compromise-based politics that formed part of the Mauritius equation that guided the
decisions of the government.
2.8 Conclusion
At the time of independence Mauritius had several inherent constraints which made
renowned economists and historians prophesy that the country was doomed. Fortunately,
the government and its people used these constraints to the country’s benefit. The creation
of the EPZ helped the country overcome its structural problems with successful
diversification. Throughout this chapter, the most important political economy factors have
been identified based on earlier and more recent literature, which acted in favour of the
creation of the EPZ in Mauritius. These factors are inclusive institutions prior to and after
independence, ideas, luck, leadership, the dual-track economic strategy, ethnic
diversity/diaspora and the protection of vested interests. All these factors provided the
framework within which the EPZ was created and developed into the Mauritian economic
‘miracle’.
ANNEXURE
Background on the Export Processing Zone (EPZ)
This section provides a brief overview of what an EPZ is and the historical background to
the EPZ worldwide. The World Bank (1992:7) gives a narrow definition of EPZs as
‘fenced-in industrial estates specialising in manufacturing for exports that offer firms free
trade conditions and a liberal regulatory framework’. Madani (1999:14) broadens the
60
definition by allowing ‘for domestic sales and including export processing firms which
benefit from the same EPZ incentives without being fenced-in’. For Mauritius the EPZ
created distinctive arrangements, where firms specialising in exports would qualify for
duty-free imported inputs regardless of their location on the island. For Mauritius the EPZ
covered the whole island, though it was initially started with a distinct area in Plaine
Lauzun, enjoying special status allowing for duty-free imports of equipment and other
materials to be used in the manufacturing of goods earmarked for exports. This special
status generally involves, inter alia, favourable legal provisions and regulations pertaining
to taxation. Madani (1999) also includes less government red-tape, with more flexibility
with labour laws for firms in the EPZ than in the domestic market.
EPZs first appeared in the mid-1960s in widely different places – namely Ireland, Puerto
Rico, the Dominican Republic, India and Taiwan.
Taiwan’s Kaohsiung EPZ (KEPZ), however, was the first to use the term ‘export
processing zone’ in its EPZ Law of 30 January 1965. The objective of the zone was to
attract industrial investment, promote foreign trade, create jobs and introduce modern
industrial technology. ‘The Kaohsiung EPZ was created on reclaimed land on the island’s
leading port and began exporting in 1966’ (World Bank, 1992). After only six years of
operation (i.e. 1972), the EPZ was already employing as many as 57,000 workers.
According to Shapiro (1981), free-trade zones had existed before in many commercial
centres, but EPZs were a new kind of export-oriented growth based on imported raw
materials, which had emerged in Taiwan in the early 1960s. In Taiwan, from the outset of
the KEPZ, the Taiwanese government sought to bring foreign investment into the zone by
providing attractive facilities. Shapiro (1981) mentions the following facilities that were
provided by the KEPZ: (i) cheap, abundant labor, (ii) no duties on imported raw materials
or exported finished products, (iii) no sales tax or commodity tax levied on companies
within the zones, (iv) a five-year corporate tax holiday offered to enterprises in the zones
which conformed to the criteria of the ‘Statute for Encouragement of Investment’, (v)
greatly reduced red tape, (vi) standard factory buildings available for purchase (with
generous government financing) or rent, (vii) good transportation to and from major
harbours and airports.

61
The Taiwanese experience was replicated by many developing countries, of which
Mauritius, where the EPZ which was set up in 1970, was one. Other countries included the
Republic of Korea (1970), Malaysia (1972), Indonesia (1973), India (1974), Senegal
(1974) and Liberia (1975). To different degrees and proportions, the Asian nations were
very successful in the implementation of the EPZ. Senegal and Liberia were not as
fortunate. This is precisely what made Mauritius different and its success during the 1980s
and 1990s is regarded as outstanding because it was one of the few African countries that
did actually use the right mix of policies to support its export-oriented strategy.
References
Abramovitz, M. (1995). “The Elements of Social Capability”. In D. Perkins and B. H. Koo
(eds.), Social Capability and Long-term Economic Growth New York: St Martin’s Press,
pp 19–47.
Acemoglu, D. & Robinson, J.A. (2012). “Why Nations Fail, The Origins of Power,
Prosperity and Poverty”. London: Profile Books.
62
Aggarwal, Aradhna (2005). “Performance of Export Processing Zones: A Comparative
Analysis of India, Sri Lanka and Bangladesh”, Indian Council for Research on
International Economic Relations, Working Paper No.155. India
Alesina, A.F (2007). “Program Report: Political Economy”, NBER Reporter, 3:1-5.
Baer, Warner (1983). Brazilian Economy: Growth and Development, 5th Edition, Kindle
Edition.
Baissac, Claude (2003). “Maximising the Developmental Impact of EPZs: A comparative
perspective in the African context of needed accelerated growth” a presentation at the
Johannesburg EPZ Symposium. WEPZA Secretariat available at
http://www.wepza.org/article7.html
Bello, W. & Rosenfeld, S. (1992). Dragons in Crisis. London: Penguin Books.
Boulle. P.L. (1978). “The Past, Present and Future of our Export Processing Enterprises”,
January 1978 Confidential Report.
Bowman, L.W. (1991). Mauritius: Democracy and Development in the Indian Ocean.
London: Westview Press.
Brautigam, D. (1997) “Institutions, Economic Reform and Democratic Consolidation in
Mauritius”. Comparative Politics, Vol. 30, No. 1 (October): 45-62.
Brautigam, D. (2005). “Strategic Engagement: Markets, Transnational Networks and
Globalization in Mauritius”. Yale Journal of International Affairs, Vol. 1, Summer/Fall:
63-78.
Chang, Ha-Joon (2002). Kicking Away the Ladder – Development Strategy in Historical
Perspective. London: Anthem Press.

63
David, Paul. A. (1994). “Why are Institutions the ‘Carriers of History’?: Path Dependence
and the Evolution of Conventions, Organizations and Institutions, Structural Change and
Economic Dynamics”. Elsevier, Vol.5, No.2: 205-220.
English, Philip (1997). “Mauritius, Reigniting the Engines of Growth. A Teaching Case of
the Economic Development Institute of the World Bank: World Bank.
Fane-Pinoe, H.L.T. & Lim Fat, E (2008). From Alien to Citizen: The Integration of the
Chinese in Mauritius. Edition de l’Ocean Indien, Rose Hill, Mauritius.
Fowdar, Narud (1991). “Textiles and Clothing in Mauritius”. EIU Textile Outlook
International, November 1991, the Economist Intelligence Unit.
Fowler, J. K. (2009). “Ha-Joon Chang and Dani Rodrik: Applications to Mauritius and
Madagascar.” Available at http://jkfowler.com/2009/12/26/ha-joon-chang-and-dani-
rodrik-applications-to-mauritius-and-madagascar/.
Frankel, Jeffery A. (2010). “Mauritius: African Success Story.” NBER Working Paper No.
16569. Cambridge, MA: National Bureau of Economic Research.
Garrity, Monique P. (1977). “Implications of the Lomé Convention for African Trade and
Development”. Review of Black Political Economy, Vol.8 No.1: pages 5-26
Hein, Catherine (1988). “Multinational enterprises and employment in the Mauritian
export processing zone”. Working Paper No. 52, Multinational Enterprises Programme.
Geneva: International Labour Office.
Hein, P. (1989). “Structural Transformation in an Island Country, The Mauritius Export
Processing Zone (1971-1988)”. UNCTAD Review, I, 2, 41-77.
64
Kreye, O, Heinrichs,J. and Frobel, F (1987). “Export processing zones in developing
countries: Results of a new survey”, Working Paper No. 43, International Labour Office,
Geneva.
Library of Congress, Country Studies, Federal Research Division, Library of Congress.
Available at http://www.mongabay.com.
Lim Fat, Edouard (1969). “Free Industrial Zones in Taiwan and Puerto Rico”, La Revue
Agricole et Sucriere, Vol. 48 No. 4. Note: I also carried out a series of interviews with
Professor Lim Fat from October to December 2009 (where a copy of a manuscript of some
of the chapters of a book that he was writing was handed over to me).
Lin, Justin Yifu (2009). Economic Development and Transition: Thought, Strategy and
Viability. New York: Cambridge University Press.
Madani, Dorsati (1999). “A Review of the Role and Impact of Export Processing Zones”.:
Washington D.C:World Bank.
Madhukar, Shubha (2004). “What is the Multi-Fibre Agreement?”. Available at domain-
b.com.
Meade, James (1961). “Report to the Government of Mauritius”. London, Methuen and
Co.
MercyCorps (2007) “The ‘Mauritian Miracle’ –a southern African success story“. Global
Envision-Initiative of Mercy Corps. Available at
http://www.globalenvision.org/library/10/1649/
Ministry of Economic Planning and Development (1980). “1980-82 two-year plan for
economic and social development”. Port Louis: Government Printer.
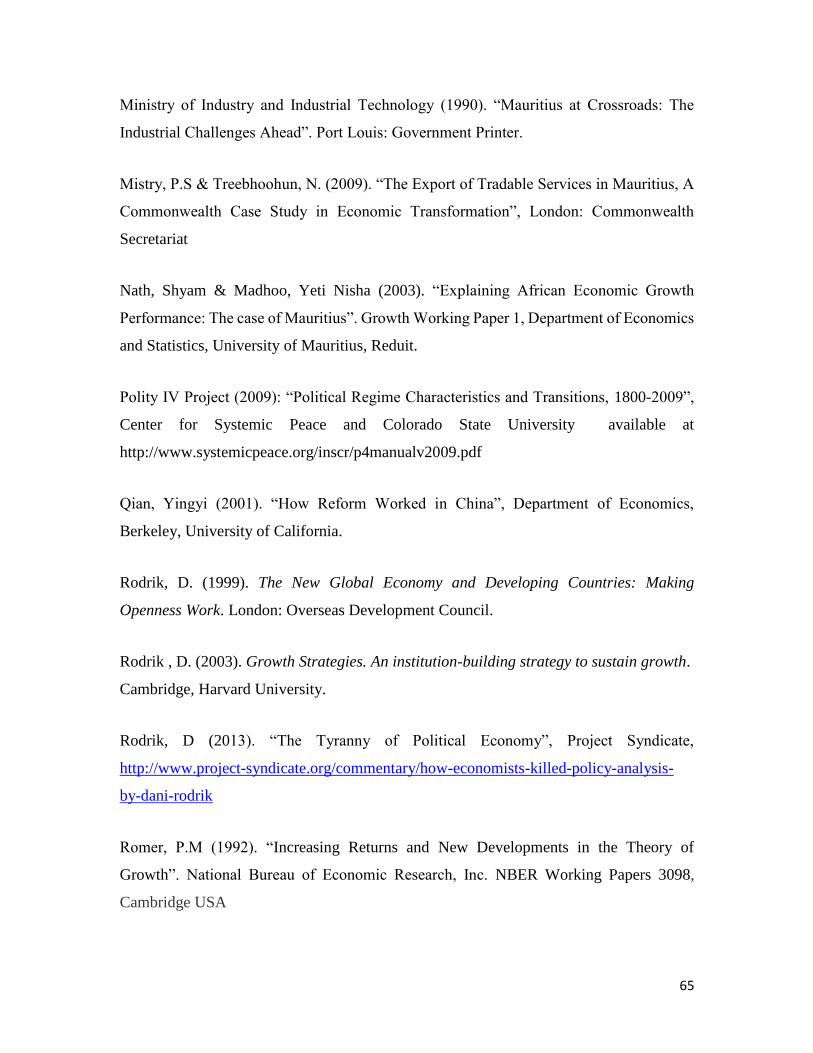
65
Ministry of Industry and Industrial Technology (1990). “Mauritius at Crossroads: The
Industrial Challenges Ahead”. Port Louis: Government Printer.
Mistry, P.S & Treebhoohun, N. (2009). “The Export of Tradable Services in Mauritius, A
Commonwealth Case Study in Economic Transformation”, London: Commonwealth
Secretariat
Nath, Shyam & Madhoo, Yeti Nisha (2003). “Explaining African Economic Growth
Performance: The case of Mauritius”. Growth Working Paper 1, Department of Economics
and Statistics, University of Mauritius, Reduit.
Polity IV Project (2009): “Political Regime Characteristics and Transitions, 1800-2009”,
Center for Systemic Peace and Colorado State University available at
http://www.systemicpeace.org/inscr/p4manualv2009.pdf
Qian, Yingyi (2001). “How Reform Worked in China”, Department of Economics,
Berkeley, University of California.
Rodrik, D. (1999). The New Global Economy and Developing Countries: Making
Openness Work. London: Overseas Development Council.
Rodrik , D. (2003). Growth Strategies. An institution-building strategy to sustain growth.
Cambridge, Harvard University.
Rodrik, D (2013). “The Tyranny of Political Economy”, Project Syndicate,
http://www.project-syndicate.org/commentary/how-economists-killed-policy-analysis-
by-dani-rodrik
Romer, P.M (1992). “Increasing Returns and New Developments in the Theory of
Growth”. National Bureau of Economic Research, Inc. NBER Working Papers 3098,
Cambridge USA

66
Ron, Alter (1991). “Lessons from the export processing zone in Mauritius”. An article from
Finance and Development. available at http://www.highbeam.com/doc/1G1-
11705329.html
Shapiro, J.E (1981). “Where the EPZs are called ‘Utopia’ for Business”. The Multinational
Monitor, Vol. 2, No. 6.
Stiglitz, Joseph E. (2011). “The Mauritius Miracle.” Project Syndicate, 23 October 2011.
Subramanian, A. & Roy, D. (2001). “Who can explain the Mauritian Miracle: Meade,
Romer, Sachs or Rodrik?”, IMF Working Paper. Available at
http://www.iie.com/publications/papers/subramanian0701imf.pdf.
Subramanian, A. (2009). “The Mauritian Success Story and its Lessons.” UNU-WIDER
Research Paper. World Institute for Development Economic Research (UNU-WIDER).
Available at http://ideas.repec.org/p/unu/wpaper/rp2009-36.html.
Selvon, S. (2001). A Comprehensive History of Mauritius. city: Mauritius Printing
Specialists Ltd.
Teelock, V. (2001). Mauritian History – From its Beginnings to Modern Times. Moka:
Mahatma Ghandi Institute Press, Mauritius.
Thomas, Dana (2005). “Picking up the pieces. The developing nations that grew prosperous
on quotas fear their economies will unravel”, Newsweek International.
Todaro, M. & Smith, S. (2009). Economic Development. Tenth Edition. city: Prentice Hall.
Tullock, Gordon, (2008). “Public Choice” from The New Palgrave Dictionary of
Economics. Second Edition. Palgrave Macmillan.
67
Work Bank (2013). “Export Processing Zones by Country: Improving Infrastructure and
Special Economic Zones (SEZs) in Africa”. Economic Department, Industry
Development Division, Trade Policy Division, World Bank, 10 July. Washington DC,
World Bank.
World Bank (1992). “Export Processing Zone”, Industry and Development Division.
Washington DC, World Bank.
Yergin, D.S. & Stanislaw, J. (2002). “Raul Prebisch and Dependencia Theory”. From
Commanding Heights. New York: Simon & Schuster, pp. 232-344.
Yeung Lamko, Louis (1998). The Economic Development of Mauritius since
Independence. Sydney: University of New South Wales.
CHAPTER 3
EXPLAINING THE ECONOMIC PERFORMANCE OF THE MAURITIAN EPZ:
TRADE THEORIES
3.1 Introduction
The previous chapter examined the political economy factors which explain why the
Mauritian government chose the EPZ strategy and was able to implement it effectively. In

68
this chapter, after first examining the impact the EPZ had on the economy during the critical
years of the 1980s, the causal factors that underpinned this success from the perspective of
trade theory will be analysed. Shortly after the operationalisation of the policy, the number
of EPZ enterprises increased sharply from only 9 in 1971 to 85 in 1976 (English, 1997).
The number of employees in the EPZ also rose significantly during the same period, from
less than 1,000 to 17,171. Sugar, however, remained the sector employing most of the
workforce throughout the 1970s, with 52,620 workers in 1976.
As far as the GDP of Mauritius is concerned, when there was no EPZ in the 1960s, real
GDP growth rates showed negative figures on four occasions during the 1960s (1965 and
1967-1969). These figures became more promising during the 1970s after the introduction
of the EPZ. For instance, during the period 1972-1976, the real annual GDP growth rates
exceeded 20.0% in 1976 (at 21.4%) (World Penn table for GDP). The average real GDP
growth for that five-year period was 7.6%, compared to the period 1964-1970, which had
a negative average growth of -1.5%. For the period 1985-1995, the economy grew at an
average of more than 5.0% annually in real terms, with a significant contribution coming
from the EPZ sector. Comparing this to Africa, where the average GDP growth rates for
1981-1990 were less than 2.0%, the Mauritian growth rate appears to be exceptional
(UNCTAD, 2008).
The existing literature on the Mauritius EPZ has not explored trade theories to see which
of them could be used to explain the success of the EPZ in Mauritius. This chapter will
undertake an analysis of the neoclassical and new trade theories to ascertain which one best
explains the Mauritius case. The neoclassical international trade theory found in the
Hecksher-Ohlin (H-O) model is the first theory that will be investigated to assess its
relevance in explaining the success of the EPZ in Mauritius. The H-O model states that a
country specialises in the production of goods in which it has a comparative advantage in
terms of factor endowments. When Mauritius decided to implement an EPZ, its
comparative advantage was still in the sugarcane plantations. It will be shown that, had
Mauritius conformed with the H-O model, it would today still have only two sectors –
namely, sugarcane and tourism.

69
Next, the new trade theories will be considered, in particular the Krugman and Venables’
model, which relaxes many of the assumptions of the H-O model. It basically sets out two
very important factors that could explain the EPZ growth – namely, transport costs and
wage costs. Based on this, the chapter will then proceed to test Hypothesis No. 1: Transport
costs and wage costs explain the EPZ take-off. To test this hypothesis data were obtained
on factors that contributed to transport costs during the take-off period – namely, air
transport costs and shipping costs (SC), which include port fees (e.g. port charges for
clearing containers), waiting time at port, port infrastructure and the shipping routes of
vessels entering the Mauritian zone. It was necessary to check whether there was a drop in
any of these figures at the time of take-off, which would make the case for low transport
costs as a causal factor in the EPZ take-off. The same exercise was done with wage costs
in Mauritius during the period 1981-1987, which were then compared to wage costs in
other countries that had operational EPZs at this time.
The possibility was then considered that the success of the EPZ had nothing to do with
factor endowments or shifting cost structures, but rather with Hypothesis No. 2: The EPZ
take off can be explained by the preferences framework that provided Mauritius with
preferential access to global markets. To study this possibility, the Multi Fibre Agreement
(MFA) and Lomé advantages that Mauritius received were compared with the advantages
obtained by other African countries. If it is the case that these other African countries failed
to create EPZs that were as successful as the Mauritian EPZ, then factors other than
agreements must be found to explain the exceptional Mauritian case. The possibility that
preferences interacted with other causal factors to produce the unique success of the
Mauritius EPZ will also be considered.
3.2 The Mauritian economy during the 1980s
The story of Mauritian economic growth during the 1980s can be divided into two distinct
periods: the very early 80s and the period after 1982-1983, when the transition in the
fundamentals of the economy became apparent. The real annual average growth rate of the
Mauritian economy for the period 1983-1990 was 4.6%.
Table 3.1 Comparative real GDP growth rates (%)

70
Year Mauritius Madagascar US Ghana Senegal
1981 1.9 -6.1 1.6 -2.1 -5.8
1982 7.6 -2.9 -4.2 -0.6 15.3
1983 -0.3 -0.1 3.4 -8.7 -0.1
1984 2.6 -0.7 7.4 4.7 -7.4
1985 6.1 -2.7 2.5 1.5 1.5
1986 6.8 0.5 2.3 0.7 2.0
1987 7.9 -1.7 2.7 -0.5 -0.1
1988 3.7 -2.0 3.1 2.8 3.0
1989 5.9 1.9 2.6 1.8 -3.6
1990 3.8 -4.4 0.7 -0.2 -0.3
Average (83-90) 4.6
-1.2
3.1
0.1
-0.6
Source: Penn World tables for GDP
As from 1984 (seen in Table 3.1), the real growth of the Mauritian economy became
consistent and far surpassed that of other African countries, most of whom experienced
very low or negative growth rates. Even the USA was growing at a slower rate than
Mauritius during this period.
The growth of the Mauritian economy during the period 1983-1990 can be seen to be driven
strongly by growth in the EPZ sector. The average EPZ growth (seen in Table 3.2) for the
period was 19.2% of GDP, while that of the sugar sector was at -1.3% of GDP.
Table 3.2 Comparison of EPZ and sugar growth rates (%)
Year Growth rate of EPZ sector Growth rate of sugar sector
81 11.2 21.0
82 -2.9 19.8
83 8.9 -20.0
84 32.9 -3.9
85 30.0 15.1
86 34.9 13.0
87 22.0 -4.4

71
88 12.0 -9.4
89 6.0 -12.5
90 7.0 11.9
Average(83-90) 19.2 -1.3
Source: Central Statistics Office Mauritius
-20
-10
0
10
20
30
40
81 82 83 84 85 86 87 88 89 90
GDP EPZ Sugar
Figure 3.1: EPZ and sugar sectors growth rates (1983-1990)
Adapted from CSO Mauritius figures
Figure 3.1 shows that growth rates in the EPZ sector and GDP growth were positive
throughout the period and, until 1989, EPZ growth rates were consistently higher than the
GDP growth rates. Sugar sector growth rates, by contrast, remained erratic and became
negative during much of the period. As indicated in Table 3.3, the EPZ was the largest
contributor to GDP (apart from wholesale and retail) from 1986 onwards.
Table 3.3 Contribution of main sectors as a % of GDP
Year 1983 1984 1985 1986 1987 1988 1989 1990
Sugar 9.5 9.7 11.1 11.6 10.4 9.0 8.4 8.1
EPZ 5.2 7.2 9.5 11.5 12.8 13.0 12.1 12.0
Construction 6.2 5.7 5.6 5.3 5.4 5.9 6.4 6.9
Transport 11.5 11.4 10.9 10.8 10.3 9.9 10.6 10.7

72
Restaurants
and hotels
2.6 2.5 2.4 2.5 2.6 2.7 2.9 3.2
Ownership 12.8 12.1 11.1 9.6 8.2 7.3 6.9 6.5
Financial
institutions
1.9 2.0 1.8 1.8 3.4 3.8 4.3 4.8
Insurance 3.1 2.9 2.9 2.8 3.2 3.3 3.4 3.9
Wholesale
and retail
11.1 11.1 10.8 11.5 12.1 13.2 13.5 13.3
Source: Central Statistics Office, Mauritius
0
2
4
6
8
10
12
14
1983 1984 1985 1986 1987 1988 1989 1990
Year
EPZ as % of GDP
Figure 3.2: EPZ contribution as a % of GDP
Adapted from CSO Mauritius figures
Furthermore, EPZ as a percentage of GDP (Figure 3.2) grew steadily from 1983 onwards,
more than doubling in just the three-year period of 1983-1986.
Table 3.4 Total exports before and after EPZ take-off
Year 1976 1977 1978 1979 1980 1981 1982 1983 1984 1985 1986
*Exports in
Rs million 2,388 2,656 2,705 3,260 4,450 4,566 5,529 5,953 6,989 8,895 11,919

73
**Exchange
rate (Rs to 1
USD)
6.68 6.60 6.16 6.31 8.71 10.98 12.58 13.95 16.18 17.07 13.54
Exports in
current
USD
357.48 402.42 439.12 516.64 510.90 415.84 439.50 426.74 431.95 521.08 880.28
***Exports
in constant
USD (1976
as base
year)
357.48 377.85 383.22 404.91 352.79 260.30 259.15 243.79 236.55 275.55 457.01
Sources:
(i) *CSO Mauritius figures. Online
(http://statsmauritius.gov.mu/English/Pages/Historical-Series--National-
Accounts.aspx)
(ii) **Online (http://fxtop.com/en/historical-exchange-rates.php)
(iii)*** CPI Inflation calculator. Online
(http://www.bls.gov/data/inflation_calculator.htm)
Table 3.4 shows that from 1976 (when the EPZ was still in its infancy) until 1983 (when
the EPZ can be said to have taken-off), total exports of goods and services in current Rs
value more than doubled from Rs 2,705 million to reach Rs 5,953. However, total exports
in constant USD gives a totally different picture, owing to the fact that inflation rates in
Mauritius prior to 1983 were at double digits until 1982 (11.4%) and the government
devalued the currency in 1979. As from 1983, inflation fell significantly to 5.6% and
maintained a single digit value until the late 1980s. Furthermore, it can be noted that after
1984 total exports in constant USD started to pick up steadily, based principally on the
strength of the EPZ whose contribution to GDP overtook the threshold of 10% in 1986 and
remained on an increasing trend.
As the following graph reveals, from 1983 the share of EPZ exports as a percentage of total
Mauritian exports increased steadily.

74
0
10
20
30
40
50
60
70
1983 1984 1985 1986 1987 1988 1989 1990
Figure 3.3 EPZ exports as percentage of total Mauritian exports
Adapted from CSO Mauritius figures
EPZ exports surpassed sugar in 1987, increasing threefold from 1984 to 1987. As a
percentage of total export earnings, the EPZ sector accounted for 56.0% in 1987 and more
than two thirds of total exports in 1997. All these figures support the argument that the EPZ
sector at take-off was contributing significantly to GDP and to exports.
The rate of increase in investment in the EPZ, measured in terms of Gross Domestic Fixed
Capital Formation (GDFCF), was also significant for the period 1983-1989 as shown
below. Total GDFCF and GDFCF in EPZ both experienced a rate of increase at the time
of take-off from 1983 to 1984, but the rate of increase for EPZ was much more pronounced
than total GDFCF. The rate of increase of GDFCF for EPZ remained higher than total
GDFCF until 1986-1987. After 1987, although the rate of total GDFCF continued to rise,
the rate of increase of investment in the EPZ sector was declining, as investments were
now not solely concentrated in the manufacturing sector because a diversification process
was underway towards new sectors, in particular the financial services sector.
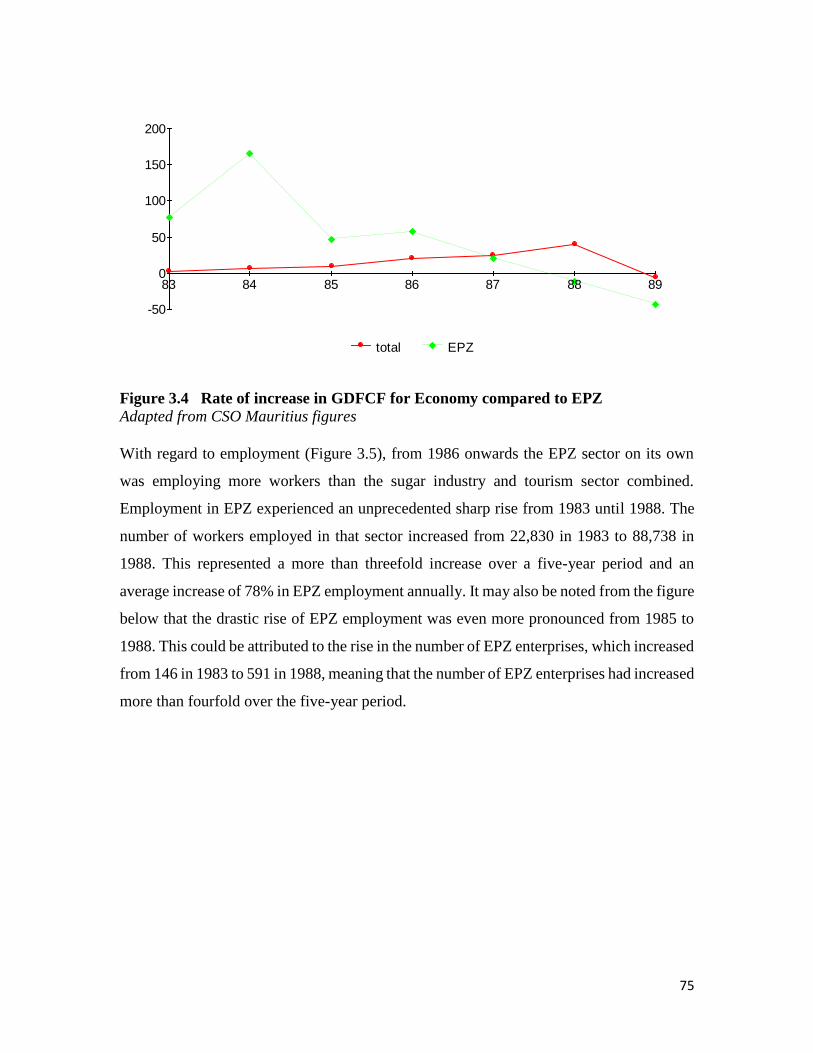
75
-50
0
50
100
150
200
83 84 85 86 87 88 89
total EPZ
Figure 3.4 Rate of increase in GDFCF for Economy compared to EPZ
Adapted from CSO Mauritius figures
With regard to employment (Figure 3.5), from 1986 onwards the EPZ sector on its own
was employing more workers than the sugar industry and tourism sector combined.
Employment in EPZ experienced an unprecedented sharp rise from 1983 until 1988. The
number of workers employed in that sector increased from 22,830 in 1983 to 88,738 in
1988. This represented a more than threefold increase over a five-year period and an
average increase of 78% in EPZ employment annually. It may also be noted from the figure
below that the drastic rise of EPZ employment was even more pronounced from 1985 to
1988. This could be attributed to the rise in the number of EPZ enterprises, which increased
from 146 in 1983 to 591 in 1988, meaning that the number of EPZ enterprises had increased
more than fourfold over the five-year period.

76
0
10000
20000
30000
40000
50000
60000
70000
80000
90000
1983 1984 1985 1986 1987 1988 1989 1990
EPZ Sugar Tourism
Figure 3.5 Employment in EPZ, sugar and tourism compared
Adapted from CSO Mauritius figures
To summarise, in an interview in Week-End Newspaper of 20 April 1988, the then Minister
of Finance of Mauritius, Mr V. Lutchmeenaraidoo, said ‘Mauritius was experiencing an
acceleration in terms of foreign investment, with the number of investors having increased
in significant proportions. The EPZ sector was the driving force behind this acceleration
in the Mauritius economic growth. The Mauritian model of development and the success
that it brought had prompted study visits from a number of reputable institutions, including
the University of Paris Dauphine. Mauritius was by then well on its way to joining the
league of Newly Industrialised Countries (NICs) comparable to other Asian countries that
had dynamic economies’ (Week-End Newspaper Mauritius of 20 April, 1988).
3.3 Discussion of theories
3.3.1 The H-O model from Hamada’s (1974) perspective
Previous analyses of Mauritius’s EPZ have not explored trade theories to see how they
could be used to explain the success of the EPZ in Mauritius. This section will contribute
towards filling this gap in the literature by providing an assessment of the neoclassical and
new trade theories to see whether they could be useful in pointing to the causal factors
behind the EPZ take-off in Mauritius.

77
The Hecksher-Ohlin’s (H-O) ‘two goods – two factors – two countries’ model says that a
country specialises in the production of goods in which it has a comparative advantage in
terms of factor endowments. That is, a country should export products that use its relatively
abundant factors intensively and import products that use its scarce factors intensively.
Madani (1999) points out that the results will depend critically on the factor intensity of
the two sectors. He concludes that when small underdeveloped countries have a
comparative advantage in labour-intensive industries and protect their capital-intensive
sectors, then an EPZ will reduce the country’s welfare. This is explained by the fact that
the Foreign Direct Investment which flows into the EPZ will mean that capital is imported
from abroad and labour is withdrawn from the sector in which the country has a
comparative advantage (which would be mainly sugar plantations for Mauritius).
Therefore, production of capital-intensive goods will increase, while that of labour-
intensive domestic goods (sugar and agricultural) decreases. This will distort production
away from the factor-based comparative efficiency.
Madani’s assessment is based on the model developed by Hamada (1974) in his analysis
of the economic implications of EPZs. Hamada concludes that an EPZ does not necessarily
improve consumption possibilities in the developing country. Hamada uses the standard
H-O 2x2 model with constant returns to scale:
X1 – Labour-intensive commodity (agriculture)
X2 – Capital-intensive commodity (manufacturing)
with the following major assumptions:
(i) The production function is as follows:
For Industry 1: X1=F1(K1, N1) ... labour-intensive industry
For Industry 2: X2=F2 (K2, N2) ... capital-intensive industry
where K and N are capital and labour inputs. The input coefficients for capital and
labour are akt (r,w) and ant(r,w). For instance, Ki = akt (r,w) Xi and Ni=ant(r.w) Xi for
i=1 and 2, showing that rentals are a function of rent for buildings and wages for
labour.

78
(ii) The country is scarce in capital, and normally exports good 1 (agriculture) and
imports good 2 (manufacturing). Industry 2 is protected in the country by use of
import tariffs.
(iii) International prices of the goods are given and constant at p while the domestic
price of good 2 (which is protected) is q and q>p.
(iv) The supply of capital and labour is assumed to be fixed in the absence of foreign
investors at K and N
so that: ak1X1+ak2X2=K
an1X1+a n2X2=N.
(v) Transport costs are negligible.
(vi) Competition in the domestic market will result in equality of wages and rates of
profit in both sectors:
ak1r+ an1w =1
ak2r+ an2w =q.
To assess the welfare implications of the duty-free zone or EPZ, Hamada uses national
income at international prices as welfare criterion, saying that the improvement of national
income at international prices will imply at the very least an improvement in consumption
possibilities. However, by setting up an EPZ the country will now provide a location where
international prices will prevail.
Given that foreign investment is indispensable for the successful implementation of an
EPZ, Hamada takes the case of foreign investment in the form of capital movements. He
concludes that the introduction of foreign capital does not change the national economic
welfare at all and, worse still, if the economy is protected by an import tariff for the capital-
intensive industry (manufacturing), the introduction of foreign capital will impact
negatively on national income, which will now be calculated at international price p, which
is less than the domestic protected price q. Therefore, even though national income at
domestic prices remains constant, national income at international prices declines as

79
foreign capital increases, leading to a decline in consumption possibilities. Hamada
explains this by saying that foreign capital demands more labour, thus implying labour
becomes scarce in the country, and as the capital-intensive industry (manufacturing)
increases its production, this will lead to a reduction of national income at international
prices.
Hamada therefore concludes that with the establishment of an EPZ through the use of the
H-O model, the potential consumption possibility for a country does not improve with the
introduction of more investment in the EPZ. And on top of that, labour is removed from
the more productive sector (agriculture) to the capital-intensive sector (manufacturing).
Now, if we apply the above reasoning based on the H-O model to Mauritius, the best option
for Mauritius should have been specialisation in the production of those goods that use the
factors of production in which the country has a comparative advantage (i.e. sugarcane
plantations, which make use of the abundant agricultural labourers and perhaps the tourism
sector, for which the country has good potential); while importing those products in which
it did not have a comparative edge – in this case manufactured goods from the USA and
the EU. Therefore, as a matter of fact, Mauritius should have continued with the sugar
sector, in which it had a comparative advantage in terms of labour, rather than introduce
the EPZ which, according to the H-O model, would create a distortion and lead to
inefficiency.
However, in practical terms the H-O model does not seem to fit the Mauritian reality of the
1970s, as foreign investors seemed to show a lot of interest in the new EPZ, where
employment was expanding rapidly but not at the expense of the sugar sector. As a matter
of fact, employment in the sugar sector was not being negatively affected as a result of the
expansion the EPZ sector, principally because the economy was experiencing an acute
unemployment problem and the EPZ helped in absorbing part of the unemployed labour.
If one takes a look at employment in the Mauritian EPZ, according to the CSO figures, that
sector was employing only 908 workers in 1972 but over the years, employment expanded
by more than a proportionate rate to reach 18,173 in 1977. Thus, over a period of only five
years employment had increased twentyfold. In terms of the number of units operating in
the EPZ, if we go along with the figures provided by Boulle (1975), there were only five

80
EPZ companies in 1970, but this figure stood at 66 in 1975, representing an average of
twelve new EPZ companies per year. With regard to the share of EPZ to total exports,
according to Yeung LamKo (1998) the share which was 6% in 1973 increased fourfold to
24% in 1978. Furthermore, in terms of net foreign exchange earnings, according to Boulle
(1975) the net earnings in the EPZ which stood at Rs 11.9 million in 1973 nearly tripled to
reach Rs 35 million in 1974. This figure, however, decreased in 1975 to reach Rs 6.3
million, mainly as a result of the oil crisis which hit the developed world badly and brought
about a recession which, inter alia, raised transport costs drastically (English, 1997).
Contrary to the Hamada (1974) model, the growth in the EPZ did not cause any distortion
in the agricultural sector, in particular the sugar sector, which continued to experience
sustained growth throughout the period, with a GDP at current prices of Rs 741 million in
1976, Rs 701 million in 1977 and Rs 729 million in 1978. The sector continued to employ
more than 50,000 workers up until 1978, showing that the increase in employment in the
manufacturing sector was not occurring to the detriment of the sugar sector. In reality,
employment in the sugar sector would experience a decline over the years, more as a
consequence of the world recession and the difficulty of the sugar sector worldwide, but it
was still employing more than 46,000 workers in 1982, which meant it was still ahead of
the emerging EPZ sector in the absolute number of workers employed.
As a matter of fact, the increase in employment in EPZ did not lead to an automatic
decrease in employment in the sugar sector, principally because the EPZ was targeting
more school leavers, in particular the first batch of girls who had benefited from free
education at secondary level since 1976. It is worth recalling here that primary education
in Mauritius has been free since 1944, but in 1976 the government also made education
free at secondary levels. It became compulsory for educational establishments to provide
free education up to secondary level. Although this was regarded more as a political move
by the incumbent government to win the 1976 elections, the consequence of this decision
was really beneficial since enrolment for secondary education increased from 66,920 in
1976 to 78,038 in 1977, representing an increase of 16.6 % in enrolment. This also
represented an increase of 5 points in the enrolment ratio from 38 to 43 (CSO, Mauritius).

81
Although free education benefited the 12- to 19-year age group as a whole, the effect was
more pronounced for female students. Enrolment of girls in secondary schools increased
from 28,030 in 1975 to reach 39,164 in 1980, representing an increase of 39.8% and a more
than 10-point increase in the gross enrolment ratio from 32 to 43. The difference in the
gross enrolment ratio between males and females, which had been in favour of males by 8
points in 1975, fell to only 3 points in 1980. Since 1990, more girls than boys have been
enrolled in secondary education.
The increase in the number of children enrolled for secondary education meant that many
people were able to broaden their horizons and no longer felt confined to the sugar
plantations. Semi-skilled workers who had some secondary schooling were now interested
in working in more skilled jobs and looked towards the EPZ for those opportunities. In
addition, conservative Mauritian attitudes which saw women’s work as restricted to
household activities began to change. People began to see that women could also contribute
to the economic development of the country and bring additional revenue to the family
budget.
It is important to highlight the positive linkage between education/skills development and
the trade theories. This type of capacity building which comes with free education is a
critical factor to explain the success of the EPZ and any subsequent policies adopted by the
government.
In line with the above explanation, it is noted from Table 3.5 that the number of women
employed in the manufacturing sector, of which EPZ accounts for a large proportion,
surpassed men at the very start of the EPZ. Despite the fact that women were then paid
lower wages than men in the EPZ (approximately 30% lower, according to the Ministry of
Industry (1990), women undoubtedly benefited from these developments, as their ability
to earn a wage provided them with a sense of empowerment and independence. Chernoff
(2002:14) confirms the role of women in the growth of EPZ when he concludes that ‘the
immediate source of the EPZ boom starting in 1983 was a shift of female labour from
unemployment to the EPZ sector. This is an interesting example of growth from pure

82
structural change. This was a one-time growth engine made possible by a reserve army of
unemployed workers.’
Table 3.5 Employment in EPZ
Year Male Female Total
1978 14274 17680 31954
1979 15363 19778 35141
1980 15365 20807 36172
1981 16013 20876 36889
1982 15884 22445 38329
Source: CSO Mauritius
As far as the sugar sector was concerned, the number of female workers and employment
in general, though falling (as a result of layoffs), had remained rather high from 1978 to
1982, as shown in Table 3.6, confirming that labour had not shifted massively from the
sugar sector to EPZ, but rather that school leavers were now joining the new sector.
Table 3.6 Employment in sugar sector
Year Male Female Total
GDP at current
prices (Rs m) for
sugar
Contribution of sugar
as a % of GDP
1978 37,470 13,862 51,332 729 13.3
1979 35,271 13,443 48,714 953 14.6
1980 34,957 12,536 47,493 598 8.1
1981 35,046 12,225 47,271 899 10.2
1982 34,491 11,966 46,457 1140 11.4
Source: CSO Mauritius
As regards real economic growth, this index also remained positive throughout the period,
which shows that there was no drastic fall in national income at international prices, as
asserted by the Hamada model. The real GDP growth was 7% in 1977, 4% in 1978 and
3.6% in 1979. The variations in the real GDP growth can be attributed more to the
international oil crisis than to anything else.

83
Given that the H-O model is unable to accommodate these complexities and that, contrary
to the predictions of the model, Mauritius adopted the EPZ successfully, alternative trade
theories need to be tested to see whether they are better able to shed light on the EPZ story
in Mauritius. Accordingly, the next section analyses ‘new trade theories’, especially the
one produced by Krugman and Venables (1995). This new trade theory assumes increasing
returns to scale within a monopolistic framework, with comparative advantages based on
product differentiation rather than on factor endowments. Krugman and Venables (1995)
also insert changing transport costs and wage costs into the model.
3.3.2 The Krugman and Venables model
The new trade theory by Krugman and Venables was developed to explain the aspects of
the real world that the H-O model failed to consider in explaining trade between nations.
The World Trade Report (2008) asserts that in the 1980s, data set on trade at firm level
became available and showed considerable differences among firms. This produced
alternative trade theories which would attempt to produce new theoretical explanations to
accommodate the shortcomings of the H-O model, with its problematic assumptions such
as no transport costs, homogeneous products, constant returns to scale and perfect
competition.
The new trade theory assumed imperfect competition, increasing returns to scale and intra-
industry trade, and rather than focusing on factor endowments only to explain trade,
Krugman focuses on geographical concentration of varieties, i.e. different countries
producing different varieties and then trading them. ‘In the new trade theory, the basic
point was that increasing returns are a motive for specialisation and trade, over and above
conventional comparative advantage, and can indeed cause trade even when comparative
advantage is of negligible importance ... among … countries with similar resources and
technology’ (Krugman, 1995).
For this to happen, Krugman (1998) explains that market size effects are determinant to
the geographic concentration effect, especially with respect to the linkages that the market
size creates. For instance, a large local market creates both backward and forward linkages.
Backward linkages are created in the sense that locations with good access to large markets
are preferred choices for production of goods subject to economies of scale (for example,

84
the preferred access of Mauritius to the EU and US markets during the 1980s and 1990s
made the Mauritius EPZ an attractive destination for investors from the Far East). Forward
linkages occur when a large local market supports the local production of intermediate
goods, thereby lowering costs for downstream producers.
Given that geography is the central component of the theory, Krugman believes that models
dealing with distance should come into play. The linkage effects mediated by transport
costs become an integral component of Krugman’s geographic concentration model.
Contrary to previous trade theory models, Krugman includes transport costs and uses the
‘iceberg’ transportation costs proposed by Samuelson, which assumed that ‘a fraction of
any good shipped simply “melts away” in transit so that transport costs are in effect
incurred in the good shipped’ (Krugman, 1998). The ‘melting’ is assumed to take place at
a constant rate per distance, resulting in the assumption that cost of transportation is always
a constant factor of f.o.b (free on board). The inclusion of transport costs in international
trade theories contrasts with the H-O model, which assumed that transportation was
costless.
The Krugman model also stresses the fact that increasing returns create economies of scale,
and the consequences of the scale economies and the assumption of labour immobility will
lead to goods being produced in specific locations. And if cost of production is assumed to
be the same in all countries, then the deciding factor in location is transport costs. With
increasing returns, we also have to relax the assumption of common wages, meaning that
wage differentials will also be a determining factor for location.
The Krugman and Venables (1995) model most clearly incorporates the effects of transport
costs and wages on the gains from trade. .
The model assumes two regions, North and South, producing two kinds of goods; (i)
agricultural, with constant returns to scale, and (ii) manufacturing, with increasing returns
to scale. According to the model, ‘at high transport costs all countries have some
manufacturing but when transport costs fall below a critical value (t), a core-periphery
North-South region spontaneously forms, and nations that find themselves in the periphery
suffer a decline in real incomes. At still lower transport costs, there is convergence of real
incomes in which peripheral nations gain and core nations may lose’ (Krugman &

85
Venables, 1995:857). This is principally due to the fact that the peripheral region has a
competitive advantage in the form of lower wages. In the beginning, this advantage is more
than offset by the North’s superior access to markets through linkages. However, as
transport costs decline, the importance of the linkages also declines, so that at some critical
point the relevant industry finds it profitable to move to lower wage locations (Krugman,
1998). It may be noted, however, that at still lower transport costs the wage differential
between North and South tend to disappear.
The model makes the following assertions:
(i) At high transport costs there is a unique equilibrium in which manufacturing is
equally divided between countries.
(ii) With some fall in transport costs an intermediate level is created, but the
linkages are not powerful enough to destabilise equilibrium. But if the North
has all its labour employed in manufacturing, then linkages are sufficient to
ensure that there is an asymmetrical equilibrium.
(iii) When transport costs fall below a critical value, there are now two unstable
points of equilibrium. At this point, the North specialises in manufacturing and
has wages above the marginal product of labour in agriculture. All agricultural
output is produced in the South, which may also produce manufacturing. There
are in this case three possibilities, one of them being that agriculture operates
in the North and manufacturing is concentrated in the South. The other two are
either that all manufacturing is in the North and agriculture in the South, or that
agriculture and manufacturing are shared between North and South.
The critical value t is defined as:
tσ-1
= 1 + µ σ(1 + µ) – 1
1 - µ σ(1 - µ) – 1
where: µ= the share of manufactured intermediate goods
σ = elasticity of demand for a single variety

86
From the above equation it is noted that asymmetry will arise only if there is a significant
role for intermediate goods (i.e. a value for µ greater than zero), which was the case for
manufactured goods produced by many EPZs, including that in Mauritius. If µ=0 then t=1
and any t which is greater than 1 would imply symmetry between economies. At the other
extreme, if σ(1 - µ) < 1, meaning either a high µ or a small σ, the expression becomes
negative. According to Krugman and Venables (1995), the core periphery pattern will then
emerge, no matter how high the transport cost. Finally, for values of µ in between, i.e. 0<
µ < (σ-1)/ σ, the critical t value will be greater than 1. The critical t value will thus be higher
the lower the elasticity of demand (σ) for the product and the higher the share of
intermediate goods (µ). That is, the higher the firm’s price cost mark-ups and the greater
the share of intermediates in production, the more powerful would be the forces of
geographic concentration.
3.4 Empirical assessment
(A) Transport cost and labour cost
Now, how does this apply to Mauritius? As noted from the previous section, initially when
transport costs are high, each region will be self-sufficient and produce both manufacturing
and agricultural goods. At the start of the EPZ sector in Mauritius, notwithstanding the fact
that the first few years would be difficult given that the industry was still in its infancy, it
is noted from the number of export enterprises in Figure 3.6 that the sector started
performing rather well around 1973. After only three years of operation, the number of
export-oriented enterprises was already at 32, with an employment figure of 5,800 workers.
This constituted an increase in employment of 124% in one year. The employment figure
went up to 9,000 in 1974, which still constitutes a significant increase of 55.1%, although
a diminishing trend started to become apparent. This downward trend was confirmed
during the subsequent years, apart from the exceptional rise in 1976 (66.9%). This was
exceptional as it was an election year and the government put pressure on EOEs to employ
the maximum number of people to mop up unemployed labour temporarily. A drastic
decrease in the rate of increase in employment was noted for 1975, 1977 and 1978. The
rate of increase in employment fell to 14.4% in 1975, to only 1.7% in 1977 and attained a

87
very modest recovery of 4.5% in 1978.The increase was 8.2% in 1983 and reached 43.7%
in 1985.
0
100
200
300
400
500
600
1973 1974 1975 1976 1977 1978 1979 1980 1981 1982 1983 1984 1985
No. of enterprises employ. in (00) % change in employ.
Exports (Rs 10m) Imports (Rs 10m)
Figure 3.6 Export-oriented enterprises (1973-1979)
Source: Adapted from CSO figures
Although other factors such as adverse weather conditions could explain some of these low
levels of improvement, they were more a consequence of the world recession caused by
the oil crisis, which lead to an increase in transport costs. Between the years 1974 and 1981,
the price of gas oil increased six-fold from Rs3.57/gallon in 1974 to Rs20.50/gallon in 1981
(CSO Mauritius). This surely had a multiplier effect on freight and sea transport costs.
According to Boulle (1978), sea freight charges increased by 300% on average for the EPZ
between 1974 and 1977. Air freight charges also increased by approximately 20%, but not
many of the raw materials and finished products could be transported by air freight.
Transport problems in general were a serious issue because the customers of EPZ products
were located very far from Mauritius. Boulle (1978:18) uses the example of the wool
knitting sector to demonstrate this. He argues that ‘our geographical remoteness from
markets introduces an important, costly and risky lag between the time a decision is made
to produce for a particular country and the time that order is ready for shipment’. Boulle
(1978) explains that ‘raw materials typically have to be ordered in June/July for the selling

88
season of September/December the following year, since shipment needs to be effected by
April and raw materials must be received prior to production in January/April’.
Therefore, coming back to the Krugman and Venables model, the trade costs associated
with sea transport were at that time very high in this ‘peripheral’ region, where
manufacturing was expensive. As a result, investors in the northern countries were
probably not interested in Mauritius during the late 1970s, as transport costs were relatively
high.
It must be remembered that the Krugman and Venables model is based on the two
determining factors in deciding whether manufacturing will succeed in a particular region
or country – namely, transport costs and wage costs. We know that during the 1970s
transport costs remained high in Mauritius and it follows that, if it were not for low wage
costs, the EPZ in Mauritius would not have survived.
Thus, when explaining the take-off of the EPZ in the 1980s from the perspective of this
model, one needs to examine the evolution of the two determining factors – namely,
transport costs and wages.
(i) Air and sea transport costs
Air transport during the 1980s
First of all, it is noted that during the 1980s, as communication became more open
worldwide, the number of direct flights from Mauritius to Europe grew steadily. Air
transport costs fell and the following major factors could explain that fall:
(a) The improvement of relations between the USA and the former USSR led to a
more secure world and an embrace of liberalisation.
(b) Mauritius could afford to accommodate more aircraft after the renovation of its
airport during the mid-1980s. Air Mauritius, which is the national carrier,
started its operations in 1972. However, it was only in 1983-1984 that Air
Mauritius began operating non-stop flights to major European cities, including
London, Paris and Rome. During the period 1986-1991, Air Mauritius made
89
investments worth Rs 3.2 billion in aircraft, transport equipment and
infrastructure (Government Information Service, 2003). Its share of air traffic
rose from 28% in 1981 to 64.3% in 1991. In 1991 Air Mauritius was operating
weekly: ten flights to Europe, four to the East and Far East, and five to Africa
and Madagascar. There was a twentyfold increase in cargo transported by Air
Mauritius between 1981and 1991.
(c) As pointed out by Lim Fat (2010:175), while recognising that high air freight
costs were a major constraint, when the first EPZ exporters to Europe started
negotiations with airlines, it was found that much of the cargo carried by
numerous airplanes from France to Reunion Island (a French dependency about
200 kms from Mauritius) was food items that could not be transported by sea,
which would impact on the freshness of the items. He added, ‘consequently, the
garments [of the Mauritian EPZ] enjoyed much reduced air freight on those
planes to Europe that would otherwise have returned to France almost empty’.
But he was also quick to recognise that sea freight costs were more important
than air freight, as the bulk of EPZ exports were carried out by sea. We therefore
need to verify the evolution of sea transport before drawing the conclusion that
transport costs had fallen and were causal in the EPZ take-off. The next section
deals with this issue.
Sea transport during the 1980s
The Port Louis harbour was significantly upgraded between 1980 and 1990. At the time
of independence the harbour was a port where most cargoes were intercepted in
midstream and towed to the port for unloading in lighters, a type of flat-bottomed boat
used to transfer goods to the lighterage (the use of lighters in loading or unloading ships
and in transporting goods for short distances) wharves. Cargo-handling operations were
therefore extremely slow, with long delays, high turnaround times and heavy port
detention charges. In 1976, the government devised a plan to improve port facilities.
The Mauritius Marine Authority was created, along with the construction of a
workshop for heavy equipment, a fire station, a port administration building and the
acquisition of a fleet of cargo and container handling equipment. By 1983 the
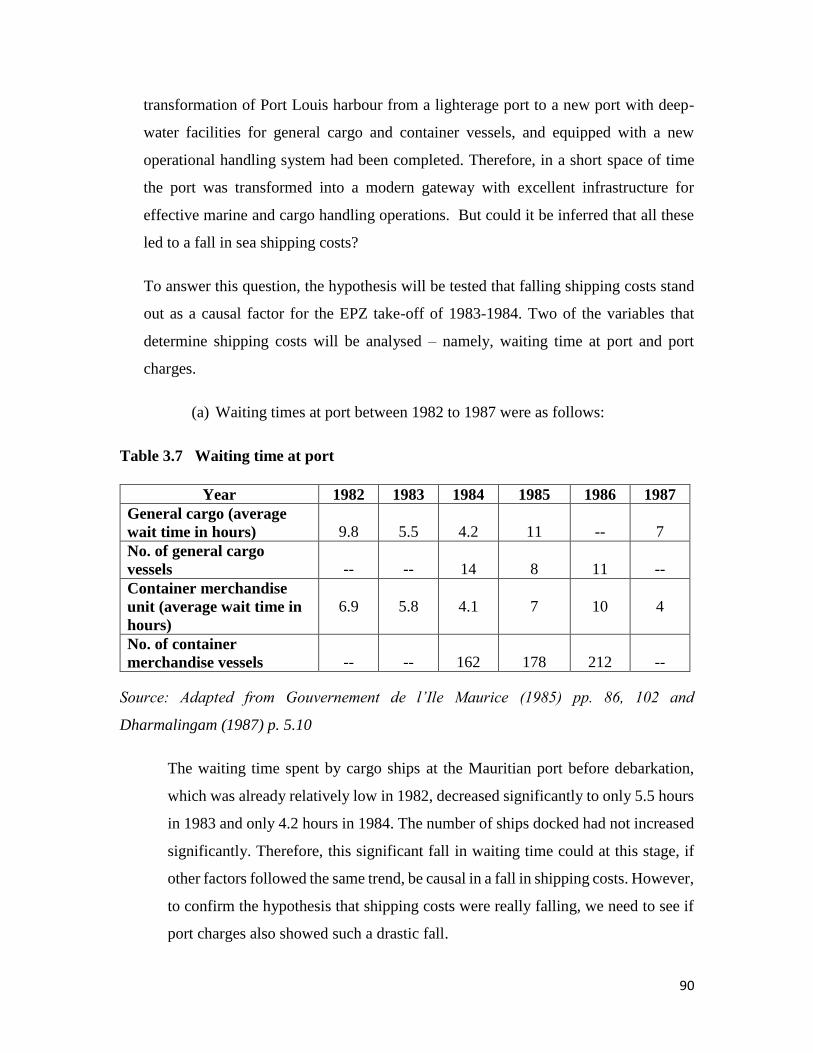
90
transformation of Port Louis harbour from a lighterage port to a new port with deep-
water facilities for general cargo and container vessels, and equipped with a new
operational handling system had been completed. Therefore, in a short space of time
the port was transformed into a modern gateway with excellent infrastructure for
effective marine and cargo handling operations. But could it be inferred that all these
led to a fall in sea shipping costs?
To answer this question, the hypothesis will be tested that falling shipping costs stand
out as a causal factor for the EPZ take-off of 1983-1984. Two of the variables that
determine shipping costs will be analysed – namely, waiting time at port and port
charges.
(a) Waiting times at port between 1982 to 1987 were as follows:
Table 3.7 Waiting time at port
Year 1982 1983 1984 1985 1986 1987
General cargo (average
wait time in hours)
9.8
5.5
4.2
11
--
7
No. of general cargo
vessels
--
--
14
8
11
--
Container merchandise
unit (average wait time in
hours)
6.9
5.8
4.1
7
10
4
No. of container
merchandise vessels
--
--
162
178
212
--
Source: Adapted from Gouvernement de l’Ile Maurice (1985) pp. 86, 102 and
Dharmalingam (1987) p. 5.10
The waiting time spent by cargo ships at the Mauritian port before debarkation,
which was already relatively low in 1982, decreased significantly to only 5.5 hours
in 1983 and only 4.2 hours in 1984. The number of ships docked had not increased
significantly. Therefore, this significant fall in waiting time could at this stage, if
other factors followed the same trend, be causal in a fall in shipping costs. However,
to confirm the hypothesis that shipping costs were really falling, we need to see if
port charges also showed such a drastic fall.

91
(b) Port charges
Gouvernement de l’Ile Maurice (1985) gives the following comparative table for
average port charges for container ships in Mauritius compared to other ports in the
Indian Ocean region for the period 1983-1984. According to a representative from
the Mauritius Port Authority, these charges are reviewed only once every five to
ten years, meaning that the charges remained the same at least from 1980 to 1988-
1990.
Table 3.8 Port charges
Ports Port charges for container ships in Mauritian
rupees
Port Louis (Mauritius) 37,000
Pointe des Galets (Reunion) 52,000
Tamatave (Madagascar) 27,000
Mahe (Seychelles) 40,000
Djibouti 8,000
Source: Adapted from Gouvernement de l’Ile Maurice (1985) pp. 86, 102 and
Dharmalingam (1987) p. 5.10
From Table 3.8 it can be seen that port charges at Port Louis were not the lowest in
the region during 1984-1988. Mauritius was cheaper than Reunion and Seychelles,
but more expensive than Madagascar and Djibouti. Therefore, the port charges
applied by Mauritius were in line with the rates prevailing in the region, and this
suggests that port charges were not low enough to provide Mauritius with a
comparative advantage that would make it an attractive location for EPZ investors.
However, it should also be noted that Gouvernement de l’Ile Maurice (1985)
confirms that Port Louis occupies a good geographical location and is well placed
in relation to European and Far East routes, as well as to regional and extra-regional
routes. The report mentions that the movement of ships reveals a preference for
Mauritius as first stop, whatever the original port from which the ships came. For
instance, the ‘long courier’ vessels coming from Europe and the Far East would
stop in Mauritius first, then in Reunion and Madagascar. Similarly, ships coming
92
from Durban would use the Mauritius-Reunion-Madagascar axis. As for ships on
the regional route from Seychelles and Comoros, their preference would be to stop
in Mauritius or Reunion first before moving to Madagascar. Therefore, Mauritius
seems to be the port of preference for a first stop for regional and long couriers.
Thus, although the Mauritius port is not the cheapest in the region in terms of port
charges, the fact that it is the first port of preference in the region for incoming ships
means that the cost of imports from Mauritius is in relative terms lower than that of
other countries in the region.
However, in the light of the limited evidence and given that details on issues such
as the number of ships and the number of containers that docked in Mauritius are
not available for that time period, it is not possible to infer conclusively that
shipping costs were causal in the EPZ take-off. But one could speculate that the
cost of land transport to carry merchandise from one place to another on the island
was quite low, given the country’s small size – compared to countries such as
Ghana, Egypt or even Senegal. There was also the fact that Mauritius was the first
port of preference for ships coming from any part of the world, which gives the
Mauritius port a definite comparative advantage over other ports in the region. But
obviously this factor did not change significantly in 1983-1984 when the EPZ took
off. Let us therefore see if the wage costs of Mauritius during that period give us a
better result.
(ii) Wage costs during the 1980s
The only way to see whether the low wages factor was causal in the EPZ success in
Mauritius is to compare it with other African and emerging countries that had operational
EPZs in the 1980s. From Kreye (1987:8) it can be noted that in 1986 only eight African
countries had EPZ firms in operation – namely, Egypt, Ghana, Liberia, Mauritius,
Morocco, Senegal, Togo and Tunisia. Of these, only Egypt and Mauritius had already
created an EPZ and had more than one EPZ firm operating during the mid-1970s. Asian
countries such as Bangladesh, Hong Kong, the Philippines, Malaysia, Sri Lanka and
Singapore, by contrast, already had fully operational EPZs during the 1970s.
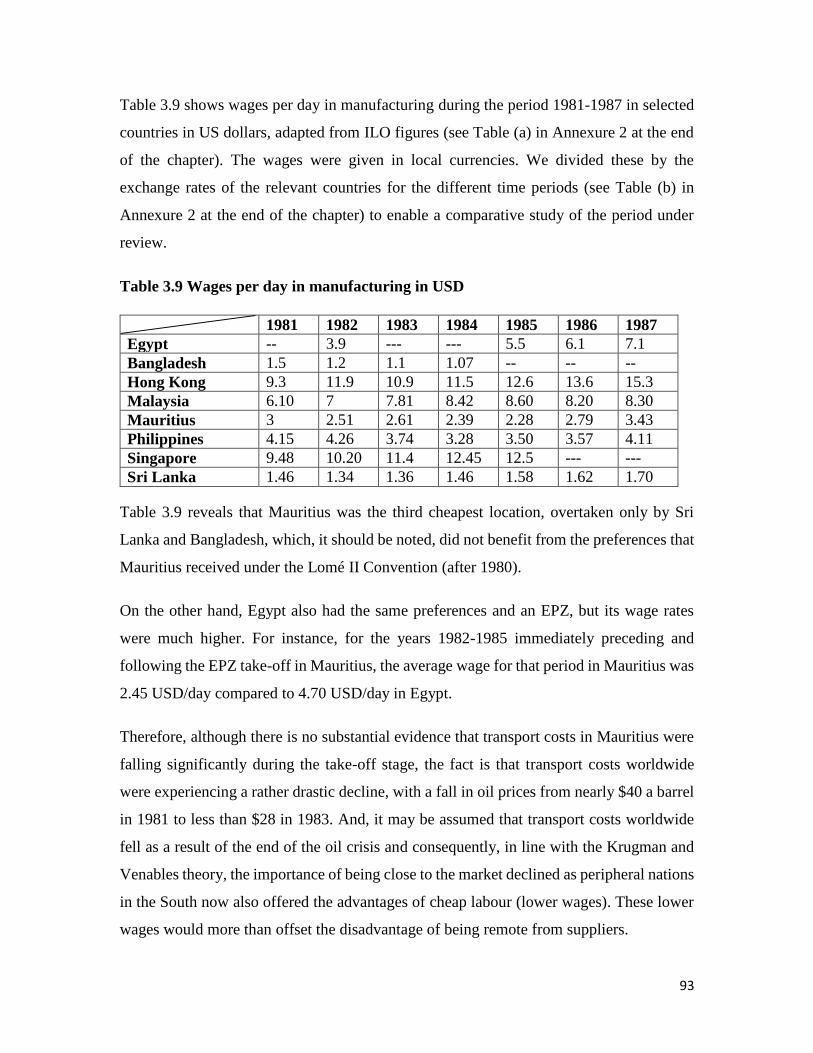
93
Table 3.9 shows wages per day in manufacturing during the period 1981-1987 in selected
countries in US dollars, adapted from ILO figures (see Table (a) in Annexure 2 at the end
of the chapter). The wages were given in local currencies. We divided these by the
exchange rates of the relevant countries for the different time periods (see Table (b) in
Annexure 2 at the end of the chapter) to enable a comparative study of the period under
review.
Table 3.9 Wages per day in manufacturing in USD
1981 1982 1983 1984 1985 1986 1987
Egypt -- 3.9 --- --- 5.5 6.1 7.1
Bangladesh 1.5 1.2 1.1 1.07 -- -- --
Hong Kong 9.3 11.9 10.9 11.5 12.6 13.6 15.3
Malaysia 6.10 7 7.81 8.42 8.60 8.20 8.30
Mauritius 3 2.51 2.61 2.39 2.28 2.79 3.43
Philippines 4.15 4.26 3.74 3.28 3.50 3.57 4.11
Singapore 9.48 10.20 11.4 12.45 12.5 --- ---
Sri Lanka 1.46 1.34 1.36 1.46 1.58 1.62 1.70
Table 3.9 reveals that Mauritius was the third cheapest location, overtaken only by Sri
Lanka and Bangladesh, which, it should be noted, did not benefit from the preferences that
Mauritius received under the Lomé II Convention (after 1980).
On the other hand, Egypt also had the same preferences and an EPZ, but its wage rates
were much higher. For instance, for the years 1982-1985 immediately preceding and
following the EPZ take-off in Mauritius, the average wage for that period in Mauritius was
2.45 USD/day compared to 4.70 USD/day in Egypt.
Therefore, although there is no substantial evidence that transport costs in Mauritius were
falling significantly during the take-off stage, the fact is that transport costs worldwide
were experiencing a rather drastic decline, with a fall in oil prices from nearly $40 a barrel
in 1981 to less than $28 in 1983. And, it may be assumed that transport costs worldwide
fell as a result of the end of the oil crisis and consequently, in line with the Krugman and
Venables theory, the importance of being close to the market declined as peripheral nations
in the South now also offered the advantages of cheap labour (lower wages). These lower
wages would more than offset the disadvantage of being remote from suppliers.
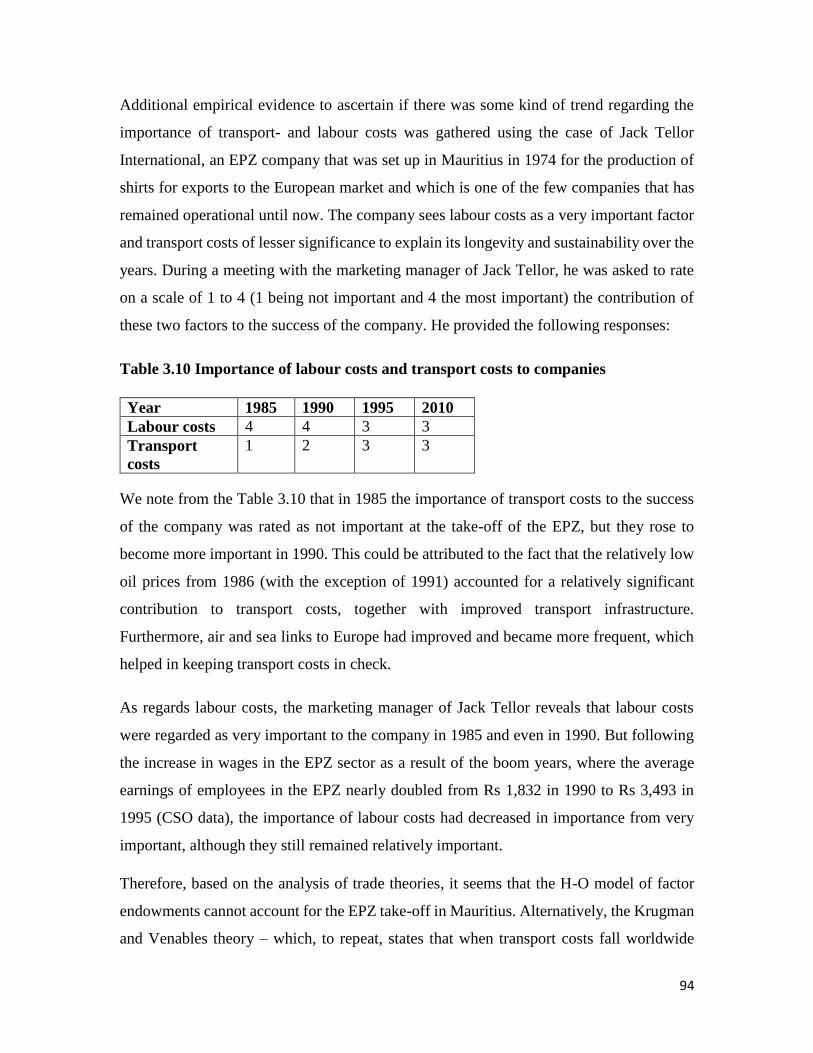
94
Additional empirical evidence to ascertain if there was some kind of trend regarding the
importance of transport- and labour costs was gathered using the case of Jack Tellor
International, an EPZ company that was set up in Mauritius in 1974 for the production of
shirts for exports to the European market and which is one of the few companies that has
remained operational until now. The company sees labour costs as a very important factor
and transport costs of lesser significance to explain its longevity and sustainability over the
years. During a meeting with the marketing manager of Jack Tellor, he was asked to rate
on a scale of 1 to 4 (1 being not important and 4 the most important) the contribution of
these two factors to the success of the company. He provided the following responses:
Table 3.10 Importance of labour costs and transport costs to companies
Year 1985 1990 1995 2010
Labour costs 4 4 3 3
Transport
costs
1 2 3 3
We note from the Table 3.10 that in 1985 the importance of transport costs to the success
of the company was rated as not important at the take-off of the EPZ, but they rose to
become more important in 1990. This could be attributed to the fact that the relatively low
oil prices from 1986 (with the exception of 1991) accounted for a relatively significant
contribution to transport costs, together with improved transport infrastructure.
Furthermore, air and sea links to Europe had improved and became more frequent, which
helped in keeping transport costs in check.
As regards labour costs, the marketing manager of Jack Tellor reveals that labour costs
were regarded as very important to the company in 1985 and even in 1990. But following
the increase in wages in the EPZ sector as a result of the boom years, where the average
earnings of employees in the EPZ nearly doubled from Rs 1,832 in 1990 to Rs 3,493 in
1995 (CSO data), the importance of labour costs had decreased in importance from very
important, although they still remained relatively important.
Therefore, based on the analysis of trade theories, it seems that the H-O model of factor
endowments cannot account for the EPZ take-off in Mauritius. Alternatively, the Krugman
and Venables theory – which, to repeat, states that when transport costs fall worldwide
95
(which was the case with the fall in oil prices during the 1980s), the importance of being
close to the market declines and the low wages advantages offered by peripheral countries
will more than offset the disadvantage of being remote from suppliers – reinforces the
importance of low wages to explain the exceptional EPZ success in Mauritius. The next
section will examine the other hypothesis, which suggests that it was the Lomé trade
preferences that caused the EPZ take-off in Mauritius.
(B) The preferences framework and its impact on Mauritius’s success
As mentioned in the section on wage costs, the fact remains that as we entered the 1980s
Mauritius was one of the few countries in the African region with an EPZ associated with
the EEC. The strategic choice of the government to move readily towards an aggressive
EPZ strategy proved to be very beneficial, because Mauritius was opportunistic enough to
choose the right path at the right time, while other African countries were still struggling
to maintain the ISI and would move towards creating EPZs only in the 1990s, e.g. 1990 in
Kenya, 1995 in Togo, 1996 in Namibia (Madani, 1999). The very quick move of Mauritius
towards establishing its EPZ gave it a lead of more than 20 years over African countries,
with the exceptions of Senegal, Egypt and Liberia, which had established weak EPZs in
the mid-1970s.
It seems likely that Mauritius’s preferential access to EEC markets through the Lomé II
Convention and the US market through the Multi-Fibre Agreement (MFA) was an
important factor in attracting investments in the Mauritian textile sectors from South-East
Asian investors. These foreign investors were motivated directly by the duty-free and
quota-free access that Mauritius had with EEC markets as from 1981-1982, but also
indirectly by the need to avoid the quotas on textiles and clothing that were constraining
exports from Hong Kong and other regions to the USA through the Multi-Fibre Agreement
(MFA). The next section will provide a more detailed explanation of the Lomé Convention
and the MFA and it will be established whether one or both of these preferences were
causal in the EPZ take-off of 1983-1984, or whether these preferences only facilitated the
optimum conditions for another factor to emerge as the causal factor for the EPZ take-off
of 1983-1984.
96
The MFA
The MFA was a set of formal quota agreements and restrictions, governing textiles and the
clothing trade between developing countries and the developed world. MFA came into
force to allocate export quotas to the low-cost developing countries, limiting the amount of
imports to developed countries whose domestic industries were facing serious challenges
from rapidly increasing imports. The MFA was subsequently extended from December
1977 onwards until its gradual phasing out in January of 2005.
The MFA was therefore a form of protectionism for developed countries to secure their
own textile industries against the threat posed by low-cost competition from less developed
countries. However, by giving quotas to individual nations, it also gave them a guaranteed
share of the rich countries market (BBC News, 2004). Subramanian and Roy (2001) have
confirmed that ‘one of the effects of these quotas was to redistribute production between
exporting countries – away from low cost towards high cost sources of production. Thus
high-cost producing countries gained an advantage relative to low-cost producers,
resulting in higher production that would otherwise not have taken place’. Mauritius
benefited as it found itself qualifying as one of the lowest-cost textile-producing countries
in Africa, while not being as competitive as compared to Asian countries such as Sri Lanka
and Bangladesh. Annexure 1 provides a detailed explanation of how the MFA worked.
Basically, when the developed country imposes a quota restriction on the low-cost
producing developing countries, it is directly decreasing the amount that it could supply
but also indirectly increasing supply from the higher-cost producer at an artificially higher
price.
Now, to see how this took place in reality. Subramanian and Roy (2001) explain this very
clearly. The MFA limited imports of textiles and clothing to the USA and EU by awarding
country-specific quotas. As a result, imports were redistributed among the countries that
produced these goods, to Mauritius's benefit. Here is how:
Under this agreement many very low-cost textile-producing countries (Sri Lanka and
Bangladesh) were given quota limits on the amount they could import to the USA and EEC.
The Ministry of Industry (1990) explained that the US government imposed quota

97
restrictions on the importation of given categories of clothing once the imports of that
product into the USA attained 1% in volume terms of US production in that category.
Therefore, countries like China, India, Sri Lanka, Bangladesh and Pakistan were directly
affected by this quota system, as the amount they could export to the USA and EU was
severely limited. For example, with the dismantling of the MFA in 2004 the level of
Chinese clothing exports rose from 11 million units in 1995 to 213 million units in 2004.
However, smaller countries seeking to expand their access to US markets benefited
considerably from the MFA, as they were guaranteed access to the developed countries’
markets (the USA in particular) in ways that would not have been possible if the quota
system had not been in place. They were protected from competing directly with Asian
low-cost producers. It was within this framework that ‘when Hong Kong producers were
looking for countries that had not yet fulfilled its quota to the US market that Mauritius
became an attractive alternative’ (Ron 1991).
Subramanian and Roy (2001) show that the total rents that Mauritius received from Apparel
Exports to the USA were 3.71 million USD in 1984 and reached a high of 68.96 million
USD in 1999.
The Lomé Convention
The Lomé Convention of 1975 was a ‘treaty envisaging wide-ranging economic
cooperation between the nine countries of the EEC (the original members of the EEC were
as follows: Belgium, France, West Germany, Italy, Luxembourg and the Netherlands.
Denmark, Ireland and the United Kingdom joined later in 1973) and 46 Third World
countries from Africa, the Caribbean and the Pacific (ACP)’ (Garrity, 1977).
As a member of the ACP group of countries, Mauritius received, under the Lomé II
Convention, the right to export textiles and clothing duty-free and quota-free to the EEC
(now the European Union). The Convention originally covered only the sugar sector, but
in 1981, under the Lomé II Convention, textiles and clothing were also included. This led
especially Asian investors (who had to pay duties to enter the European market) to seek
duty-free access to the European market via Mauritius. A very good example of this is

98
Esquel Mauritius Ltd, a company set up in Mauritius in 1972 to manufacture cotton woven
shirts. The company is 100% foreign-owned (i.e. the owners are based in Hong Kong).
During interviews conducted with representatives of the company, it became clear that the
very existence of the company in Mauritius at that time was principally due to the
preferences and duty-free access of Mauritius to the EEC market and the fact that the
company did not have to satisfy any rules of origin, given that the last substantial
transformation took place in Mauritius.
However, when considering the importance of these conventions as a cause of the EPZ’s
take-off, it is important to remember that all African countries qualified for the same access
and preferences that Mauritius obtained. Mauritius was one of only a few African countries
(the others being Senegal, Egypt and Liberia) that decided to create an EPZ and obtain the
full benefits of the preferences. Other African nations would try the EPZ experience only
much later in the late 1980s and 1990s. While Mauritius was experiencing the take-off of
its EPZ, most African countries were still struggling with nationalisation policies and
placed a heavy emphasis on import substitution. Therefore, it can be concluded that the
conventions were important but not sufficient to explain the success of the EPZ in
Mauritius.
3.5 Conclusion
At the time of the economic take-off in Mauritius in 1983-1984, the EPZ sector was the
driving force behind the country’s exceptional economic performance. The neoclassical
and new trade theories were reviewed to determine which one of them was more
appropriate to explain the causal factors behind the success of the EPZ in Mauritius.
The H-O model stipulates that a country will produce and export only those goods which
use intensively the factor of production with which it is relatively well-endowed. Going
along with this model, Mauritius would to this day have only two sectors – namely,
sugarcane plantation and tourism. Throughout this chapter, the H-O model has been
systematically questioned, which assumes that countries cannot succeed in the EPZ if the
necessary factor endowments are lacking. Another controversial assumption of the H-O
model is that it assumes common wages across countries.

99
The new trade theory proposed by Krugman and Venables, with its emphasis on transport
and wage costs, seems to fit the Mauritius EPZ story better. Although, with the limited data
on transport costs, conclusive evidence that falling transport costs contributed to the EPZ
success is still lacking. However, stronger evidence of the role played by low wages in the
EPZ take-off has been provided.
As regards preferences, Mauritius and all African countries qualified for the Lomé
Convention. However, in contrast to most other African economies, Mauritius quickly
created the EPZ, as explained through the political economic factors identified in Chapter
2, and was successful in implementing at the right time. Many African countries later tried
the EPZ experience, but were not as successful as Mauritius. Evidence of the failure of
other African countries to implement the EPZ as early and as successfully as Mauritius
managed to do is provided by Madani (1999), who stresses that it was only after having
seen the success of Mauritius, the Dominican Republic and some other zones around the
world that many sub-Saharan African countries established an EPZ. He provides an
analysis of some sub-Saharan countries that have adopted the EPZ strategy – namely, Togo
(1989), Namibia (1996), Kenya (1990) and Cameroon (1990). This confirms the fact that
other African nations adopted the EPZ much later than Mauritius, but none of them
experienced the unprecedented take-off, as was the case for Mauritius. The main reasons
were either political unrest or increased competition from neighbouring countries as the
preferences faded away during the 1990s.
The EPZ story in Mauritius can be summarised as follows: its creation was linked to the
interaction of the political economy factors identified in Chapter 2, which were unique to
Mauritius, and the successful implementation of the EPZ was the result of the causal factor
that the new trade theory of Krugman and Venables provides for – mostly labour costs.
This cost factor, together with the timely application of the preferential access of Mauritius
to the EU and US markets through the Lomé Convention, drove the take-off of the EPZ in
Mauritius.
The next chapter will use cross-country data to examine the association between the EPZ
and economic performance, and will provide an empirical analysis of the causes of the EPZ
success. It will also enlighten the reader on whether the EPZ on its own is a guarantee of

100
success, or alternatively, whether other factors, e.g. the causal or control factors identified
in this chapter, have to be present for the EPZ to succeed. If that is the case, this would
mean that it was the more successful countries that were the ones to actually choose to
implement an EPZ. With this empirical study completed, we would be in a better position
to show conclusively whether the EPZ led to an economic take-off, or whether the EPZ
was merely an outcome of Mauritius’s broader economic development.
ANNEXURE 1
MFA Theory (from UK Essays.com)
Figure 1
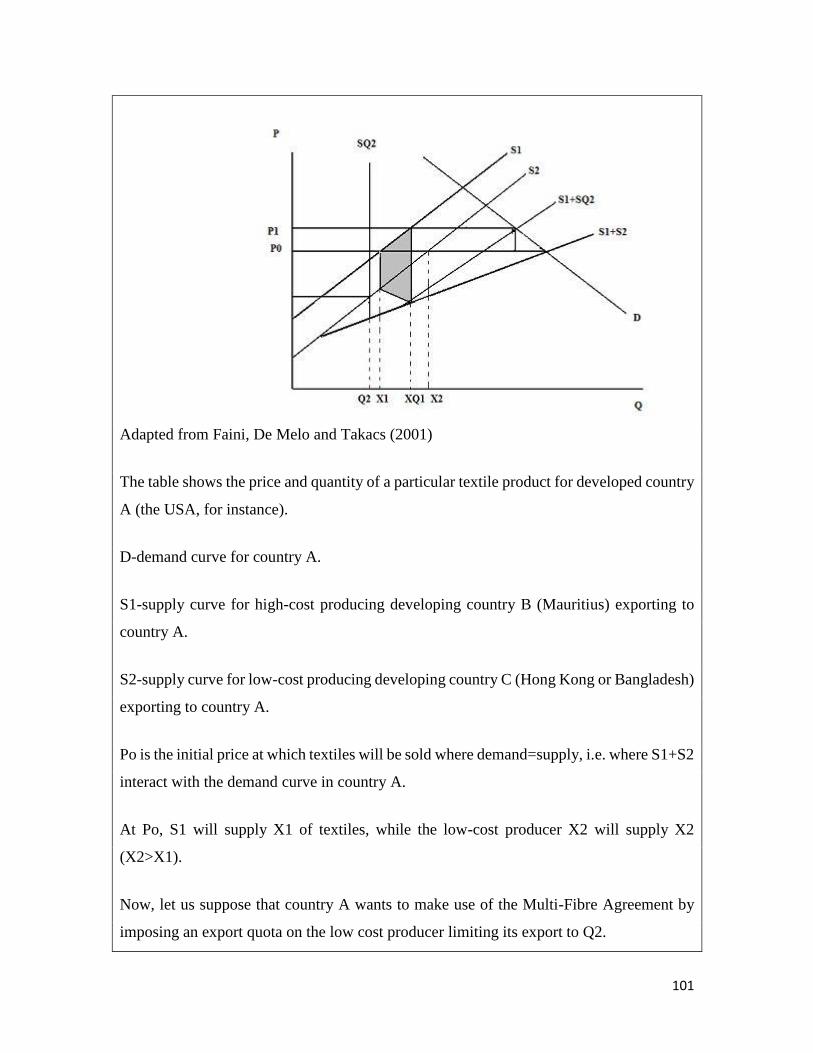
101
Adapted from Faini, De Melo and Takacs (2001)
The table shows the price and quantity of a particular textile product for developed country
A (the USA, for instance).
D-demand curve for country A.
S1-supply curve for high-cost producing developing country B (Mauritius) exporting to
country A.
S2-supply curve for low-cost producing developing country C (Hong Kong or Bangladesh)
exporting to country A.
Po is the initial price at which textiles will be sold where demand=supply, i.e. where S1+S2
interact with the demand curve in country A.
At Po, S1 will supply X1 of textiles, while the low-cost producer X2 will supply X2
(X2>X1).
Now, let us suppose that country A wants to make use of the Multi-Fibre Agreement by
imposing an export quota on the low cost producer limiting its export to Q2.

102
In that case, the supply curve for the low-cost producer C will now be SQ2, while the
supply curve for the high-cost producer B will remain the same at S1.
Given that there is now a quota restriction, the supply curves of both countries B and C
when added together will now rotate inwards from S1+S2 to S1+SQ2.
The new supply curve (S1+SQ2) now equals demand in country A at a higher price P1.
This is logical because as supply falls price rises.
At the new higher price P1 (quota rents meaning developing countries are receiving higher
prices than they would be guaranteed in a free market than developing countries would
receive, which is a consequence of the quota imposed on the low-cost producer) the low-
cost producer will now supply less at Q2 instead of X2, while the high-cost producer will
increase its supply to the developed country from X1 to XQ1, while at the same time
obtaining a higher price.
Therefore, it is clear that when the developed country is imposing a quota restriction on the
low-cost producing developing countries, it is directly decreasing the amount that it could
supply, but also indirectly increasing supply from the higher-cost producer at an artificially
higher price.
Now let us see how this took place in reality. Subramanian and Roy (2001) explain this
very clearly. The MFA limited imports of textiles and clothing to the USA and EU by
awarding country-specific quotas. As a result, imports were redistributed among the
countries that produced these goods, to Mauritius's benefit. Let us explain how.
Under this agreement many low-cost textile-producing countries were given quota limits
on the amount they could import to the USA and EEC. The Ministry of Industry (1990)
explains that the US government imposed quota restrictions on the importation of given
categories of clothing once the imports of that product into the US, in volume terms, attains
1% of US production in that category. Therefore, countries like China, India and Pakistan
were directly affected by this quota system, as the amount they could export to the USA
and EU was severely limited compared to a situation of free trade. For example, Free

103
Essays (http://www.free-essays.com) shows that with the dismantling of the MFA in 2004
‘the level of Chinese clothing exports rose from 11 million units in 1995 to 213 million
units in 2004’.
ANNEXURE 2
Table (a) below shows wages per day in manufacturing during the period 1981 to 1987 in
selected countries in their respective local currencies.
Table (a) Wages per day in manufacturing 1981-1987
1981 1982 1983 1984 1985 1986 1987
Egypt (Pounds) -- 2.71 -- -- 3.86 4.28 5
Bangladesh (Taka) 26.81 27.00 27.2 27.3
Hong Kong (Dollar) 52.2 72.3 79.5 90.1 98.3 106.4 119.4
Malaysia (Ringitt) 14.01 16.23 18 19.67 21.27 21.2 20.9
Mauritius (Rupees) 26.55 27.29 30.57 32.95 35.17 37.56 44.18
Philippines (Peso) 32.77 36.37 41.6 54.73 65.03 72.76 84.57
Singapore (Dollar) 20 21.84 24.08 26.56 27.68 -- --
Sri Lanka (Rupees) 28.25 27.79 32.04 37.22 42.87 45.42 50.03
Source: Adapted from ILO figures
Table (b) Exchange rates to 1 USD
1981 1982 1983 1984 1985 1986 1987
Egypt (Pounds) 0.7 0.7 0.7 0.7 0.7 0.7 0.7
Bangladesh (Taka) 17.99 22.11 24.62 25.35 27.99 30.41 30.95
Hong Kong(Dollar) 5.59 6.07 7.27 7.81 7.79 7.8 7.8
Malaysia (Ringitt) 2.3 2.33 2.32 2.34 2.48 2.58 2.51
Mauritius (Rupees) 8.93 10.87 11.7 13.8 15.44 13.47 12.88
Philippines (Peso) 7.89 8.54 11.11 16.7 18.6 20.39 20.56
Singapore (Dollar) 2.11 2.14 2.11 2.13 2.20 2.18 2.10

104
Sri Lanka (Rupees) 19.25 20.81 23.52 25.44 27.16 28.01 29.44
Source: World Penn tables

105
References
Ancharaz, V. (2003). “FDI and Export Performance of the Mauritian Manufacturing
Sector”, Paper presented at the UNCTAD Training Workshop in January 2014, University
of Mauritius.
BBC News (2004). China to place duties on textiles. Accessed 15th March 2005 available
at
http://newsvote.bbc.co.uk/mpapps/pagetools/print/news.bbc.co.uk/1/hi/business/4090975.
stm
BBC News (2004). Millions 'to lose textile jobs' available at
http://newsvote.bbc.co.uk/mpapps/pagetools/print/news.bbc.co.uk/1/hi/business/4100249.
stm [Accessed 15th March 2005]
BBC News (2010). Morocco, Country Profile available at
http://www.bbc.co.uk/news/world-africa-14121438
Boulle, P.L. (1978). “The Past, Present and Future of our Export Processing Enterprises”.
January 1978 Confidential Report.
Bowman, L.W. (1991). “Mauritius: Democracy and Development in the Indian Ocean”.
London: Westview Press.
Brautigam, D. (1999). “The Mauritius Miracle: Democracy, Institutions and Economic
Policy”, in State, Conflict and Democracy in Africa, Ed. by R Joseph. Boulder: Lynne
Reiner.
Budget Speech (1982). Mauritius 20 August 1982
Bureau of African Affairs (2010). US Department of State, Diplomacy in Action. Available
at http://www.state.gov/r/pa/ei/bgn/6618.htm.

106
Central Statistics Office, Mauritius. Available at http://www.gov.mu/portal/site/cso.
Chernoff, B. &Warner, A. (2002). “Source of fast growth in Mauritius: 1960-2000”, Center
for International Development at Harvard University. Prepared for a conference on
“Iceland and the World Economy: Small Island Economies in the Era of Globalization”
available at
http://www.cid.harvard.edu/archive/events/docs/mauritius_conference_paper.pdf
Dharmalingam, K. (1987). A Report on Berth, Existing Capacity vs Demand, Mauritius
Marine Authority. Mauritius: Ports and Harbors.
English, Philip (1997). “Mauritius, Reigniting the Engines of Growth. A Teaching Case of
the Economic Development Institute of the World Bank: World Bank.
Faini, R., De Melo, J. and Takacs, W. (2001). “A Primer on the MFA Maze”. Oxford: Basil
Blackwell.
Fowdar, Narud (1991). “Textiles and Clothing in Mauritius”. EIU Textile Outlook
International, November 1991, the Economist Intelligence Unit.
Garrity, Monique P. (1977). “Implications of the Lomé Convention for African Trade and
Development”. Review of Black Political Economy, Vol.8 No.1: pages 5-26
Gouvernment de L’ile Maurice (Avril 1985). PLAN DIRECTEUR DU PORT DE PORT
LOUIS, Rapport, Etude financee par le Fonds d’Aide et de Cooperation de la Republique
Francaise-FAC.
Government Information Service (2003) Mauritius 1968-2003, Achievements and
Challenges, March, Prime Minister’s Office. Port Louis: Government Printer.
Griffiths, A. and Wall, S. (1997). Applied Economics. An Introductory Course. 7th Edition.
London: Longman.

107
Hamada, K. (1974). “An Economic Analysis of the Duty-Free Zone”. Journal of
International Economics, 4: 225-241.
Hein, Catherine (1988). “Multinational enterprises and employment in the Mauritian
export processing zone”. Working Paper No. 52, Multinational Enterprises Programme.
Geneva: International Labour Office.
Helpman, E. (2004). The Mystery of Economic Growth. Cambridge MA: The Belknap
Press of Harvard University Press.
Kreye, O, Heinrichs,J. and Frobel, F (1987). “Export processing zones in developing
countries: Results of a new survey”, Working Paper No. 43, International Labour Office,
Geneva.
Krugman, P. (1995). Development, Geography and Economic Theory. Cambridge (MA):
MIT Press.
Krugman, P. and Venables, A. (1995). “Globalization and the Inequality of Nations” The
Quarterly Journal of Economics, Vol. 110, No.4: 857-880.
Krugman, P. (1998). “The role of Geography in Development”. Paper prepared for Annual
World Bank Conference on Development Economics. Washington DC: World Bank.
Lim Fat, Sir E.(2010) “From Vision to Miracle, Memoirs of Sir Edouard Lim Fat and the
Story of the Mauritian Export Processing Zone (EPZ)”, T-Printers Co. Ltd., Industrial Zone
Mauritius.
Madani, Dorsati (1999). “A Review of the Role and Impact of Export Processing Zones”.:
Washington D.C: World Bank.
Marques, H.(2004). “The New Economic Theories”, Department of Economics,
Loughborough University, Loughborough, Leicestershire.

108
Ministry of Economic Planning and Development (1980). 1980-82 two-year plan for
economic and social development. Port Louis: Government Printer.
Ministry of Industry and Industrial Technology (1990). Mauritius at Crossroads: The
Industrial Challenges Ahead. Port Louis: Government Printer.
Nath, S and Madhoo, Y.N (2004). “Explaining African Economic Growth Performance.
The case of Mauritius,” Growth Working Paper 1, Department of Economics and Statistics.
Reduit: University of Mauritius.
Nathan Associates (2003). Successful Integration into the Global Economy: Costa Rica
and Mauritius. Research Report. Washington: USAID.
Regional Integration Facilitation Forum (RIFF) (2002). Mauritius Technical Working
Group. Proceedings of .alf-day seminar on FDI Database for Mauritius. Domaine les
Pailles: Regional Cooperation Division of the Ministry of Foreign Affairs, Mauritius.
Ron, Alter (1991). “Lessons from the export-processing zone in Mauritius”. An article
from Finance and Development. available at http://www.highbeam.com/doc/1G1-
11705329.html
Sachs, J. and Radelet, S. (1998). “Shipping Costs, Manufactured Exports, and Economic
Growth”, Earth Institute – Presented at the Annual Meeting of the American Economics
Association, Chicago, January 3-5, 1998.
Subramanian, A. & Roy, D. (2001). “Who can explain the Mauritian Miracle: Meade,
Romer, Sachs or Rodrik?”. IMF Working Paper, available at
http://www.iie.com/publications/papers/subramanian0701imf.pdf.
Sulimani, F. (2007) “The False Promise of International Financial Institutions in Building
Stable Democracies in Third World Countries”, Wright State University. Available at
http://rave.ohiolink.edu/etdc/view?acc_num=wright1183402800
109
Tyler, W. and Negrete, A. (2009). “Economic Growth and Export Processing Zones: An
Empirical Analysis of Policies to Cope with Dutch Disease”, LASA 2009 Congress, Rio
de Janeiro.
United Nations Conference on Trade and Development (2001). Investment Policy Review
Mauritius, Geneva: United Nations.
United Nations Conference on Trade and Development (2008). Economic Development in
Africa 2008, Geneva: United Nations.
UK Essays.com available at http://www.ukessays.com/essays/economics/multi-fibre-
agreement.php
Watson, P.L (2001). “Export Processing Zones: Has Africa Missed the Boat? Not yet!”
Africa Region Working Paper Series. Washington DC: World Bank.
Week-End Newspaper, Mauritius, of 20 April 1988
World Trade Report (2008). Trade in a Globalized World, Geneva: World Trade
Organisation.
CHAPTER 4
AN EMPIRICAL ANALYSIS ON WHETHER OR NOT THE EXPORT
PROCESSING ZONE (EPZ) IS ASSOCIATED WITH ECONOMIC SUCCESS
110
4.1 Introduction
This chapter uses a cross-country dataset to examine the association between EPZs and
economic performance. An empirical analysis is performed to test whether EPZs lead to
economic success, or if countries that are already successful also succeed when they
implement EPZs. In other words, are there underlying factors other than the successful
implementation of EPZs that would explain the economic success of countries such as
Mauritius?
On the basis of the approaches employed in this chapter, it seems that although those
countries adopting an EPZ tend to be globally more successful, a more in-depth analysis
shows that this hypothesis cannot be proved statistically, and adopting an EPZ does not
necessarily lead to the general effect of bringing success to a country.
4.2 Previous studies
There are a number of theories and models that are suggestive about the nature of the
association between EPZs and economic success. For example, the neoclassical Hecksher-
Ohlin (H-O) ‘two goods – two factors – two countries’ model discussed in the previous
chapter explains the decision to adopt an EPZ in terms of the comparative advantages
provided by factor endowments. Hamada (1974) uses this approach to analyse the
economic implications of EPZs. He concludes that an EPZ does not necessarily improve
consumption possibilities in the developing country. With the establishment of an EPZ
through the use of the H-O model, the potential consumption possibility for a country does
not improve with the introduction of more investment in the EPZ. In addition, labour is
taken away from the more productive sector (agriculture) to the capital-intensive sector
(manufacturing). Most neoclassical economists regard EPZs only as a second-best option.
The best option will always be complete liberalisation.
However, Cling (2001) has provided an overview of neoclassical economists who take a different
view than the majority and shows that the creation of EPZs improves a country's wellbeing.
New growth theorists tend to take a more positive view than the majority of neoclassical
economists, as they stress the possible external effects of an EPZ on the host economy,

111
such as learning effects, human capital development and demonstration effects. By
recognising the importance of these positive externalities, new growth theorists point to
important gains for host countries that implement EPZs successfully (Johansson & Nilsson,
1997).
Romer (1993) goes further when he shows that the catalyst effect of EPZs on the rest of
the economy may be transmitted through a variety of channels. For instance, workers
trained within EPZs may transmit their knowledge and experience to subsequent
employers; domestic enterprises may copy production and organisational methods applied
by foreign firms in the EPZ, as well as benefit from distribution networks established to
serve these foreign enterprises; and local entrepreneurs may be encouraged to seek their
own export markets, and so on.
Tyler (2009), using the endogenous growth framework of new growth economics, analyses
the empirical effects of the adoption of an EPZ policy on the growth of countries. The
analysis incorporates the use of EPZs in the empirical estimates of a growth equation and
demonstrates a positive and significant relationship between the use of EPZs and economic
growth, providing support for the contention that host countries (using EPZs) grow faster
than countries that have not employed such mechanisms. In the light of his findings, he
advises governments that have rejected the implementation of EPZs to re-examine their
policies.
Radelet (1999) observes that success in manufactured exports has been nearly synonymous
with rapid economic development. With only a few exceptions, the countries that have
achieved the most rapid gains in income per capita have also recorded the fastest growth
in manufactured exports. He gives the example of the East Asian countries where incomes
grew between fourfold (in South-East Asia) and sevenfold (in the Four Tigers) on the back
of labour-intensive manufactured exports. Beyond East Asia, Mauritius, Ireland and
Tunisia have all achieved both rapid manufactured export growth and rapid economic
growth over sustained periods. He says that there is widespread consensus today that
manufactured exports accelerate economic growth and technological progress by fostering
closer connections with international firms, using leading-edge technologies, encouraging
economic specialisation, promoting high rates of investment in profitable economic

112
activities, and providing foreign exchange to finance imports of capital goods which cannot
be produced locally.
Although he is an advocate of EPZs, he also points to the general importance of the broader
policies and underlying preconditions that are needed to encourage growth in manufactured
exports. These include prudent macroeconomic policies, such as small budget deficits,
appropriate exchange rates and low inflation, access to duty-free imports of capital goods
and raw materials, political stability, and a basic level of reliable infrastructure. This
suggests that countries that have successfully implemented the types of EPZs that lead to
increases in manufacturing exports were already performing well by all the above
standards.
4.3 Methodology
The key question of this chapter is whether implementing an EPZ is in some way a
contributory factor to economic success or whether economic success is the product of
broader underlying factors, which ensure that EPZs will work but are not really necessary
for economic success. To assess this, we will use a number of different approaches.
Firstly, a general overview is given of the performance of countries for five and ten years
prior to, during and after EPZ implementation. A comparison of EPZ countries is made
with non-EPZ countries over similar periods (1980-1990) using the two success measures
identified throughout the chapter. Broadly, it seems that those countries with EPZs
performed better. Next, the data are investigated to find out whether this was actually the
case or whether it was due to something else.
The first step is to analyse the types of countries that chose to implement an EPZ and their
characteristics. . Probit estimation is used in this case. The results will give an indication
of whether it was just certain types of countries that chose EPZs. The results will also show
that the choice of implementing an EPZ may not be exogenous but related to additional
factors. A way to deal with the endogeneity will also need to be identified at a later stage.
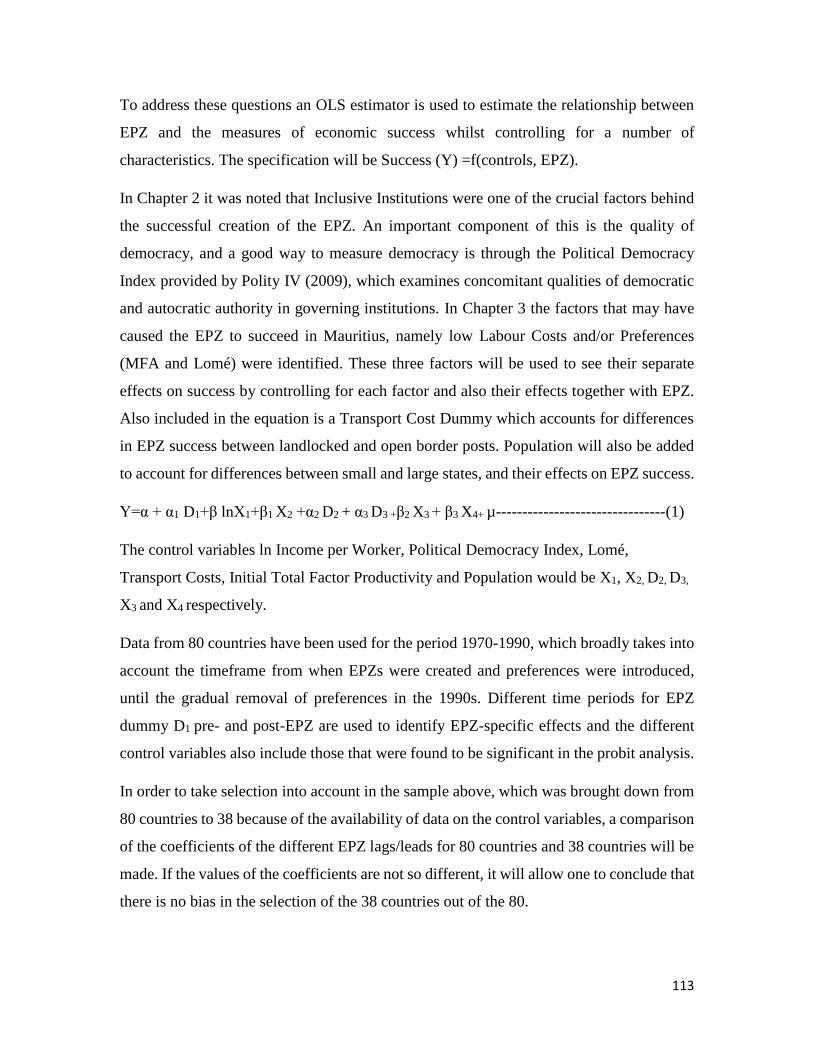
113
To address these questions an OLS estimator is used to estimate the relationship between
EPZ and the measures of economic success whilst controlling for a number of
characteristics. The specification will be Success (Y) =f(controls, EPZ).
In Chapter 2 it was noted that Inclusive Institutions were one of the crucial factors behind
the successful creation of the EPZ. An important component of this is the quality of
democracy, and a good way to measure democracy is through the Political Democracy
Index provided by Polity IV (2009), which examines concomitant qualities of democratic
and autocratic authority in governing institutions. In Chapter 3 the factors that may have
caused the EPZ to succeed in Mauritius, namely low Labour Costs and/or Preferences
(MFA and Lomé) were identified. These three factors will be used to see their separate
effects on success by controlling for each factor and also their effects together with EPZ.
Also included in the equation is a Transport Cost Dummy which accounts for differences
in EPZ success between landlocked and open border posts. Population will also be added
to account for differences between small and large states, and their effects on EPZ success.
Y=α + α1 D1+β lnX1+β1 X2 +α2 D2 + α3 D3 +β2 X3 + β3 X4+ µ--------------------------------(1)
The control variables ln Income per Worker, Political Democracy Index, Lomé,
Transport Costs, Initial Total Factor Productivity and Population would be X1, X2, D2, D3,
X3 and X4 respectively.
Data from 80 countries have been used for the period 1970-1990, which broadly takes into
account the timeframe from when EPZs were created and preferences were introduced,
until the gradual removal of preferences in the 1990s. Different time periods for EPZ
dummy D1 pre- and post-EPZ are used to identify EPZ-specific effects and the different
control variables also include those that were found to be significant in the probit analysis.
In order to take selection into account in the sample above, which was brought down from
80 countries to 38 because of the availability of data on the control variables, a comparison
of the coefficients of the different EPZ lags/leads for 80 countries and 38 countries will be
made. If the values of the coefficients are not so different, it will allow one to conclude that
there is no bias in the selection of the 38 countries out of the 80.
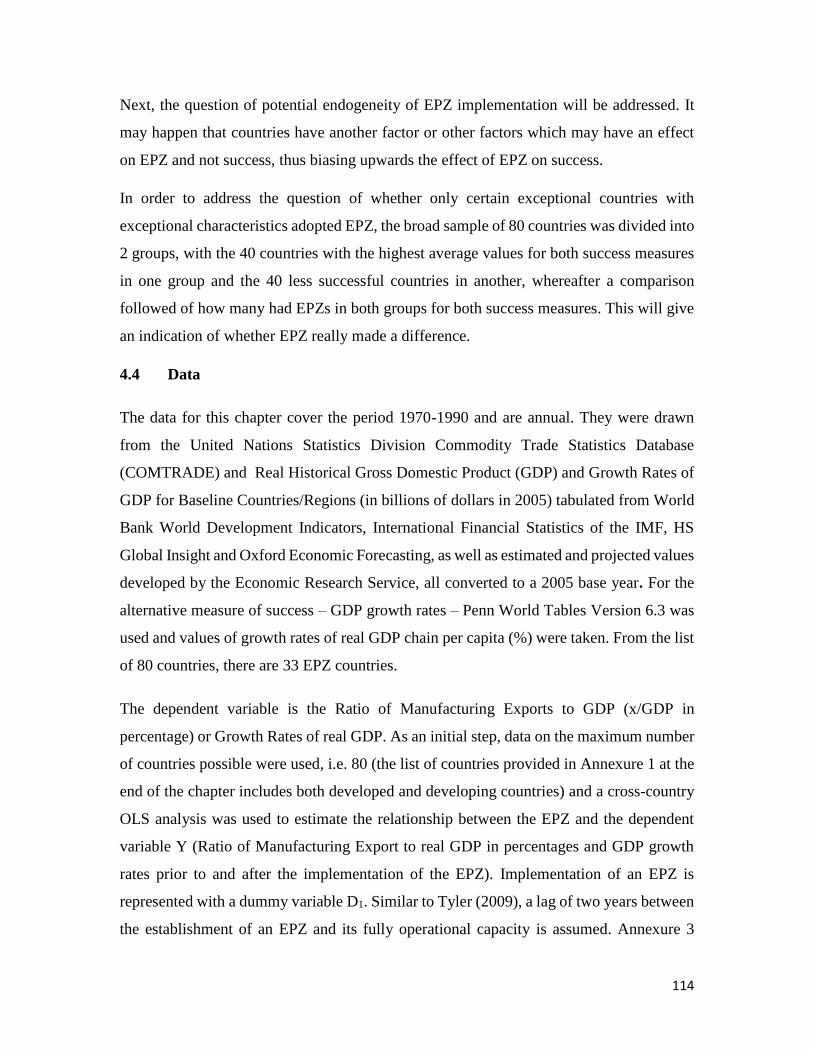
114
Next, the question of potential endogeneity of EPZ implementation will be addressed. It
may happen that countries have another factor or other factors which may have an effect
on EPZ and not success, thus biasing upwards the effect of EPZ on success.
In order to address the question of whether only certain exceptional countries with
exceptional characteristics adopted EPZ, the broad sample of 80 countries was divided into
2 groups, with the 40 countries with the highest average values for both success measures
in one group and the 40 less successful countries in another, whereafter a comparison
followed of how many had EPZs in both groups for both success measures. This will give
an indication of whether EPZ really made a difference.
4.4 Data
The data for this chapter cover the period 1970-1990 and are annual. They were drawn
from the United Nations Statistics Division Commodity Trade Statistics Database
(COMTRADE) and Real Historical Gross Domestic Product (GDP) and Growth Rates of
GDP for Baseline Countries/Regions (in billions of dollars in 2005) tabulated from World
Bank World Development Indicators, International Financial Statistics of the IMF, HS
Global Insight and Oxford Economic Forecasting, as well as estimated and projected values
developed by the Economic Research Service, all converted to a 2005 base year. For the
alternative measure of success – GDP growth rates – Penn World Tables Version 6.3 was
used and values of growth rates of real GDP chain per capita (%) were taken. From the list
of 80 countries, there are 33 EPZ countries.
The dependent variable is the Ratio of Manufacturing Exports to GDP (x/GDP in
percentage) or Growth Rates of real GDP. As an initial step, data on the maximum number
of countries possible were used, i.e. 80 (the list of countries provided in Annexure 1 at the
end of the chapter includes both developed and developing countries) and a cross-country
OLS analysis was used to estimate the relationship between the EPZ and the dependent
variable Y (Ratio of Manufacturing Export to real GDP in percentages and GDP growth
rates prior to and after the implementation of the EPZ). Implementation of an EPZ is
represented with a dummy variable D1. Similar to Tyler (2009), a lag of two years between
the establishment of an EPZ and its fully operational capacity is assumed. Annexure 3

115
shows when EPZs were established in the relevant countries in the sample. To confirm the
EPZ-specific effects, a series of other EPZ dummies will also be given – namely, ten years
prior (t-10) to establishment of EPZ, five years prior (t-5) to establishment of EPZ, the year
of establishment (t), five years after establishment of EPZ (t+5) and ten years after
establishment (t+10) of EPZ. The number of observations in this sample was 1,680.
In order to analyse whether success could be explained by factors other than EPZ, and
given the limited data availability of the other possible factors to explain success, the
sample has been restricted to 38 countries. Cross-country panel data analysis over the same
period was also used. The 38 countries covered in the sample are listed in Annexure 2.
From the 38 countries, there are 20 EPZ nations; the total number of observations is 798.
The sources for the other variables, i.e. the control variables are given in Table 4.1.
Table 4.1 Data sources
Variable Symbol Source
Ln Income per
Worker
compared to the
US
X1 (t-2) UNIDO website. Ln value for this variable was used, as it gives a
good measure of the absolute change in Y for a given relative or
proportional change in the Income per Worker index. In tabulating,
it was assumed that manufacturing success in year t will depend on
income in year (t-2), hence the use of X1(t-2).
Political
Democracy
Index
X2 (t-2) Ranges between -10 to +10. Data obtained from the Polity website.
It has been assumed that its effect will be felt after two years.
Lomé D2 The allocation of 0 for no Lomé preferences and 1 for Lomé
preferences. This dummy would take a value of one for the relevant
countries only as from 1981-1990, when Textiles and Clothing were
also included in the Lomé preferences under Lomé II. From the
sample of 38 countries analysed are 11 Lomé Countries, the ACP
states – namely, the Dominican Republic, Fiji, Malawi, Mauritius,
Barbados, Cameroon, Congo, Cote d'Ivoire, Madagascar, Togo and
Trinidad and Tobago. From these 11 countries, only Mauritius and
the Dominican Republic already had EPZs before the entry into
force of the Lomé Convention. Furthermore, this variable has not
been lagged, due to the fact that the preferences under Lomé were
part of a package of preferences between ACP and EU (EEC at that
time) and the fact that the Lomé preferences for textiles and clothing
would enter into force in 1981 was known well in advance. Those
deciding to use these preferences were ready from day one.
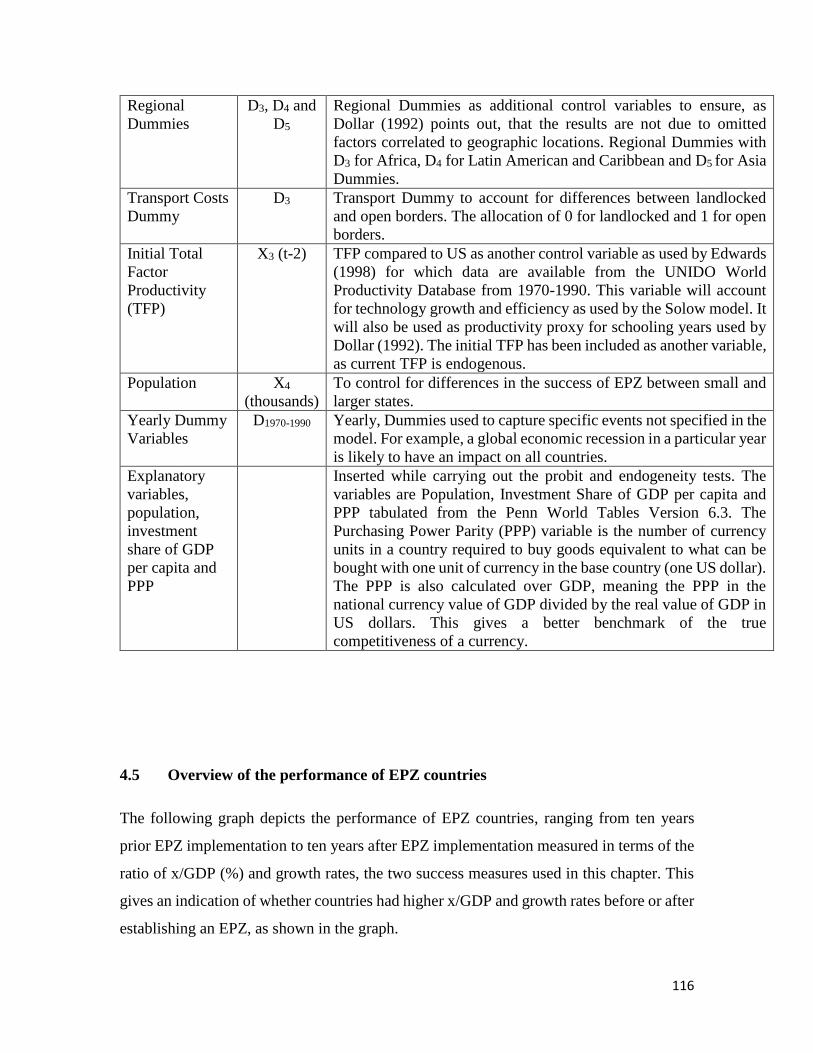
116
Regional
Dummies
D3, D4 and
D5
Regional Dummies as additional control variables to ensure, as
Dollar (1992) points out, that the results are not due to omitted
factors correlated to geographic locations. Regional Dummies with
D3 for Africa, D4 for Latin American and Caribbean and D5 for Asia
Dummies.
Transport Costs
Dummy
D3 Transport Dummy to account for differences between landlocked
and open borders. The allocation of 0 for landlocked and 1 for open
borders.
Initial Total
Factor
Productivity
(TFP)
X3 (t-2) TFP compared to US as another control variable as used by Edwards
(1998) for which data are available from the UNIDO World
Productivity Database from 1970-1990. This variable will account
for technology growth and efficiency as used by the Solow model. It
will also be used as productivity proxy for schooling years used by
Dollar (1992). The initial TFP has been included as another variable,
as current TFP is endogenous.
Population X4
(thousands)
To control for differences in the success of EPZ between small and
larger states.
Yearly Dummy
Variables
D1970-1990 Yearly, Dummies used to capture specific events not specified in the
model. For example, a global economic recession in a particular year
is likely to have an impact on all countries.
Explanatory
variables,
population,
investment
share of GDP
per capita and
PPP
Inserted while carrying out the probit and endogeneity tests. The
variables are Population, Investment Share of GDP per capita and
PPP tabulated from the Penn World Tables Version 6.3. The
Purchasing Power Parity (PPP) variable is the number of currency
units in a country required to buy goods equivalent to what can be
bought with one unit of currency in the base country (one US dollar).
The PPP is also calculated over GDP, meaning the PPP in the
national currency value of GDP divided by the real value of GDP in
US dollars. This gives a better benchmark of the true
competitiveness of a currency.
4.5 Overview of the performance of EPZ countries
The following graph depicts the performance of EPZ countries, ranging from ten years
prior EPZ implementation to ten years after EPZ implementation measured in terms of the
ratio of x/GDP (%) and growth rates, the two success measures used in this chapter. This
gives an indication of whether countries had higher x/GDP and growth rates before or after
establishing an EPZ, as shown in the graph.

117
.
-1
0
1
2
3
4
(t-10) (t-5) (t) (t+5) (t+10)x/G
DP
and g
row
th r
ate
s
x/GDP growth rate
Figure 4.1 Success measure over time
On the y-axis are the averages of the success measures x/GDP and growth rates plotted
against time for periods ten years prior to EPZ (t-10), five years prior (t-5), at time of EPZ
establishment (t), five years after (t+5) and ten years after (t+10). The figure suggests that
from the sample of thirteen randomly selected countries (Table 4.3), countries that
implemented EPZs do better than when they were without EPZs. It is noted, however, that
just after an EPZ has been implemented, the increase in average x/GDP was more apparent
than for the other success measure.
The next step is to statistically compare some EPZ and non-EPZ countries in terms of their
average x/GDP3 and growth rates of real GDP for the period 1980-1990.
Table 4.2 EPZ and non-EPZ countries compared
EPZ Non-EPZ
Country/year
of EPZ
establishment
Average
x/GDP
(1980-90)
Average
growth
rates of
real GDP
(1980-90)
Country
Average
x/GDP
(1980-90)
Average
growth
rates of
real GDP
(1980-90)
Latin
America
3 Ratio of total exports of manufacturing goods in value terms to GDP.
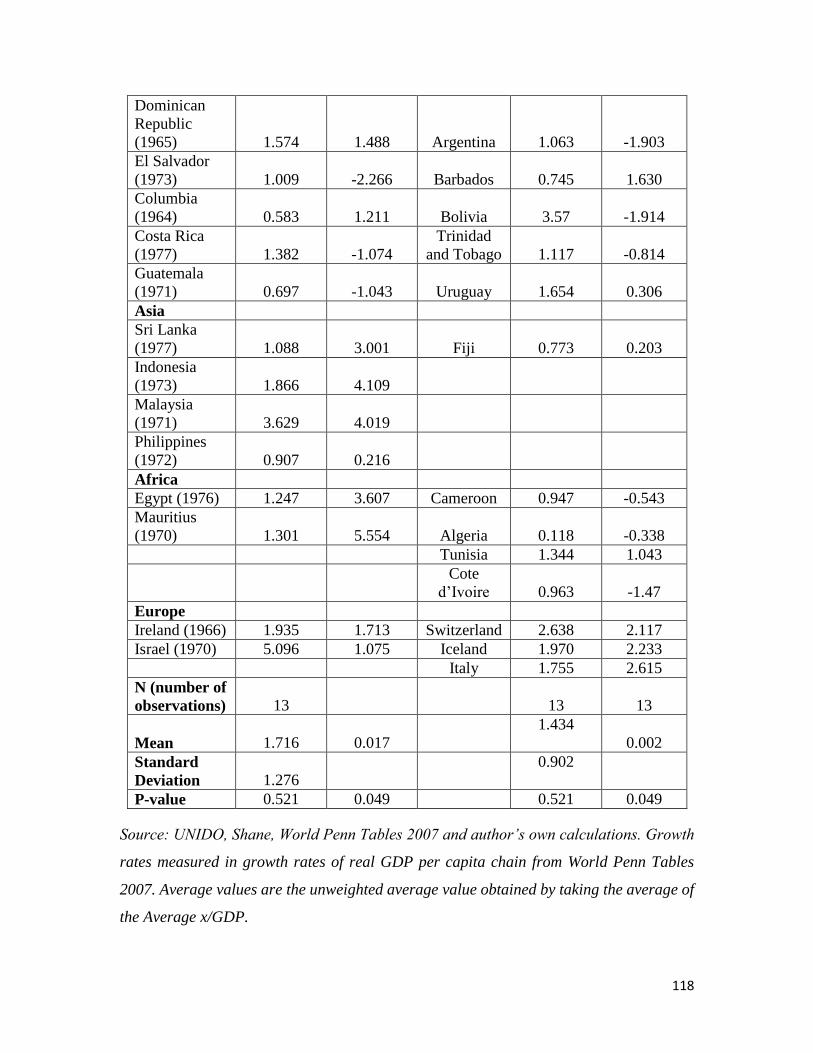
118
Dominican
Republic
(1965) 1.574 1.488 Argentina 1.063 -1.903
El Salvador
(1973) 1.009 -2.266 Barbados 0.745 1.630
Columbia
(1964) 0.583 1.211 Bolivia 3.57 -1.914
Costa Rica
(1977) 1.382 -1.074
Trinidad
and Tobago 1.117 -0.814
Guatemala
(1971) 0.697 -1.043 Uruguay 1.654 0.306
Asia
Sri Lanka
(1977) 1.088 3.001 Fiji 0.773 0.203
Indonesia
(1973) 1.866 4.109
Malaysia
(1971) 3.629 4.019
Philippines
(1972) 0.907 0.216
Africa
Egypt (1976) 1.247 3.607 Cameroon 0.947 -0.543
Mauritius
(1970) 1.301 5.554 Algeria 0.118 -0.338
Tunisia 1.344 1.043
Cote
d’Ivoire 0.963 -1.47
Europe
Ireland (1966) 1.935 1.713 Switzerland 2.638 2.117
Israel (1970) 5.096 1.075 Iceland 1.970 2.233
Italy 1.755 2.615
N (number of
observations) 13 13 13
Mean 1.716 0.017
1.434
0.002
Standard
Deviation 1.276
0.902
P-value 0.521 0.049 0.521 0.049
Source: UNIDO, Shane, World Penn Tables 2007 and author’s own calculations. Growth
rates measured in growth rates of real GDP per capita chain from World Penn Tables
2007. Average values are the unweighted average value obtained by taking the average of
the Average x/GDP.

119
Table 4.2 uses a sample of 26 countries taken from the restricted list of 38 countries, which
gives an equal number of EPZ and non-EPZ countries chosen from different regions to
avoid regional bias. Data in the table clearly show that for both success measures (x/GDP
and growth rates) EPZ countries on average performed better than non-EPZ countries. For
instance, the average growth rate (calculated using growth rates for each country from
World Penn Tables over the ten-year period) for the selected EPZ countries was 1.74%,
which was approximately sevenfold higher than for non-EPZ countries, which stood at
only 0.24%. The differences that were significantly different between EPZ and non-EPZ
samples for growth rates were not so for x/GDP.
To check whether these values are statistically significant, a t-test was performed on both
measures of success. The t-test gives a p-value of 0.52, which is far higher than 0.05.
Therefore the null hypothesis that there is no difference of x/GDP between EPZ and non-
EPZ countries has to be accepted.
On the other hand, using the other measure of success, growth rates of real GDP, the t-test
gives a value of 0.049 < 0.05, confirming the alternative hypothesis that EPZ and non-EPZ
countries had significantly different values when measured using the success measure
growth rates of real GDP per capita.
To compare within-country performance statistically, the performance of individual
countries that implemented EPZ at time periods ranging from ten years before EPZ
implementation to ten years after implementation were examined to see whether these
countries showed significant differences when EPZs were established. This is shown in
Table 4.3.
Table 4.3: Performance of countries (x/GDP) that implemented EPZ at different time
periods
Countries/year
of EPZ
establishment
Real
x/GDP (t-
10) 10
years
prior
x/GDP (t-
5) 5 years
prior
x/GDP
(t): in
year of
establish-
ment
x/GDP
(t+5) 5
years post
x/GDP
(t+10) 10
years post
Brazil (1988) 0.3054 0.6851 1.3190 1.4673 1.2535
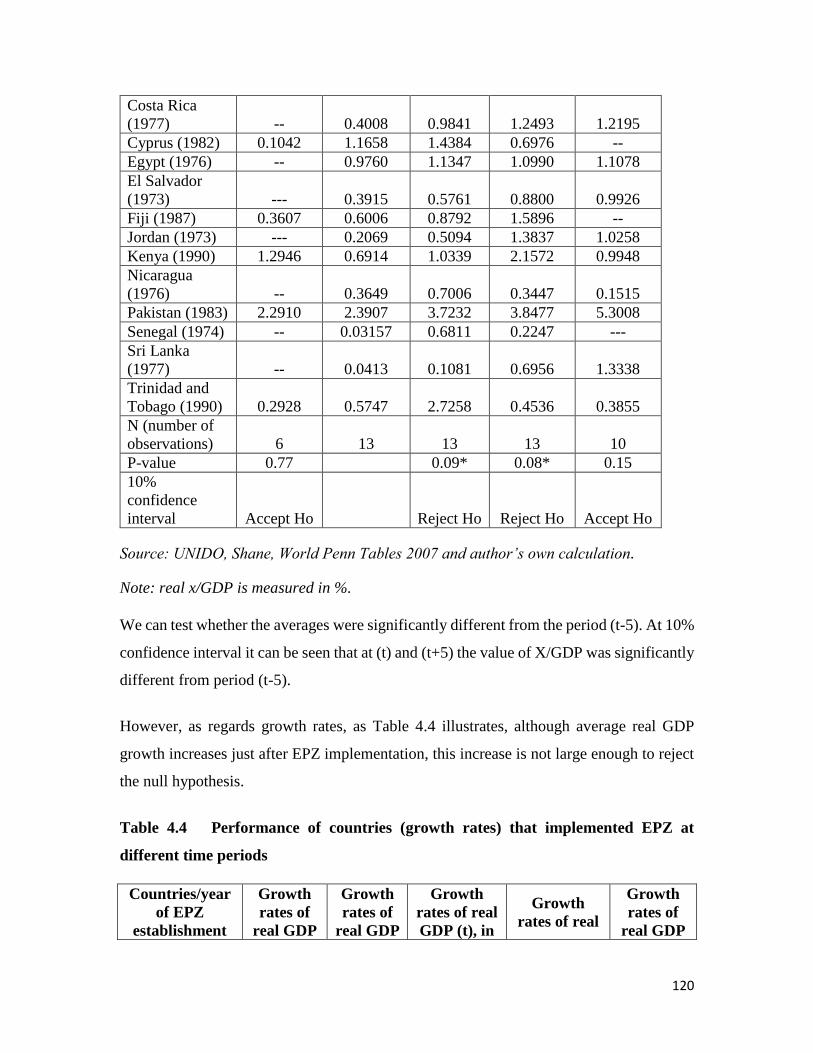
120
Costa Rica
(1977) -- 0.4008 0.9841 1.2493 1.2195
Cyprus (1982) 0.1042 1.1658 1.4384 0.6976 --
Egypt (1976) -- 0.9760 1.1347 1.0990 1.1078
El Salvador
(1973) --- 0.3915 0.5761 0.8800 0.9926
Fiji (1987) 0.3607 0.6006 0.8792 1.5896 --
Jordan (1973) --- 0.2069 0.5094 1.3837 1.0258
Kenya (1990) 1.2946 0.6914 1.0339 2.1572 0.9948
Nicaragua
(1976) -- 0.3649 0.7006 0.3447 0.1515
Pakistan (1983) 2.2910 2.3907 3.7232 3.8477 5.3008
Senegal (1974) -- 0.03157 0.6811 0.2247 ---
Sri Lanka
(1977) -- 0.0413 0.1081 0.6956 1.3338
Trinidad and
Tobago (1990) 0.2928 0.5747 2.7258 0.4536 0.3855
N (number of
observations) 6 13 13 13 10
P-value 0.77 0.09* 0.08* 0.15
10%
confidence
interval Accept Ho Reject Ho Reject Ho Accept Ho
Source: UNIDO, Shane, World Penn Tables 2007 and author’s own calculation.
Note: real x/GDP is measured in %.
We can test whether the averages were significantly different from the period (t-5). At 10%
confidence interval it can be seen that at (t) and (t+5) the value of X/GDP was significantly
different from period (t-5).
However, as regards growth rates, as Table 4.4 illustrates, although average real GDP
growth increases just after EPZ implementation, this increase is not large enough to reject
the null hypothesis.
Table 4.4 Performance of countries (growth rates) that implemented EPZ at
different time periods
Countries/year
of EPZ
establishment
Growth
rates of
real GDP
Growth
rates of
real GDP
Growth
rates of real
GDP (t), in
Growth
rates of real
Growth
rates of
real GDP

121
(t-10) 10
years
prior
(t-5) 5
years
prior
year of
establishme
nt
GDP (t+5) 5
years post
(t+10) 10
years post
Brazil (1988) 2.47 -6.16 -3.18 3.11 -1.53
Costa Rica
(1977) 2.00 3.38 7.09 -9.90 -0.13
Cyprus (1982) 4.22 22.90 4.43 7.19 6.05
Egypt (1976) -2.29 2.57 17.57 9.42 6.01
El Salvador
(1973) 0.77 -1.31 4.04 2.25 -1.88
Fiji (1987) 3.39 -5.11 -2.12 4.04 2.97
Jordan (1973) 0.63 -8.99 -11.14 9.12 7.62
Kenya (1990) 2.17 -2.84 0.70 1.95 -1.61
Nicaragua
(1976) 1.29 1.19 1.81 5.73 -1.51
Pakistan (1983) 1.26 -0.89 2.33 1.43 2.08
Senegal (1974) 0.10 -9.31 1.15 5.5 -7.87
Sri Lanka (1977) 6.9 1.3 3.01 3.42 0.15
Trinidad and
Tobago (1990) 9.9 -5.9 5.34 5.42 17.0
N (number of
observations) 13 13 13 13 13
P-value 0.21 0.30 0.11 0.33
10% confidence
Interval Accept Ho Accept Ho Accept Ho Accept Ho
Source: World Penn Tables 2007 and author’s calculations.
Thus, although it seems that implementing an EPZ was generally associated with success,
it could also be that only those countries that had the necessary preconditions for success
did actually implement the EPZ, and that those countries would have grown faster anyway.
A deeper empirical analysis needs to be undertaken with the larger number of countries
before coming up with any sensible conclusion.
4.6 Empirical results
The empirical analysis will first of all try to provide explanations for why EPZ countries
seem to be associated with success. The question is asked whether only those countries that
were successful chose to implement an EPZ.

122
A probit is used to estimate EPZ implementation using the control variables, Income per
Worker compared to the US, Political Democracy Index, the Ratio of Manufacturing
Exports to GDP (X/GDP %) as predictors, but also other randomly selected factors such as
Population (thousands), PPP and Investment Share of Real GDP per capita which may also
have impacted on whether a country decided to adopt an EPZ. Data have been obtained
from the World Penn Tables.
Our dependent variable is EPZ (t) and all the predictors are lagged by five years (t-5),
which will provide an indication of the performance of these predictors five years prior to
the implementation of the EPZ and also an idea of the type of countries that were prone to
implement an EPZ within the next five years from period (t).
Table 4.5 Performance (x/GDP) of predictors five years prior to implementation of
EPZ
Variables EPZ Dummy(t)
Estimate Standard Error
(SE)
Ratio of Manufacturing Exports to GDP % (t-5) 0.305*** 0.0467
Political Democracy Index (t-5) 0.056*** 0.008
Population in thousands (t-5) 1.65e-05*** 2.20e-06
PPP (t-5) -0.004*** 0.001
Investment Share of GDP/capita (t-5) 0.013* 0.007
Income per Worker compared to US (t-5) -2.397*** 0.303
Constant -0.101 0.112
Observations 740 * Indicates significance at different % levels: *** p<0.01(99% CI), ** p<0.05 (95% CI), * p<0.1(90% CI).
The number of observations taken in the table was 740. In the parameter estimates part, we have the
coefficients and their standard error. The standard error is an estimate of the standard deviation of the
coefficient, the amount it varies across cases. It measures the precision with which the coefficient is
measured. If a coefficient is large compared to its standard error, then it is probable that the variable is
different from 0, meaning it is significant. In the table the asterisks indicate the significance levels.
The probit results suggest that lagged values of manufacturing exports as a proportion of
GDP, the Political Democracy Index, Population and the Share of Investment are all
positively and significantly related to EPZ implementation. Income per Worker and PPP
are also found to be significantly related to EPZ, but with negative coefficients.

123
Table 4.6 Marginal effects on probit-performance (x/GDP) of predictors five years
prior to implementation of EPZ
Marginal effects after probit
y = Pr(EPZ_t) (predict)
= .437
Variable dy/dx Std.
Err.
Z P>z [ 95% C.I. ] X
manufa~g .120 .018 6.55 0.000 .084 .156 1.098
politi~s .022 .003 6.69 0.000 .0155 .0284 .066
popula~g 6.49e-06 .000 7.48 0.000 4.8e-06 8.2e-06 17419
Invest~s .005 .003 1.93 0.054 -.000 .010 16.834
Income~s -.944 .119 -7.93 0.000 -1.178 -.711 .327
PPPlag~s -.001 .000 -4.16 0.000 -.002 -.001 30.800
The marginal effects show that a one-unit increase in the manufacturing exports as a
proportion of GDP increases the probability of EPZ being implemented within the next
five years by 0.12. Similarly, a one-unit increase in Income decreases the probability of
EPZ being implemented within the next five years by 0.944. In this case, also, it is noted
the manufacturing exports as a proportion of GDP, the Political Stability Index, Population
and the Share of Investment are all positively related to EPZ implementation. Income per
Worker and PPP are found to be negatively related to EPZ. However, the probabilities for

124
Manufacturing Exports, Political Stability Index and PPP are more significant in marginal
terms.
The above analysis shows that countries that were exporting already, where political
democratic systems were in place, with low wages and competitive PPP were more likely
to implement an EPZ within the next five years than other countries.
To confirm the results, a step further was taken by looking first of all at only those countries
in the sample of 38 countries that did not have an EPZ in 1970, using EPZ (t). Having
identified those countries, their status in 1975 was checked using EPZ (t+5). The LHS
dependent variable will be EPZ (t+5) for those countries not having EPZ in 1970 and the
RHS will contain EPZ (t) for those countries not having EPZ in 1970, together with the
control variables Income per Worker compared to the US, Political Democracy Index, the
Ratio of Manufacturing Exports to GDP (X/GDP %), Population (thousands), PPP and
Investment Share of Real GDP per capita as predictors. In 1970 there were 29 countries
with no EPZ out of the 38. The same was followed for 1975, when there were 24 countries
with no EPZ. No results were obtained from 1980, 1985 and 1990, because the sample of
countries became too low. The results are indicated in Table 4.7.
Table 4.7 Performance (x/GDP) of countries without EPZ in 1970 and 1975
Countries with no EPZ 1970 1975
Variable EPZ (t+5) EPZ (t+5)
Estimate SE Estimate SE
Manufacturing_exp 0.370*** 0.140 0.184 0.428
Political_dem_lag2yrs -0.014 0.020 -0.168*** 0.055
Population_2yrslag -6.25e-06 6.57e-06 -3.71e-06 1.11e-05
Investment_Share -0.010 0.017 -0.003 0.026
Incomeperwprker_lagged2yrs -2.712 1.688 -8.530** 3.363
PPP 0.003 0.003 0.442*** 0.142
Constant 0.973* 0.564 0.461 1.114
Observations 174 80
The probit results suggest that countries with higher levels of manufacturing exports (but
this was only for 1970), Political Democracy, Competitive Incomes and PPP are more

125
likely to implement an EPZ. This indicates that, at least for these dimensions of economic
success, it was the more successful countries which implemented EPZs.
The marginal effects for countries with no EPZ for 1970 give the following results:
Marginal effects after probit
y = Pr(EPZ_t) (predict)
= .230
Table 4.8 Marginal effects on probit-performance (x/GDP) of countries without EPZ
in 1970
Variable dy/dx Std.
Err.
Z P>z [ 95% C.I. ] X
manufa~p .0565 .0183 3.09 0.002 .0207 .0924 1.050
politi~s .012 .003 4.13 0.000 .0065 .0182 .192
popula~g 5.71e-06 .000 7.39 0.000 4.2e-06 7.2e-06 19889.5
Invest~e .006 .002 2.71 0.007 .0016 .010 21.385
Income~s -1.188 .126 -9.41 0.000 -1.435 -.940 .309
PPP -.002 .000 -5.81 0.000 -.003 -.001 35.196
The marginal effects show that a one-unit increase in the Manufacturing Exports, Political
Index, Income and PPP affects significantly the probability of EPZ being implemented.
The marginal effects for countries with no EPZ for 1975 give the following results:
Marginal effects after probit
y = Pr(EPZ_fiveyrsafter) (predict)
= .850
Table 4.9 Marginal effects on probit-performance (x/GDP) of countries without EPZ
in 1975

126
variable dy/dx Std.
Err.
Z P>z [ 95% C.I. ] X
politi~s -.040 .013 -3.12 0.002 -.064 -.015 -.6
popula~g -8.68e-07 .000 -0.34 0.731 -5.8e-06 4.1e-06 24936.7
Invest~e -.001 .006 -0.11 0.915 -.013 .011 20.470
Income~s -1.994 1.042 -1.91 0.056 -4.036 .049 .200
PPP .103 .022 4.68 0.000 .060 .147 4.873
manufa~p .043 .098 0.44 0.660 -.149 .236 .950
After doing the same with the other success measure – namely, growth rates – results
similar to the above were obtained, with Income, Political Democracy and PPP significant.
4.6.1 OLS
An OLS estimator is used to estimate the relationship between EPZ and the measures of
economic success, while at the same time controlling for other variables. The specification
runs as follows: Success (Y) =f(controls, EPZ).
Table 4.10 Performance of 80 countries using OLS (x/GDP)
DF Estimate SE
EPZ (t-10) 30 0.0673 (0.148)
EPZ (t-5) 30 -0.101 (0.186)
EPZ (t) 30 0.0134 (0.237
EPZ (t+2) 30 -0.0656 0.261)
EPZ (t+5) 30 0.181 (0.207)
EPZ (t+10) 30 0.463*** 0.152)
Initial x/GDP % (growth rates) 30 1.695*** 0.0541
Year Dummies (1970-90) 30 Yes
Africa Dummy 30 Yes

127
+GRULAC Dummy 30 Yes
Asia Dummy 30 Yes
Constant 30 1.080*** (0.181)
Observations 30 1539
R-Squared 30 0.519 + GRULAC – Caribbean and Latin American countries
Dependent variable: Ratio of Manufacturing/GDP(%); (standard errors are in parentheses).
Indicates significance at different % levels: *** p<0.01(99% CI), ** p<0.05 (95% CI), * p<0.1(90% CI). The
results of the various OLS estimates will show whether the coefficients of the independent variables are really
different from zero, which would mean that the independent variables are having a real effect on the
dependent variable (measures of success). With coefficients large compared to Standard Errors, the
independent variable is probably different from zero.
DF stands for degrees of freedom
For the large sample of 80 countries, the results show EPZ (t+10) as the only significant
variable (at 99% CI (Confidence Interval)) of the success measure x/GDP. EPZ (t+10)
coefficient of 0.463 indicates that ten years after its introduction, the EPZ is seen as having
a positive association with x/GDP, which is expected to increase by 46.3 percentage points
from EPZ (t+10) alone.
Table 4.11 Performance of 80 countries using OLS (Growth rates)
DF Estimate SE
EPZ (t-10) 30 -1.161* 0.652
EPZ (t-5) 30 1.106 0.827
EPZ (t) 30 0.520 1.083
EPZ (t+2) 30 0.453 1.196
EPZ (t+5) 30 0.419 0.943
EPZ (t+10) 30 -0.795 0.692
Initial x/GDP % (growth rates) 30 0.308 0.251
Year Dummies (1970-90) 30 Yes
Africa Dummy 30 Yes
+GRULAC Dummy 30 Yes
Asia Dummy 30 Yes
Constant 30 4.509*** (0.872)
Observations 30 1567
R-Squared 30 0.110

128
Using the other success measure, the reported results do not show any significant
explanatory variable to explain growth at 99% CI.
This analysis on a broader set of countries seems to indicate little relationship between
EPZs and exports or economic growth. However, it does not allow us to control for other
factors such as ln Income per Worker, Political Democracy Index, Lomé, Total Factor
Productivity, Transport Costs and Population. The second part analyses the effect of EPZ
on the smaller sample of 38 countries when we control for all the important variables listed
above. Year Dummies and Region Dummies are also included while running these
regressions.
Table 4.12 OLS for 38 countries using x/GDP success measure
DF Estimate SE
EPZ (t) 33 -0.031 0.236
EPZ (t+2) 33 0.029 0.254
EPZ (t-5) 33 -0.280 0.196
EPZ (t-10) 33 0.056 0.162
EPZ (t+5) 33 0.336* 0.199
EPZ (t+10) 33 0.411*** 0.143
Africa Dummy 33 Yes
GRULAC Dummy 33 Yes
Asia Dummy 33 Yes
Initial TFP 33 0.287 0.316
Initial x/GDP(%) 33 1.493*** 0.063
Transport Cost
Dummy
33 0.026 0.204
Constant 33 0.426 0.295
Observations 33 798
R-squared 33 0.645
+ GRULAC – Caribbean and Latin American countries referred to as Latin America
Dependent variable: Ratio of Manufacturing/GDP(%); (standard errors are in parentheses)
* Indicates significance at different % levels: *** p<0.01(99% CI), ** p<0.05 (95% CI), * p<0.1(90% CI)
Results in Table 4.12 show that EPZ (t+10) is again significant, while EPZ (t+5) is
marginally significant, indicating that EPZ starts showing an association with x/GDP only
five years after implementation and that association becomes stronger ten years after the
EPZ has been introduced. The coefficient for EPZ (t+10) is at a high of 0.411.

129
If we compare ln Income per Worker to US (Table 4.13) it will ceteris paribus bring an
estimated absolute change in Y (Ratio of Manufacturing Exports to GDP (%)) by 81.0%
and is highly significant.
Table 4.13 OLS for 38 countries using x/GDP success measure (cont.)
DF Estimate SE
Africa Dummy 27 Yes
GRULAC Dummy 27 Yes
Asia Dummy 27 Yes
Initial TFP 27 -2.424*** 0.421
Initial x/GDP(%) 27 1.376*** 0.063
ln Income per Worker (t-2) 27 0.810*** 0.093
Transport Cost Dummy 27 -0.314 0.201
Constant 27 3.238*** 0.408
Observations 27 798
R-squared 27 0.660
Taking both EPZ and ln Income per Worker, the results in Table 4.14 are obtained. It is
noted that EPZ (t+5), EPZ (t+10) and ln Income per Worker are still significant but the
effect of EPZ on x/GDP drops, meaning that Income per Worker does have an effect on
success.
Table 4.14 OLS for 38 countries using x/GDP success measure (cont.)
DF Estimate SE
EPZ (t) 33 -0.100 0.226
EPZ (t+2) 33 -0.002 0.243
EPZ (t-5) 33 -0.134 0.189
EPZ (t-10) 33 0.229 0.156
EPZ (t+5) 33 0.323* 0.191
EPZ (t+10) 33 0.277** 0.138
Africa Dummy 33 Yes
GRULAC Dummy 33 Yes
Asia Dummy 33 Yes
Initial TFP 33 -2.208*** 0.428
Initial x/GDP(%) 33 1.319*** 0.064
Ln Income per Worker (t-
2)
33 0.798*** 0.100
Transport Cost Dummy 33 -0.517** 0.206
Constant 33 3.405*** 0.417
Observations 33 798
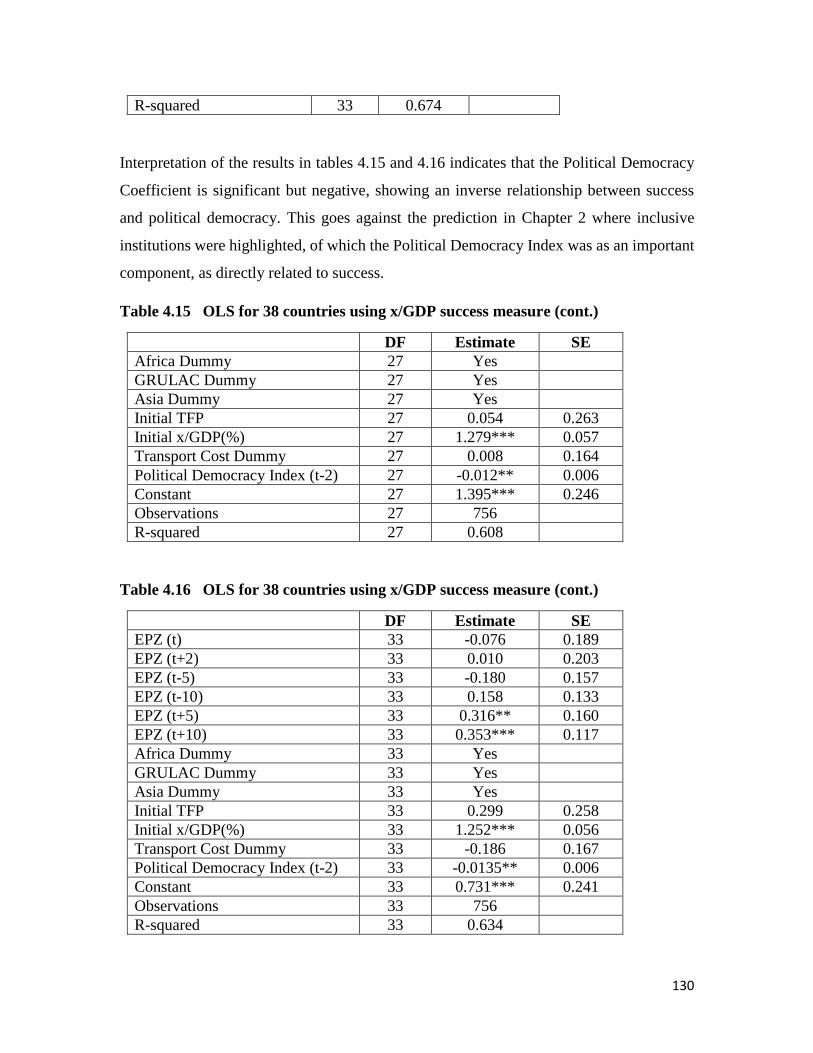
130
R-squared 33 0.674
Interpretation of the results in tables 4.15 and 4.16 indicates that the Political Democracy
Coefficient is significant but negative, showing an inverse relationship between success
and political democracy. This goes against the prediction in Chapter 2 where inclusive
institutions were highlighted, of which the Political Democracy Index was as an important
component, as directly related to success.
Table 4.15 OLS for 38 countries using x/GDP success measure (cont.)
DF Estimate SE
Africa Dummy 27 Yes
GRULAC Dummy 27 Yes
Asia Dummy 27 Yes
Initial TFP 27 0.054 0.263
Initial x/GDP(%) 27 1.279*** 0.057
Transport Cost Dummy 27 0.008 0.164
Political Democracy Index (t-2) 27 -0.012** 0.006
Constant 27 1.395*** 0.246
Observations 27 756
R-squared 27 0.608
Table 4.16 OLS for 38 countries using x/GDP success measure (cont.)
DF Estimate SE
EPZ (t) 33 -0.076 0.189
EPZ (t+2) 33 0.010 0.203
EPZ (t-5) 33 -0.180 0.157
EPZ (t-10) 33 0.158 0.133
EPZ (t+5) 33 0.316** 0.160
EPZ (t+10) 33 0.353*** 0.117
Africa Dummy 33 Yes
GRULAC Dummy 33 Yes
Asia Dummy 33 Yes
Initial TFP 33 0.299 0.258
Initial x/GDP(%) 33 1.252*** 0.056
Transport Cost Dummy 33 -0.186 0.167
Political Democracy Index (t-2) 33 -0.0135** 0.006
Constant 33 0.731*** 0.241
Observations 33 756
R-squared 33 0.634
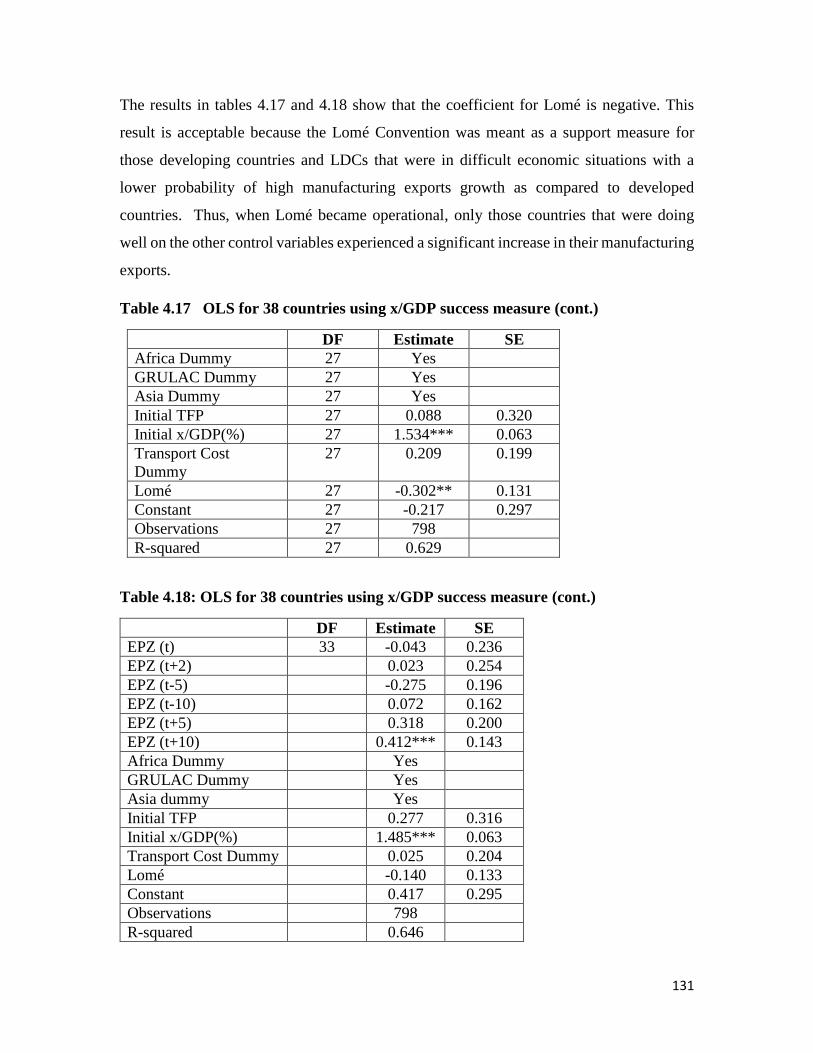
131
The results in tables 4.17 and 4.18 show that the coefficient for Lomé is negative. This
result is acceptable because the Lomé Convention was meant as a support measure for
those developing countries and LDCs that were in difficult economic situations with a
lower probability of high manufacturing exports growth as compared to developed
countries. Thus, when Lomé became operational, only those countries that were doing
well on the other control variables experienced a significant increase in their manufacturing
exports.
Table 4.17 OLS for 38 countries using x/GDP success measure (cont.)
DF Estimate SE
Africa Dummy 27 Yes
GRULAC Dummy 27 Yes
Asia Dummy 27 Yes
Initial TFP 27 0.088 0.320
Initial x/GDP(%) 27 1.534*** 0.063
Transport Cost
Dummy
27 0.209 0.199
Lomé 27 -0.302** 0.131
Constant 27 -0.217 0.297
Observations 27 798
R-squared 27 0.629
Table 4.18: OLS for 38 countries using x/GDP success measure (cont.)
DF Estimate SE
EPZ (t) 33 -0.043 0.236
EPZ (t+2) 0.023 0.254
EPZ (t-5) -0.275 0.196
EPZ (t-10) 0.072 0.162
EPZ (t+5) 0.318 0.200
EPZ (t+10) 0.412*** 0.143
Africa Dummy Yes
GRULAC Dummy Yes
Asia dummy Yes
Initial TFP 0.277 0.316
Initial x/GDP(%) 1.485*** 0.063
Transport Cost Dummy 0.025 0.204
Lomé -0.140 0.133
Constant 0.417 0.295
Observations 798
R-squared 0.646

132
As observed from tables 4.19 and 4.20, Total Factor Productivity is significant.
Table 4.19 OLS for 38 countries using x/GDP success measure (cont.)
DF Estimate SE
Africa Dummy 27 Yes
GRULAC Dummy 27 Yes
Asia Dummy 27 Yes
Initial TFP 27 -5.925*** 0.534
Initial x/GDP(%) 27 1.333*** 0.059
Transport Cost Dummy 27 -0.223 0.183
TFP 27 6.776*** 0.505
Constant 27 -0.340 0.269
Observations 27 798
R-squared 27 0.697
Table 4.20 OLS for 38 countries using x/GDP success measure (cont.)
DF Estimate SE
EPZ (t) 33 -0.027 0.213
EPZ (t+2) 33 0.004 0.229
EPZ (t-5) 33 -0.079 0.178
EPZ (t-10) 33 0.166 0.146
EPZ (t+5) 33 0.351* 0.180
EPZ (t+10) 33 0.150 0.131
Africa Dummy 33 Yes
GRULAC Dummy 33 Yes
Asia Dummy 33 Yes
Initial TFP 33 -5.718*** 0.539
Initial x/GDP(%) 33 1.277*** 0.059
Transport Cost Dummy 33 -0.453** 0.188
TFP 33 6.748*** 0.514
Constant 33 0.055 0.268
Observations 33 798
R-squared 33 0.711
The results in tables 4.21 and 4.22 show that the coefficients for population are negative
and significant.
Table 4.21 OLS for 38 countries using x/GDP success measure (cont.)
DF Estimate SE
Africa Dummy 27 Yes

133
GRULAC Dummy 27 Yes
Asia Dummy 27 Yes
Initial TFP 27 -0.059 0.324
Initial x/GDP(%) 27 1.504*** 0.065
Population (000) 27 -4.11e-06*** 1.48e-06
Transport Cost Dummy 27 0.245 0.198
Constant 27 -0.034 0.304
Observations 27 798
R-squared 27 0.630
Table 4.22 OLS for 38 countries using x/GDP success measure (cont.)
DF Estimate SE
EPZ (t) 33 -0.013 0.235
EPZ (t+2) 33 0.042 0.252
EPZ (t-5) 33 -0.270 0.195
EPZ (t-10) 33 0.027 0.161
EPZ (t+5) 33 0.356* 0.198
EPZ (t+10) 33 0.388*** 0.143
Africa Dummy 33 Yes
GRULAC Dummy 33 Yes
Asia Dummy 33 Yes
Initial TFP 33 0.131 0.318
Initial x/GDP(%) 33 1.432*** 0.065
Population (000) 33 -4.59e-06*** 1.46e-06
Transport Cost Dummy 33 0.018 0.202
Constant 33 1.101*** 0.302
Observations 33 798
R-squared 33 0.650
When the explanatory variable and control variables are regarded together (Table 4.23) to
explain Y, it is found that EPZ (t+5) and (t+10) are still significant, with a coefficient of
0.316 and 0.204 respectively. As far as ln Income per Worker is concerned, the coefficient
is not significant. However, TFP which also includes a component of income of workers
proves to be highly significant. Population is also seen to be significant with a negative
coefficient.
Table 4.23 OLS for 38 countries using x/GDP success measure (cont.)
DF Estimate SE
EPZ (t) 37 -0.064 0.178
EPZ (t+2) 37 -0.024 0.191
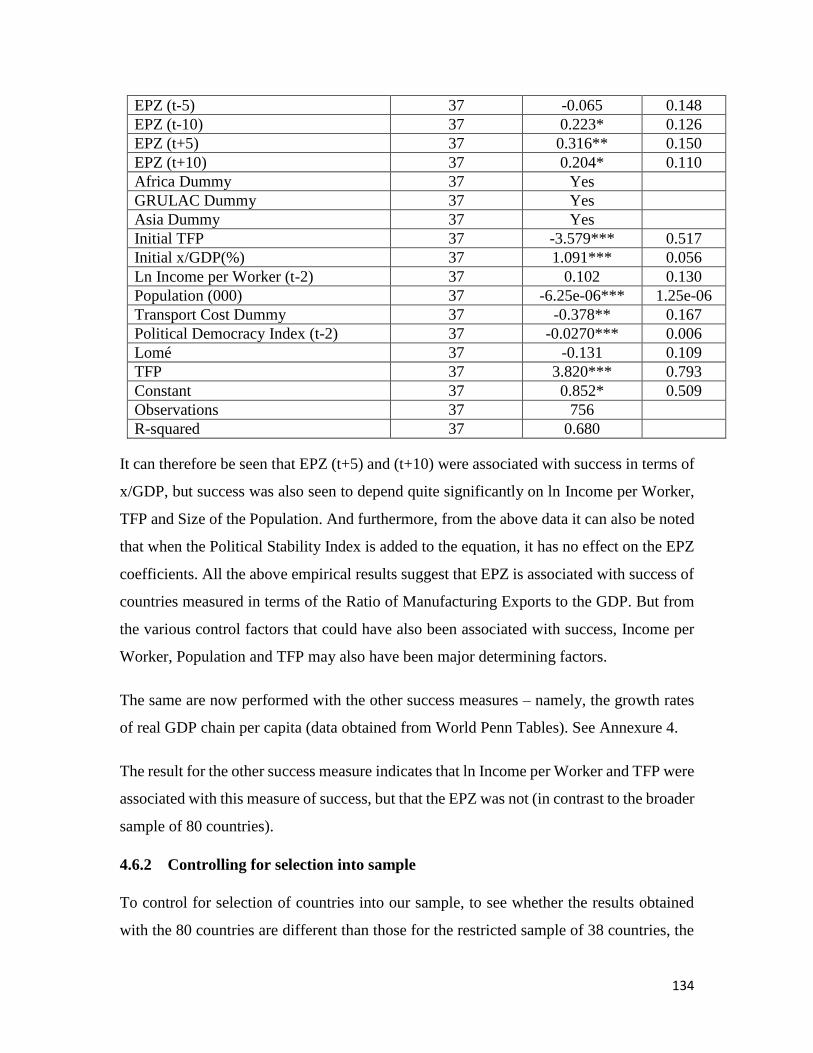
134
EPZ (t-5) 37 -0.065 0.148
EPZ (t-10) 37 0.223* 0.126
EPZ (t+5) 37 0.316** 0.150
EPZ (t+10) 37 0.204* 0.110
Africa Dummy 37 Yes
GRULAC Dummy 37 Yes
Asia Dummy 37 Yes
Initial TFP 37 -3.579*** 0.517
Initial x/GDP(%) 37 1.091*** 0.056
Ln Income per Worker (t-2) 37 0.102 0.130
Population (000) 37 -6.25e-06*** 1.25e-06
Transport Cost Dummy 37 -0.378** 0.167
Political Democracy Index (t-2) 37 -0.0270*** 0.006
Lomé 37 -0.131 0.109
TFP 37 3.820*** 0.793
Constant 37 0.852* 0.509
Observations 37 756
R-squared 37 0.680
It can therefore be seen that EPZ (t+5) and (t+10) were associated with success in terms of
x/GDP, but success was also seen to depend quite significantly on ln Income per Worker,
TFP and Size of the Population. And furthermore, from the above data it can also be noted
that when the Political Stability Index is added to the equation, it has no effect on the EPZ
coefficients. All the above empirical results suggest that EPZ is associated with success of
countries measured in terms of the Ratio of Manufacturing Exports to the GDP. But from
the various control factors that could have also been associated with success, Income per
Worker, Population and TFP may also have been major determining factors.
The same are now performed with the other success measures – namely, the growth rates
of real GDP chain per capita (data obtained from World Penn Tables). See Annexure 4.
The result for the other success measure indicates that ln Income per Worker and TFP were
associated with this measure of success, but that the EPZ was not (in contrast to the broader
sample of 80 countries).
4.6.2 Controlling for selection into sample
To control for selection of countries into our sample, to see whether the results obtained
with the 80 countries are different than those for the restricted sample of 38 countries, the

135
OLS results coefficients for the different EPZ leads/lags for the 80 countries are compared
to those of the 38 countries without the control variables, as shown in tables 4.24 - 4.27 for
both success measures.
Table 4.24 Controlling for selection into sample: (x/GDP) success measure for 80
countries
Estimate SE
EPZ (t-10) 0.0673 0.148
EPZ (t-5) -0.101 0.186
EPZ (t) 0.013 0.237
EPZ (t+2) -0.066 0.261
EPZ (t+5) 0.181 0.207
EPZ (t+10) 0.463*** 0.152
Year Dummies Yes
Africa Dummy Yes
GRULAC Dummy Yes
Asia Dummy Yes
Observations 1,539
R-squared 0.519
Table 4.25 Controlling for selection into sample: (x/GDP) success measure for 38
countries
Estimate SE
EPZ (t-10) 0.168 0.131
EPZ (t-5) -0.196 0.155
EPZ (t) -0.086 0.189
EPZ (t+2) 0.010 0.203
EPZ (t+5) 0.309* 0.159
EPZ (t+10) 0.350*** 0.116
Year Dummies Yes
Africa Dummy Yes
GRULAC Dummy Yes
Asia Dummy Yes
Observations 756
R-squared 0.633
Table 4.26 Controlling for selection into sample: (Growth rates) success measure for
80 countries

136
Estimate SE
EPZ (t-10) -1.161* 0.652
EPZ (t-5) 1.106 0.827
EPZ (t) 0.520 1.083
EPZ (t+2) 0.453 1.196
EPZ (t+5) 0.419 0.943
EPZ (t+10) -0.795 0.692
Year Dummies Yes
Africa Dummy Yes
GRULAC Dummy Yes
Asia dummy Yes
Observations 1,567
R-squared 0.110
Table 4.27 Controlling for selection into sample: (Growth rates) success measure for
38 countries
Estimate SE
EPZ (t-10) -1.362 0.839
EPZ (t-5) 1.029 1.015
EPZ (t) 1.300 1.234
EPZ (t+2) 0.0128 1.328
EPZ (t+5) 0.772 1.042
EPZ (t+10) -0.685 0.750
Year Dummies Yes
Africa dummy Yes
GRULAC dummy Yes
Asia dummy Yes
Observations 798
R-squared 0.162
EPZ (t+10) is significant for both 80 countries and 38 countries using the success measure
x/GDP, while there do not seem to be any significant EPZs for either 80 or 38 countries for
the alternative measure of success, showing that the coefficients are not very different
between the broad sample of 80 countries and the sample of 38. This leads to the conclusion
that there may not have been a selection bias in choosing the 38 from the 80 countries.
4.6.3 EPZ endogeneity issue

137
As shown in the OLS estimates above, the probability of EPZ (especially EPZ (t+10))
affecting x/GDP seems to be significant, with a very high coefficient. However, the probit
results indicate that EPZ may be endogenous and thus related to factors such as
Predisposition to Exports, Political Democracy, Income per Worker and PPP. Even though
we treated EPZ (t+10) as an independent variable in equation (1), we now know that it may
be a function of other factors and its coefficients may be biased.
In this section, a second equation for EPZ as the dependent variable is therefore set up:
EPZ (t+10)=f(exogenous factors, µ)--------------------------------------(2)
EPZ (t+10) will be a function of a set of exogenous factors and the exogenous factors in
equations (1) and (2) are likely to overlap, as it is known that numerous factors in equation
(1) such as Income per Worker, TFP and to a lesser extent Political Stability Index are
clearly associated with both success and EPZ. As mentioned by Timpone (n.d.), the
endogenous factors, in this case Success and EPZ, are related within the larger system.
To address the issue of EPZ endogeneity, an extension of the linear regression model (OLS)
to a two-stage least squares (2SLS) is used.
A two-stage least squares (2SLS) estimator is used with ln Income per Worker, Political
Democracy, Lomé, TFP, PPP as the usual instruments and a new instrument (for instance,
Sino Population (people of Chinese origin) of at least 1% of the total population, which
was randomly chosen, which is likely to affect EPZ but not success). The instrument Sino
Population would be a dummy variable, 1 for Sino population >1% of total population and
0 for <1%. EPZ (t+10) is instrumented. Instrumental variables provide additional
information which allows us to obtain consistent estimates of the parameters of interests.
The instrumental variables are variables that are uncorrelated with the error term and are
used to provide information in place of the endogenous variables on the right-hand side of
the equation (Timpone, n.d.).
The specifications are as follows:
Success=f{EPZ (t+10), control variables (Political Democracy Index, Lomé, ln Income per
Worker, TFP)+ є1 ……….(A)

138
EPZ (t+10)=f{ln Income per Worker, TFP, PPP, Sino)+ є2…….(B)
We check endogeneity using p-values.
The OLS estimation in equation(B) will lead to biased and inconsistent results if Expected
value E(є1, є2) ≠ 0, i.e. if there is overlap in the set of unobserved variables (Z) that affect
outcomes.
Our null and alternate hypothesis may be specified as follows:
H0 : variables are exogenous (Z’ є=0) z is the unobserved variable
HA : variables are endogenous (Z’ є≠0)
It will be attempted to get around the endogeneity issue by performing the 2SLS for the
lag/lead values for the dependent variable, i.e. the success measures. So in this case, if EPZ
(t+10) is used, x/GDP (t+10) will also be used. Similarly, when using EPZ (t+5), x/GDP
(t+5) etc. will be used to compare coefficients’ values with and without the dependent
variable being lagged.
The first stage uses x/GDP, EPZ (t+10) and the usual control variables – namely, ln Income
per Worker, Political Democracy Index, Lomé, TFP and PPP. The second step uses the
same variable, but with the addition of Sino Population of >1% of total population for each
country. The reason for the addition of Sino Population is that in the success stories of
many EPZ countries, especially in Africa, it seems that most of the initial investments and
the groundwork were done by the Chinese population of these countries that had diaspora
links with China. The instrument Sino Population may thus have an effect on EPZ, but not
on the success measures x/GDP and growth.
Table 4.28 2SLS to test for endogeneity
sino_countriesInstruments: ln_income political_stability_index Lome TFP PPPInstrumented: EPZ_tenyrsafter _cons -1.603764 2.267057 -0.71 0.479 -6.047115 2.839586 TFP 2.445975 2.435536 1.00 0.315 -2.327588 7.219538 Lome -.1249482 .2411189 -0.52 0.604 -.5975324 .3476361political_~x -.017715 .015987 -1.11 0.268 -.0490489 .0136189 ln_income -.3442027 .5754136 -0.60 0.550 -1.471993 .7835872EPZ_tenyr~er 4.797787 1.393573 3.44 0.001 2.066434 7.529141 ratio_manu~P Coef. Std. Err. z P>|z| [95% Conf. Interval]
Root MSE = 2.1045 R-squared = . Prob > chi2 = 0.0000 Wald chi2(5) = 53.08Instrumental variables (2SLS) regression Number of obs = 756
> ies). ivregress 2sls ratio_manufacturingexp_GDP ln_income political_stability_index Lome TFP (EPZ_tenyrsafter=ln_income political_stability_index PPP sino_countr
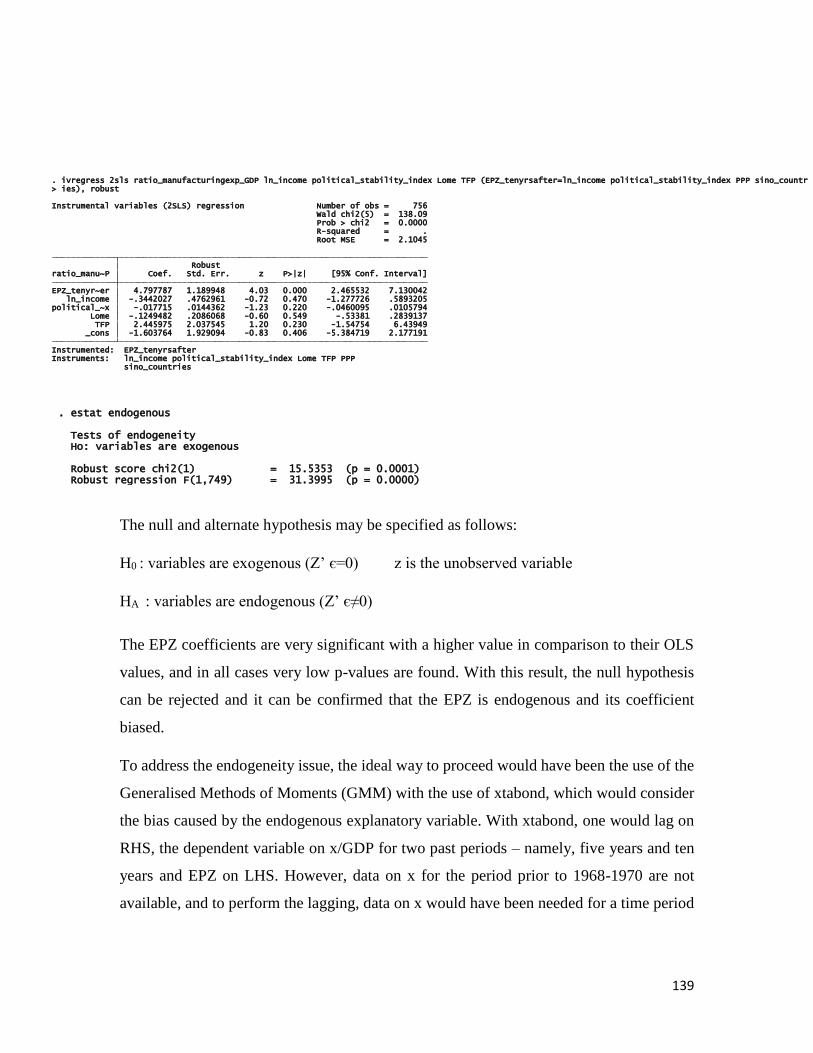
139
Robust regression F(1,749) = 31.3995 (p = 0.0000) Robust score chi2(1) = 15.5353 (p = 0.0001)
Ho: variables are exogenous Tests of endogeneity
. estat endogenous
The null and alternate hypothesis may be specified as follows:
H0 : variables are exogenous (Z’ є=0) z is the unobserved variable
HA : variables are endogenous (Z’ є≠0)
The EPZ coefficients are very significant with a higher value in comparison to their OLS
values, and in all cases very low p-values are found. With this result, the null hypothesis
can be rejected and it can be confirmed that the EPZ is endogenous and its coefficient
biased.
To address the endogeneity issue, the ideal way to proceed would have been the use of the
Generalised Methods of Moments (GMM) with the use of xtabond, which would consider
the bias caused by the endogenous explanatory variable. With xtabond, one would lag on
RHS, the dependent variable on x/GDP for two past periods – namely, five years and ten
years and EPZ on LHS. However, data on x for the period prior to 1968-1970 are not
available, and to perform the lagging, data on x would have been needed for a time period
sino_countriesInstruments: ln_income political_stability_index Lome TFP PPPInstrumented: EPZ_tenyrsafter _cons -1.603764 1.929094 -0.83 0.406 -5.384719 2.177191 TFP 2.445975 2.037545 1.20 0.230 -1.54754 6.43949 Lome -.1249482 .2086068 -0.60 0.549 -.53381 .2839137political_~x -.017715 .0144362 -1.23 0.220 -.0460095 .0105794 ln_income -.3442027 .4762961 -0.72 0.470 -1.277726 .5893205EPZ_tenyr~er 4.797787 1.189948 4.03 0.000 2.465532 7.130042 ratio_manu~P Coef. Std. Err. z P>|z| [95% Conf. Interval] Robust
Root MSE = 2.1045 R-squared = . Prob > chi2 = 0.0000 Wald chi2(5) = 138.09Instrumental variables (2SLS) regression Number of obs = 756
> ies), robust. ivregress 2sls ratio_manufacturingexp_GDP ln_income political_stability_index Lome TFP (EPZ_tenyrsafter=ln_income political_stability_index PPP sino_countr

140
as far back as 1960. Most of the countries in the sample do not have disaggregated data
going back as far as that.
4.7 Did EPZs have an impact on economic success?
To analyse whether there is a real difference in our success measures with and without an
EPZ, all 80 countries are taken and divided into two groups, the first 40 are those countries
that had an average value greater than or equal to 0.85% for x/GDP measure of success,
and the second group for those countries with an average value x/GDP less than 0.85%. A
similar exercise is carried out for the alternative measure of success (growth rates of real
GDP) with the first group consisting of those countries that had an average growth rate of
2.18% or higher. The results are shown in the table in Annexure 5.
The results for both success measures indicate that 17 out of 33 countries that had an EPZ
were in the first group of successful countries, while the remaining 16 were in the second
group of less successful countries for both success measures. This raises serious questions
about whether EPZs had any real impact on the economic success achieved by individual
countries.
4.8 Incentives offered by EPZs
From the OLS results, there were some indications that countries do better five to ten years
after EPZ implementation. One explanation for this could be that EPZs are not
homogeneous, but differ across a number of dimensions. For instance, there may be
differences in the incentives offered by the various EPZs, making some EPZs more
attractive than others. One should also consider the types of EPZ zones and see whether
one type was yielding better results than another.
Looking at the major incentives offered by EPZs in different countries, it is noted that
successful and non-successful EPZs countries offered nearly similar fiscal, physical and
administrative incentives, such as tax holidays, duty-free imports and exports, no
restrictions on repatriation of profits and one-stop shop facilities. Table 4.29 gives a
comparative profile of some EPZs and the incentives that they offered prior to 1990 (except
Trinidad and Tobago, which started their EPZ in 1990). It is notable from the last row of

141
the table that countries that provided more of these facilities were not necessarily more
successful in terms of our measure of success, i.e. ratio of x/GDP. The incentives appear
to act more as a facilitator to the establishment and smooth running of the EPZs rather than
be causal in the EPZ’s success.
Table 4.29 Incentives offered for EPZs
Country /
Incentives Malaysia Korea Philippines
Sri
Lanka Jamaica
Trinidad
and
Tobago
Dominican
Republic Mauritius
Tax
Exemption Yes Yes Yes Yes Yes Yes Yes
No (15%
corporate
tax)
Tax holiday 8-10
years
5
years 4-6 years 5-15 years Indefinite -----
15-20
years 20 years
Duty-free
on imports:
equipment,
machinery,
parts/spare
parts, raw
materials
Yes to all Yes to
all Yes to all
Yes to all
except
machinery
Yes to all
except
machinery
Yes to all
except
machinery
Yes to all
except
machinery
Yes to all
Duty-free
exports Yes Yes Yes Yes Yes Yes Yes Yes
Unrestricted
repatriation
of profits
-- -- Yes -- Yes -- -- Yes
Reducing
red tape:
simple
procedure
or one-stop
shop
Yes Yes Yes -- Yes -- -- Yes
Average
x/GDP %
(for years
1985-90)
3.11 3.54 1.05 1.57 0.22 1.7 2.08 1.8
Source: Kusago (2008)
Although countries differed slightly on their tax holiday period, it is noted that all countries
that had EPZs were invariably providing duty-free facilities on both imports and exports,
and bureaucratic red tape was being reduced.

142
4.9 Types of EPZs
The World Economic Processing Zones Association (WEPZA) divides EPZ in four
categories, as indicated in Table 4.30.
Table 4.30 Types of EPZ
Zone type Definition
Wide Area (WA) These are large zones with a resident population, such as the Chinese
Special Economic Zones or new cities.
Small Area (SA)
Zones that are generally smaller than 1000 ha and are normally
surrounded by a fence. Investors must locate within the zone to receive
benefits. There is no resident population, although they may contain
worker dormitories.
Industry Specific
(IS)
Zones that are created to support the needs of a specific industry, such as
banking, jewellery, oil and gas, electronics, textiles, tourism, etc.
Companies invested in the zone may be located anywhere and receive
benefits. Examples include India's Jewellery Zones, or many offshore
banking zones.
Performance
Specific (PS)
Zones that admit only investors who meet certain performance criteria
such as degree of exports, level of technology, size of investment, etc.
Companies can be located anywhere. Examples include India's export-
oriented factories, the Mexico Maquila programme, or a research park.
Source: WEPZA website: http://www.wepza.org/
From the list of 38 countries included in the study, 21 had EPZs. The types of EPZ for each
country are indicated in Table 4.31.
Table 4.31 Types of EPZ compared by success measure
Country WA SA IS PS
Average
x/GDP
1985-90
Average
Growth
rates (%)
Colombia * 0.64 1.71
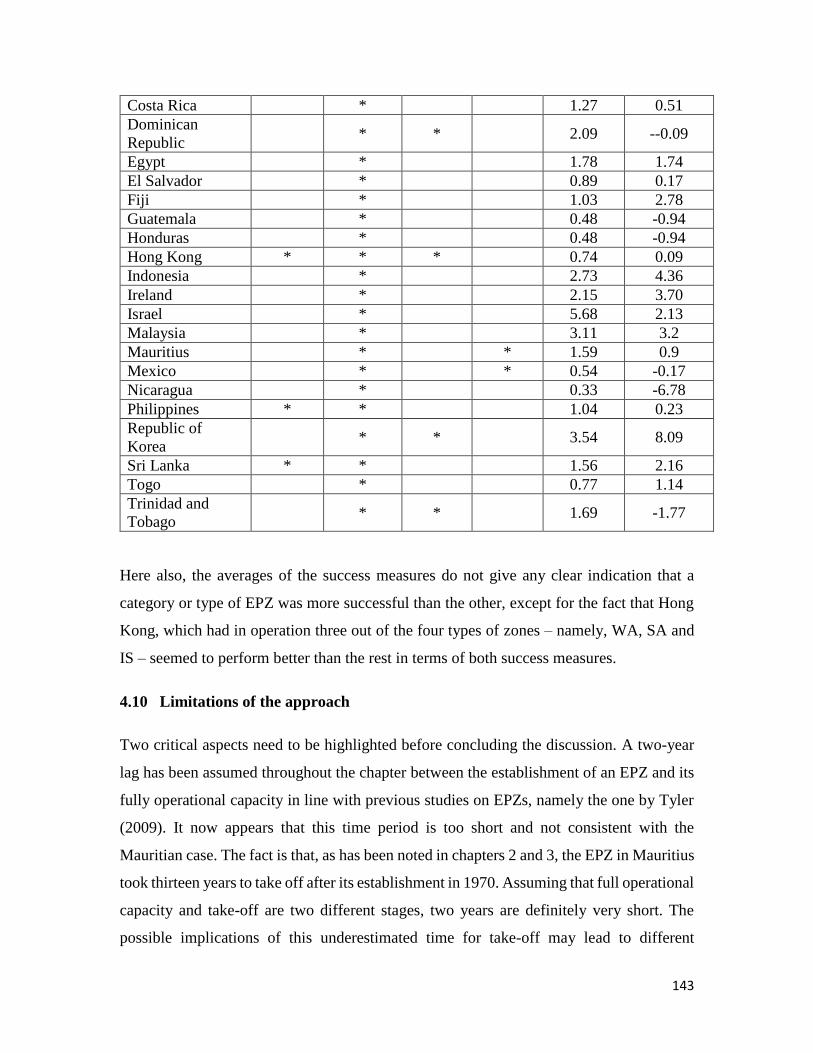
143
Costa Rica * 1.27 0.51
Dominican
Republic * * 2.09 --0.09
Egypt * 1.78 1.74
El Salvador * 0.89 0.17
Fiji * 1.03 2.78
Guatemala * 0.48 -0.94
Honduras * 0.48 -0.94
Hong Kong * * * 0.74 0.09
Indonesia * 2.73 4.36
Ireland * 2.15 3.70
Israel * 5.68 2.13
Malaysia * 3.11 3.2
Mauritius * * 1.59 0.9
Mexico * * 0.54 -0.17
Nicaragua * 0.33 -6.78
Philippines * * 1.04 0.23
Republic of
Korea * * 3.54 8.09
Sri Lanka * * 1.56 2.16
Togo * 0.77 1.14
Trinidad and
Tobago * * 1.69 -1.77
Here also, the averages of the success measures do not give any clear indication that a
category or type of EPZ was more successful than the other, except for the fact that Hong
Kong, which had in operation three out of the four types of zones – namely, WA, SA and
IS – seemed to perform better than the rest in terms of both success measures.
4.10 Limitations of the approach
Two critical aspects need to be highlighted before concluding the discussion. A two-year
lag has been assumed throughout the chapter between the establishment of an EPZ and its
fully operational capacity in line with previous studies on EPZs, namely the one by Tyler
(2009). It now appears that this time period is too short and not consistent with the
Mauritian case. The fact is that, as has been noted in chapters 2 and 3, the EPZ in Mauritius
took thirteen years to take off after its establishment in 1970. Assuming that full operational
capacity and take-off are two different stages, two years are definitely very short. The
possible implications of this underestimated time for take-off may lead to different

144
interpretation of results. For instance, if a country’s economy is in a bad situation and an
EPZ is established and if the EPZ is successful only after thirteen years, as was the case for
Mauritius, using the two-year lag would lead to the misleading conclusion that the EPZ
after two years of establishment did not have any impact.
The second issue is the pooled data used for the regressions. Pooled data do not account
for the evolutionary process whereby, for example, having an EPZ in a given country in
1980 is not the same as having the same EPZ ten years later, which could have a substantial
impact on the economy in 1990. An EPZ is set to evolve and may develop some self-
augmenting forces over time and pooling data do not account for this. Thus, in reality, an
EPZ in year x after establishment and year x+10 after establishment are thus two different
variables providing different results. This is in essence the problem that a researcher may
face and is unaccounted within pooled data sets.
4.11 Conclusion
This chapter has demonstrated that from a general perspective countries that have adopted
an EPZ seem to be more successful than those without EPZs. The empirical analysis
undertaken here has sought to shed light on the direction of this association: is it the
adoption of EPZs that lead to success, or does economic success lead to the adoption of
EPZs? First of all, the probit results indicated that those countries that would adopt an EPZ
within the next five years were already performing well in terms of Ratio of Manufacturing
Exports and Political Democracy, and they were competitive in terms of Income per
Worker and PPP. Although the OLS revealed a strong association between EPZ (t+10) and
success, there were also indications that ln Income per Worker and Productivity were
associated with success as well. The 2SLS results indicate that EPZ was itself
endogenously determined by other factors, which would bias upwards its influence on
success. Finally, comparing the average values of both success measures for all 80
countries showed that implementing an EPZ appears to have made little difference to
comparative success.
All these results were first derived from a dataset of 80 countries, but this was eventually
reduced to 38 countries to analyse the control variables. The empirical results confirm that

145
there is no general association between EPZ and success. This should, however, not stop
one from thinking about possible scenarios regarding the effect of EPZ on success. The
first scenario, which was confirmed by the probit results, is that those countries that were
successful and had an EPZ would have experienced some success anyway with or without
an EPZ. The second is the possibility that EPZs were adopted by countries that were already
set up for success, but EPZs nevertheless contributed in some way to the scale of success.
Though our empirical results do not show an association between EPZ implementation and
success, the question remains whether Mauritius would have been as successful as it has
been if it had not adopted the EPZ.
The fact is that the previous chapters have shown that there is a clear association between
certain factors and the creation of an EPZ. For instance, as demonstrated in Chapter 2, we
now know that the successful creation of an EPZ in Mauritius occurred because of the
positive environment created by the inclusive institutions in Mauritius and other traditional
political economic factors. The existence of these factors, together with the low wages
and/or timely application of the preferences framework, fuelled the exceptional take-off of
the EPZ in Mauritius during the early 1980s, which led to the economic success of
Mauritius, confirmed by the fact that Mauritius was at that time the only country in Africa
which implemented an EPZ with success. However, this chapter has not been able to
provide us with evidence with regard to the association between a successful EPZ and a
successful economy. A very interesting question now is to ask what happened to the
Mauritian EPZ once the preferences were removed during the early years of the new
millennium, and how the removal of the preferences affected the different industries in the
manufacturing sector in Mauritius. This will be the focus of the next chapter.

146
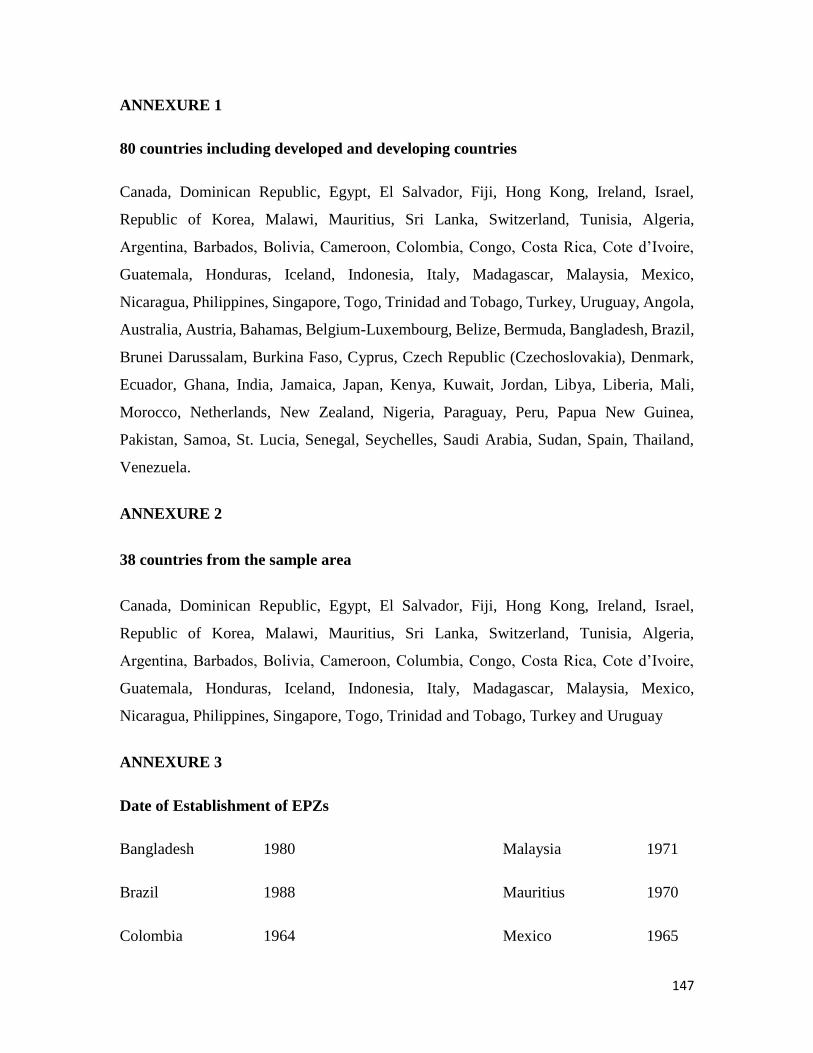
147
ANNEXURE 1
80 countries including developed and developing countries
Canada, Dominican Republic, Egypt, El Salvador, Fiji, Hong Kong, Ireland, Israel,
Republic of Korea, Malawi, Mauritius, Sri Lanka, Switzerland, Tunisia, Algeria,
Argentina, Barbados, Bolivia, Cameroon, Colombia, Congo, Costa Rica, Cote d’Ivoire,
Guatemala, Honduras, Iceland, Indonesia, Italy, Madagascar, Malaysia, Mexico,
Nicaragua, Philippines, Singapore, Togo, Trinidad and Tobago, Turkey, Uruguay, Angola,
Australia, Austria, Bahamas, Belgium-Luxembourg, Belize, Bermuda, Bangladesh, Brazil,
Brunei Darussalam, Burkina Faso, Cyprus, Czech Republic (Czechoslovakia), Denmark,
Ecuador, Ghana, India, Jamaica, Japan, Kenya, Kuwait, Jordan, Libya, Liberia, Mali,
Morocco, Netherlands, New Zealand, Nigeria, Paraguay, Peru, Papua New Guinea,
Pakistan, Samoa, St. Lucia, Senegal, Seychelles, Saudi Arabia, Sudan, Spain, Thailand,
Venezuela.
ANNEXURE 2
38 countries from the sample area
Canada, Dominican Republic, Egypt, El Salvador, Fiji, Hong Kong, Ireland, Israel,
Republic of Korea, Malawi, Mauritius, Sri Lanka, Switzerland, Tunisia, Algeria,
Argentina, Barbados, Bolivia, Cameroon, Columbia, Congo, Costa Rica, Cote d’Ivoire,
Guatemala, Honduras, Iceland, Indonesia, Italy, Madagascar, Malaysia, Mexico,
Nicaragua, Philippines, Singapore, Togo, Trinidad and Tobago, Turkey and Uruguay
ANNEXURE 3
Date of Establishment of EPZs
Bangladesh 1980 Malaysia 1971
Brazil 1988 Mauritius 1970
Colombia 1964 Mexico 1965

148
Costa Rica 1977 Nicaragua 1976
Cyprus 1982 Pakistan 1983
Dominican Republic 1965 Philippines 1972
Egypt 1976 Republic of Korea 1970
El Salvador 1973 Senegal 1974
Fiji 1987 Spain 1950
Guatemala 1971 Sri Lanka 1977
Honduras 1972 St. Lucia 1986
Hong Kong 1960s Togo 1989
India 1965 Trinidad and Tobago 1990
Indonesia 1973 Singapore before 1970
Ireland 1966
Israel 1970
Jamaica 1976
Jordan 1973
Kenya 1990
Liberia 1975
Source: World Bank (1992) Industry and Energy Department. Industry Development
Division, World Bank Country Economics Dept. Trade Policy Division.

149
ANNEXURE 4
OLS for 38 countries using growth rates success measure
DF-32 (2) DF-27 (3) DF-33 (4)DF-27 (5) DF-33 (6) DF-27 (7) DF-33
EPZ (t) 1.283 1.156 1.362 1.290
(1.236) (1.231) (1.250) (1.238)
EPZ (t+2) 0.00981 -0.0464 0.0440 0.0129
(1.329) (1.323) (1.346) (1.330)
EPZ (t-5) 0.934 1.203 1.018 0.931
(1.026) (1.026) (1.040) (1.027)
EPZ (t-10) -1.293 -0.976 -1.207 -1.303
(0.847) (0.851) (0.877) (0.852)
EPZ (t+5) 0.779 0.754 0.890 0.790
(1.044) (1.039) (1.057) (1.049)
EPZ (t+10) -0.693 -0.940 -0.852 -0.694
(0.751) (0.753) (0.771) (0.751)
Africa Dummy -0.588 -0.115 0.161 -0.307 0.0855 -0.725 -0.610
(0.800) (0.839) (0.840) (0.916) (0.928) (0.822) (0.821)
GRULAC Dummy -1.638** -1.005 -1.414** -1.190* -1.578** -1.323** -1.645**
(0.635) (0.612) (0.637) (0.667) (0.732) (0.603) (0.638)
Asia Dummy 1.647** 2.286*** 1.748** 2.253*** 1.824** 2.040** 1.641*
(0.837) (0.797) (0.834) (0.847) (0.907) (0.795) (0.839)
Initial TFP 0.642 -4.052* -3.949* -0.0541 0.628 0.0805 0.648
(1.656) (2.262) (2.328) (1.701) (1.709) (1.653) (1.658)
Initial x/GDP(%) 0.364 0.216 0.0442 0.387 0.224 0.480 0.369
(0.328) (0.340) (0.346) (0.367) (0.368) (0.326) (0.330)
Ln Income per Worker (t-2)
1.333*** 1.469***
(0.501) (0.526)
Population (000)
Transport Cost Dummy
0.446 0.547 -0.554 1.069 -0.134 1.413 0.446
(1.067) (1.077) (1.121) (1.062) (1.105) (1.028) (1.067)
Political Democracy Index (t-2)
0.0442 0.0506
(0.0363) (0.0371)
Lomé -0.438 0.0814
(0.676) (0.699)
TFP

150
Constant 2.601* 4.489** 5.087** 0.116 3.005* 2.716* 2.605*
(1.543) (2.187) (2.270) (1.593) (1.595) (1.534) (1.544)
Observations 798 798 798 756 756 798 798
R-squared 0.162 0.156 0.171 0.140 0.158 0.149 0.162 + GRULAC – Caribbean and Latin American countries referred to as Latin America
Dependent variable: Ratio of Manufacturing/GDP(%); (standard errors are in parentheses)
* Indicates significance at different % levels: *** p<0.01(99% CI), ** p<0.05 (95% CI), * p<0.1(90% CI)
OLS for 38 countries using growth rates success measure (cont.)
(8) DF-27 (9) DF-33 (10)DF-27 (11) DF-33 (12) DF-37
EPZ (t) 1.286 1.267 1.121
(1.234) (1.237) (1.250)
EPZ (t+2) -0.0108 -0.00188 0.0202
(1.327) (1.330) (1.341)
EPZ (t-5) 1.106 0.925 1.209
(1.028) (1.026) (1.040)
EPZ (t-10) -1.199 -1.269 -0.920
(0.847) (0.849) (0.884)
EPZ (t+5) 0.792 0.763 0.780
(1.042) (1.045) (1.057)
EPZ (t+10) -0.916 -0.674 -0.994
(0.758) (0.752) (0.776)
Africa Dummy -0.516 -0.217 -0.709 -0.508 1.569
(0.819) (0.821) (0.812) (0.815) (1.073)
GRULAC Dummy -1.052* -1.358** -1.260** -1.578** -0.933
(0.626) (0.650) (0.610) (0.646) (0.789)
Asia Dummy 2.243*** 1.822** 1.942** 1.614* 1.926**
(0.805) (0.840) (0.796) (0.840) (0.922)
Initial TFP -4.231 -4.479 0.334 0.776 -0.664
(3.045) (3.120) (1.675) (1.677) (3.641)
Initial x/GDP(%) 0.353 0.180 0.601* 0.416 0.0571
(0.336) (0.341) (0.337) (0.343) (0.397)
Ln Income per Worker (t-2)
2.144**
(0.911)
Population (000) 6.97e-06 3.94e-06 1.62e-05*
(7.67e-06) (7.69e-06) (8.82e-06)
Transport Cost Dummy
1.124 0.0366 1.440 0.452 -1.331
(1.043) (1.086) (1.026) (1.067) (1.175)
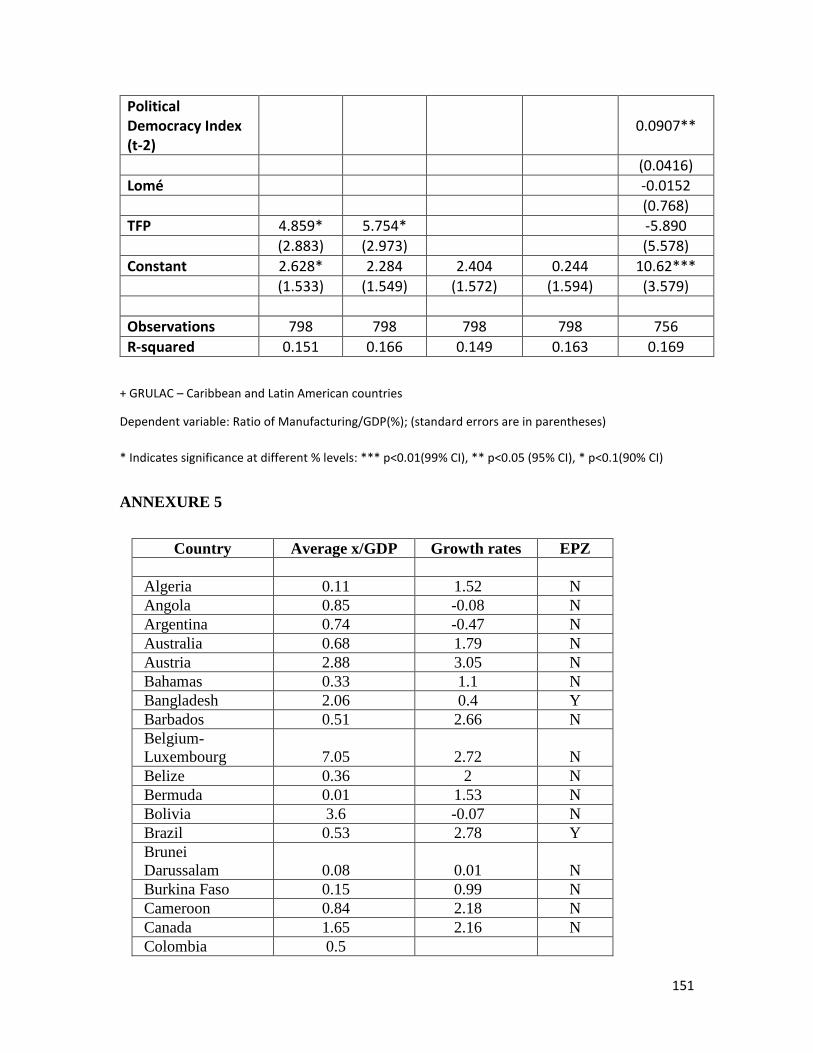
151
Political Democracy Index (t-2)
0.0907**
(0.0416)
Lomé -0.0152
(0.768)
TFP 4.859* 5.754* -5.890
(2.883) (2.973) (5.578)
Constant 2.628* 2.284 2.404 0.244 10.62***
(1.533) (1.549) (1.572) (1.594) (3.579)
Observations 798 798 798 798 756
R-squared 0.151 0.166 0.149 0.163 0.169
+ GRULAC – Caribbean and Latin American countries
Dependent variable: Ratio of Manufacturing/GDP(%); (standard errors are in parentheses)
* Indicates significance at different % levels: *** p<0.01(99% CI), ** p<0.05 (95% CI), * p<0.1(90% CI)
ANNEXURE 5
Country Average x/GDP Growth rates EPZ
Algeria 0.11 1.52 N
Angola 0.85 -0.08 N
Argentina 0.74 -0.47 N
Australia 0.68 1.79 N
Austria 2.88 3.05 N
Bahamas 0.33 1.1 N
Bangladesh 2.06 0.4 Y
Barbados 0.51 2.66 N
Belgium-
Luxembourg 7.05 2.72 N
Belize 0.36 2 N
Bermuda 0.01 1.53 N
Bolivia 3.6 -0.07 N
Brazil 0.53 2.78 Y
Brunei
Darussalam 0.08 0.01 N
Burkina Faso 0.15 0.99 N
Cameroon 0.84 2.18 N
Canada 1.65 2.16 N
Colombia 0.5

152
Colombia 0.5 2.2 Y
Congo 1.1 -1.68 N
Costa Rica 1.04
Costa Rica 1.05 0.98 Y
Cote d'Ivoire 0.62
Cote D'Ivoire 0.6 0.88 N
Cyprus 0.83 4.97 N
Czech Republic 2.2 N
Denmark 0.97 2 N
Dominican
Republic 1.37 3 Y
Ecuador 0.09 2.25 N
Egypt 1.24 3.6 Y
El Salvador 0.83 -0.04 Y
Fiji 0.57 2.61 Y
Ghana 1.92 1.4 N
Guatemala 0.59 0.97 Y
Honduras 0.65 1.41 Y
Hong Kong 6.86 6.15 Y
Iceland 1.51 3.71 N
India 1.32 2.24 Y
Indonesia 1.16 5.37 Y
Ireland 1.5 2.66 Y
Israel 4 2.08 Y
Italy 1.31 2.9 N
Jamaica 0.22 0.65 Y
Japan 0.96 3.61 N
Jordan 1.28 1.09 Y
Kenya 0.92 0.31 Y
Kuwait 0.5 -4.8 N
Liberia 0.05 -4.3 Y
Libya -4.5 -9.5 N
Madagascar 0.33 0.11 N
Malawi 0.54 0.69 N
Malaysia 3.5 5.55 Y
Mali 0.09 2.35 N
Mauritius 0.9 4.63 Y
Mexico 0.31 1.8 Y
Morocco 0.68 2.6 N
Netherlands 2.32 2.01 N
New Zealand 1.07 0.82 N
Nicaragua 0.46 -1.55 Y
Nigeria 0.08 0.3 N
Pakistan 3 3.12 Y

153
Papua New
Guinea 0.4 2.26 N
Paraguay 0.32 3.2 N
Peru 1.4 -0.77 N
Philippines 0.68 1.47 Y
Republic of
Korea 2.54 6.9 Y
Samoa 0.05 0.94 N
Saudi Arabia 0.09 2.51 N
Senegal 0.67 -0.22 Y
Seychelles -0.13 5.33 N
Singapore 4.85 6.49 Y
Spain 0.8 2.64 Y
Sri Lanka 0.66 2.85 Y
St Lucia 1.6 3.67 Y
Sudan 0.17 -0.64 N
Switzerland 1.89 1.77 N
Thailand 1.94 5.56 N
Togo 0.81 -0.72 Y
Trinidad and
Tobago 0.75 0.13 Y
Tunisia 1.01 2.48 N
Turkey 0.83 2.31 N
Uruguay 1.24 0.42 N
Venezuela 0.61 -0.14 N
17 EPZ countries had average values of x/GDP >0.85% compared to 16 for average x/GDP
<0.85%
Similar results are found for average growth rates of real GDP, but for values > or < 2.18%

154
References
Cling, J.P & Letilly, G. (2001). “Export Processing Zones: A Threatened Instrument for
Global Economy Insertion”, DIAL Working Paper No: 2001/17, CIPRE Research Unit,
cited in the World Bank, Special Economic Zones: Performance, Lessons Learned, and
Implications for Zone Development, (Washington, DC: World Bank, April 2008), p.12.
Dollar, D. (1992). “Outward-oriented Developing Economies Really Do Grow More
Rapidly: Evidence from 95 LDCs: 1976-1985”. Economic Development and Cultural
Change 40: 523-544.
Edwards, S. (1998). “Openness Productivity and Growth: What Do We Really Know?”
Economic Journal, 108: 383-398.
Hamada, K. (1974). “An Economic Analysis of the Duty-Free Zone”. Journal of
International Economics, 4: 225-241.
Heston, A. (2009). “Penn World Table Version 6.3”, Center for International Comparisons
of Production, Income and Prices at the University of Pennsylvania.
Irwin, D.A & Tervio, M. (2002). “Does trade raise income? Evidence from the twentieth
century”. Journal of International Economics 58: 1-18.
Johansson, H. and Nilsson, L. (1997). “Export processing zones as catalysts”. World
Development, 25(12): 2115-28.
Kusago, T. & Tazannatos, Z. (1998). “Export Processing Zones: A Review in Need of
Update” Social Protection Discussion Paper No. 9802, Social Protection Group, Human
Development Network. Washington, DC: The World Bank.
Madani, D. (1999). A Review of the Role and Impact of Export Processing Zones.
Washington, DC: World Bank.

155
Miyagiwa, K. (1986). “A Reconsideration of the Welfare Economics of Free Trade Zone”.
Journal of International Economics, 21: 337-350.
Nagler, J (1999). “Notes on Simultaneous Equations and Two Stage Least Squares
Estimates” available at http://www.nyu.edu/classes/nagler/quant2/notes/2slsnotes_oh.pdf
Polity Score Website: http://www.systemicpeace.org/polity/polity4.htm.
Probit regression STATA: http://www.ats.ucla.edu/stat/stata/output/Stata_probit.htm.
Radelet, S. (1999). “Manufactured exports, export platforms, and economic growth.”
Cambridge, MA: HIID. Mimeo, available at
http://www.cid.harvard.edu/caer2/htm/content/papers/confpubs/paper43/paper43.pdf
Real Historical Gross Domestic Product (GDP) and Growth Rates of GDP for Baseline
Countries/Regions (in billions of 2005 dollars) 1969-2010; Source: World Bank World
Development Indicators, International Financial Statistics of the IMF, HS Global Insight
and Oxford Economic Forecasting as well as estimated and projected values developed by
the Economic Research Service all converted to a 2005 base year complied by Dr Matthew
Shane.
Rodriguez, F. & Rodrik, D. (2000). “Trade Policy and Economic Growth. A skeptic’s guide
to the cross-national evidence”. University of Maryland and Harvard University available
at http://www.hks.harvard.edu/fs/drodrik/Research%20papers/skepti1299.pdf
Romer, P. (1993). “Idea gaps and object gaps in economic development”. Journal of
Monetary Economics, 32: 543-573.
Timpone, R.J. (n.d.) “Concerns with Endogeneity in Statistical Analysis: Modeling the
Interdependence between Economic Ties and Conflict”, Department of Political Science,
The Ohio State University. Available at http://people.duke.edu/~gelpi/timpone.pdf

156
Tyler, W. & Negrete, A. (2009). “Economic Growth and Export Processing Zones: An
Empirical Analysis of Policies to Cope with Dutch Disease”, LASA 2009 Congress, Rio
de Janeiro.
United Nations Industrial Development Organisation, “Income per Worker compared to
US”. Available at http://www.unido.org/
United Nations Statistics Division, Commodity Trade Statistics Database (COMTRADE)
available at http://comtrade.un.org/db/
WEPZA. Available at http://www.wepza.org.
World Bank (1992). Industry and Energy Department. Industry Development Division,
World Bank Country Economics Dept. Trade Policy Division. Washington, DC: World
Bank.

157
CHAPTER 5
THE IMPACT OF THE REMOVAL OF TRADE PREFERENCES ON THE
EPZ (EOE) AND THE TEXTILE AND APPAREL SECTORS IN MAURITIUS
5.1 Introduction
One of the direct effects of the Multi-Fibre Agreement (MFA) is the development of many
new textile and apparel industries in countries that might not have entered this market in a
quota-free environment. Mauritius may be regarded as one of the countries that seized the
opportunities offered by the MFA. The country benefited indirectly from the MFA and
directly from the Lomé Convention, which gave it duty-free and quota-free access to the
EU market. The MFA imposed quota restrictions on countries wishing to enter the EU. The
trade preferences that Mauritius enjoyed before 2005 were of significant benefit to the
textile and apparel sectors, which represented more than 85% of EPZ exports.
However, after the creation of the WTO in 1995, the MFA was gradually phased out,
culminating in the complete removal of all quotas in 2005. The quota-free access that gave
Mauritius an edge over low-cost producers of textile and apparel was no longer available.
Mauritius was in direct competition for access to the EU market with big low-cost
producers such as India and China.
A data analysis of the evolution of the Mauritian manufacturing sector and its various
product groups will be carried out in this chapter for the period during and after the MFA
phase-out. The chapter will analyse whether those products that were under preferences
prior to 2005 experienced a sudden fall in exports after the preferences had been removed.
The difference-in-difference estimation technique is used to compare the textile and
apparel sectors in Mauritius with other sectors and ascertain the real effects of the removal
of the preferences, which will be defined as the treatment effect.
The chapter begins by reviewing existing studies of the effects of the MFA phase-out.
These generally reveal net welfare losses for countries such as Mauritius and benefits for

158
China and India. They also stress the shift in FDIs to low-cost producing countries such as
India and China.
The chapter then moves on to an analysis of the two main performance indicators for
Mauritius– namely, exports and employment for the period 2000-2010, and looks at how
different products have been affected in different ways. Next, a comparison of countries’
exports which had EPZs similar to Mauritius is carried out to provide a list of countries
that have been or will become direct competitors to Mauritius in the more deregulated
global trading environment.
The difference-in-difference estimates comparing changes in textiles and apparel sectors
with other sectors are used to analyse further the impact of the preferences removal. The
estimates provide an insight into the real differences between these two groups as a result
of the removal of preferences. Although the results show without any doubt that removal
of preferences had an impact, the negative effect on the performance indicators was less
than might have been expected. This chapter therefore shows that, contrary to existing
perspectives, Mauritius did not suffer major losses from the phasing out of the MFA. The
chapter concludes that the Mauritius textile and apparel sector did not fare as badly as some
might have expected, principally as a result of the diversification of the exports towards
non-EU markets. Mauritius also moved towards niche products with a new emphasis on
quality and high-end products, as proponents of endogenous growth theory would predict.
5.2 Previous studies
There are several studies available to date on the effect of the phasing out of the MFA on
the developing world. Francois and Spinanger (2004) derived a methodology for measuring
the level of protection faced by exporters under the pre-2005 quota system, but they do not
address the implication of the removal of protection. Their study does mention, though,
that the elimination of quotas with the enactment of the Agreement on Textiles and
Clothing (ATC) means that the textile and clothing trade is likely to shift dramatically
towards China and India. According to Francois and Spinanger (2004), the MFA had been
a preference system which helped other developing countries at the expense of India and
China. The low-cost character of Chinese and Indian exports would, after 2005, mean lost

159
market share for most of the other suppliers in the developing world who produced at a
higher cost. The high-cost countries could have used the WTO special anti-surge clauses
for textiles and clothing (T&C) products. General anti-surge clauses and the treatment of
China as ‘a non-market economy’ in anti-dumping cases could have allowed the rest of the
developing world to keep up protectionist pressure against China for the next decade,
Francois and Spinanger maintained in 2004. The reality has, however, been quite different.
Products from China and India have invaded the T&C markets completely since 2005.
Rivera (2004) analysed the welfare implications of full implementation of the ATC for
three Sub-Saharan African (SSA) regions. The study finds that the Southern African
Customs Union (SACU), other Southern African countries and the rest of SSA all benefited
from AGOA preferences on clothing (which is US legislation that the US has signed with
African countries, called the Africa Growth and Opportunity Act), with other Southern
African countries experiencing the largest benefits. The completion of the ATC reverses
these benefits and leads to small net welfare losses compared to pre-AGOA levels.
Evans and Harrigan (2004) have found that MFA quotas have generated significant wage
premiums for exporting countries. These have increased the incentives to invest in these
countries. This paper looks at the extent and effects of the MFA, making use of a dataset
on product-level US import quotas. The findings suggest that the MFA constrained
exporters in East Asian countries that had binding quotas (i.e. fill rates that are high enough
to keep imports into the USA below what they would otherwise be), especially China and
Hong Kong. The MFA thus substantially distorted trade as binding quotas tightly
constrained many East Asian exporters, and led to substantially higher import prices in the
USA. For those exporters that did not have binding quotas, which includes Mauritius, MFA
quotas yielded billions of dollars in quota rents to holders of quota licenses. UNCTAD
(2005) suggests that the end of the MFA would change the location of foreign direct
investors and cause FDI to leave countries that previously enjoyed quota access and move
to countries with lower wages or other production advantages.
The World Bank (2009) suggested that the end of the MFA could mean a decrease in both
exports and FDI in countries affected by this regime change.

160
Wacziarg and Wallack (2004) examine the inter-sectoral employment effects for 25
liberalisation episodes in a set of developing and transition economies. At the one-digit
level, trade liberalisation is found to have either no effect or a negative (but insignificant)
effect on sectoral employment shares. Considering a five-year window following an
episode of trade liberalisation, a typical liberalising sector will sustain a 0.65 percentage
point absolute change in employment share in the two years following the liberalisation
episode. By contrast, a non-liberalising sector will experience a 0.79 percentage point
absolute change. That is, there is more labour movement within sectors, i.e. change in
employment share of the different sectors in the non-liberalising sector than in the
liberalising sector, though the difference is not statistically significant. At the three-digit
level, the employment effects of trade liberalisation are more pronounced. Wacziarg and
Wallack (2004) also report that a liberalisation episode five years in the past will reduce
the two-year growth in manufacturing employment in a country by 4.02 percentage points.
They also find some, though mixed, evidence that labour market rigidities inhibit labour
market responses.
Revenga (1997) also finds small employment effects for Mexico: tariff reductions had no
statistically significant effect on employment, while removal of import quotas reduced
employment minimally. Similarly small employment effects are found in other studies
(Pages-Serra &Marquez, 1998; Moreira &Najberg, 2000; Rama, 1994).
Currie and Harrison (1997) explain why such employment effects might be small. They
analyse data from Morocco and found that the impact of trade on wages and employment
depends on the degree of imperfections in the output market. For competitive markets in
which profit margins are small, import penetration reduces employment. By contrast, for
those markets with larger profit margins, virtually no change occurs in wages or
employment. These results led the World Bank (2009) to conclude that, at least for these
cases, increased trade exposure leads to positive outcomes.
5.3 The evolution of EPZ export performance in Mauritius
The focus now turns to analysing the effects of the removal of preferences in Mauritius
after the MFA. The emphasis is on determining whether there has been a change in terms
of performance measured by employment and exports.

161
Textiles and clothing products were returned to GATT (General Agreement on Tariffs and
Trade) rules over the ten-year period of 1995-2005. ‘This happened gradually, in four
steps, to allow time for both importers and exporters to adjust to the new situation. Some
of these products were previously under quotas. Any quotas that were in place on 31
December 1994 were carried over into the new agreement. For products that had quotas,
the result of integration into GATT was the removal of these quotas. The agreement stated
the percentage of products that had to be brought under GATT rules at each step. If any of
these products came under quotas, the quotas had to be removed at the same time. The
percentages were applied to the importing country’s textiles and clothing trade levels in
1990. The agreement also said the quantities of imports permitted under the quotas had to
grow annually, and that the rate of expansion had to increase at each stage. How fast that
expansion would be was set out in a formula based on the growth rate that existed under
the old Multi-Fibre Agreement’ (WTO,n.d.).
The ATC set a four-stage quota liberalisation schedule which is outlined in Article 2 of the
Agreement. Each phase foresaw the integration of a specific percentage of textile
categories based on 1990 levels. The first stage lasted three years, the second lasted four
years, and the third three years. The final stage was the date of full integration (1 January
2005). As Table 5.1 indicates, the first phase of quota removal (between 1995 and the end
of 1997) saw quantitative restrictions lifted from a minimum of 16% of imports, followed
by batches of a minimum of 17%, 18% and finally 49% (the remaining categories).
Table 5.1 Steps to MFA phase out
There were four steps over ten years. The example is based on the commonly used 6%
annual expansion rate of the old MFA. In practice, the rates used under the MFA varied
from product to product.

162
Step Percentage of products
to be brought under GATT
(including
removal of any quotas)
Percentage of products
to be brought under GATT
(including
removal of any quotas)
Step 1: 1 Jan 1995 (to 31 Dec 1997)
16% (minimum, taking 1990 imports as
base)
From 6% to 6.96% per year
(All annual quota growth rates,
which existed in respective
bilateral agreements prior to
the ATC, to be increased by a
factor of at least 16%. Thus an
annual growth rate of 6 %
should be increased to 6.96 %;
5 % to 5.80%; 4% to 4.64%;
3% to 3.48 %; 2% to 2.32%;
1% to 1.16 %.)
Step 2: 1 Jan 1998 (to 31 Dec 2001)
17% From 6.96 % to 8.7% per
year
(The annual growth rates
resulting from the above
formula will be increased
further by at least 25 %.)
Step 3: 1 Jan 2002 (to 31 Dec 2004)
18% From 8.7% to 11.05% per
year
(The rates resulting from the
above (i.e. 1998) will be
increased by another at least
27%.)
Step 4: 1 Jan 2005
>Full integration into GATT
(and final elimination of
quotas).
>Agreement on Textiles and
Clothing terminates.
49% (maximum)
No quotas left
The actual formula for
import growth under quotas
was:
by 0.1 x pre-1995 growth
rate in the first step;
0.25 x Step 1 growth rate in
the second step; and
0.27 x Step 2 growth rate in
the third step.
Source World Trade Organisation
(http://www.wto.org/english/thewto_e/whatis_e/tif_e/agrm5_e.htm)

163
Besides regulating quota removal and the integration of the textiles and clothing trade with
normal GATT disciplines, the ATC in Article 2(13)-(14) also required a concurrent
increase in the remaining quotas. In other words, the ATC sought to ensure not only
ongoing liberalisation, but also that the process would be undertaken with some
momentum. These increases– expressed as a percentage and shown in the last column in
Table 5.1 below – refer to an increase of quota levels beyond the increases foreseen by the
MFA. For example, where the annual quota increase foreseen for a particular country and
category is 5%, it would have to be increased by 16%, i.e. from 5% to 5.8% (5% multiplied
by 16% annual growth), 5.8% to 7.25% (i.e. 5.8% multiplied by 25% annual growth) and
7.25% to 9.21% (i.e. 7.25% multiplied by 27% annual growth) in the third stage. Smaller
developing countries are recognised in ATC Article 2(18), in that where a country’s
restricted exports were 1.2% or less of the volume of a particular importing country’s
restrictions, such a country should be fast-tracked to benefit from the next stage of quota
growth rates.
Products brought under GATT rules at each of the first three stages had to cover the four
main types of textiles and clothing: tops and yarns, fabrics, made-up textile products, and
clothing. Any other restrictions that did not come under the MFA and did not conform to
regular WTO agreements by 1996 had to be made to conform or be phased out by 2005.
We start our evaluation of the impact of these changes with an overview of the Mauritius
EPZ (replaced by EOE – Export Oriented Enterprises – after 2005) exports for the period
2000-2010, which provides an indication of the evolution of exports prior to and after
preferences.

164
0
5000
10000
15000
20000
25000
30000
2000 2001 2002 2003 2004 2005 2006 2007 2008 2009 2010
Others Europe North America
Figure 5.1 EPZ exports in Rs Million (2000-2010) Source: Central Statistics Office, Mauritius
Mauritian EPZ exports to Europe remained mostly at the same level throughout the period
2000-2004 with a slight decrease in 2005, the year of the complete removal of preferences.
After 2005, the exports to Europe surged until 2007 and remained within the range Rs
25,000 million to Rs 30,000 million from 2008 to 2010. Exports to North America
decreased systematically from 2002 onwards, which coincides with the beginning of the
third stage of tariff removal under the Agreement on Textiles and Clothing (ATC).

165
-3000
-2000
-1000
0
1000
2000
3000
4000
5000
2000 2001 2002 2003 2004 2005 2006 2007 2008 2009 2010
Others North America Europe
Figure 5.2 Change in EPZ exports in Rs million
Source: Central Statistics Office, Mauritius
Computing year-on-year changes in exports (Figure 5.2) highlights the drastic fall in
exports to both Europe and North America in the period leading up to 2005.
Total EPZ exports, illustrated in Figure 5.3, experienced a slight fall from 2001 to 2005,
but after 2006 total EPZ exports increased steadily. A sensible explanation for this is the
diversification of EPZ exports to countries such as South Africa and Madagascar after
2005. There is also the fact that Mauritian companies restructured and refocused, which
made them resilient to a degree.
A key feature of the EU market is the duty-free status accorded to exports originating from
ACP countries under the Cotonou Agreement which have continued to provide some
degree of protection against cheaper Asian exports. In the absence of such tariff
preferences, it is unlikely that Mauritius could have measured up to China (Goliath,
2009:13).
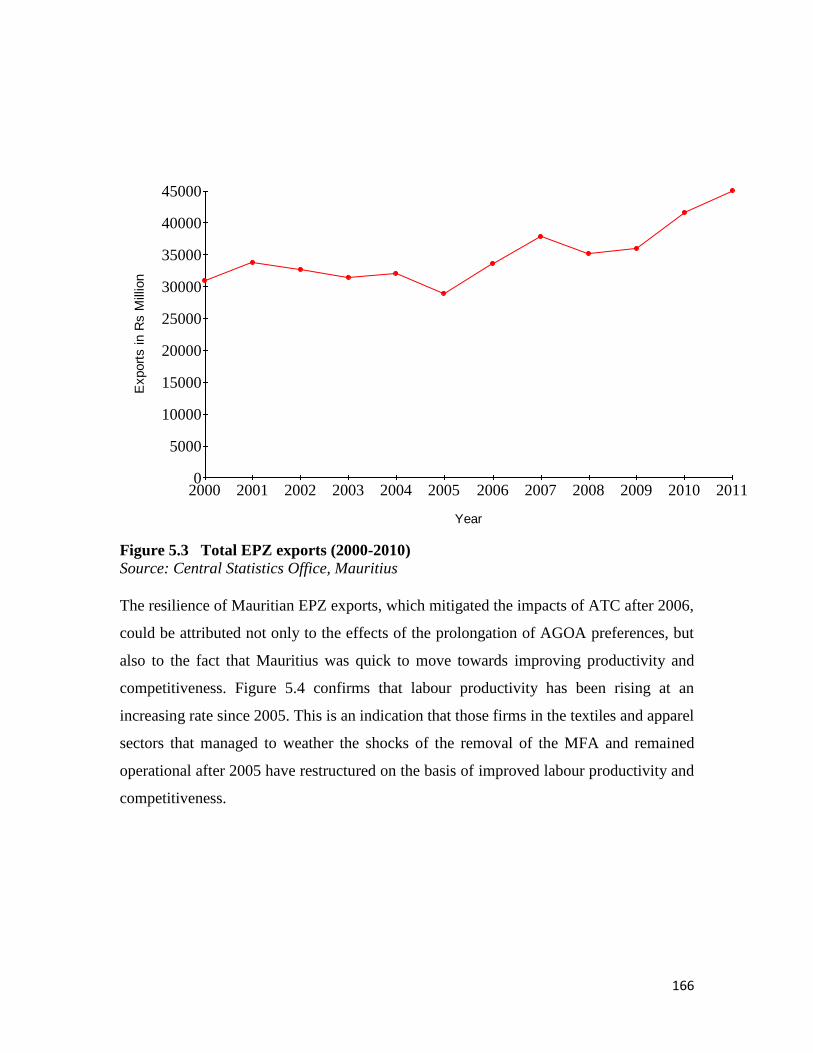
166
0
5000
10000
15000
20000
25000
30000
35000
40000
45000
2000 2001 2002 2003 2004 2005 2006 2007 2008 2009 2010 2011
Export
s in R
s M
illio
n
Year
Figure 5.3 Total EPZ exports (2000-2010)
Source: Central Statistics Office, Mauritius
The resilience of Mauritian EPZ exports, which mitigated the impacts of ATC after 2006,
could be attributed not only to the effects of the prolongation of AGOA preferences, but
also to the fact that Mauritius was quick to move towards improving productivity and
competitiveness. Figure 5.4 confirms that labour productivity has been rising at an
increasing rate since 2005. This is an indication that those firms in the textiles and apparel
sectors that managed to weather the shocks of the removal of the MFA and remained
operational after 2005 have restructured on the basis of improved labour productivity and
competitiveness.

167
0.0
20.0
40.0
60.0
80.0
100.0
120.0
140.0
160.0
180.0
2000 2001 2002 2003 2004 2005 2006 2007 2008 2009 2010
Index o
f pro
ductivity(1
00 in 2
000)
year
Labour productivity Multifactor product
Figure 5.4 Productivity of labour in textiles Source: Central Statistics office Mauritius
5.4 EPZ employment performance
The other main performance indicator for the EPZ, namely employment, reveals that the
number of enterprises in the EPZ remained relatively stable through the period 2000-2005,
with a slight fall in 2006 and 2007. This was not something specific to the EPZ, as data on
the industrial sector also reveals a decrease for the whole sector in 2005 and 2006.
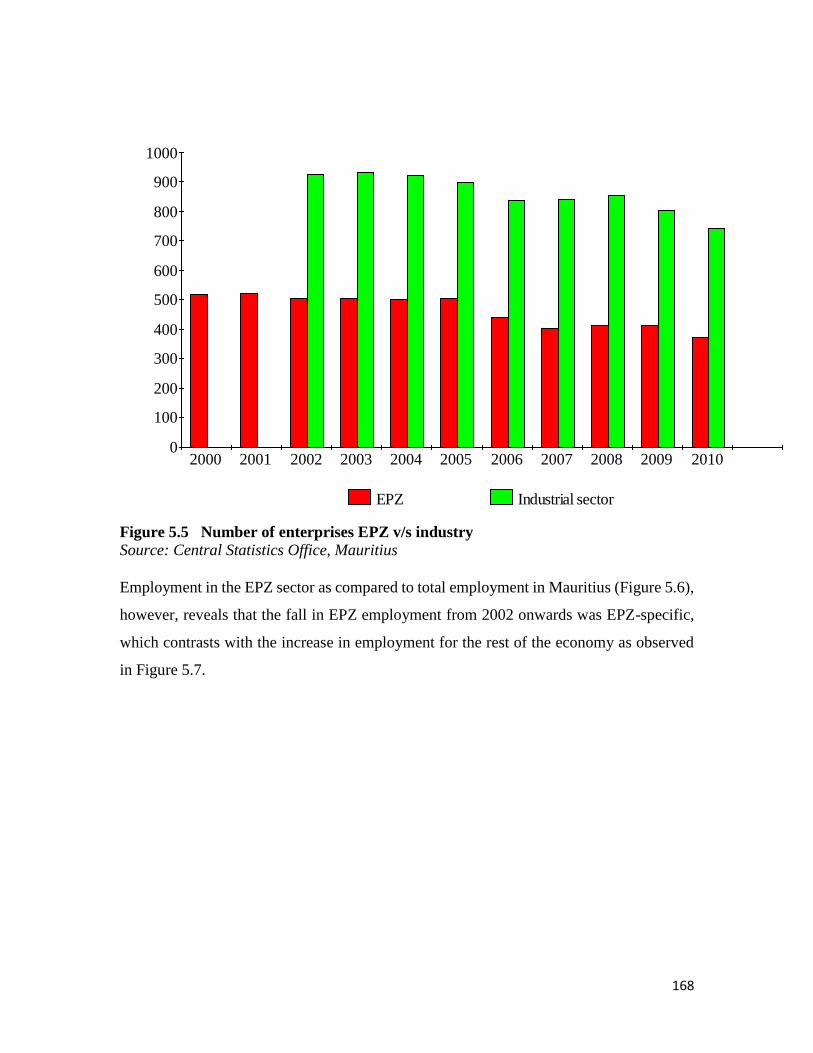
168
0
100
200
300
400
500
600
700
800
900
1000
2000 2001 2002 2003 2004 2005 2006 2007 2008 2009 2010
EPZ Industrial sector
Figure 5.5 Number of enterprises EPZ v/s industry Source: Central Statistics Office, Mauritius
Employment in the EPZ sector as compared to total employment in Mauritius (Figure 5.6),
however, reveals that the fall in EPZ employment from 2002 onwards was EPZ-specific,
which contrasts with the increase in employment for the rest of the economy as observed
in Figure 5.7.

169
0
10000
20000
30000
40000
50000
60000
70000
80000
90000
100000
2000 2001 2002 2003 2004 2005 2006 2007 2008 2009 2010
Em
plo
ym
ent
Year
Figure 5.6 EPZ Employment (2000-2010) Source: Central Statistics Office, Mauritius
Based on the aforementioned, it looks as if EPZ performance in general seemed to have
been moderately affected by the gradual removal of preferences, but the drastic changes
are concentrated in the period 2002-2005.

170
Figure 5.7
Source: Central Statistics Office, Mauritius and ILO websites
5.5 Product specific
Data at product level in Mauritius provide us with an indication of the performance of those
manufacturing products in Mauritius that took advantage of the non-reciprocal trade
preferences (namely – textiles, yarn, and fabrics and apparel) before and after the
preferences were removed for the time period 1995-2010. Those manufactured products
will be compared with those products that did not have preferences throughout – for
instance, food, flowers, optical goods, jewellery and toys, etc. It will be determined whether
the removal of preferences actually made a difference in the performance of these EPZ
products. It will also be determined whether those products in the manufacturing sector
that never benefited from preferences actually experienced a change in their performance
during the post-preference period.
The Central Statistics Office Mauritius divides the manufacturing sector into 11 product
groups – namely, No.1: Food, No.2: Flowers, No.3: Textile Yarn and Fabrics, No.4:
Employment
0
100000
200000
300000
400000
500000
600000
1 2 3 4 5 6 7 8 9 10 11
year (2000-2010)
nu
mb
er
of
peo
ple
Year
Employment in EPZ
Total Employment
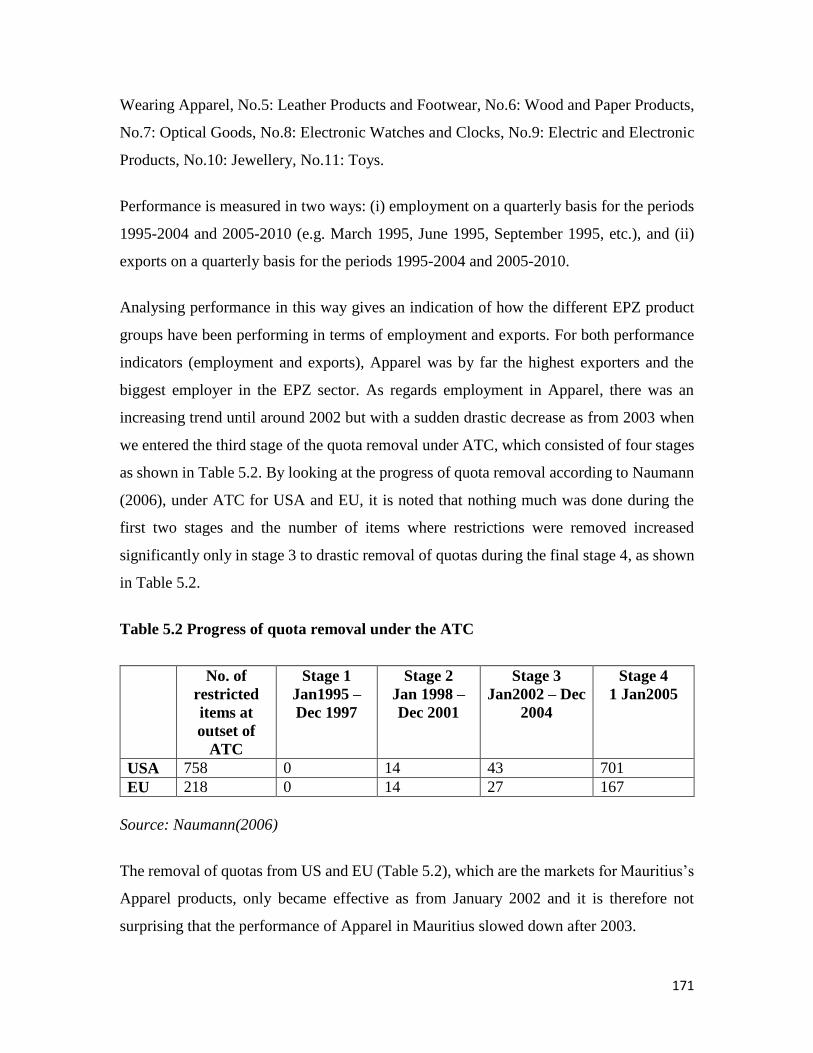
171
Wearing Apparel, No.5: Leather Products and Footwear, No.6: Wood and Paper Products,
No.7: Optical Goods, No.8: Electronic Watches and Clocks, No.9: Electric and Electronic
Products, No.10: Jewellery, No.11: Toys.
Performance is measured in two ways: (i) employment on a quarterly basis for the periods
1995-2004 and 2005-2010 (e.g. March 1995, June 1995, September 1995, etc.), and (ii)
exports on a quarterly basis for the periods 1995-2004 and 2005-2010.
Analysing performance in this way gives an indication of how the different EPZ product
groups have been performing in terms of employment and exports. For both performance
indicators (employment and exports), Apparel was by far the highest exporters and the
biggest employer in the EPZ sector. As regards employment in Apparel, there was an
increasing trend until around 2002 but with a sudden drastic decrease as from 2003 when
we entered the third stage of the quota removal under ATC, which consisted of four stages
as shown in Table 5.2. By looking at the progress of quota removal according to Naumann
(2006), under ATC for USA and EU, it is noted that nothing much was done during the
first two stages and the number of items where restrictions were removed increased
significantly only in stage 3 to drastic removal of quotas during the final stage 4, as shown
in Table 5.2.
Table 5.2 Progress of quota removal under the ATC
No. of
restricted
items at
outset of
ATC
Stage 1
Jan1995 –
Dec 1997
Stage 2
Jan 1998 –
Dec 2001
Stage 3
Jan2002 – Dec
2004
Stage 4
1 Jan2005
USA 758 0 14 43 701
EU 218 0 14 27 167
Source: Naumann(2006)
The removal of quotas from US and EU (Table 5.2), which are the markets for Mauritius’s
Apparel products, only became effective as from January 2002 and it is therefore not
surprising that the performance of Apparel in Mauritius slowed down after 2003.
172
With regards to EPZ exports by product, the same trend is observed for Apparel, the highest
exporter, with very significant falls from 2003-2005 and growth resuming after 2006.
Jewellery was also coming up as the second most important product group as from 2005-
2006. As far as total exports are concerned (Figure 5.8), there was an upward trend
throughout the period 1995-2010, indicating that total exports seemed to be unaffected by
the changes in the preference regimes, confining pre- and post-preference effects only to
the EPZ sector.

0
5,000
10,000
15,000
20,000
25,000
234123412341234123412341234123412341234123412341234123412341234
5,576
Figure 5.8 Total exports quarterly 1995-2010 Source: Central Statistics Office, Mauritius
5.6 Data on African EPZ exports to USA and EU
The comparative Table 5.3 of those African countries (list from Boyenge (2007)) that had
an EPZ like Mauritius and which qualified after 2000 under both the Cotonou Agreement
and AGOA gives an indication of exports and number of EPZ enterprises prior to and after
MFA. Those countries (Table 5.3) that have the potential to be direct competitors of
Mauritius are countries with non-negligible manufacturing textiles and clothing exports
sectors – namely, Ghana, Kenya, Lesotho, Malawi, Mali, Mozambique and Madagascar.
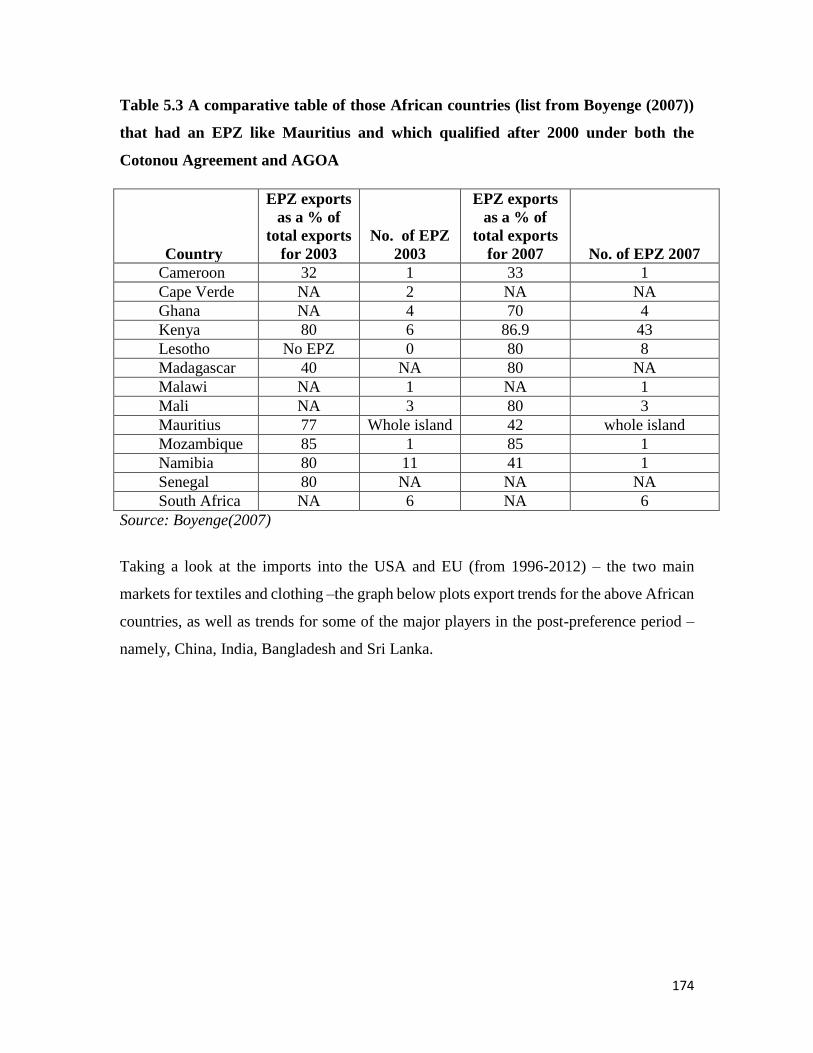
174
Table 5.3 A comparative table of those African countries (list from Boyenge (2007))
that had an EPZ like Mauritius and which qualified after 2000 under both the
Cotonou Agreement and AGOA
Country
EPZ exports
as a % of
total exports
for 2003
No. of EPZ
2003
EPZ exports
as a % of
total exports
for 2007 No. of EPZ 2007
Cameroon 32 1 33 1
Cape Verde NA 2 NA NA
Ghana NA 4 70 4
Kenya 80 6 86.9 43
Lesotho No EPZ 0 80 8
Madagascar 40 NA 80 NA
Malawi NA 1 NA 1
Mali NA 3 80 3
Mauritius 77 Whole island 42 whole island
Mozambique 85 1 85 1
Namibia 80 11 41 1
Senegal 80 NA NA NA
South Africa NA 6 NA 6
Source: Boyenge(2007)
Taking a look at the imports into the USA and EU (from 1996-2012) – the two main
markets for textiles and clothing –the graph below plots export trends for the above African
countries, as well as trends for some of the major players in the post-preference period –
namely, China, India, Bangladesh and Sri Lanka.

175
0
5.0E+06
1.0E+07
1.5E+07
2.0E+07
2.5E+07
3.0E+07
3.5E+07
1996 1997 1998 1999 2000 2001 2002 2003 2004 2005 2006 2007 2008
Import
s U
S t
housands
Year
Bangladesh (1980) Sri Lanka China
India Mauritius
Figure 5.9 Textiles imports in the US Source: World Integrated Trade Solution (WITS)http://wits.worldbank.org/
(Note: Textiles as 26+65+84 of SITC Rev.1)
Chinese textiles exports into the USA (Figure 5.9), which were already at a high level,
more than doubled between 2003 and 2006. Bangladesh, Sri Lanka and India also exported
more to the USA after 2005, while for Mauritius one can observe a gradual decrease in its
exports to the USA after a peak in 2003. The same trend is noted for the other African
countries with falls in exports to the USA after 2003/2004.
Table 5.4 Textile imports into the USA from the other African countries (including
Mauritius) from 1996-2008 in USD thousands
Trade
Year Ghana Kenya Mozambique Malawi
1996 913 27,820 447 1,488
1997 1,260 31,822 156 276
1998 7,814 33,795 116 246
1999 3,619 39,670 44 1,204
2000 508 44,093 0 7,326

176
2001 407 64,654 179 12,385
2002 550 126,492 193 11,432
2003 4,505 188,152 2,528 23,173
2004 7,432 277,457 2,255 26,775
2005 5,207 270,872 2,516 22,781
2006 9,564 264,090 694 18,187
2007 3,632 249,999 163 19,830
2008 919 247,077 1 12,677
Source: World Integrated Trade Solution (WITS)
(Note: Textiles as 26+65+84 of SITC Rev.1). Numbers in bold represent imports in the
post-preference period
Table 5.5 Textile imports into the USA from the other African countries (including
Mauritius) from 1996-2008 in USD thousands (cont.)
Trade
Year Mali Lesotho Mada Mauritius
1996 1,179 64,922 12,177 165,220
1997 278 86,554 16,220 184,586
1998 200 100,183 22,822 233,613
1999 1,866 110,745 46,226 232,104
2000 261 140,060 110,125 244,863
2001 108 216,776 178,877 238,345
2002 121 321,049 90,077 254,640
2003 150 392,490 196,768 269,143
2004 72 456,010 323,885 226,781
2005 78 390,690 277,496 167,014
2006 116 387,242 238,742 119,176
2007 107 383,568 290,628 114,968
2008 102 339,757 279,953 101,691
It is noted that Mauritius (Table 5.5), in contrast to many SSA countries that built their
clothing industries on the provisions of the Africa Growth and Opportunity Act (AGOA
2000),was already exporting to the USA under the GSP (Generalised System of
Preferences) regime and, additionally, as a beneficiary of the MFA quota system. Thus,
clothing exports in 1995 were already high. Goliath (2009:11) shows that while a ‘major
proportion of exports shifted to AGOA after 2000, this shift has been gradual and the
overall percentage of exports to the US under AGOA has remained small – 52 percent over
the period 2001-2005 compared to over 95 percent for most of the SSA exporters (except
South Africa). This means that about half of Mauritius’s exports did not enjoy duty-free

177
access to the US market, which exposed them particularly to the threat of China sweeping
over the US market upon the expiry of the MFA’. Furthermore, many apparel exporters
were hopeful that Mauritius would be obtaining an extension of the third-country fabric
derogation beyond September 2005. When this did not happen during the period 2003-
2005, a number of Asian companies that exported exclusively to the USA exited the
Mauritian EPZ during 2003-2007. However, Mauritius was able to secure an extension in
2008.
As far as imports to the EU are concerned (Figure 5.10), the situation is similar to the USA
trends, but the changes seem to be more drastic, especially regarding the increase in exports
from China, India and Bangladesh after 2005 when all preferences were removed and the
ATC became operational.
0
5.0E+06
1.0E+07
1.5E+07
2.0E+07
2.5E+07
3.0E+07
3.5E+07
4.0E+07
4.5E+07
5.0E+07
1996 1997 1998 1999 2000 2001 2002 2003 2004 2005 2006 2007 2008
Import
s in U
S t
housands
Year
Bangladesh (1980) Sri Lanka China
India Mauritius
Figure 5.10 Textiles imports in the EU Source: World Integrated Trade Solution (WITS) http://wits.worldbank.org/
(Note: Textiles as 26+65+84 of SITC Rev.1)

178
Table 5.6 Textiles imports to the EU from the other African countries (including
Mauritius) from 1996-2008 in USD thousands
Trade
Year Ghana Kenya Mozambique Malawi
1996 1,592 14,518 20,420 6,454
1997 1,907 17,656 26,399 2,317
1998 594 14,722 25,723 1,921
1999 1,433 11,266 22,969 607
2000 4,232 8,561 20,501 841
2001 3,217 6,246 14,606 584
2002 4,839 7,063 10,014 144
2003 1,835 9,407 14,457 175
2004 3,327 13,848 12,727 261
2005 2,279 12,066 7,748 36
2006 1,606 12,353 7,158 117
2007 1,012 6,133 3,208 14
2008 1,302 5,063 3,376
Source: World Integrated Trade Solution (WITS) (Note: Textiles as 26+65+84 of SITC
Rev.1) Numbers in bold represent imports in the post preference period.
Table 5.7 Textiles imports to the EU from the other African countries (including
Mauritius) from 1996-2008 in USD thousands (cont.)
Trade
Year Mali Lesotho Mada Mauritius
1996 79,855 13,182 136,488 643,963
1997 81,299 4,642 177,968 682,661
1998 101,366 843 229,227 721,511
1999 57,195 173 246,846 671,849
2000 40,461 1,652 249,599 627,843
2001 21,340 3,373 247,356 599,972
2002 38,993 1,913 130,382 586,393
2003 34,485 1,496 139,334 623,687
2004 50,354 1,787 196,843 646,425
2005 32,954 812 216,262 562,307
2006 19,304 1,076 279,354 623,191
2007 21,797 2,328 329,147 678,425
2008 8,777 2,725 330,516 639,670

179
5.7 Average change in performance indicators by product in Mauritius
The change in exports and employment for the different products groups in Mauritius for
period 1995-2004 and 2005-2010 are presented in tables 5.8 and 5.9.
Table 5.8 Average% change in EPZ exports by product
Product Food /
live
animal
4Crude
materia
ls
Chemic
als
Textile
fabrics
Pearls Apparel Optical Watches Toys Jewellery
Period
1995-
2004
4.6 44 16 10.1 5.1 3.85 2.9 1.81 14 7.5
Period
2005-
2010
7 7 12 3.1 2.7 1.6 7.1 4.1 4.7 10.3
Table 5.9 Average% change in EPZ employment by product
Product Food Flowers Textile
Fabrics Apparel Leather
Wood
Paper
Opti
cal
Wat
ches
Electr
onics
Jewell
ery Toys
Period
1995-
2004
1.12 -0.69 0.58 -0.64 -1.76 0.92 -0.52 0.82 0.08 0.59 -0.76
Period
2005-
2010
3.04 -2.89 0.09 -1.37 -0.48 0.62 -0.81 -0.31 0.37 -0.27 -3.84
Sources for tables 5.6 and 5.7: Author’s own calculations from Central Statistics Office
Mauritius data
The apparel and textiles average percentage change in exports (Table 5.8) during 2005-
2010 was one third of the average change in 1995-2004, while most of the other products
were not affected by the ATC – namely, Food/live animals, Opticals, Watches, Toys and
Jewellery. An increase in the average percentage change in exports after MFA was
observed. With regard to employment, a fall in the textile sector is noted and an even more
significant decrease in the apparel sectors after MFA. Some other products which also had
an average percentage decrease were flowers, wood and jewellery, while increases can be
observed for food and electronics.

180
5.8 Computing the double difference
To analyse further the impact of the removal of preferences, the difference-in-differences (DID)
estimation is used, which compares the changes of the product groups Textile/Yarn/Fabrics and
Apparel (Nos. 3 and 4) with the other sectors. The treatment group will be groups 3+4, while the
control group will be the other sectors taken together.
The simplest way would be to compute the average treatment groups and control groups over the
two time periods. One of the groups is exposed to a treatment (preferences) in the first period but
not in the second period. The second group is not exposed to the treatment during either period. In
the case where the same units within a group are observed in each time period, the average gain in
the second (control) group is subtracted from the average gain in the first (treatment) group. This
removes biases in first period comparisons between the treatment and control group that could
result from permanent differences between those groups, as well as biases from comparisons over
time in the treatment group that could be the result of trends.
Table 5.10 DID estimate of the effect of preferences on ln4 employment (i.e. ln(employmentt)
– ln(employmentt-1)
Average difference in ln employment
(quarterly)
Difference between
periods
June 1995 –
December
2004(preference)
March 2005 –
December 2010 (no
preference)
Textile and wearing
apparel (group3+4)
-0.0015 -0.0075 0.006
All other sectors -0.0020 -0.0078 0.0058
Difference between
groups
0.0005 0.0003 0.0002-DID estimate
The simple differences are in the two columns, while the difference-in-differences are in the
bottom right cell.
4 Ln values are used as this is more convenient and easier to tabulate which will give us a straight line if we are to
plot the results.

181
In the second column (Table 5.10) it can be seen that the difference between the two groups in
terms of employment during the preference period was 0.0005 and this difference decreased
slightly once the preferences were removed, principally as a result of loss of employment in the
treatment group. Looking at the difference between periods, it can be noted that slightly more
employment was lost in the textile and wearing apparel group than the other sectors after the
preferences had been removed. The difference-in-difference (DID) rating is 0.0002, showing that
annual growth in employment under preferences was 0.0002 percentage points higher than after
preferences.
Looking at exports (Table 5.11), it can be noted that when preferences were still ongoing, the
differences between groups were largely in favour of the treatment group with a high of 0.629.
When the preferences no longer applied, the differences between groups came down to 0.242. As
far as the differences between periods are concerned, the treatment group was slightly affected
after 2004, while no change was observed in the control group. The DID estimate of 0.387 shows
that the annual growth in exports under preferences was 0.387 percentage points higher than when
the preferences were removed.
Table 5.11 DID estimate of the effect of preferences on ln5 exports
Average difference in ln exports
(quarterly) Rs million
Difference between
periods
1st quarter 1995–
last quarter
2004(preference)
1st quarter 2005 –
last quarter
2010(no
preference)
Textile and wearing
apparel (group3+4)
0.652 0.265 0.387
All other sectors 0.023 0.023 0
Difference between groups 0.629 0.242 0.387-DID estimate
5 Ln measures growth rates in exports.

182
5.9 Using regression to confirm the DID results
From the above analysis it is observed that in practice the impact on apparel exports has been
milder than was actually feared. Goliath (2009) found that the prophecy of doom, that predicted
that SSA’s apparel trade would be swept away by the Chinese tidal wave of cheap exports, was
unwarranted. One important factor, according to Goliath (2009), is the remarkable changes in
exports by product category, which he illustrates by using Kenya as an example, where exports of
T-shirts to the USA declined, while exports of men’s and boys’ cotton shirts increased strongly.
Mauritian companies were also orienting their strategies towards a model based on market
knowledge and innovation of products and services. The purpose was not only to move to more
efficient production and marketing of higher-value products and services, but also to move away
from traditional markets and towards Africa and the Far East. Looking at the Mauritian export data
for products by HS (Harmonised System) codes for the period 2001-2008, one might get an
indication of whether Mauritius exports by products actually experienced a change before and after
MFA. We may also get an indication of whether Mauritian exports by products actually
experienced the same types of changes that have been observed in Kenya.
DID will measure the average difference between the treatment and control groups using the
following specifications:
y= β + α1 D1+β1 dT +α2 D1 * dT + µ--------------------------------------------------(1)
where T=1, if in treatment group and T=0 if in control group
and D1 = 1 until 2004 (with preferences) and D1 = 0 as from 2005(without preferences)
Time Dimension: from 2001-2004 and from 2005-2008.
y is the outcome of interest, D1 is the time period dummy variable which captures aggregate factors
that would cause changes in y even in the absence of a policy change. The dummy variable dT
captures possible differences between the treatment and control groups after preferences have been
removed. The coefficient of interest α2 multiplies the interaction term D1 * dT, which is the same
as a dummy variable equal to one for those observations in the treatment group in the period before

183
2005. The DID approach is used as a way of eliminating unobserved heterogeneity, i.e. it is a way
of eliminating fixed factors that might have an impact between treatment and control groups.
To study the impact of preferences on the treatment group, information is used from the Central
Statistics Office Mauritius for manufacturing sector exports from the Exports by HS codes from
2001-2008. The table in the document from Central Statistics Office Mauritius contained columns
for HS codes, products, country of destination and exports. Figures have been tabulated for exports
exceeding Rs 35 million/year, which is equivalent to approximately $1 million. This brought down
the number of observations to 1,215. All textiles and clothing products were in the treatment group
with a T=1, and year dummies were also inserted in the tabulation. The dependent variable is Ln
exports.
A linear regression (Table 5.12) was done to verify the average difference between the treatment
and control groups across time (from 2001-2008). This method is a way to eliminate fixed factors
that might have an impact between treatment and control groups. The regression for the average
difference between ln exports before and after preferences were removed to demonstrate that the
removal of preferences did have an impact on exports. The T coefficient is significant at p<0.01
with a coefficient of 27.2%, meaning the exports in the treatment group changed (decreased) by a
significant percentage after the preferences had been removed (see Table 5.10).
5.10 Including covariates into the regression
Including the AGOA variable, which takes a dummy of 1 when the export destination is the USA,
shows that it has an influence on the outcome variable. The T coefficient in the third column is
lower but still significant, while the AGOA control variable adds 37.9% to exports during
preferences and is thus less by 37.9% after preferences, principally as a result of the preferences
being removed on textiles and apparel.
Using non-EU members as another dummy in column 4, it is noted that the T coefficient becomes
even lower at 0.230 while remaining still significant, while the non-EU variable has a negative
coefficient of -0.38 and is significant, which means that non-EU members’ contribution to exports
were lower with preferences and increased by 38% after preferences had been removed.

184
Column 5 shows the effects of both AGOA and non-EU with the T still significant, but with a
coefficient decreasing to 0.223. Thus, when the effects of AGOA and non-EU member countries
are highlighted, a fall is noted in exports after preferences have come down to 22.3% from an
initial decrease of 27.5%. It shows that the removal of preferences did have an impact on the
treatment group, but its effect was less pronounced when non-EU and AGOA were included in the
equation.
Table 5.12 Difference-in-differences estimation for treatment group post-2004 (after
removal of preferences)
Variables Lnexports Lnexports Lnexports Lnexports
AGOA_USA 0.379*** 0.310***
(0.0990) (0.0999)
T(Treatment effect) 0.272*** 0.258*** 0.230*** 0.223***
(0.0644) (0.0643) (0.0644) (0.0644)
d2001preferencedummy -0.637 -0.572 -0.398 -0.365
(0.630) (0.628) (0.627) (0.625)
d2002 -0.577 -0.513 -0.368 -0.334
(0.629) (0.627) (0.625) (0.624)
d2003 -0.558 -0.479 -0.345 -0.297
(0.647) (0.644) (0.643) (0.641)
d2004 -0.554 -0.494 -0.328 -0.302
(0.646) (0.644) (0.642) (0.641)
d2005 -0.550 -0.466 -0.283 -0.236
(0.643) (0.641) (0.640) (0.638)
d2006 -0.497 -0.415 -0.231 -0.184
(0.642) (0.640) (0.639) (0.638)
d2007 -0.604 -0.510 -0.320 -0.267
(0.642) (0.640) (0.639) (0.638)
d2008 -0.588 -0.491 -0.309 -0.254
(0.642) (0.640) (0.639) (0.638)
Non-EU -0.380*** -0.347***
(0.0776) (0.0785)
Constant 18.94*** 18.83*** 18.79*** 18.71***
(0.639) (0.636) (0.634) (0.633)
Observations 1,215 1,211 1,213 1,209
R-squared 0.017 0.029 0.036 0.044 Standard Errors in brackets

185
5.11 Move towards high-end products
From Table 5.13 it is observed that while in 2001 the top Rs 100,000 (Mauritian Rupees) of textile
and clothing exports from Mauritius were to Europe and the USA, in 2008 UAE joined the list of
top export markets. As regards products, Mauritius was now exporting a large quantity of HS
(Harmonised Systems) code product 62052090, consisting of other men’s or boys cotton shirts
(which included woven, knitted and crocheted) to the USA. It therefore seems that Mauritius was
moving towards the high-end cotton luxury market.
Table 5.13 EPZ exports: 2001 and 2008 for export values exceeding Mauritian rupees Rs
100,000,000
HS code Year Product description
Country of
destination
Exports –
FOBvalue(rs)
61091000 2001
T-shirts, singlets and other vests of cotton,
knitted or crocheted France 2,979,710,386
61091000 2001
T-shirts, singlets and other vests of cotton,
knitted or crocheted UK 2,245,191,970
62034200 2001
Men's/boys'trousers ,bibs,shorts etc. of
cotton –not knitted/crocheted US 2,190,689,545
62046200 2001
Women's/girls' trousers,bibs,shorts etc. of
cotton – not knitted or crocheted US 2,157,281,964
62052000 2001
Men's/boys'shirts of cotton – not knitted or
crocheted US 1,834,219,286
16041400 2001
Prepared or preserved tuna, skipjack and
Atlantic bonito UK 1,574,697,113
62046200 2002
Women's/girls' trousers,bibs ,shorts etc.of
cotton – not knitted or crocheted US 3,022,004,238
17011100 2008
Raw cane sugar in solid form, not
flavoured or coloured UK 7,092,773,154
61091000 2008
T-shirts, singlets and other vestsof cotton,
knitted or crocheted UK 4,727,635,158
16041400 2008
Prepared or preserved tuna, skipjack and
Atlantic bonito UK 3,565,073,253
61091000 2008
T-shirts, singlets and other vestsof cotton,
knitted or crocheted France 2,760,697,504
62052090 2008 Other men's/boys’ shirts of cotton US 1,907,907,326
85171200 2008
Telephones for cellular networks or for
other wireless networks UAE 1,622,477,534
186
Source: Central Statistics Office Mauritius
As Table 5.11 shows, 2008 saw the revival of the textile and apparel sectors in Mauritius, which
occurred as a result of innovation in ideas, in R&D and high-quality products and the
diversification of exports towards non-EU markets.
5.12 Conclusion
With the creation of the WTO and the complete removal of preferences, the future of the Mauritian
EPZ, in particular the textiles and clothing sector (which constituted the bulk of EPZ exports),
seemed very uncertain. Most previous studies on the removal of preferences on textiles and
clothing generally reveal welfare losses for countries such as Mauritius. This chapter analysed the
evolution of the Mauritian manufacturing sector and its various product groups during and after
removal of preferences to see whether there actually was a sudden fall in exports and employment
(the two performance indicators) that was specific to textile and clothing products once the
preferences were removed.
Starting with an analysis of EPZ export performance, the chapter showed that Mauritius EPZ
exports to the EU did not seem to have been affected by the removal of preferences. However,
exports to North America decreased systematically after 2002. As far as total EPZ exports are
concerned, the data reveal a slight fall from 2000-2006, but a steady increase after 2006 principally
due to diversification of EPZ exports towards South Africa and Madagascar, the prolongation of
AGOA preferences and increasing productivity in the textiles and clothing sector.
As regards the employment performance indicator, the analysis showed that EPZ employment fell
slightly after 2005, but this was not specific to the EPZ, as employment in the whole manufacturing
sector was actually also falling during that same time period. However, employment for the rest
of the economy was rising, which indicates diversification away from manufacturing.
A detailed look at the various product groups in the manufacturing sector showed that in terms of
exports, apparel was by far the highest exporter in the EPZ sector but with very significant falls
from 2003-2005 and with growth resuming after 2006. Jewellery came up as the second most
16041400 2008
Prepared or preserved tuna, skipjack and
Atlantic bonito Italy 1,112,061,612

187
important product group as from 2005-2006. As far as total exports are concerned, the analysis
showed an upward trend throughout the period 1995-2010, indicating that total exports seemed to
be unaffected by the changes in the preference regimes, confining pre- and post-preference effects
only to the EPZ sector.
As regards employment, apparel was also the biggest employer and the statistics showed an
increasing trend until around 2002, but with a sudden drastic decrease from 2003 when we entered
the third stage of the quota removal under ATC. In general, there was a fall in the textile sector
and an even more significant decrease in the apparel sectors after MFA.
Next, a comparison of the exports of countries which had EPZs similar to that of Mauritius was
carried out to provide a list of countries that have or will become direct competitors to Mauritius
in the more deregulated global trading environment. A look at imports in the USA and EU, which
are the two main markets for textiles and clothing, showed that China, Bangladesh, Sri Lanka and
India exported more to the USA after 2005, while Mauritius and other African countries
experienced a fall in exports to the USA after 2004. A similar trend was observed as far as imports
into the EU were concerned.
To analyse in more detail the real impact of the removal of preferences, difference-in-difference
estimates were used, which compare the changes in the textile and apparel sectors with other
sectors. The results show that the removal of preferences did have an impact on the textile and
apparel sectors, but the negative effect was less than expected. Therefore, contrary to existing
perspectives, Mauritius did not suffer major losses from the phasing out of the MFA. This was
principally a result of the diversification of exports towards non-EU markets.
Mauritius also moved towards niche products with a new emphasis on quality and high-end
products, as proponents of endogenous growth theory would predict. In fact, the period 2006-2008
saw the revival of the textile and apparel sectors in Mauritius, characterised by innovation in ideas,
in R&D and high-quality products which had a significant influence on the growth of the sector.
Mauritius was now in line with Romer’s endogenous growth theory, which focuses on ideas and
technology. In Mauritius the initial stage of EPZ industrialisation involved only labour-intensive,
low-skill firms with little requirement for technology support systems (Gray, 1995). During the

188
1990s, Mauritius upgraded its activities with the use of more capital-intensive tools such as
knitting, which makes use of machinery. With liberalisation and the phasing out of preferential
arrangements and the emergence of new low-cost producers in India and China, the
competitiveness of Mauritius was tested despite the growth in capital intensity during the 1990s.
As Gray (1995) argues, it is no longer just access to labour and acquisition of machinery that are
important determinants of competitiveness; know-how has become critical. To be competitive,
Mauritian firms need to know how best to adapt technologies to the local environment and to find
new ways of improving product quality and design. In an interview in the Mauritius Times
newspaper (2008), Romer states that the easiest way to improve quality is to copy ideas from the
rest of the world, which will give Mauritius an advantage by facilitating catch up without having
to work through the technology all over again. But he was quick to point out that to do this
Mauritius would need a world-class education system that would significantly improve the
country’s human capital levels. Local companies are very well aware that their future success
depends on how they adapt to new technologies and some are already implementing changes. The
future of the Mauritian Textile and Clothing (T&C) lies in investment in technology and human
capital that would give workers the capacity to manage new machines that will produce the luxury
goods which would give Mauritius an edge over its competitors.
189
References
Adhikari, R. and Weeratunge, C. (2007). “Textiles and Clothing in South Asia: Current Status
and Future Potential”. South Asia Economic Journal, 8:2 (2007): 171-203.
Boyenge, J.P. (2007). “ILO database on export processing zones (Revised)”, Sectoral Activities
Department, International Labour Office. Geneva: International Labour Organization.
Business for Social Responsibility (2004).“The Multi-Fibre Arrangement (MFA) Strategic
Sourcing Impact: The Private Sector Perspective.” Washington DC,: World bank avaliable at
www.bsr.org
Central Statistics Office Mauritius.Available at
http://statsmauritius.gov.mu/English/StatsbySubj/Pages/Productivity-and-Competitiveness.aspx.
Chaudhary, J., Mohanty, S., Misra S. and Pan, S. (2007). “The effects of MFA quota elimination
on Indian Fibre markets”.Applied Economics.
Cortright, J. (2001). “New Growth Theory, Technology and Learning: A Practitioner’s Guide,
Review of Economic Development Literature and Practice”, No 4, US Economic Development
Administration, Washington DC : Impresa Inc.
Currie, J. and Harrison, A. E. (1997).“Sharing the Costs: The Impact of Trade Reform on Capital
and Labor in Morocco”.Journal of Labor Economics, 15 (3): S44–71.
Diamond, A. Jr. (2006). “Schumpeter’s Creative Destruction: A Review of the Evidence”. Journal
of Private Enterprise, Vol. 22 No. 1: 22-36.
Dixit A.K. and Stiglitz J.E (1977).“Monopolistic Competition and Optimum Product
Diversity”.American Economic Review, 67: 297-308.
Espinoza, J.J (n.d). “Difference-in-Differences Estimation: Garbage Incinerators and Home
Prices”. Available at espin086.wordpress.com/2010/08/08/difference-in-difference.
190
Evans, C. and Harrigan, J. (2004). “Tight Clothing: How the MFA Affects Asian Apparel
Exports.” NBER Working Paper No. 10250. Cambridge, MA: National Bureau of Economic
Research.
Francois, J. and Spinanger, D. (2004). “Liberalizing quotas on textiles and clothing: has the ATC
actually worked?” 7th Annual Conference on Global Economic Analysis, June 17-19 2004,
Washington, DC available at https://www.gtap.agecon.purdue.edu/resources/download/1902.pdf
Goliath .D. (2009).“Mauritius facing up to China”, African Economic Conference 2009, 11-13
November 2009, United Nations Conference Centre, Addis Ababa, Ethiopia.
Government of Mauritius, Budget Speech (2008).Available at
http://www.docstoc.com/docs/35988027/2008-Mauritius-Budget-Speech.
Gray, S. (1995). “Findings, Africa Region No.37”.Industry and Energy Division, Central Africa
and Indian Ocean Department, World Bank Group. Washington DC: World Bank.
Imbens/Wooldridge (2007). Lecture Notes 10. Available at
http://www.nber.org/WNE/lect_10_diffindiffs.pdf
Joomun, G. (2006). “The Textile and Clothing Industry in Mauritius” in TheFutureof
theTextileandClothing Industry in Sub-Saharan Africa”, editedbyHerbert JauchandRudolf Traub-
Merz.Bonn, Germany: Friedrich-Ebert-Stiftung, pp.193–211.
Kurz, H. D. and Salvadori, N. (2008). “New Growth Theory and Development Economics”, in
Amitava Krishna Dutt and Jaime Ros, eds, International Handbook of Development Economics.
Cheltenham (U.K.): Edward Elgar, pp. 207-222.
L’express Mauritius (2010). Interview with Mr Mario Julienne, Director of Corona Textile, 17
July.
191
Lucas, R.E. (1988). “On the mechanics of economic development”, Journal of Monetary
Economics, 22: 3-42.
Nath, S. &Madhoo, Y.N (2003).“Draft Interim Report on Mauritius Case Study for the African
Economic Research Consortium Project Explaining African Economic Growth
Performance”.Department of Economics and Statistics.Reduit: University of Mauritius.
MacDonald S., Pan S., Somwaru, A. and Tuan, F. (2010). “China’s role in world cotton and textile
markets: a joint computable general equilibrium/partial equilibrium approach”. Department of
Agriculture, Economics Research Service, 1800M Street NW, Washington, DC, 20036-5831.
Mauritius Times Newspaper (2008).Interview with Paul Romer, Professor of Economics,
Standford University.online issue No. 303, 8 February 2008.
Milner, C. and Wright, P. (1998).“Modelling Labour Market Adjustment to Trade Liberalisation
in an Industrialising Economy.”Economics Journal, 108 (447): 509–28.
Mistry, P.S and Treebhoohun, N. (2009). “The Export of Tradable Services in Mauritius”, A
Commonwealth Case Study in Economic Transformation, London: Commonwealth Secretariat.
Moreira, Mauricio M., and Najberg, S. (2000). “Trade Liberalisation in Brazil: Creating or
Exporting Jobs?” Journal of Development Studies, 36 (3): 78–99.
Naumann, E. (2006). “The Multifibre Agreement, WTO Agreement on Textiles and Clothing”,
Tralac Working Paper: No 4/2006. Geneva: WTO.
Nordas, H. (2004). “The Global Textiles and Clothing Industry post the Agreement on Textiles
and Clothing”, WTO, Discussion Paper No.5. Geneva: WTO.
Pages-Serra, Carmen, and Gustavo Marquez. (1998). “Trade and Employment: Evidence from
Latin America and the Caribbean.” RES Working Paper No. 4108. Washington, DC: Inter-
American Development Bank.
192
Rama, M. (1994). “The Labor Market and Trade Reform in Manufacturing”, in The Effects of
Protectionism on a Small Country: The Case of Uruguay, ed. M. Connolly and J. de Melo. World
Bank Regional and Sectoral Studies. Washington, DC: World Bank, pp. 108–23.
Revenga, A. (1997). “Employment and Wage Effects of Trade Liberalization: The Case of
Mexican Manufacturing.” Journal of Labor Economics, 15 (3): S20–S43.
Rivera, S.A, Laurie-Ann A. and Judith D. (2004). “Africa Beyond 2005: understanding the impact
of eliminating NTBs and tariffs on textiles and clothing”. Paper read at the Sixth Annual
Conference on Global Economic Analysis, The Hague, The Netherlands, June 2003.
Romer, P.M. (1990). “Endogenous Technological Change” Part 2: The Problem of Development:
A Conference of the Institute for the Study of Free Enterprise Systems. (Oct., 1990), The Journal
of Political Economy, Vol. 98, No. 5: S71-S102.
Selvon, S. (2001).A Comprehensive History of Mauritius. Rose Hill: Mauritius Printing Specialists
(Pte) Ltd.
Servansingh, R. (2006). “Textiles and Garments in Mauritius, A Competitive Response to
Globalisation”.
Todaro, M. & Smith, S. (2009). “Economic Development”, 10th Edition, Pearson Education.
Trade Policy Review – Mauritius (2001).Available at
http://www.wto.org/english/tratop_e/tpr_e/tp177_e.htm.
University of Witwatersrand, Regional Centres for Learning on Evaluation and Results (2012).
Impact Evaluation Course: Policy Makers and Analysts, “Differences-in-Differences and Within
Regression Estimators” Session T6.
193
United Nations Conference on Trade and Development UNCTAD (2005).“TNCs and the Removal
of Textiles and Clothing Quotas”.UNCTAD/ITE/IIA/2005/1. New York and Geneva: United
Nations.
United Nations Conference on Trade and Development (UNCTAD) (2008).“Training Module on
Trade in Textiles and Clothing.The Post-ATC context”. New York, Geneva: United Nations.
Wacziarg, R. and Wallack, J.S, (2004). “Trade Liberalization and IntersectoralLabor
Movements.”Journal of International Economics, 64 (2): 411–39.
Wenfan, L. (2009).“The Analysis of Developed and Developing Countries Textile Exports under
the Current Trading System”, International Business Research, vol 2 no.2 pages131-136.
World Bank (2009). “International Bank for Reconstruction and Development: Globalisation,
Wages and the Quality of Jobs – Five Country Studies”. Washington DC: World Bank.
World Trade Organisation (n.d.).www.wto.org.
World Integrated Trade Solution (WITS): http://wits.worldbank.org/
Yang, Y. and Montfort M. (2007). “The end of textiles quotas: a case study of the impact on
Bangladesh”, The Journal of Development Studies, Oxfordshire: Routledge.
CHAPTER 6
CONCLUSION

194
6.1 Introduction
The primary research question posed by the thesis was: “What was the contribution of the
Export Processing Zone (EPZ) to the economic growth of Mauritius?” To do this, after the
introductory chapter 1, chapter 2 identified the political economy factors that contributed to the
successful creation of the EPZ in Mauritius. Chapter 3 provided an overview of the contribution
of EPZ to GDP prior to and during the take-off phase. It also sought to identify the trade theory
most suited to explain the EPZ story of Mauritius. Using the identified trade theory, the possible
factors contributing to the success of the Mauritius EPZ, which made Mauritius an exception in
Africa, were identified. In chapter 4, cross-country data from EPZ and non-EPZ countries were
used to investigate empirically whether EPZ on its own was a guarantee for success, or whether
success was determined by other factors. Chapter 5 looked at the impact of the removal of
preferences on the EPZ sector in Mauritius and how the sector is coping with the changes in the
international environment.
6.2 Findings
This section brings together the main findings of the study. The findings are chapter-specific and
will be synthesised by providing answers to the five main research sub-questions of the thesis.
They are:
(i) What are the political economy factors that created the enabling environment for the
creation of the successful EPZ in Mauritius?
In Chapter 2 the political economy factors which facilitated the creation of the EPZ in Mauritius
were identified based on previous studies and recent literature. These factors are inclusive
institutions (prior to and after independence), ideas, luck, leadership, a dual-track economic
strategy, ethnic diversity and ethnic ties to other continents and compromises around vested
interests. All these factors contributed to the unique framework within which the Mauritius EPZ
was created. All the factors had their own weight, though some were more important than others.
It was found that at a very early stage the government decided to deal with demands from its
constituents by moving towards inclusive political institutions where, instead of power being
vested in a narrow group, the government would encourage a broad coalition of many groups to

195
share power. The inclusive institutions of democracy, a British-style parliament and a constitution
which emphasised the protection of property rights provided a guarantee that there would be no
expropriation of the Franco-Mauritians’ sugar plantations. This helped in securing the support of
colonial elites.
This strategy also made it possible for Mauritius to promote new elites without having to adopt the
concept of ‘creative destruction’, as the sugar plantation elites kept their privileges, while
newcomers benefited from the advantages offered by the ISI and EPZ. This led to an increase in
the number and ethnic composition of the elites. One could also see that the protection of vested
interests played an important role in determining the strategy of Mauritius to move to adopting the
EPZ. As a result of its design, the development of the EPZ was made compatible with the interests
of the ruling elites.
Thus, EPZs are not as ideal an economic solution as full liberalisation, but they can help in that
they take political considerations into account. The presence of democratic institutions in
Mauritius were vital as they pushed elites into a compromise solution without which the country
could probably have been stuck with only sugar exports and ISI.
(ii) What was the contribution of EPZ to the country’s economy at the time of take-off?
Chapter 3 showed that the growth of the Mauritian economy during the period 1983-1990 was
found to be driven strongly by growth in the EPZ sector. The average EPZ growth for the period
was 19.2% of GDP, while that of the sugar sector was at -1.3% of GDP. Also, the evolution of
growth in the EPZ, the sugar sector and the GDP growth at constant prices of the Mauritian
economy for the same period showed that growth rates in the EPZ sector and GDP growth were
positive throughout the period, and EPZ growth rates were consistently higher than the GDP
growth rates until 1989, meaning that the EPZ contribution to economic growth was strengthening
during that period.
EPZ as a percentage of GDP also grew steadily and more than doubled in three years (1983-1986).
Between 1976 (when the EPZ was still in its infancy) and 1983 (when the EPZ can be said to have
taken off), total exports of goods and services more than doubled from Rs 2,705 million to reach

196
Rs 5,953. This also gave an indication that the EPZ made an increasingly important contribution
to total exports.
Finally, it was noted that EPZ exports soared in 1987 with a threefold increase over 1984,
surpassing sugar. As a percentage of total export earnings, the EPZ sector accounted for 56.0% in
1987 and more than two thirds of total exports in 1997. This confirmed the boom in EPZ exports
and the fact that the EPZ sector at take-off was contributing significantly to GDP and to exports.
(iii) Which trade theory best explains the EPZ take-off in Mauritius?
In Chapter 3, the neoclassical and new trade theories were reviewed to find out which one of them
was more appropriate to explain the factors behind the success of EPZ in Mauritius.
The H-O model stipulates that a country will produce and export only those goods which
intensively use the factor of production with which it is relatively well-endowed. In terms of this
model, Mauritius would to this day have only two sectors in which the country has a comparative
advantage (i.e. sugarcane plantations, which make use of the abundant agricultural labourers, and
perhaps the tourism sector, for which the country had good potential) and would be importing
those products in which it did not have a comparative edge, in this case manufactured goods from
the USA and EU.
However, in practical terms the H-O model did not seem to fit the Mauritian reality during the
1970s, as foreign investors seemed to show a lot of interests in the new EPZ, where employment
was expanding rapidly, but not at the expense of the sugar sector.
Also, the growth in the EPZ did not cause any distortion to the sugar sector, which continued to
experience sustained growth throughout the period. In fact, the increase in employment in EPZ did
not lead to an automatic decrease in employment in the sugar sector, principally because the EPZ
was targeting more school leavers, in particular the first batch of girls who had benefited from free
education at secondary level since 1976.
As regards real GDP growth, it remained positive throughout the period, which showed that there
was no drastic fall in national income at international prices, as asserted by the Hamada model.
197
Given that the H-O model is unable to explain the Mauritius EPZ story, an alternative trade theory
was tested to see whether it would be more suitable to account for what happened in Mauritius.
The new trade theory proposed by Krugman and Venables (1995), with its emphasis on transport
and wage costs, seemed to fit the Mauritius EPZ story better. Geography is central to the theory
developed by Krugman and Venables (1995). It includes transport costs; the inclusion of transport
costs in international trade theories contrasts with the H-O model which assumed that
transportation was costless.
The Krugman/Venables model also stresses the fact that increasing returns create economies of
scale, and the consequences of the scale economies and the assumption of labour immobility will
lead to goods being produced in specific locations. And if cost of production is assumed to be the
same in all countries, then the decisive factor in location is transport costs. With increasing returns,
the assumption of common wages also needs to be relaxed, meaning that wage differentials will
also be a determining factor for location. Thus the Krugman and Venables model clearly
incorporates the effects of transport costs and wages on the gains from trade.
Although, with limited data on transport costs, we have been unable to conclusively provide
evidence that falling transport costs contributed to the success of the EPZ, stronger evidence has
been provided of the role played by low wages in the EPZ take-off.
To see whether the low wages factor was causal in the success of EPZ in Mauritius, a comparison
was made of the wages in Mauritius with those in other African and Asian countries that had
operational EPZs in the 1980s – namely, Egypt, Liberia, Mauritius, Morocco, Senegal, Togo,
Tunisia, Bangladesh, Hong Kong, Philippines, Malaysia, Sri Lanka and Singapore. Wages per day
(in US dollars) in manufacturing during the period 1981 to 1987 in these countries was used. The
results showed that Mauritius was the third cheapest location, overtaken only by Sri Lanka and
Bangladesh which, it should be noted, did not benefit from the preferences that Mauritius received
under the Lomé II Convention (after 1980). On the other hand, Egypt also had the same preferences
and an EPZ, but their wage rates were much higher. For instance, for the years 1982-1985
immediately preceding and following the EPZ take-off in Mauritius, the average wage for that
period in Mauritius was 2.45 USD/day compared to 4.70 USD/day in Egypt.
198
In trade theory terms it is therefore clear that the successful implementation of the EPZ was much
more the result of factors identified by the new trade theory of Krugman and Venables than relative
factor endowments in terms of the H-O theory. The weight of the factor, i.e. low wages in the EPZ
take-off, was significant but the success would not have taken on such proportions if Mauritius did
not use the preferential access that Mauritius had to the EU and US markets through the Lomé
Convention in a timely manner. It is important to highlight that all of this would not have been
possible if Mauritius did not possess the political economy factors identified earlier, which were
probably unique to Mauritius and which provided the integrated framework on which the EPZ
evolved.
(iv) What is the association between EPZ and success?
Chapter 4 demonstrated that from a general perspective, countries that had an EPZ seemed to be
more successful. The empirical analysis undertaken here sought to shed light on the direction of
this association: is it the adoption of EPZs that lead to success, or does economic success lead to
the adoption of EPZs, or are there other contributing factors to success? First of all, the probit
results indicated that those countries that would adopt the EPZ within the next five years were
already performing well in terms of exports and political democracy, and they were competitive
in terms of income per worker and purchasing power parity (PPP).
From the OLS it was found that EPZ (t+5) and (t+10) were associated with success in terms of the
success measure rate of manufacturing exports to GDP (x/GDP), but success was also seen to
depend quite significantly on log (ln) income per worker, which is used as a proxy for wages and
TFP. Also, when the political stability index is added to the equation, it has no effect on the EPZ
coefficients. The OLS results suggest that EPZ was associated with success of countries measured
in terms of x/GDP. However, from the various control factors that could have also been associated
with success, ln income per worker and TFP are also seen to have been major determining factors.
When we controlled for selection of countries into the sample to see whether the results obtained
from the 80 countries are different from those of the sample limited to 38 countries, the results
showed that EPZ (t+10) is significant for both 80 countries and 38 countries using the success
measure x/GDP, while there does not seem to be any significant EPZs for either the 80 or the 38
countries for the alternative measure of success, showing that the coefficients are not very different
199
between the broad 80 countries and the sample of 38. This leads to the conclusion that there may
not have been a selection bias in choosing the 38 out of the 80 countries.
From the OLS estimates, the probability of EPZ (especially EPZ (t+10)) affecting x/GDP seems
to be significant with a very high coefficient. However, the probit results indicate that EPZ may
be endogenous and thus related to factors such as Predisposition to Exports, Political Democracy,
Income per Worker and PPP. Even though EPZ (t+10) was treated as an independent variable, it
is known that it may be a function of other factors and its coefficients may be biased.
To test this, a two-stage least squares (2SLS) estimator was used. The first stage uses x/GDP, EPZ
(t+10) and the usual control variables, namely Ln Income per Worker, Political Democracy Index,
Lomé, TFP and PPP. The second step uses the same variable but with the addition of Sino
Population (the term used in Mauritius for the population group whose descendants came from
China) of >1% of total population for each country. The reason for the addition of the Sino
Population is that in the success stories of many EPZ countries, especially in Africa, it seems that
most of the initial investments and groundwork was done by the Chinese immigrants who
maintained diaspora links with China. The instrument Sino Population may thus have an effect on
EPZ but not on the success measures x/GDP and growth. With the result obtained, the null
hypothesis could be rejected that EPZ is exogenous and it could be confirmed that the EPZ is
endogenous and its coefficient biased. The 2SLS results indicated that EPZ was itself
endogenously determined by other factors, which may have biased upwards its influence on
success.
To analyse whether there is a real difference in the success measures with and without an EPZ, all
80 countries were taken and divided into 2 groups; the first 40 are those countries that had an
average value greater than or equal to 0.85% for x/GDP measure of success and the second group
are those countries with an average value x/GDP less than 0.85%. A similar exercise was done for
the alternative measure of success, i.e. growth rates of real GDP, with the first group consisting of
those countries that had an average growth rate of 2.18% or higher. The results for both success
measures indicated that 17 out of 33 countries that had EPZ were in the first group of successful
countries, while the remaining 16 were in the second group of less successful countries for both
success measures. This raised serious questions about whether EPZs in themselves had any real
impact on the economic success achieved by individual countries.

200
Finally, considering the types of EPZ zones and whether one type was yielding better results than
another, it was found that countries that provided more facilities were not necessarily more
successful in terms of our measure of success, i.e. ratio of x/GDP. The incentives appear to act
more as a facilitator for the establishment and smooth running of the EPZs rather than being causal
in the success of EPZs. Similar results were obtained with the types of EPZ incentives compared.
The empirical results confirmed that there is no general association between EPZ and success. But
this should not stop one from thinking about possible scenarios regarding the effect of EPZ on
success. The first scenario, which was confirmed by the probit results, is that those countries that
were successful and had an EPZ would have experienced some success anyway – with or without
an EPZ. The second is the possibility that EPZs were adopted by countries that were already set
up for success but EPZs nevertheless contributed in some way to the scale of success. Though the
empirical results do not show an association between EPZ implementation and success, the
question remains as to whether Mauritius would have been as successful as it has been if it had not
adopted the EPZ. To attempt a response to this question, a further study may be needed on the
relationship between only those countries that implemented an EPZ effectively and success.
(v) How did the removal of preferences affect the Mauritian EPZ?
In Chapter 5, it is noted that with the creation of the WTO and the complete removal of preferences,
the future of the Mauritian EPZ, in particular the textiles and clothing sector (which constitutes the
bulk of EPZ exports), seemed very uncertain. Most studies related to the removal of preferences
on textiles and clothing generally reveal welfare losses for countries such as Mauritius. Chapter 5
analysed the evolution of the Mauritian manufacturing sector and its various product groups during
and after the removal of preferences to see whether there was in fact a sudden fall in exports and
employment (the two performance indicators), and whether that fall was specific to textile and
clothing products once the preferences were removed.
Starting with the EPZ’s export performance, the analysis showed that Mauritius EPZ exports to
the EU did not seem to have been affected by the removal of preferences. However, exports to
North America decreased systematically after 2002. As far as total EPZ exports are concerned, the
data reveal a slight fall from 2000-2006 but a steady increase after 2006 principally due to the

201
diversification of EPZ exports towards South Africa and Madagascar, the prolongation of AGOA
preferences and increasing productivity in the textiles and clothing sector.
As regards the employment performance indicator, the analysis showed that EPZ employment fell
slightly after 2005, but this was not specific to the EPZ as employment in the whole manufacturing
sector was actually also falling during that same period. However, employment for the rest of the
economy was rising, which indicates diversification away from manufacturing.
A detailed look at the various product groups in the manufacturing sector showed that in terms of
exports, Apparel was by far the highest exporter in the EPZ sector, but with very significant falls
from 2003-2005 and growth resuming after 2006. Jewellery also came up as the second most
important product group as from 2005-2006. As far as total exports are concerned, the analysis
showed an upward trend throughout the period 1995-2010, indicating that total exports seemed to
be unaffected by the changes in the preference regimes, confining pre- and post-preference effects
only to the EPZ sector.
As regards employment, Apparel was also the biggest employer and the statistics showed an
increasing trend until around 2002, but with a sudden drastic decrease as from 2003, the beginning
of the third stage of the quota removal under ATC. In general, there was a fall in the textile sector
and an even more significant decrease in the apparel sector after MFA.
Next, a comparison of countries’ exports which had EPZs similar to those of Mauritius was carried
out to provide us with a list of countries that have or will become direct competitors to Mauritius
in the more deregulated global trading environment. A look at imports into the USA and EU, which
are the two main markets for textiles and clothing, showed that China, Bangladesh, Sri Lanka and
India exported more to the USA after 2005, while Mauritius and other African countries
experienced a fall in exports to the USA after 2004. A similar trend was observed as far as imports
by the EU were concerned.
To analyse in more detail the real impact of the removal of preferences, difference-in-difference
(DID) estimates were used, which compare changes in textiles and apparel sectors with other
sectors. The results show that the removal of preferences had an impact on the textile and apparel

202
sectors, but the negative effect was less than some might have expected. Although regression
analysis confirms that the DID results showed a fall in exports of 27.2%, which was significant for
the textiles and apparel group, it is still maintained that contrary to existing perspectives, Mauritius
did not suffer major losses from the phasing out of the MFA. This was principally achieved through
the diversification of the exports to non-EU markets which, when taken into consideration, shows
the fall in exports to be 22.3%.
6.3 Contribution to Knowledge
Previous studies have identified some of the factors contributing to Mauritius’ EPZ success, but
they have not provided a theoretical framework within which all the factors contribute to a unique
framework underpinning success. The approach used in chapter 2 brings together all existing
explanations and assesses their contribution towards an integrated political economy framework
that can explain the success of the EPZ. Thus, though factors have been recognised – such as
inclusive institutions, ideas, luck, leadership, dual-track economic strategy and ethnic diversity –
in the choice of creating an EPZ in Mauritius, there was also a strong component of compromise-
based politics that entered into the Mauritius equation which guided the decisions of the
government. In this way a more comprehensive political economy explanation for the EPZ
successes achieved in Mauritius has been provided.
In Chapter 3 it was noted that previous analyses of Mauritius’s EPZ did not investigate trade
theories to see how they could actually be used to explain the success of the EPZ in Mauritius. The
chapter contributed towards filling this gap by providing an assessment of the neoclassical and
new trade theories to see if they could be useful in explaining the factors behind the EPZ take-off
in Mauritius. It was concluded that the Krugman and Venables theory, which falls within the new
trade theory approach, is more appropriate for the task of explaining the Mauritius EPZ and its
determinant factors, in particular labour costs.
On the basis of the approaches employed in Chapter 4, it seems that although those countries
adopting an EPZ tend to be globally more successful in terms of two success measures – x/GDP
and growth rates – a more in-depth analysis shows that this hypothesis cannot be proved
statistically, and adopting an EPZ does not necessarily lead to the general effect of bringing success
to a country.
203
In Chapter 5 it was shown that existing literature on the effects of the MFA phase-out generally
acknowledges net welfare losses for countries such as Mauritius to the benefit of China and India.
They also stress that exports will definitely be affected, while effects on employment will be
minimal. Although the results show without any doubt that removal of preferences did have an
impact, the negative effect on the performance indicators was less than expected. The contribution
of this chapter to the existing literature is that it shows that Mauritius’s losses after MFA were
actually quite small. Exports remained at satisfactory levels for two main reasons – namely,
diversification of exports towards non-EU markets, and the emphasis on niche products targeting
the high-end market.
Most analyses of the EPZ story in Mauritius have a tendency to link the EPZ with success. But, as
indicated above, the fact is that the empirical evidence does not show a direct association between
EPZ and success. What is clear, however, is that the success of Mauritius can be explained because
the country had an inclusive political economy framework at the time of the creation of the EPZ –
it had cheap labour and made optimal use of the preferences at the right time. The country was
also able to diversify and develop resilience after the preferences had been removed, as there was
no significant negative impact on the textile and clothing sector in Mauritius, which to date remains
one of the most important contributors to Mauritius’s GDP.
To draw lessons from the success of the Mauritius EPZ, it is therefore necessary to take all the
factors explored within this thesis into consideration within a broad framework. The thesis shows
that, while EPZs can make a vital contribution to economic success and produce positive
development outcomes, they are not ‘silver bullets’, able to generate positive outcomes regardless
of the context in which they are implemented.
6.4 Recommendations
To create a successful EPZ it is absolutely indispensable to have the necessary political economy
factors that will produce an environment conducive to the evolution of an EPZ. It is also clear that
vested interests were strongly present in Mauritius, but luckily the pursuit of these interests was
accommodated in such a way that other sections of the population were not left out in the process.
The core recommendation of the political economy chapter is that it is normal for vested interests
to exist. However, in the process of bringing change one should ensure that the vested interests of

204
the current political elite are taken into account, while, at the same time, building opportunities for
others to move up the income ladder and expand the size and diversity of the elite. This is the only
way that will ensure a peaceful and productive transition.
The importance of inclusive political and economic institutions on which the foundation of any
EPZ rests should also be present and functioning before a decision to create an EPZ is taken.
Although one can argue that even without inclusive institutions, which is the basis for a democratic
society, countries like China have been able to successfully adopt the EPZ concept. It can be said
that the issue is that within a democratic dispensation it is more likely that an EPZ will be pursued
effectively, because it becomes a way to include members of the electorate without directly
challenging entrenched interests. Thus, when all the political economy factors analysed in Chapter
2 are in place, then only can we look at how to use the advantages that the country has to offer to
try and obtain a competitive edge over others. Africa has a lot of reason to be optimistic, as many
countries on the continent have the necessary human resources and relatively cheap labour to get
into the textile and clothing industry productively. However, first they must ‘get their house in
order’ by making sure that they have the right institutions, which could provide the political
economy framework within which the industry can evolve.
What does the future hold for the textile and apparel industry in Mauritius? In line with the findings
of Chapter 5, it can be noted that human capital and technology have helped to mitigate the impacts
of the removal of preferences. Now the government needs to develop these trends further. The
government of Mauritius has embarked on an ambitious project with the objective of building a
knowledge hub. The first step was the creation of a separate Ministry for Tertiary Education, whose
function is, inter alia, to attract the best universities to open antenna campuses in Mauritius.
As a first option, Mauritius should focus on the areas where its universities could provide courses
best suited for the needs of Mauritius. It is highly recommended that with a view to increase the
competiveness of the Mauritian labour forces, the government should continue to support higher
education in Mauritius and provide incentives for students to enrol in advanced courses. The
country should be able to produce high-quality graduates within the next ten years, if it is to
compete effectively with countries such as India and China, and if it is to remain in the business
of exporting its textiles and apparel. In this highly liberalised world, suppliers will now look for
high-quality products. To give Mauritius a competitive edge, now that it is no longer in the low-

205
cost producers group, the country needs highly qualified middle- and top-level cadres in the
Mauritian apparel industry, whose daily activities will be to focus on innovative ideas to give the
industry an edge. If this is to happen, Mauritius will then have the ability to develop textile and
apparel companies employing the latest technologies with a pool of well-paid professionals
running these companies. At the same time, of course, new, skills intensive export opportunities
could open up if Mauritius continues on this course.
The second option for Mauritius is to do away with the traditional markets and focus much more
on countries in the region. There has been a move in recent years to export to non-EU and some
African markets. But Mauritius needs to display more initiative and adopt a more proactive
approach to the emerging African markets. More market research needs to be channelled towards
the Eastern and Southern African markets. By virtue of its membership to the SADC, Mauritius
should tap the opportunities offered by these markets. The Mauritius government and private
sector should consider these markets that still have cheap labour where infrastructure and the
political economy factors are still lacking, before the Chinese hegemony becomes firmly
established. The country has a long experience in Export Processing Zones, its own EPZ has been
in operation for 43 years, which very few countries in Africa can claim to rival. Mauritius has the
capacity to provide high-quality products to the growing African middle class as well as guidance
on how to put in place the necessary political economy factors essential to create confidence among
investors. Mauritius should also be able to provide consultancy services to put in place the
necessary transport and communications infrastructure essential for the setting up of
manufacturing businesses for the textiles sector in African countries. Mauritius can thus become a
hub for high-value products into Africa. Mauritius may also look towards the Eastern European
markets, which are providing a lot of incentives for outside countries to penetrate their markets
now that the Eurozone is in financial difficulty. Rather than seeing the Euro crisis as a threat,
Mauritius should seize the opportunity to enter the Eastern European region, whose doors are now
wide open to investors from Africa.

206
References
Krugman, P. and Venables, A. (1995). “Globalization and the Inequality of Nations” The
Quarterly Journal of Economics, Vol. 110, No.4: 857-880.

207