chapter 1 introduction to crystal growth and...
TRANSCRIPT

1
CHAPTER 1
INTRODUCTION TO CRYSTAL GROWTH AND
CHARACTERIZATION TECHNIQUES
1.1 HISTORICAL INTRODUCTION
Crystals are the unacknowledged pillars of modern technology. In
the past few decades, there has been a growing interest on crystal growth
processes, particularly in view of the increasing demand of materials for
technological applications (Brice 1986, Nalwa and Miyata 1997). Crystal
growth is an interdisciplinary subject covering physics, chemistry, materials
science, chemical engineering, metallurgy, crystallography, mineralogy, etc.
The growth of single crystals is both scientifically and technologically
important, and the applications of such crystals today range from electronics
to thermal management to synthetic gemstones.
Fundamental aspects of crystal growth had been derived from early
crystallization experiments in the 18th and the 19th century (Elwell and Scheel
1975 and Scheel 1993). Theoretical understanding started with the
development of thermodynamics in the late 19th century and with the
development of nucleation and crystal growth theories and the increasing
understanding of the role of transport phenomena in the 20th century. The
phenomena of undercooling and supersaturation and the heat of crystallization
were already recognized in the 18th century.

2
The rates of nucleation and crystallization in glasses were the
foundation to nucleation theories. The work of separation of crystal units as
repeatable steps as the basis of the first crystal-growth theories. With the
understanding of facet formation as a function of the entropy of fusion
(Jackson 1958) and depending on the density of bonds in the crystal structure
(Hartman and Perdok 1955) the role of screw dislocations as continuous step
sources in the formation of growth hillocks (Frank and Van der Merwe 1949),
and with the generalized crystal growth theory of Burton (Burton et al 1951),
many growth phenomena could be explained.
In the growth of crystals from a fluid medium (melt, solution, gas
phase) the heat and mass transport phenomena also play a significant role, as
was observed early by Rouelle (1745). The diffusion boundary layer defined
by Noyes and Whitney (1897) was used in the growth-rate equation of
Nernst (1904) and confirmed by interferometric measurements of
concentration profiles around growing crystals. Forced convection was
recognized to be beneficial for diffusion-limited growth. The growth of
inclusion-free crystals from the melt can be accomplished by observing the
principles of “diffusional undercooling” (Ivantsov 1951) and “constitutional
supercooling” (Tiller et al 1953). Formation of inclusions, i.e. growth
instability, can be prevented in growth from solutions by sufficient flow
against or along the crystal facets developed an empirical theory which was
utilized by Scheel and Elwell (1972) to derive the maximum stable growth
rate and optimized programming of supersaturation for obtaining large
inclusion-free crystals.
Microscopic and macroscopic inhomogeneities in doped crystals
and in solid solutions are caused by segregation phenomena, which are related
to mass and heat transfer. Based on the derivation of effective distribution
coefficients for melt growth by Burton et al (1953) and by van Erk (1982) for

3
growth from solutions, the theoretical and experimental conditions for growth
of striation-free crystals could be established (Rytz and Scheel 1982, Scheel
and Sommerauer 1983, Scheel and Swendsen 2001).
There have been remarkable developments with respect to size and
perfection of crystals, with silicon, sapphire, alkali and earth alkali halides
reaching diameters up to 0.5 m and weights of nearly 500 kg. These advances
in Czochralski, Kyropoulos, heat-exchanger method, and
Bridgman–Stockbarger growth were accompanied by numerical simulations
which have become increasingly powerful to predict the optimized conditions.
However, further advances in computer modelling and in the reliability of the
used physico-chemical data are required in order to increase the efficiency
and precision of computer simulations and to allow the prediction of the best
crystal-growth technology including growth parameters for the growth of new
large and relatively perfect crystals.
1.2 TECHNIQUES USED TO GROW CRYSTALS
Nowadays crystal growth technology is largely used to grow
crystals such as NLO crystals, piezo-electric crystals, Ferro-electric crystals,
sensitive crystals and crystalline films. Preparation of single crystals of such
materials has resulted in growing realization for the importance of crystal
growth, in the theoretical and experimental aspects. The preparation of single
crystal is mainly based on the availability and nature of the starting materials
and their physico-chemical properties. Crystal growth concept has been
fundamental to many areas of science and technology.
Crystals can be grown in any one of the following four
transformations (Pamplin 1975).

4
1. Solid-state reaction involving solid-solid phase transition.
2. Solution growth process involving Liquid-solid phase transition.
3. Vapour growth process involving vapour-solid phase transition.
4. Melt growth process involving liquid- solid phase transition.
The general condition for all the above mentioned processes is that
the growing crystals must have lower free energy than the initial state of the
system.
Growth of crystal ranges from a small inexpensive technique to a
complex sophisticated expensive process and crystallization time ranges from
minutes, hours, days and to months. The method of growing crystals is very
wide and mainly dictated by the characteristics of the material and their size
(Buckley 1951, Mullin 1976). Accordingly the basic growth methods are
1. Growth from melt
2. Growth from solution and
3. Growth from vapour
1.2.1 Growth from Melt
All materials can be grown in single crystal form, from the melt
provided they melt congruently without decomposition at the melting point
and do not undergo any phase transformation between the melting point and
room temperature. Depending on the thermal characteristics, techniques are
classified as
(i) Bridgman technique
(ii) Czochralski technique
5
(iii) Kyropoulous technique
(iv) Zone melting technique
(v) Verneuil technique
1.2.2 Growth from Solution
Materials, which have high solubility and have variation in
solubility with temperature, can be grown easily by solution method. There
are two methods in solution growth depending on the solvents and the
solubility of the solute. They are
1. Low temperature solution growth
2. High temperature solution growth (or) Flux growth
1.2.2.1 Low temperature solution growth
Growth of crystals from aqueous solution is one of the ancient
methods of crystal growth. The method of crystal growth from low
temperature aqueous solutions is extremely popular in the production of many
technologically important crystals. It is the most widely used method for the
growth of single crystals, when the starting materials are unstable at high
temperatures (Pamplin 1975) and also which undergo phase transformations
below melting point (Hooper et al 1980). The growth of crystals by low
temperature solution growth involves weeks, months and sometimes years.
Though the technology of growth of crystals from solution has been well
perfected, it involves meticulous work, much patience and even a little
amount of luck. A power failure or a contaminated batch of raw material can
destroy months of work.

6
Materials having moderate to high solubility in temperature range,
ambient to 100°C at atmospheric pressure can be grown by low-temperature
solution method. The mechanism of crystallization from solutions is
governed, in addition to other factors, by the interaction of ions or molecules
of the solute and the solvent which is based on the solubility of substance on
the thermodynamical parameters of the process; temperature, pressure and
solvent concentration (Chernov 1984). The advantages of crystal growth from
low temperature solution nearer the ambient temperature results in the simple
and straight forward equipment design which gives a good degree of control
of accuracy of ± 0.01ºC. Due to the precise temperature control,
supersaturation can be very accurately controlled. Also efficient stirring of
solutions reduces fluctuations to a minimum. The low temperature solution
growth technique is well suited to those materials which suffer from
decomposition in the melt or in the solid at high temperatures and which
undergo structural transformations while cooling from the melting point and
as a matter of fact numerous organic and inorganic materials which fall in this
category can be crystallized using this technique. The low temperature
solution growth technique also allows variety of different morphologies and
polymorphic forms of the same substance can be grown by variations of
growth conditions or of solvent (Hooper et al 1979). The proximity to
ambient temperature reduces the possibility of major thermal shock to the
crystal both during growth and removal from the apparatus.
The main disadvantages of the low temperature solution growth are
the slow growth rate in many cases and the ease of solvent inclusion into the
growing crystal. Under the controlled conditions of growth the solvent
inclusion can be minimized and the high quality of the grown crystal can
compensate the disadvantage of much longer growth periods. After many
modifications and refinements, the process of solution growth now yields
good quality crystals for a variety of applications. Growth of crystals from

7
solution at room temperature has many advantages over other growth methods
though the rate of crystallization is slow. Since growth is carried out at room
temperature, the structural imperfections in solution grown crystals are
relatively low (Brice 1973).
Among the various methods of growing single crystals, solution
growth at low temperatures occupies a prominent place owing to its versatility
and simplicity. In the low temperature solution growth, crystals can be grown
from solution if the solution is supersaturated, that is it contains more solute
than it can be in equilibrium with the solid. Three principal methods are used
to produce the required supersaturation:
i. Slow cooling of the solution
ii. Slow evaporation of the solvent
iii. The temperature gradient method
Low temperature solution growth is a well-established technique
due to its versatility and simplicity. It is possible to grow large crystals of
high perfections as the growth occurs close to equilibrium conditions
(McArdle and Sherwood 1987). It also permits the preparation of different
morphologies of the same materials by varying the growth conditions.
1.2.2.1.1 Slow cooling technique
It is the best way to grow single crystals by solution technique. The
Main limitation is the need to use a range of temperature. The possible range
of temperature is usually small so little amount of the solute remains in the
solution at the end of the run. To compensate this effect, large volumes of
solution are required. The use of a range of temperatures may not be desirable
because the properties of the grown material may vary with temperature. Even

8
though the method has technical difficulty of requiring a programmable
temperature control, it is widely used with great success. The temperature at
which such crystallization can begin is usually within the range 45-75°C and
the lower limit of cooling is the room temperature.
1.2.2.1.2 Slow evaporation method
This method is similar to the slow cooling method in view of the
apparatus requirements. The temperature is fixed constant and provision is
made for evaporation. With non-toxic solvents like water, it is permissible to
allow evaporation into the atmosphere. Typical growth conditions involve
temperature stabilization to about ± 0.05°C and rates of evaporation of a
few ml/hr. The evaporation techniques of crystal growth have the advantage
that the crystals grow at a fixed temperature. But inadequacies of the
temperature control system still have a major effect on the growth rate. This
method is the only one, which can be used with materials, which have very
small temperature coefficient of stability.
1.2.2.1.3 Temperature gradient method
This method involves the transport of the materials from a hot
region containing the source material to be grown to a cooler region where the
solution is supersaturated and the crystal grows. The main advantages of this
method are that
(a) Crystal grows at a fixed temperature
(b) This method is insensitive to changes in temperature provided
both the source and the growing crystal undergo the same
change.
(c) Economy of solvent and solute.

9
On the other hand, changes in the small temperature differences
between the source and the crystal zones have a large effect on the growth
rate.
1.2.2.2 High temperature solution growth (or) Flux growth
The greatest advantage of crystal growth from high temperature
solutions (or flux growth) is that one can crystallise materials, which
cannot be obtained in single crystal form by any other method. Flux
growth methods, which allow the crystals to grow before the melting
temperature is reached, are used when the crystals melt incongruently or when
there is a phase transition before melting. The components of the final desired
materials are dissolved in a solvent. This method is based on the concepts of
solubility and supersaturation. At a given temperature, a limited amount of a
substance dissolves in a particular solvent. The amount dissolved defines the
solubility at that temperature. If a saturated solution is prepared at a certain
temperature and then cooled to a lower temperature, it contains more salt than
is permitted by the solubility at the lower temperature. The same happens if
some of the solvent is allowed to evaporate, the solution is now in the
supersaturated state, which is a metastable state and, with a slightest
induction, the extra salt precipitates.
If a seed crystal is introduced into the solution, the substance
precipitating from the solution grows around the seed crystal to form a larger
single crystal. In the absence of a seed, even dust particles provide a nucleus
for crystal growth. Crystallisation can be performed in air or any other
suitable atmosphere. Crystal growth is possible even if very little is
known about the crystallization conditions. For this reason, this method is
used as a preliminary one, to obtain new materials for the first time in

10
single crystal form, so that their physical and chemical properties can be
investigated.
1.2.3 Growth from Vapour
The growth of single crystal material from the vapour phase is
probably the most versatile of all crystal growth processes. Crystals of high
purity can be grown from vapour phase by sublimation, condensation and
sputtering of elemental materials. To obtain single crystals of high melting
point materials this method is used. The most frequently used method for the
growth of bulk crystals utilizes chemical transport reaction in which a
reversible reaction is used to transport the source material as a volatile species
to the crystallization region. Finding a suitable transporting agent is a
formidable, problem in this technique. It is rarely possible to grow large
crystals because of multi-nucleation.
The commercial importance of vapour growth is the production of
thin layers by chemical vapour deposition (CVD), where usually irreversible
reactions e.g. decomposition of silicon halides or of organic compounds are
used to deposit materials epitaxially on a substrate. Doping can be achieved
by introducing volatile compounds of dopant elements into the reaction
region. The thickness of the doped layer can be controlled.
1.3 SANKARANARAYANAN-RAMASAMY (SR) METHOD
Sankaranarayanan-Ramasamy method is one of the solution growth
methods. To grow high quality crystal with a reasonable yield, the
investigation of a possible single crystal growth technique is needed. Further,
growth of organic or inorganic crystal with specific orientation has
11
tremendous value in terms of its significance towards device application.
From this point of view, a novel Sankaranarayanan-Ramasamy crystal growth
method has more advantages when compared to conventional solution growth
techniques (Sankaranarayanan and Ramasamy 2005) and this can be
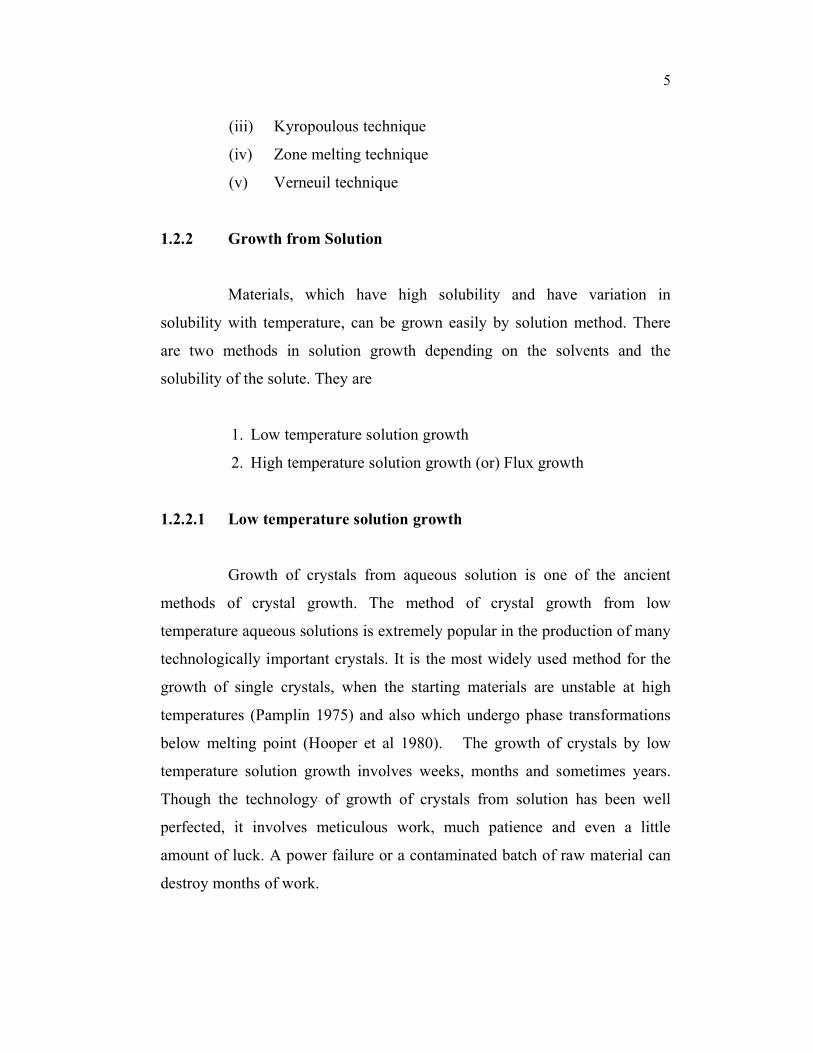
employed to grow unidirectional crystal from solution. Figure 1.1 shows the
schematic representation of SR method apparatus. It consists of heating coils,
seed-mounting pad, growth portion and top portion (made up of glass).
Heating coil is placed at the top of the crucible and it is directly connected to
thermostat to maintain the heater voltage. Heater voltage plays a major role in
this novel unidirectional SR method and this is used for solvent evaporation
of the growth solution. The entire SR method crucible was placed inside a
constant temperature bath (CTB) (accuracy ± 0.01°C) for avoiding
temperature fluctuations in the growth portion. Growth condition of this
method depends on the temperatures of heating coils. Once the growth
condition is optimized, it is easy to grow the crystals with different
orientations.
Figure 1.1 Schematic of experimental set up of SR method

12
The advantages of Sankaranarayanan-Ramasamy method are as
follows:
(i) Can grow single crystal with specific orientation from solution
(ii) Room temperature growth is possible
(iii) Solute-crystal conversion efficiency is almost 100 percent.
(iv) Simple experiment setup
1.4 GEL GROWTH
It is an alternative technique to solution growth with controlled
diffusion and the growth process is free from convection. Gel is a two-
component system of a semisolid rich in liquid and inert in nature.
The material, which decomposes before melting, can be grown in this
medium by counter diffusing two suitable reactants. Crystals with dimensions
of several mm can be grown in a period of 3 to 4 weeks. The crystals grown
by this technique have high degree of perfection and fewer defects since the
growth takes place at room temperature.
1.5 HYDROTHERMAL GROWTH
Hydrothermal implies conditions of high pressure as well as high
temperature. Substances like calcite, quartz are considered to be insoluble in
water but at high temperature and pressure, these substances are soluble. This
method of crystal growth at high temperature and pressure is known as
hydrothermal method. Temperatures are typically in the range of 400°C to
600°C and the pressure involved is large (hundreds or thousands of
atmospheres). Growth is usually carried out in steel autoclaves with gold or
silver linings. Depending on the pressure the autoclaves are grouped into low,
medium and high-pressure autoclaves. The concentration gradient required to
produce growth is provided by a temperature difference between the nutrient

13
and growth areas. The requirement of high pressure presents practical
difficulties and there are only a few crystals of good quality and large
dimensions are grown by this technique. Quartz is the outstanding example of
industrial hydrothermal crystallization. One serious disadvantage of this
technique is the frequent incorporation of OH- ions into the crystal, which
makes them unsuitable for many applications.
1.6 NUCLEATION
Nucleation is an important phenomenon in crystal growth and is the
precursor of the overall crystallization process. Nucleation is the process of
generating within a metastable motherphase, the initial fragments of a new
and more stable phase capable of developing spontaneously into gross
fragments of the stable phase. Nucleation may occur spontaneously or it may
be induced artificially. These are referred to as homogeneous and
heterogeneous nucleations respectively. Both these nucleations are called
primary nucleation and occur in systems that do not contain crystalline matter.
On the other hand, nuclei are often generated in the vicinity of crystals present
in the supersaturated system. This phenomenon is referred to as secondary
nucleation (Mullin 1972). Growth of crystals from solutions can occur if some
degree of supersaturation or supercooling has been achieved first in the
system. There are three steps involved in the crystallization process.
(i) Achievement of supersaturation or supercooling
(ii) Formation of crystal nuclei
(iii) Successive growth of crystals to get distinct faces
All the above steps may occur simultaneously at different regions
of a crystallization unit. However an ideal crystallization process consists of
a strictly controlled stepwise program.

14
1.7 OSTWALD’S DIAGRAM
The relationship between the concentration and temperature is
schematically shown in Figure 1.2 (Meirs and Issac 1987). Meirs carried out
extensive research into the relationship between supersaturation and
spontaneous crystallization. The lower continuous line is the normal solubility
curve for the salt concerned. Temperature and concentration at which
spontaneous crystallization occurs are represented by the upper broken curve,
generally referred to as the supersolubility curve. The whole concentration-
temperature field is separated by the saturated-solution line (solubility curve)
into two regions, unsaturated and supersaturated solutions. Saturated solutions
are those mixtures, which can retain their equilibrium indefinitely in contact
with the solid phase with respect to which they are saturated. The solubility of
most substances increases with temperature (the temperature coefficient of the
solubility is positive) and crystals can be grown only from supersaturated
solutions, which contain an excess of the solute above the equilibrium value.
The diagram is divided into three zones, which are termed as region I, II and
III respectively.
(i) The stable (undersaturated) zone, where crystallization is not
possible
(ii) The second region is a metastable zone, between the solubility
and supersolubility curves, where spontaneous crystallization
is improbable. However, if a crystal seed is placed in such a
metastable solution, growth would occur on it
(iii) Third region is the unstable or labile (supersaturation) zone,
where spontaneous crystallization is more probable
If the solution whose concentration and temperature represented by
point A in the Figure 1.2, is cooled without loss of solvent (line ABC)

15
spontaneous crystallization cannot occur until conditions represented by
point C are reached. At this point, crystallization may be spontaneous or
seeding, agitation or mechanical shock may induce it. Further cooling to some
point D may be necessary before crystallization can be induced, especially
with very soluble substances such as sodium thiosulphate.
Figure 1.2 Solubility diagram showing different levels of saturation
The evaporation of solvent from the solution may also result in
supersaturation. Line AB’C’ represents an operation carried out at constant
temperature. Penetration beyond the super solubility curve into the labile zone
rarely happens, as the surface from which evaporation takes place is usually
supersaturated to a greater degree than the bulk of the solution. Crystals,
which appear on this surface eventually fall into the solution and seed it.
In practice, a combination of cooling and evaporation as represented by the
line AB”C” in (Figure 1.2) is adopted.

16
1.8 EXPRESSION FOR SUPERSATURATION
The supersaturation of a system may be expressed in a number of
ways. The basic units of concentration as well as temperature must be
specified. The concentration driving force (∆C), the supersaturation ratio (S)
and relative supersaturation (σ) are related to each other as follows:
The concentration driving force ∆C = C – C* (1.1)
where C is the actual concentration of the solution at a given temperature and
C* is the equilibrium concentration at a given temperature.
Supersaturation ratio S = C / C* (1.2)
Relative supersaturation σ = (C - C*) / C*
σ = S – 1 (1.3)
If the concentration of a solution can be measured at a given
temperature and the corresponding equilibrium saturation concentration is
known, then, it is easier to calculate the supersaturation.
Growth of good quality single crystals by slow evaporation and
slow cooling techniques require optimized conditions. The same may be
achieved with the help of the following criteria: (i) material purification,
(ii) solvent selection, (iii) solubility, (iv) solution preparation, (v) seed
preparation, (vi) agitation, (vii) crystal habit and (viii) cooling rate.
1.9 CHOICE OF SOLVENT AND SOLUBILITY
Growth from aqueous solution provides information on the
fundamental process applicable to both low and high temperature solution

17
growth methods (Bordui et al 1987). Water is a popular solvent for the
growth of a variety of inorganic and organic compounds. It is not toxic and is
less volatile than organic solvents, which are, in general, toxic, volatile and
flammable. In comparison with organic solvents, it is also easily available in
the pure state and is cheap. Because of its higher boiling point than most of
the organic solvents commonly used for growth, it provides a reasonably wide
range for the selection of growth temperature. Moreover, it is chemically inert
to a variety of glasses, plastics and metals used in crystal growth equipment.
However, water is not a reversible solvent for some materials. It hydrolyses
some materials and introduces water of crystallization to others which may be
desired in the anhydrous form. Therefore, for the growth of crystals of a
compound from solution, the selection of a solvent is critical.
A simple rule of thumb in the proper selection of a solvent is
chemical similarity between the solvent and the compound to be grown. For
example, crystals of nonpolar organic compounds can be grown easily from
nonpolar organic solvents. Chemical similarity also determines solute
solubility in the solvent. Experiments reveal that a solvent in which the
compound has solubility between 10 and 60% at a given temperature is
economically suitable for crystal growth. Very low and very high solubility of
a solute provide low growth rates due to low solute concentration and
increased viscosity, respectively. Therefore, in both of these cases it is
desirable to use additives to change the solute solubility in a solvent or
solution viscosity. Additives not only change the properties of solutions, but
also lead to changes in the growth habits of crystals (Buckley 1951).
The solvent must be chosen taking into account the following
factors to grow crystals from solution. A solvent of choice is the one with
18
(i) A good solubility for the given solute
(ii) A good solubility gradient
(iii) Less viscosity
(iv) Less volatility
(v) Less corrosion
(vi) Non-toxic
If the solubility is too high, it is difficult to grow bulk single
crystals and too small a solubility restrict the size and growth rate of the
crystals. Solubility gradient is another parameter, which dictates the growth
procedure. Neither a flat nor a steep solubility curve will enable the growth of
bulk crystal from solution; while the level of supersaturation could not be
varied by reducing the temperature in the former, even a small fluctuation in
the temperature will affect the supersaturation to a large extent in the later
disabling the growth of good quality bulk crystals in both cases. If the
solubility gradient is very small, slow evaporation of the solvent is the other
option for crystal growth to maintain the supersaturation in the solution.
Growth of crystals from solution is mainly a diffusion- controlled
process; the medium must be less viscous to enable faster transport of the
growth units from the bulk solution by diffusion. Hence a solvent with less
viscosity is preferable (Ohara and Reid 1973). The solubility data at various
temperatures are essential to determine the level of supersaturation. Hence,
the solubility of the solute in the chosen solvent must be determined before
starting the growth process (Christian 1990).
The solubility of the solute may be determined by dissolving the
solute in the solvent maintained at a constant temperature with continuous
stirring. On reaching saturation, the equilibrium concentration of the solute
may be determined gravimetrically. A sample of the clear supersaturated

19
liquid is withdrawn by means of a warmed pipette and a weighed quantity of
the sample is analyzed. The solubility curve can then be plotted in this way by
repeating the above for different temperatures.
1.10 NONLINEAR OPTICS
Nonlinear optics is attracting the attention of researchers due to its
wide application in the area of laser technology, optical communication and
data storage technology. Nonlinear optics (NLO) is the interaction of intense
electromagnetic fields with materials to produce modified fields that are
different from the input field in phase, frequency or amplitude (Firdous
Anwar 1988). The light propagates through a crystalline solid, which lacks a
centre of symmetry, generates light at second harmonics of the applied
frequency. This important nonlinear property of noncentro-symmetric crystals
is called second Harmonic generation (SHG) and this phenomenon and the
materials in which it occurs is the subject of intense study (Chemla and Zyss,
1987). In the beginning nonlinear optics is often taken to be discovery of
second-harmonic generation by Franken et al (1961), after the demonstration
of the first working laser by Maiman (1960). Second harmonic generation
observed the ultraviolet light at twice the frequency of a ruby laser light, when
the light was made to traverse through a quartz crystal. Numerous nonlinear
optical phenomena have been discovered since then. The existence of
harmonic light waves at the boundary of a nonlinear dielectric medium was
predicted by Blombergen and Pershan (1962). Some materials change light
passing through them, depending upon orientation, temperature, light
wavelength etc. (red light, lower wavelength) releasing one photon of
accumulated higher energy (blue and green light, higher wavelength). NLO
materials typically have a distinct crystal structure, which is anisotropic with
respect to electromagnetic radiation.

20
1.11 THEORY OF NONLINEAR OPTICS
The explanation of nonlinear effects lies in the way in which a
beam of light propagates through a solid. The nuclei and associated electrons
of the atoms in the solid form electric dipoles. The electromagnetic radiation
interacts with these dipoles causing them to oscillate which, by the classical
laws of electromagnetism, results in the dipoles themselves acting as sources
of electromagnetic radiation. If the amplitude of vibration is small, the dipoles
emit radiations of the same frequency as the incident radiations. As the
intensity of the incident radiations increases, the relationship between
irradiance and amplitude of vibrations becomes nonlinear resulting in the
generation of harmonics in the frequency of radiations emitted by oscillating
dipoles. Thus frequency doubling or second harmonic generations (SHG) and
indeed higher order frequency effects occur as the incident intensity is
increased. In a nonlinear medium the induced polarization is a nonlinear
function of the applied field. A medium exhibiting SHG is a crystal composed
of molecules with asymmetric charge distributions arranged in such a way
that a polar orientation is maintained throughout in the crystal. At very low
fields, the induced polarization is directly proportional to the electric field
(Nalwa and Miyata 1997).
P = ε0χ.E (1.4)
where χ is the linear susceptibility of the material, E is the electric field
vector, ε0 is the permittivity in free space.
At high fields polarization becomes independent of the field and the
susceptibility becomes field dependent. Therefore, the nonlinear response is
expressed by writing the induced polarization as a power series in the field.
21
P = ε0 χ(1). E + ε0 χ
(2). E. E + ε0 χ(3). E.E.E + … (1.5)
where χ(2), χ(3), … are the nonlinear susceptibilities of the medium.
χ(1) is the linear term responsible for the refractive index,
dispersion, birefringence and absorption. χ(2) is the quadratic term which
describes second harmonic generation, optical mixing and optical parametric
oscillation. χ(3) is the cubic term which is responsible for observing
phenomena such as stimulated Raman scattering, third harmonic generation,
phase conjugation and optical instability. Hence the induced polarization is
capable of multiplying the fundamental frequency to second, third and even
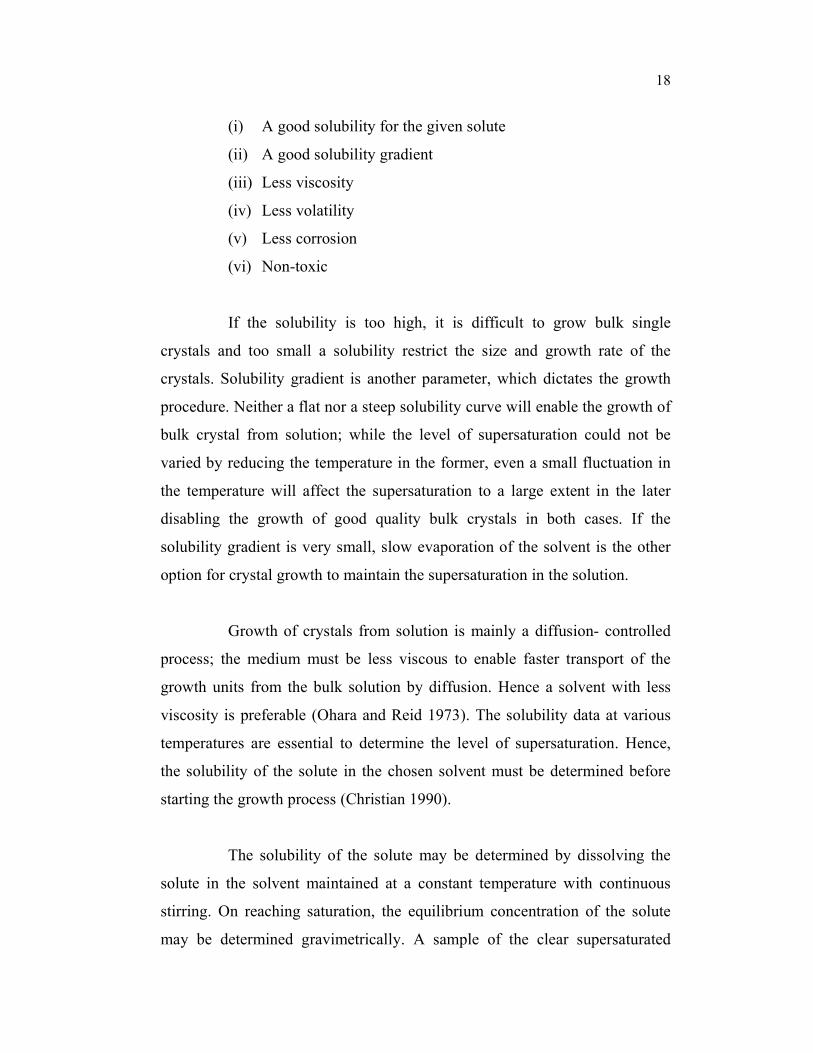
higher harmonics. The coefficients of χ(1), χ(2) and χ(3) give rise to certain
optical effects. The table 1.1 gives the nonlinear optical effects and
applications of materials.
Table 1.1 Optical effects of nonlinear materials
Order Effects Applications
χ(2) Refraction Optical fibers
χ(2) SHG (ω+ω = 2ω
Frequency mixing
(ω1±ω2=ω3)
Pockels effects
(ω+o=ω)
Frequency doubling
Optical parametric oscillators
Electro-optical modulators
χ(3) 4 wave mixing phase gratings
Kerr effect
Optical amplitude
Raman coherent spectroscopy
Real time holography
Ultra high speed optical gates
Amplifiers, choppers etc.

22
A noncentrosymmetric crystal, which exhibits the following
properties, is required for nonlinear device fabrication.
(i) High effective nonlinear optical coefficient
(ii) Good optical quality
(iii) Wide transparency region
(iv) Good mechanical and chemical stability
(v) Large birefringence
(vi) Low absorption
(vii) Easy device fabrication
1.12 SECOND HARMONIC GENERATION (SHG)
The first break through of SHG was achieved in 1961, when pulsed
laser beam was sent into a piezoelectric crystal sample. Peter A Franken
(Franken et al 1961) and several coworkers at the University of Michigan
were the first to observe SHG experimentally. They focused a 3 kW pulse of
red ruby laser light onto a quartz crystal, the frequency of the incident light
gets doubled which enables one to extend the range of laser wavelength into
the blue and UV parts of the spectrum. This is called frequency doubling.
Two waves each of frequency ω simultaneously superimposed constructively.
The resulting wave excites an electron from the ground state to a virtual
excited state. On relaxation, one wave of frequency 2ω is emitted.
To optimize SHG effect, one must optimize χ(2). χ(2) is influenced by various
structural features. Crystallographically, the compound must be
noncentrosymmetric by nature. The process of transformation of light with
frequency into light with double frequency is referred as SHG (Tarasov 1981)
(Figure 1.3).

23
Figure 1.3 Second harmonic generation
1.13 PARAMETRIC GENERATION (OR) SUM FREQUENCY
GENERATION
The transformation of the light wave with frequency υ into two new
light waves with frequencies υ1
and υ2
is termed as parametric generation
(Tarasov 1981) (Figure 1.4).
Figure 1.4 Optical parametric generation
1.14 APPLICATIONS OF NLO EFFECTS
Various susceptibility functions and frequency arguments with their
applications in various fields (Williams 1984) are given in Table 1.2 for χ (2)
and χ (3).

24
Table 1.2 Various susceptibility functions with their applications
Susceptibility Effect Application
χ (2)(0;ω, - ω) Optical rectification Hybrid bistable device
χ(2) (-ω; ω, 0)
Electro-optic (Pockels)
Effect
Modulators, variable phase
retarders
χ(2) (-2ω; -ω, ω) Frequency doubling Harmonic generation device
χ(2) (-ωc; ω
a, ω
b) Frequency mixing Parametric amplifiers, IR up
convertors
χ (3)(-ω; ω, ω, -ω) ac electro-optic effect
ac Kerr effect
Optical bistability
Phase conjugation
χ (3) (-3ω;ω; ω, ω) Frequency tripling Deep UV conversion
1.15 ELECTRO-OPTIC MODULATOR
An Electro-optic modulator is a device with operation based on
electric field controlled change in index of refraction or change in natural
birefringence. Depending on the device configuration, the following
properties of the light wave can be varied in intensity, amplitude, frequency or
direction of propagation of the light. Electro-optic light modulators control
the polarization of light passing through a crystal subjected to an electrical
driving signal. The effect was first described by Pockels in 1893; hence, the
devices are known as Pockels cells. The phenomenon is also called the linear
electro-optic effect, because phase retardation of light transiting the crystal is
directly proportional to the applied electric field. Early attempts to use
Pockels cells were not overly successful, in the absence of a source of well-
collimated, monochromatic light.

25
The electro-optic effect is the change in refractive index resulting
from the application of a DC or low frequency electric field. If the materials
have nonlinear polarization properties then the dielectric displacement (D)
can be related with the applied electric field (E) as
D = Є0χ(1) E + Є0χ
(2) E2 + Є0χ(3) E3 + .......... (1.6)
where χ(1) is the linear susceptibility and χ(2)
, χ(3)
are the second and third order
susceptibilities respectively. The permittivity of the material is defined as:
dD/dE = Є0χ(1) + Є0χ
(2) E + Є0χ(3) E2 +…….. (1.7)
where the first term is a constant and the higher order terms show the change
in permittivity due to applied electric field. Since the refractive index of
materials is directly related to their dielectric constant, it will also change
under electric field due to the nonlinear effect. Based on the change of
refractive index electro-optic effect is classified into two types. They are
Pockels effect (or linear electro-optic effect): Change in the
refractive index linearly proportional to the electric field. Only certain
crystalline solids show the Pockels effect, as it requires lack of inversion
symmetry.
Kerr effect (or quadratic electro-optic effect): Change in the
refractive index proportional to the square of the electric field. All materials
display the Kerr effect, with varying magnitudes, but it is generally much
weaker than the Pockels effect.

26
1.16 TYPES OF OPTICAL MODULATORS
There are different kinds of optical modulators:
(i) Acousto-optic modulators are based on the acousto-optic
effect. They are used for switching or continuously adjusting
the amplitude of a laser beam, for shifting its optical
frequency, or its spatial direction.
(ii) Electro-optic modulators exploit the electro-optic effect in
a Pockels cell. They can be used for modifying the
polarization, phase or power of a beam, or for pulse picking
in the context of ultrashort pulse amplifiers.
(iii) Electroabsorption modulators are intensity modulators, used
for data transmitters in optical fiber communications.
(iv) Interferometric modulators (Mach–Zehnder modulators) are
often realized in photonic integrated circuits for optical data
transmission.
(v) Fiber-optic modulators can exploit various physical
principles. They can be true fiber devices, or contain fiber
pig-tailed bulk components.
(vi) Liquid crystal modulators are suitable for optical displays
and pulse shapers. They can serve as spatial light
modulators, with a spatially varying transmission, for
displays.

27
(vii) Chopper wheels can periodically switch the optical power of
a light beam, as required for certain optical measurements
(lock-in amplifier).
(viii) Micromechanical modulators (which are microelectro-
mechanical systems = MEMS), (silicon-based light valves
and two-dimensional mirror arrays, are particularly useful
for projection displays).
Pockels cells can have two different geometries concerning the
direction of the applied electric field:
1.17 LONGITUDINAL DEVICES
Longitudinal devices have the electric field in the direction of the
light beam, which passes through holes in the electrodes. Large apertures can
easily be realized, as the required drive voltage is basically independent of the
aperture. The electrodes can be metallic rings (Figure 1.5 (a)) or transparent
layers on the end faces (b) with metallic contacts.
(a) (b)
Figure 1.5 Pockels cells with longitudinal electric field

28
1.18 TRANSVERSE DEVICES
Transverse devices have the electric field perpendicular to the light
beam. The field is applied through electrodes at the sides of the crystal. For
small apertures, they can have lower switching voltages. Figure 1.6 shows the
Pockels cells with transverse electric field. On the left is a bulk modulator and
on the right a waveguide modulator.
Figure 1.6 Pockels cells with transverse electric field
1.19 HALF-WAVE VOLTAGE
An important property of a Pockels cell is the half-wave voltage Vπ
which is the voltage required for inducing a phase change of π. In an
amplitude modulator, the applied voltage has to be changed by this value in
order to go from the operation point with minimum transmission to that with
maximum transmission. The half-wave voltage of a Pockels cell with
transverse electric field depends on the crystal material, the electrode
separation, and the length of the region where the electric field is applied. For
larger open apertures, the electrode separation needs to be larger, and hence
also the voltages. For a Pockels cell with longitudinal electric field, the crystal
length does not matter, since a shorter length also increases the electric field
strength for a given voltage. Larger apertures are possible without increasing
the half-wave voltage. Typical Pockels cells have half-wave voltages of

29
hundreds or even thousands of volts, so that a high-voltage amplifier is
required for large modulation depths. Relatively small half-wave voltages are
possible for highly nonlinear crystal materials such as LiNbO3, and
for integrated optical modulators with a small electrode separation, but such
devices have a limited power handling capability.
The voltage required to produce a retardation of π is called half
wave voltage. For a longitudinal modulator the applied electric field is
E = V / L , and the induced phase shift is 3x x
n rVπλ
∆Φ = , which is
independent of L and is linearly related to V. For a transverse
modulator E = V / d and the induced phase shift is 3 ( / )x xn rV L dπλ
∆Φ = ,
which is a function of the aspect ratio L / d and V. The voltage that would
produce an induced phase shift of φ π∆ = is the half-wave voltage.
For longitudinal modulator 3/ xV n rπ λ= (1.8)
For transverse modulator 3( / )( / )xV n r d Lπ λ= (1.9)
where λ is the wavelength, nx is the unperturbed index of refraction, r is the
corresponding Electro-optical coefficient, L is the interaction length and d is
the electrode spacing.
Therefore for the longitudinal modulators, the required magnitude
of the applied electric field for a desired degree of modulation cannot be
reduced by changing the aspect ratio (ratio of the crystal length to the
electrode separation) and it increases with wavelength. Here the electrodes do
not obstruct the light as it passes through the crystal. The induced phase shift
is proportional to the aspect ratio. Therefore, the voltage necessary to achieve

30
a desired degree of modulation can be greatly reduced by reducing the crystal
thickness. However the transverse dimension d is limited by the increase in
capacitance, which affects the modulation bandwidth or speed of the device
and by diffraction for a given length ‘L’, since a beam with finite cross
section diverges as it propagates.
1.20 ASSESSING PROPERTIES OF A GOOD ELECTRO-OPTIC
MODULATOR
Practical electro-optic materials should preferably have the
following properties (Robert Goldstein 1986)
(i) Large electro-optic figure of merit, n3r, (where ‘n’ is the
refractive index and ‘r’ is the relevant electro-optic
coefficient)
(ii) The half wave voltage should be as small as possible
(iii) The crystals should be transparent at frequency at which
they are to be used
(iv) Alternatively the transmission region of the crystal
determines the spectral region available for modulation
(v) The crystal should have highest attainable optical
homogeneity with the minimum amount of absorption or
scattering
(vi) The crystal should lack in the centre of inversion
(vii) The relative dielectric constant must be as low as possible
because the reactive power required to drive the modular
becomes large with increased dielectric constant. But this
requirement is conflicting with the previous requirement

31
since r is directly proportional to the dielectric constant.
Hence one has to compromise between the two, depending
on which parameter is more important for the device
(viii) The presence of any natural birefringes to a larger degree
will affect the performance of the electro-optic device
because firstly, it is a direct function of temperature and
secondly, the emerging rays be collinear on the same axis to
properly recombine
(ix) Dielectric dissipation must be very low
(x) As the strain in the lattice affects the phase relationship, the
crystal should be hard enough to resist strain during cutting
and polishing
(xi) The thermal conductivity of the crystal determines the
deleterious birefringes due to thermal gradients in the crystal
as heated by electrical or optical sources. Hence the thermal
conductivity of the crystal must be as high as possible
(xii) The crystal must be resistive to radiation damage at high
laser powers
(xiii) The crystal should not be optically active and
(xiv) Availability of large and good optical quality single crystals.
1.21 CHARACTERIZATION TECHNIQUES
Characterization of a crystal essentially consists of its chemical
composition, structure, defects and the study of its electrical, mechanical and
optical properties. A brief description of the fundamentals and the procedure
related to each technique is given. The equipment, schematic views and
illustrations of some of the systems used are presented.

32
In the present investigation the grown crystals were characterized
by various techniques. Single crystal and Powder diffraction studies were
carried out to confirm the grown crystals. Some of the grown crystals were
subjected to HRXRD to evaluate the crystalline perfection. The optical
transmittance, optical band gap and refractive index of the grown materials
were evaluated by recording optical transmission spectra. The
photoluminescence (PL), dielectric and Vickers microhardness studies were
performed on the grown crystals. Etching studies carried out revealed the
defects and growth pattern of the crystals. The second harmonic generation
(SHG) and its efficiency were measured using Kurtz-Perry powder method
(Kurtz and Perry 1968).
1.21.1 X-ray Diffraction
X-ray diffraction is now a common technique for the study of
crystal structures and atomic spacing. X-ray diffraction is based on
constructive interference of monochromatic X-rays and a crystalline sample.
X-rays are generated by a cathode ray tube, filtered to produce
monochromatic radiation, collimated to concentrate, and directed towards the
sample. When a crystal is bombarded with X-rays of a fixed wavelength
(similar to spacing of the atomic-scale crystal lattice planes) and at certain
incident angles, intense reflected X-rays are produced when the wavelengths
of the scattered X-rays interfere constructively. In order for the waves to
interfere constructively, the differences in the travel path must be equal to
integer multiples of the wavelength. When this constructive interference
occurs, a diffracted beam of X-rays will leave the crystal at an angle equal to
that of the incident beam. Each rational plane of atoms in a crystal will
undergo refraction at a single, unique angle (for X-rays of a fixed
wavelength). The general relationship between the wavelength of the incident

33
X-rays, angle of incidence and spacing between the crystal lattice planes of
atoms is known as Bragg's Law, expressed as:
n λ = 2dsinθ (1.10)
where n (an integer) is the "order" of reflection, λ is the wavelength of the
incident X-rays, d is the interplanar spacing of the crystal and θ is the angle of
incidence.
1.21.1.1 High-Resolution X-Ray Diffraction (HRXRD)
To evaluate the crystalline perfection of the specimen crystals,
high-resolution X-ray diffraction (HRXRD) analysis was carried out. A
multicrystal X-ray diffractometer developed at National Physical Laboratory
(NPL), New Delhi (Lal and Bhagavannarayana 1989) was used to record
high-resolution rocking or diffraction curves (DCs). Figure 1.7 shows the
schematic of the Multicrystal X-Ray Diffractometer.
In this system, a fine focus (0.4 × 8 mm2; 2 kW Mo) X-ray source
energized by a well-stabilized Philips X-ray generator (PW 1743) was
employed. The well-collimated and monochromated MoKα1 beam obtained
from the three monochromator Si crystals set in dispersive (+,-,-)
configuration has been used as the exploring X-ray beam. This arrangement
improves the spectral purity (∆λ/λ<< 10-5) of the MoKα1 beam. The
divergence of the exploring beam in the horizontal plane (plane of diffraction)
was estimated to be << 3 arc sec. The specimen crystal is aligned in the
(+,-,-,+) configuration. Due to dispersive configuration of the third
monochromator crystal with respect to the second monochromator, the
spectral quality of the diffracted beam emerged from the third monochromator

34
is highly perfect (∆λ/λ ~ 10-5; horizontal divergence >> 3 arc seconds) and
hence though the lattice constant of the monochromator crystal and the
specimen are different, the unwanted experimental dispersion broadening in
the diffraction curve of the specimen crystal (∆FWHM = ∆λ/λ (tanθM −tanθS);
θM and θS are being the Bragg diffraction angles of monochromator and the
specimen crystals) is insignificant. The specimen can be rotated about a
vertical axis, which is perpendicular to the plane of diffraction, with minimum
angular interval of 0.4 arc sec. The diffracted intensity is measured by using a
scintillation counter. The DCs were recorded by changing the glancing angle
(angle between the incident X-ray beam and the surface of the specimen)
around the Bragg diffraction peak position θB (taken zero as reference point)
starting from a suitable arbitrary glancing angle (θ). The detector was kept at
the same angular position 2θB with wide opening for its slit, the so-called ω
scan. The omega scan is very appropriate to record the short range order
scattering caused by the defects or by the scattering from local Bragg
diffractions from agglomerated point defects or due to low angle and very low
angle boundaries. Before recording the diffraction curve, to remove the non-
crystallized solute atoms remained on the surface of the crystal and also to
ensure the surface planarity, the specimens were first lapped and chemically
etched in a non-preferential etchant of water and acetone mixture in 1:2
volume ratio.

35
Figure 1.7 Schematic of the Multicrystal X-Ray Diffractometer Set up
used for the study
1.21.2 Scanning Electron Microscopy (SEM)
Scanning electron microscopy (SEM) is one of the most versatile
and widely used tools allowing the study of structure, morphology and surface
details of the crystals under investigation. By scanning across a specimen
high–resolution images of the morphology or topography of a specimen with
great depth of filed at very low or very high magnification can be obtained.
The morphology and the structure of crystal were examined using the Quanta
200 FEG scanning electron microscope (SEM) which is a versatile high
resolution scanning electron microscope.
1.21.3 Energy Dispersive X–ray Analysis (EDX)
Energy dispersive X-ray spectroscopy is an analytical technique
used for the elemental analysis or chemical characterization of a sample. It is
one of the variants of X-ray fluorescence spectroscopy which relies on the
investigation of a sample through interactions between electromagnetic

36
radiation and matter, analyzing X-rays emitted by the matter in response to
being hit with charged particles. Its characterization capabilities are due in
large part to the fundamental principle that each element has a unique atomic
structure allowing X-rays that are characteristic of an element's atomic
structure to be identified uniquely from one another. During EDX Analysis,
the specimen is bombarded with an electron beam inside the scanning
electron microscope. The bombarding electrons collide with the specimen
atoms' own electrons, knocking some of them off in the process. A position
vacated by an ejected inner shell electron is eventually occupied by a higher-
energy electron from an outer shell. To be able to do so, however, the
transferring outer electron must give up some of its energy by emitting an
X-ray.
The amount of energy released by the transferring electron depends
on which shell it is transferring from, as well as which shell it is transferring
to. Furthermore, the atom of every element releases X-rays with unique
amounts of energy during the transferring process. Thus, by measuring the
amounts of energy present in the X-rays being released by a specimen during
electron beam bombardment, the identity of the atom from which the X-ray
was emitted can be established. Output of an EDX analysis is an EDX
spectrum. The EDX spectrum is just a plot of how frequently an X-ray is
received for each energy level. An EDX spectrum normally displays peaks
corresponding to the energy levels for which the most X-rays had been
received. Each of these peaks is unique to an atom, and therefore corresponds
to a single element. The higher a peak in a spectrum, the more concentrated
the element is in the specimen.

37
1.21.4 Fourier Transformation Infra-Red (FT-IR) Spectroscopy
Infrared light from a suitable source passes through a scanning
Michelson interferometer and its Fourier transformation gives a plot of
intensity versus frequency. IR spectroscopy is one of the most widely used
tools for the detection of functional groups in pure compounds and mixtures,
and for the comparison of compounds. IR region of the electromagnetic
spectrum extends from 400 to 4000 cm-1. There are two types of IR
spectrometers characterised by the manner in which IR frequencies are
handled. In the first type called the dispersive type, the IR light is dispersed
into individual frequencies using a grating monochromator whereas in the
second called the Fourier transform IR where, the IR frequencies interact to
produce an interference pattern and this pattern is then analyzed
mathematically using Fourier Transform to determine the individual
frequencies and their intensities (Silverstein and Webster 1998).
When a sample is placed in the path of the beam, it absorbs the
characteristic frequencies so that their intensities are reduced in the
interferometer and the ensuing Fourier transform is the infrared absorption
spectrum of the sample. The scan time for the moving mirror dictates the
speed with which the IR spectrum can be recorded. Digitalization of the data
calculation of the Fourier Transform takes few seconds more, but the
information which constitutes the spectrum, can be acquired in exceedingly
short time even in a few milliseconds. The FT-IR spectra of samples were
recorded using perkin Elmer FT-IR spectrometer in the range 400-4000 cm-1
by KBr pellet technique for the present work.

38
1.21.5 UV- Visible studies
A double beam UV-Visible NIR spectrophotometer consists of
deutrium lamp which gives continuous radiation and a tungsten as required.
A narrow bandwidth was selected with the help of band pass filters. Then the
radiation lamp which produces visible range. The instrument has an
arrangement for switching on either radiation source was passed through the
cells of the given solution and solvent alternatively and respectively. This
process is called double beam process and it eliminates the fluctuations of
intensity of radiation scattering effect and solvent effect. The two rays were
combined and differences in intensities of those two radiations are measured
electrically. The movement of monochromators and the recorder were
synchronized and adjusted so that the record shows the intensity of
appropriate radiation. In the transmission study the intensity was recorded in
terms of percentage of transmittance (%) along Y-axis and the wavelength
(nm) along X-axis.
In this investigation, PerkinElmer double beam UV-VIS-NIR
Spectrometer was used to study the optical quality of the grown crystals in the
wavelength range of 200 to 1100 nm at room temperature.
1.21.6 Photoluminescence Spectroscopy
Photoluminescence spectroscopy (PL) is the direct emission of light
from an excited medium rather than the scattering of light and, as such,
involves real rather than virtual excitations of electrons. In PL, an excitation
source optically pumps a material. Typically, this excitation source is greater
in energy than the band gap of the material, in order to promote electrons to
excited states. After a relaxation period, electrons that fall back to lower states
through radiative recombination pathways emit photons, as shown

39
schematically in Figure 1.8. Because of the thermal relaxation, the emitted
photons have no correlation with the excitation process.
Figure 1.8 Photoluminescence process
1.21.7 Thermal Studies
Thermal studies involve the measurement of various properties of
materials subjected to dynamical change in environment. Thermogravimetric
analysis (TGA) determines the weight gain or loss of a phase due to gas
absorption or release as a function of temperature under a controlled
atmosphere. This technique provides information about the purity of the
sample, as well as its water, carbonate and organic content. It is also useful
for studying decomposition reactions, both thermal and mass transfers of the
sample are measured simultaneously. These analyses were made at the
Netzsch Thermal Analyzer, which make it possible to differentiate between
endothermic/exothermic transitions with (e.g. degradation) and without
weight change.

40
Differential Thermal Analysis (DTA) can be defined formally
as a technique for recording the difference in temperature between a
substance and a reference material against either time or against
temperature as the two specimens are subjected to identical temperature
regimes in an environment that is heated or cooled at a controlled rate. In
DTA, the difference in temperature between a reactive sample and a non-
reactive reference is determined as a function of time and temperature.
This provides useful information about the temperatures, thermodynamics and
kinetics of reactions. The key features in differential thermal analysis
equipment are a sample holder comprising thermocouples, sample
containers and a ceramic or metallic block, a furnace, a temperature
programmer and a recording system. The sample holder consists of one
thermocouple for the sample and one for the reference, generally
surrounded by a block to ensure heat is evenly distributed.
The furnaces should provide a stable and sufficiently large
hot-zone and must have a low response time in order to accurately follow
the thermal program. To obtain constant heating rates, a temperature
programmer is essential. The recording system must have a low inertial to
faithfully reproduce variations in the experimental set-up. Care must be taken
when selecting the experimental parameters. For example, specimen
environment, composition, size and surface-to-volume ratio all affect
powder decomposition reactions but may not affect solid-state phase
changes. Experiments are frequently performed on powders, so the data
obtained may not be representative of bulk samples, where the
transformations can be controlled by the build-up of strain energy.
The packing state of any powder sample is important in decomposition
reactions and can lead to large variations between apparently identical
samples. The information provided by the equipment differentiates between
endothermic or exothermic events.

41
1.21.8 Dielectric Measurement
The science of dielectrics, which has been pursued for well over
one hundred years, is one of the oldest branches of physics and has close links
to chemistry, materials, and electrical engineering. The term dielectric was
first coined by Faraday to suggest that there is something analogues to current
flow through a capacitor structure during the charging process when current
introduced at one plate (usually a metal) flows through the insulator to charge
another plate (usually a metal). The important consequence of imposing a
static external field across the capacitor is that the positively and negatively
charged species in the dielectric become polarized. Charging occurs only as
the field within the insulator is changing. Electrical measurements to evaluate
the dielectric behaviour of materials are usually made with cells having two
identical electrodes applied to the faces of a sample in the form of a pellet.
1.21.9 Mechanical Studies
Hardness of a material is the resistance it offers to indentation by a
harder body. An important use of micro hardness studies is the possibility of
making indirect estimate of other mechanical characteristics of materials
having a specific correlation with their hardness. The hardness depends not
only on the properties of the material under test but also largely on the
conditions of measurements. Hardness is an important factor in the choice of
ceramics for abrasives, tool bits, bearings and wear resistant coatings and it
generally correlates with both micro and macro and macro plastic deformation
and with ease of machining. It may be termed as a measure of the resistance
against lattice destruction or the resistance offered to permanent deformation
or damage.

42
1.21.9.1 Vicker’s microhardness studies
In order to study the mechanical properties, microhardness
measurements were carried out on the smooth surface of the crystals. The
static measurements were carried out at room temperature using Reichert MD
4000E ultra microhardness tester fitted with a Vicker’s diamond pyramidal
indenter. The loads varying from 5-50g were applied over a fixed interval of
time (10 seconds). Vicker’s microhardness values were calculated from the
formula
HV = 1.8544 P/d2 kg/mm2 (1.11)
where
HV = Vicker’s microhardness number in kg/mm2
P = applied load in g
d = average diagonal length in micro meter
The Meyer's index number was calculated from the Meyer's law,
which relates the load and indentation diagonal length.
nP k d= (1.12)
log P = logk + nlogd (1.13)
where, k is the material constant and n is the Meyer's index. The plot between
log P and log d, is a straight line and the slope of this straight line gives the
value of n. Hv should increase with the increase of P if n > 2 and decrease if
n < 2. According to Onitsch (Onitsch 1947) n should lie between 1 and 1.6 for
harder materials and above 1.6 for softer materials. For a crystal with

43
well-defined cracks, the resistance to fracture indicates the toughness of a
material. According to Ponton and Rawling (Ponton and Rawling, 1989)
fracture toughness Kc is dependent on the ratio of c/a, where c is the crack
length and a is the half-diagonal length of the square indentation as shown in
Figure 1.9.
Figure 1.9 Schematic diagram of the microindentation on the polished
surface of crystal
For c/a ≥ 2.5, the cracks are developed with median crack system
and the fracture toughness c/a is calculated using the equation
3/ 2c
kPK
c= (1.14)
where the constant k = 1/7 for the Vickers indenter.
For c/a ≤ 2.5, the cracks have the Palmqvist conguration and Kc is
obtained by the relation
1/ 2c
kPK
al= (1.15)

44
where l = c − a is the mean Palmqvist crack length. The brittleness index Bi is
calculated using the relation
vi
c
HB
K= (1.16)
From the hardness values, the Yield strength σy can be calculated
and it is defined as the stress at which the material begins to deform
plastically and depends on Meyer's index n. For n > 2, the yield strength σy
may be calculated using the expression
( )2
12.5 23
2.9 3
n
y v
nnH
nσ
−− −
= −
(1.17)
For n < 2, the yield strength is calculated using the relation
3v
y
Hσ = (1.18)
1.21.10 Etching Studies
The study of the identification, origin and characteristic of
crystalline defects such as boundaries, slip planes, dislocation and plastic flow
relies heavily on etching phenomena (Sangwal 1987). Etching is the selective
dissolution of the crystal, a reverse phenomenon of growth. When a crystal
phase is exposed to a solvent, dissolution begins by the nucleation of unit pits
of one molecular depth which then grows in the size by the retreating steps
across the crystal surface.

45
Etching is however a surface technique and care must be exercised
in the interpretation of etching studies, since defect densities and properties in
the surface and bulk regions of crystals frequently show a marked difference.
For any defect etchant, it is essential to assess the extent to which a
correspondence exists between etch features and dislocations. In general, it
should be noted that not all etch pits are necessarily formed at emergent
dislocations and that not all dislocations give rise to etch features.
An etchant is a solvent of the testing sample. But all the solvents
are not the best etchants for the same sample. An etchant should satisfy the
following requirement: continued etching of a surface should, in general
result in no net change in the number of pits other than where pits are
associated with, for example, dislocation loops. In such cases, the pits should
appear or disappear in pairs. The occurrence of etch pits is an illustration of
the enhanced chemical reactivity of dislocation, while in this case the
different etch pit shapes on the same crystal face demonstrate the dependence
of this behaviour upon dislocation character. This technique requires only
very basic equipment and yields much valuable information, particularly
about mechanical properties.
There are different methods to obtain preferential dislocation on a
crystal surface such as Chemical etching, Thermal etching, Ionic etching and
Electrolytic etching. In chemical etching the growth spiral could be removed
by observing the impressions of the depressions that are left behind.
The three important parameters for performing chemical etching of
a material are;
(i) Etchant
(ii) Temperature of Etching
(iii) Time of Etching

46
1.21.11 Second Harmonic Generation (SHG) Efficiency in Powder
The SHG is produced when monochroromatic light passes through
a non-centrosymmetric crystal. For a single crystal, only certain orientations
in respect to incoming photons will produce SHG. However, by grinding the
single crystal or using a polycrystalline powder, one arrives to a large number
of randomly oriented small crystallites whose SHG does not depend on the
incoming light direction. This simplifies both qualitative and quantitative
SHG measurements, as first described by Kurtz and Perry.
Kurtz and Perry (1968) demonstrated that it was possible to
perform second harmonic generation (SHG) studies on microcrystalline
powders to predict the phase matching direction in crystals and determine
their averaged nonlinear efficiency. The SHG intensity generated by a powder
in a solid angle of 360º depends on the averaged nonlinear efficiency of the
material but also on the particle size and the total number of small crystals
irradiated by the incident beam. The basic assumptions made by Kurtz and
Perry were that the powder particles were small crystals of almost identical
size, randomly orientated and densely packed. These assumptions mean that
form factors, polycrystallinity, and voids are avoided. Taking these
assumptions into account the small crystals were powdered and graded with
standard sieves to obtain a uniform particle size between 5 and 20 µm. Then,
they were uniformly packed in a capillary tube. Figure 1.10 shows the
schematic of experimental set-up used to make the measurements.

47
Figure 1.10 Schematic of Experimental set up used to measure SHG
efficiency in powder
To irradiate the sample, an Nd: YAG laser emitting at 1.064 µm
wavelength was used. The fundamental power at 1.064 µm reflected by the
sample was measured using a silicon photodiode. The beam generated by
the sample was focused with a lens to a silicon photodiode and an
interferometric filter to eliminate the non-doubled portion of the incident
power. Signals were collected and analysed using a digital oscilloscope. The
SHG efficiency of grown crystals was compared with standard material KDP
and urea.
1.22 THE CONTENT OF THESIS
The synthesis and growth of 1H-Benzimidazolium hydrogen
L-tartrate dihydrate (BT) single crystal by solution growth technique are
presented. Grown crystal characterized by Single crystal XRD confirms that
BT crystallizes in the monoclinic system, space group P21 with the unit cell
parameters a = 9.222(2) Å, b = 7.282(1) Å, c = 10.945(2) Å, β = 110.30(2)°
and V = 689.4(3) Å3. High-resolution X-ray diffractometry (HRXRD) was
carried out to evaluate the crystalline perfection of the specimen crystal.

48
The low full width at half maximum (FWHM) and the low angular spread of
around 450 arc s (one eight of a degree) of the diffraction curve indicates that
the crystalline perfection is fairly good. The functional groups present in the
grown crystal were identified by FT-IR spectral analysis. The optical study
reveals high transparency of BT crystal in the entire visible region.
The optical band gap and refractive index (n) of the material were calculated
from the transmittance spectrum. The broad greenish yellow emission is
centered at 2.38 eV in PL spectrum. The thermal analyses revealed good
thermal stability of the material thus proving its suitability for NLO
applications. The work hardening coefficient ‘n’ is found to be more than 2.
Surface micrographs recorded from etching studies revealed that BT crystal
grows by two dimensional layer growth mechanisms. The SHG efficiency
was measured using Kurtz-Perry technique. BT exhibits the SHG 1.2 times
that of KDP.
The results on synthesis, growth and characterization of
2-Aminopyridinium 4-methylbenzoate dihydrate (2A4M) are elaborated. The
single crystal X-ray diffraction analysis revealed that the crystal belongs to
monoclinic system. The optical transmittance data give maximum
transparency in the range of 300-700 nm. The functional groups were
confirmed by FT-IR. The thermal behaviour of the grown crystal was studied
by TG-DTA. From the Vickers hardness studies (Hv), fracture toughness (Kc),
brittleness (Bi), yield strength (σy) and elastic stiffness constant (C11) were
calculated. The work hardening coefficient was calculated as 3. The etching
study revealed rectangular hillocks and mono layer growth mechanism. SHG
relative efficiency of 2A4M is 3.03 times that of KDP.
The synthesis and growth of Bis(tetraethylammonium)
bis(hydrogen L-tartrate) L-tartaric acid monohydrate (TELT) by solution
growth technique are presented. The structure was solved by direct methods

49
using the programme SHELXS-97 (Sheldrick 2008). The refinement and all
further calculations were carried out using SHELXL-97. The single crystal
X-ray diffraction confirmed that the grown crystal belongs to monoclinic
system with space group P21, a = 7.5725 (4) Å, b = 27.7907 (13) Å,
c = 8.7620 (6) Å, β = 99.884 (5)º, V = 1816.55 (18) Å3. Fourier transform
infrared spectroscopy (FTIR) reveals the functional groups of the grown
crystal. Optical transparency of the grown crystal shows lower optical cut off
at 252 nm and optical band gap is 3.6 eV. Thermogravimetric (TG) and
differential thermal analysis (DTA) studies revealed that TELT is thermally
stable up to 192˚ C. Mechanical studies carried out on the well developed
(001) crystallographic plane using Vickers microhardness tester, revealed that
hardness increases with increasing load. Work hardening coefficient (n),
fracture toughness (Kc), brittleness index (Bi), yield strength (σy) and elastic
stiffness constant (C11) were calculated. Etching studies were carried out
using water as etchant. The observed etch patterns confirm the layer growth
mechanism. The second harmonic generation was confirmed by Kurtz-Perry
technique. The SHG efficiency of this material is low compared to standard
material.
The growth of single crystals of La4Mo7O27 by the flux growth
method using H3BO3 as the flux is presented with size 0.8×0.3×0.2 mm3. The
crystals were grown in plantium crucible using the starting materials of
La2O3, H3BO3 and MoO3 in a molar ratio of 0.16: 0.16: 0.68 under the
optimized crystal growth conditions: growth temperature 827°C, growth time
of 95 h and cooling rate of 0.5°C/h. The grown crystals were subjected to
powder X-ray diffraction (PXRD), EDX, UV-Vis, SEM, Photoluminescence,
thermal, dielectric and Second Harmonic generation (SHG) studies.
Benzil single crystal of <100> direction with 18 mm diameter and
75 mm length was successfully grown by Sankaranarayanan-Ramasamy (SR)

50
method and subjected to various characterization like single crystal XRD,
Powder XRD, High-resolution X-ray diffractometry (HRXRD), Optical and
PL studies, FT-IR and laser Raman studies, Vickers microhardness, Etching,
Second Harmoinc generation (SHG) studies. Half wave voltage measurement
was made by applying high voltage to the crystal. The intensity variation on
applied voltage is plotted as well the variation is pictured from the
oscilloscope display.
The outcomes of the investigation were published in International
journals and National/ International conferences.