chapter 1 introduction - um...
TRANSCRIPT

1
CHAPTER 1
INTRODUCTION
1.1 INTRODUCTION
This chapter serves as an introductory note to the whole research endeavor. Basically,
it presents brief information about what this study is all about, why it is undertaken,
what are going to be investigated and how it is going to be presented. Several
important concepts and theories that are relevant in this study are also briefly
discussed.
1.2 PROBLEM STATEMENT
As a body of knowledge, sport management is defined as “a field concerned with the
coordination of limited human and material resources, relevant technologies, and
situational contingencies for the efficient production and exchange of sport services”
(Chelladurai, 1994, p. 15). The definition reflects the essence of human resources’ role
in sport enterprises. In professional sport for example, the performances of players are
critically related to the financial success of a franchise. If the players keep on
demonstrating unimproved performances, profits gained through ticket entrances will
not be satisfactory. A subsequent decline in fan attendance will negatively impact the
team’s profitability. Linnehan (2005) asserts that the truly successful sport
organizations are those with the best front office and administrative staffs. “These
staffs are able to build unique, competitive advantages for the franchise through such
HR-related practices as recruiting coaches and players, developing personnel, and

2
structuring financial rewards that are competitive in the market, fiscally sound, and
within league guidelines” (p.287).
In Smart and Wolfe’s (2000) case study, it is shown that “the history, relationships,
trust and culture that have developed within the program’s coaching staff over a
number of years” (p.144) is the key to Penn State’s superior performance in the USA
football. This implies that success is not dependent merely on the staff but on the
environment in which they are managed too. In fact, the source of productive human
resources is the management of human resource (HRM) itself. However, the question
that is faced by many sport managers is; what is the kind of environment that can
enhance employees’ work performances? The next question is, how can human
resources be best managed for that purpose?
1.3 EMPLOYEES AS CRITICAL RESOURCES IN SPORT
The features of every organization differ from one to another and each has its own style
of management, depending on the type of products it produces. The most common
denominator in every organization however is the human resources. All organizations
including sport firms depend on human resources to run their businesses and achieve
the organizational goals. Without the existence of human resources, other resources no
matter how expensive or sophisticated they are, will be of little value to the enterprises.
In sport organizations, the dependence on human resources to success is critical. It is
because most sport organizations are service-oriented (Chelladurai, 1999). As pointed
out by many service scholars, in service-oriented or service-based organizations,
human resources or employees are a crucial variable that links the firms to profits (e.g.,

3
Heskett, Jones, Loveman, Sasser Jr., & Schlesinger, 1994; Schneider, 1994, 2004;
Morrison, 1996; Bowen & Ford, 2002; Anderson, 2005).
The nature of service is commonly described as intangible, perishable, heterogeneous
and inseparable (Sasser, Olsen, & Wyckoff, 1978; Schmenner, 1995; Lovelock, 2001;
Chelladurai, 2006). Intangibility is when a product does not exist in a physical form
where it can be assessed by humans’ senses. In a sport context for instance, a man who
pays to be a golf club member normally obtains a membership card to be used upon
entry to the club. However, this card is not actually the core product that he purchases.
What is offered in the exchange to the money he pays to the club is something that is
service-based which cannot be seen, touched, felt, heard or even smelled. The money is
mainly paid for a freedom to use the club facilities and to some others, it is probably
for the association with the reputation that is attached to the club. Because of this
intangible nature of the service products, their qualities (the freedom and association
with reputation) cannot be measured as how tangible goods such as cars, books, shoes
are measured.
The concept of perishability implies that the service products cannot be reproduced and
stored for future use. For example, a golf manager cannot provide the same
competition event (which has been featured previously) to his clients (players or
spectators). This is different from tangible goods such as clothes or bicycles where they
can be reproduced and inventoried for future sales. However, services such as sport
events have to be consumed there and then by the existing consumers. Once the service
products are produced and experienced by customers, they are lost forever. Being

4
perishable, services cannot be captured and kept in boxes or containers. Otherwise
stated, they are perishable commodities (Sasser et al., 1978).
Services are also described as being heterogeneous. It explains the varying degree of
satisfactions of the customers about the quality of the same sport services. For
example, a member of a golf club may be easily annoyed by the delayed provision of a
buggy in one sunny afternoon. On the other hand, in a different day, in probably the
same hot weather condition, this same person may have a very high tolerance of
waiting and even receives the late buggy with a forgiving smile. Put succinctly,
because customers cannot base the quality of a service on something tangible, they
look for the cues around them. Being such unique creatures, their cues evaluations are
affected by their moods and these moods usually are influenced by their own
psychological and physiological states. That is why in a group of customers who
consume the same services at the same time, some of them may think the services are
great while some others may think otherwise and the same customers may be satisfied
with the services today but dissatisfied with the same services in other days.
Mood fluctuations (due to psychological and physiological conditions) are also
inherent in the characters of employees. Despite comprehensive job descriptions,
employees are also exposed to changes in moods which to a certain extent shape the
quality of their work performances. In short, service providers may have perfect rules
and procedures for the organizational operations. Nevertheless, as the production of
services involves human resources (customers and employees) and as these resources

5
are susceptible to emotional variability, the services cannot be produced and
experienced with a quality that is consistent and uniformed every different time.
Another attribute of services is that, the production and consumption of services are
inseparable from the existence of customers. For example, a golf competition will not
be materialized if there are no players to participate and spectators to watch the event.
People who play and spectators who attend to golf courses to watch the event are the
customers of the event and the event itself is the offered service product. The moment
the event is produced, which is when the competition begins, that is the exact time the
customers start consuming the product. The consumption is manifested by the act of
playing (players) and witnessing (spectators). Thus, the facts that the customers have to
be presence during the service production as well as consuming the product at the same
time it is being produced, describe the inseparable or simultaneous nature of services.
Due to the complex nature of the products of sport, it is not easy to convince customers
to purchase and continue purchasing the services. The only way to communicate to
customers that the services offered are of high quality is by ensuring the cues that
customers use as a proxy to evaluate service quality, are of outstanding quality. This
however is only achievable with the assistance of employees whose attitudes and
behaviours are in congruence with the organizations’ service quality emphasis.
Evidence that show the important role of employees in the achievement of excellent
service quality can be inferred from many studies that have developed service quality
scales. For example, in the famous service quality scale which is called as

6
SERVQUAL (Parasuraman, Zeithaml, & Berry, 1988), customers are believed to judge
the quality of services based on aspects of tangibles, reliability, responsiveness,
assurance and empathy. All these quality dimensions are actually the results of
employees’ work performances. One of the items that is assumed to be able to capture
that concept of “tangibles” for instance, is related to the extent to which the facilities
are “visually appealing” to customers (Parasuraman et al., 1988, p. 38). Such a desired
condition however can only be demonstrated by the work performances of the
employees in charge. It is them who can guarantee that the cues that customers use as
the basis of their evaluations are in excellent or “appealing” conditions. The key to
customer perceptions of service quality therefore lies in the hand of employees.
Another example is the scale developed by Ko and Pastore (2005) in the context of
sport and recreation. They have suggested that dimensions such as program,
interaction, outcome and environmental qualities are the signals that customers look for
in their evaluations of the service quality in recreational sport. Again, although it has
not been elaborately discussed how important the role of employees in the
conceptualization of those dimensions is, it is logical to assume that the quality of those
dimensions depends so much on the quality of employee work outcomes. For example,
in the “program” dimension, the range of program, operating time and information are
the relevant aspects expected to be examined by customers. These aspects however
only exist to be favourable to customers if they are well prepared, arranged and
communicated by no one else but employees. In short, employees play a critical role in
attracting customers who in this case, are the ultimate profit generators in sport
organizations.

7
1.4 SERVICE-BASED HUMAN RESOURCE MANAGEMENT
As stated by Parasuraman, Berry, and Zeithaml (1985, p. 42), “In the absence of
tangible evidence on which to evaluate quality, customers must depend on other cues”.
A few years later, these researchers come out with SERVQUAL (Parasuraman et al.,
1988), a scale that lists the important “cues” which have been widely accepted to be the
basis of customers’ service quality evaluation. Within the context of sport, there are
several different scales that have been developed too. This scenario proposes that
different cues are more prevalent in different sport settings. For example, it is found
that there are five dimensions of service quality in fitness services (Chelladurai, Scott,
& Haywood-Farmer, 1987), eleven in sport centers (Kim & Kim, 1995), four in sport
and leisure centers (Howat, Absher, Crilley, & Milne, 1996) and five in professional
sport (McDonald, Sutton, & Milne, 1995).
Although all those scales may differ in terms of the number of dimensions and the
names of the dimensions themselves, they are similar in one thing; the respective
dimensions are the outcomes of employees’ hard work. Thus, if customers are satisfied
with the dimension of “physical environment” for example (Chang & Chelladurai’s
scale, 2003), that is all because of the work of employees who make the physical
environment looks great to customers. Building on this logic, employees then are the
key factor in achieving high service quality in sport organizations. In other words, to
aim for high service quality in sport is actually to aim for the improvement of
employees’ performances because when employees perform well-done jobs they
provide impressive cues to customers. In any service firm, including sport
organizations, such positive cues are evidently the recipe for high service quality.

8
In the pursuit of admirable service quality, Schneider and Bowen (1993) suggest
service managers to promote two related, but different climates namely climate for
service and climate for employee well-being. Climate for service can be acquired
through the organizations’ systems and logistic supports, targeting at the fulfillment of
customers’ needs, wants and demands. Climate for employee well being is attained by
meeting the needs of employees. Employee satisfaction is important because before
they are committed to perform well-done jobs (which influence the quality of the cues
that are evaluated by customers), they need to be enthusiastic about their jobs first.
According to those scholars, climate for employee well-being in service companies can
be materialized through “quality HRM practices” (p.43) or in this present study, they
are termed as service-based HRM practices.
.
To rephrase the above argument, organizations with a focus of service quality will have
to fulfill the needs of employees. “Management can potentially manage employee
stress by establishing a climate in which employees’ desires to give good service are
made easier and encouraged; a climate in which service, as proved by management
word and deed, is an organizational imperative” (Schneider, 1980, p. 53). Thus, for
organizations that strive for superior service quality, their HRM practices must
therefore emphasize on the well-being of employees because when the employees’
well-being are taken care of, customer perceptions of service quality are believed to
improve.
In the context of this research, the relevant HRM practices are those called service-
based HRM of which the practices are related to policies, practices and procedures

9
designed to make employees satisfied. The word satisfied here means, employees are
contented with how the management takes care of their well-being. In short, in order to
establish the climate for service within the organizations, the effort must begin with the
achievement of climate for employee well-being.
1.5 ORGANIZATIONAL CITIZENSHIP BEHAVIOUR
Given the facts that customers are unique and unfathomable human beings, service
providers are unable to accurately determine the specific cues that customers look for
when evaluating the quality of services. This notion is supported by the many different
dimensions of service quality which have been proposed in the literature. One the best
solutions for this problem is by ensuring that all potential cues are presented in great
conditions and manners. For example, the cleanliness of the facilities must be
constantly demonstrated, the relevant machineries must always be made available and
functional and the performances of the customer-contact employees must be at all
times pleasant and satisfactory. As argued earlier, all these cues can only be excellently
presented to customers when the employees responsible for those cues are dedicated in
doing excellent jobs. This means that a culture of service excellence where service
quality is a priority must first be embraced by all employees in the service
organizations. Hence, all employees which include non- and customer-contact
personnel (Schneider & Bowen, 1993) must therefore have the appropriate behaviours
that are in congruence with the organizations service quality goals.
According to Zerbe, Dobni, and Harel (1998), many marketing theorists have argued
that organizations with a service culture usually promote service behaviours among

10
their employees. Service behaviours are known as work-related behaviours which are
derived from intrinsic motivation (Deci, 1975; Kohn, 1993), not specified in advance
by the management (Katz & Kahn, 1978; Bowen, 1990) and adaptable in unpredictable
situations (Smith, Organ, & Near, 1983). Morrison (1996) believes that such
characteristics are prominently featured in a behaviour that is called organizational
citizenship behaviour (OCB). In fact, the author proposes an OCB to be the specific
behaviour that should be possessed by employees in the service setting. This proposal
has been used by many researchers to support the conceptualization of OCB as a
service-related behaviour in their studies (e.g., Podsakoff, MacKenzie, Moorman, &
Fetter, 1990; Vaughan & Renn, 1999; Hui, Lam, & Schaubroeck, 2001; Koys, 2001;
Bienstock, De Moranville, & Smith, 2003; Yoon & Suh, 2003).
In sum, employees of high levels of OCBs are aspired in service organizations because
such employees are committed to excel in their jobs and they are also able to face the
unforeseen contingencies resulted from the unique nature of services (Morrison, 1996).
Sharing the same opinion, this study proposes OCB to be the behaviour that enables
sport organizations to achieve service quality goals.
1.6 PERCEIVED SERVICE QUALITY
“The appropriate judges of performance should be those who are served” (Schneider,
Parkington, & Buxton, 1980, p. 53). In service, customers are “those who are served”.
Therefore, as the service end users, customers are the rightful authorities who can tell
whether the provided service experiences are of exceptional quality or otherwise. In his
writing, Anderson (2005) states that, “customer’s perceptions rather than ‘widget’

11
[manufacturing organization’s product] quality are the driving force behind
management practice in the service sector” (p.502). This means that customer
perceived service quality determines the productivity of the organizations.
Anderson’s idea is consistent with the fundamental philosophy of the service-profit
chain theory (Heskett et al., 1994). This theory postulates that as direct recipients of
service outputs, customers’ roles are therefore very influential in the subsequent and
ultimate outcomes of services namely profit and growth. Such a postulation supports a
popular view which has long regarded customer perceived service quality as one of the
organizations’ important success indicators (Zeithaml, Parasuraman, & Berry, 1990;
Bojanic & Rosen, 1994; Heskett et al., 1994; Mat Zaid, 1995; Hill, Geurs, Hays, John,
Johnson, & Swanson, 1998; Arcelay, Sánchez, Hernández, Inclán, Bacigalupe, &
Letona, 1999; Tat & Chu, 1999; Bowen, Schneider, & Kim, 2000; Lagrosen, 2000;
Haynes & Fryer, 2000; Papadimitriou & Karteroliotis, 2000; Allred, 2001; Lynn, 2001;
Chang, Chen, & Hsu, 2002; Rhoades & Waguespack Jr, 2004; Gelade & Young, 2005;
Lagrosen & Lagrosen, 2007).
Since the existence of services cannot be conceptualized physically and consistently,
their qualities and performances depend entirely on the perceptions of customers, who
consume and at the same time, co-produce the services (Edvardsson, 2005;
Chelladurai, 2006). Being the co-producers of services certainly enhances the
legitimacy of customers’ roles as the ultimate evaluators of service quality.
Parasuraman (2002) clarifies that “in service contexts, customers often play a co-

12
production role, providing some amount of direct or indirect input in the form of time,
physical effort and mental energy” (p.7). For instance, golfers who come to play golf
with worn out golfing sets or attires or simply are not in the right mood to play (i.e.,
having mild colds), will not be able to enjoy the game although the golf courses are in
extraordinary conditions. Therefore, the standard of quality as provided by the
organizations is actually a perception given by customers who not only rely on what
are served to them but also take into consideration emotional factors which are entailed
within them. As concluded by Bowen and Ford (2002, p. 451), “Service quality is
given meaning by customers – it is perceived”.
The function of customer perceived service quality as the marker of service
performance is also in line with the recent conceptual framework proposed by
Parasuraman (2002), the famous guru in the service quality study. In that particular
framework, Parasuraman has highlighted four inter-linkaging components that are
believed to be the central thrusts of service excellence. According to him, the degree to
which service companies provide appropriate inputs will have co-relational effects on
the customers’ inputs (e.g., time, effort, emotional and energy). By the same token, the
amount of outputs expended by the customers (e.g., service evaluation and satisfaction)
will also determine the size of the companies’ outputs (e.g., sales, profit and market
share). In short, similar to Heskett et al.’s (1994) service-profit chain framework,
Parasuraman’s (2002) model also recognizes the critical role of customer perceived
service quality as the predictor of the organizations’ accomplishment in the service
business.

13
1.7 THE NATURE OF EMPLOYEE JOB ORIENTATION
Within the literature of service, most empirical evidence are gathered from employees
whose jobs involve direct interactions with customers. (e.g., Brown & Swartz, 1989;
Bitner, Boom, & Tetreault, 1994; Brown & Sulzer-Azaroff, 1994; Chebat, Babin, &
Kollias, 2002; Tsaur & Lin, 2004; Little & Dean, 2006). Among the common terms
that are used to represent this group of employees are “customer-contact employees”
(e.g., Zerbe et al., 1998; Chebat et al., 2002; Yoon & Suh, 2003), “frontline
employees” (e.g., Browning, 2006; Elmadağ, Ellinger, & Franke, 2008), “service
employees” (e.g., Lovelock, 1983; Donavan & Hocutt, 2001). By labeling the
employees with such terms it is therefore logical to assume that there exists another
group of employees whose nature of job orientations is not related to direct interaction
with customers. In other words, in service organizations, there are two types of
employees and they are distinguished by the nature of their job types (non- and
customer contact employees).
The strategic core workforce is a term coined by Delery and Shaw (2001) to indicate
the strategic development of human resources that is designed based on their
importance to the organizations. From this view, the authors argue that,
“Jobs where employees are directly responsible for the firm’s core
competencies are those where a high level of productivity is necessary
for competitive advantage. Jobs where employees are not directly
responsible for the firm’s core competencies are less important for the
performance of the organization” (p.178).
In service, because customers are the key to profits, the interaction between them and
employees are deemed to be very crucial (Schneider, 1994; Bowen & Ford, 2002;
14
Anderson, 2005). Based on the idea of strategic core workforce, these customer-contact
employees are the strategic core workforce of the firms and their levels of
competencies determine the organization’s productivity. As such, there is reason to
believe that customer-contact employees have more potential than the non-customer-
contact employees in the validation of employee-organizational performance
relationship, particularly in service companies. This belief is consistent with the service
research trend where customer-contact employees have always been the subjects of
studies (e.g, Brown & Swartz, 1989; Wiley, 1991; Bitner, Booms, & Mohr, 1994;
Brown & Sulzer-Azaroff, 1994; Johnson, 1996; Chebat et al., 2002; Tsaur & Lin,
2004; González & Garazo, 2006; Little & Dean, 2006).
1.8 SPORT EMPLOYEES
Based on Chelladurai’s (2006) classification of human resources in sport, sport
employees can be categorized into athletes or non-athletes. Athletes are characterized
as those who demonstrate their professional skills to their selected group of clients
(e.g., audience of tennis tournament). As for the non-athletes, they are further divided
into two categories namely, professional and consumer service sport employees.
Similar to professional athletes, the professional non-athlete employees provide their
professional assets such as expertise and knowledge to their specific customers (e.g.,
registered members of fitness clubs). Examples of them are sport nutritionists, coaches,
fitness trainers and umpires. Meanwhile, consumer service employees are those who
deliver consumer services to mass clients on the basis of limited range of
responsibilities with relatively low-skill competencies. Sport staff who work at the

15
registration counters as cashiers and clerks are some examples of this type of
employees.
Athlete and non-athlete employees may differ in terms of the services offered to
clients. However, both of them are similar in the sense that their performances
represent the outputs of organizations. In service, as its output is intangible, the basis of
customers’ evaluations of service quality is on the performances of the organizations’
employees. Hence, if the demonstrations of athletic skills are considered as the
athletes’ performances, the efforts in making the clients’ service experiences worthy of
purchase are therefore the performances of the non-athlete (professional and consumer
service) employees. These two types of performances serve as the organizations’
outputs that are assessed by the clients.
In Malaysia, most athletes are from non-profit organizations. Non-profit organizations
are run by volunteers and ad-hoc committees. As these types of employees are not
bound by the typical employment contract, their HRM system is therefore expected to
be ambiguous and as such, difficult to be examined. Unlike non-profit, the
administrations of the profit-oriented organizations are clearer and more systematic, at
least in the aspect of HRM (e.g., compensating the hired employees). However, there is
only one profit-oriented sport organization for athletes in this country and they are
soccer organizations.
While soccer organizations seems to be the appropriate subjects for the present study,
their complex and vague administration systems nevertheless make them no longer

16
suitable. It is all because of the heavy involvement of the Football Association of
Malaysia (FAM) in the organizational management of the soccer organizations. FAM
is the principle governing body for soccer in Malaysia. All existing soccer
organizations are affiliated with FAM and receive annual grants from it. Because of
these fundamental factors, the administration systems of those affiliated soccer
organizations are subjected to the rules and policy that are prescribed by FAM. Put
succinctly, the soccer organizations do not operate like any common business
corporations where administrative decisions can be made independently.
In short, athletes are not the compelling samples to be used in this study because first,
most of their organizations are not profit-oriented and second, even if they are from
profit-oriented organizations (i.e., soccer organizations), the nature of the
organizations’ businesses is so unique that the application of the typical HRM system
(as reviewed in the available literature) on this context is rather inappropriate. Because
of these two reasons, non-athlete employees from profit-oriented sport organizations
such as golf clubs are considered a better choice to be the samples of this study.
1.9 GOLF INDUSTRY IN MALAYSIA
According to Winston Churchill, “golf is a curious sport whose object is to put a very
small ball in a very small holes with implements ill-designed for the purpose”
(Readman, 2003, p.165). In general, golf is a game where a player aims at hitting a golf
ball into a given number of holes with the lowest possible number of strokes. Each
playing field which is called a golf course, has its own unique design and it normally
consists of specific number of holes such as 9, 18, 36 or 63.

17
Since the establishment of golf in 1885 (Green, 1993; Campbell, 1994), golf has
become the most sought-after sporting activity embraced by people worldwide. It is
estimated that there are 60 billion golfers around the world (Readman, 2003) and this
number is growing every year (Palmer, 2004). In Malaysia alone, the Companies
Commission of Malaysia has shown that in 2004, the golf industry is worth RM4.43
billion per annum (Malaysian Business, 2006). Meanwhile in the 2007 budget, golf
industry has been strategized to be the government’s main foreign income earner
(Bernama, 2006). The phenomenal escalation of golf industry is expected because
according to the Prime Minister, Datuk Seri Najib Tun Razak, golf is now the deciding
factor in choosing travel destinations for most people (Utusan Malaysia, 2008).
Due to the promising prospect of golf industry, a lot of golf clubs begin to mushroom
the country. From having only 20 golf clubs in the 1980’s, currently there are about
204 golf clubs in Malaysia. Quite rapidly increasing in number, it is therefore rational
to ask the following question; is the golf industry doing that well? Based on the article
that reviews the present situation of golf industry (Malaysian Business, 2006), the
answer to that question is unfortunately not very positive. In fact, it is also reported that
several number of golf clubs have been closed down. The main reason given is that, the
number of frequent golfers is inadequate to support the generation of the organizations’
incomes.
Undoubtedly, there are various strategies that can be planned to help golf clubs achieve
sustainability in this business. In line with the aspiration of the country which is to
capitalize the growing popularity of golf, the present study is particularly relevant in

18
attempting to provide solutions on how to increase the attractiveness of this sporting
activity to a wider population, particularly from the aspect of human resource
management. As such, golf clubs are chosen as the sampling units and golf club
employees as the samples for the study.
1.10 THEORETICAL UNDERPINNINGS
Within the study of sport management, researchers are encouraged to provide
suggestions to sport practitioners based on a “well-developed, theoretically-based body
of research” (Mahony & Pitts, 1998, p. 263). In other words, in conducting any sport-
related study, relevant theories are required to support the investigation. Building on
the existing knowledge of HRM, organizational behavior and service marketing
literature, this study is carried out based on the following theories.
1.10.1 ROLE BEHAVIOUR THEORY
A role behaviour theory argues that the behavioral roles of individuals working in
organizations are the results of the interactions between them and their organization’s
contextual situations with regard to each other’s expectations and requirements of
appropriate behaviors (Barker, 1999; Thompson, 2001). Therefore, it is assumed that
failure to match the roles with the specified expectations will lead to ineffective
performances of the individuals and organizations alike (Kahn, Wolfe, Quinn, Snoek,
& Rosenthal, 1964; Rizzo, House, & Lirtzman, 1970).
Jackson and Schuler (1992) assert that the role behaviour theory can be used to help
justify the significant function of HRM in producing employees with the appropriate

19
service behaviours. For example, to match the needs of service environment is to craft
a climate for service. As discussed earlier, a climate for service is likely to be presence
in an environment where a climate for employee well-being is already accepted as a
culture. In order to create a link between a climate for employee well-being and
climate for service, that is the point where an HRM role is critically needed. Because
HRM is a department where employee related matters are dealt with (Byars & Rue,
2003), its’ practices are therefore highly related to the extent to which the climate for
employee well-being are promoted within the organizations (Schneider & Bowen,
1993).
In short, the theory of role behaviour serves as a rationale to explain why HRM is a
paramount variable in the creation of a chain that connects the climate for employee
well-being to climate for service. Assuming the theory of role behaviour is correct,
sport firms should encourage their employees to adopt behaviours that are service-
related. However, service-related behaviours or more specifically OCBs, can only be
materialized by the help of HRM practices that are designed with a focus to achieve
superior service quality.
1.10.2 SOCIAL EXCHANGE THEORY
Social exchange theory offers an explanation for the contributions of employers and
employees to each other in the employment relationship (Aryee, Budhwar, & Chen,
2002). Popularized by Blau (1964), the basic assumption of the social exchange theory
is that people tend to commit in a relationship when they believe their commitment or
contributions will be fairly reciprocated by the other involving parties.

20
Gouldner (1960) argues that the social exchange theory is dependent on the willingness
of the participating individuals to embark on a general norm of reciprocity. In similar
vein, Eisenberger, Fasolo, and Davis-LaMastro (1990) advance organizations as the
leading entity that initiates this kind of relationship. In line with this notion, Settoon,
Bennett, and Liden (1996, p. 219) add that “positive, beneficial actions directed at
employees by the organization and/or its representatives contribute to the establishment
of high quality exchange relationships that create obligations for employees to
reciprocate in positive [and] beneficial ways”. This statement points out to the idea that
organizations have to be the initiator of this reciprocity concept. In other words, the
organizations have to start showing their concern by being truly concerned with and
responsive to employees’ needs and wants because these positive acts will motivate
employees to demonstrate the behaviours that benefit the organizations.
Extending this theory to the sport setting, sport managers can expect their employees to
be productive if they treat the employees well. In this study, the management’s well
treatment is regarded as any employee-related activities that are aimed at achieving a
climate for employee well-being while productive employees are considered as those
with high OCB levels. To sum up, the social exchange theory provides a strong reason
to believe that the implementation of service-based HRM practices can trigger a
reciprocity process where employees will feel obliged to repay the management’s
kindness by exhibiting high levels of OCBs.

21
1.10.3 RESOURCE-BASED VIEW THEORY
This study is about making use the existing employees to achieve organizational
effectiveness. The backbone of this idea is drawn from a theory of resource-based
view. According to this theory, organizations can achieve competitive advantage or
distinguish themselves from their rivals by capitalizing their internal resources such as
raw materials, technology, economies of scale, innovation, human resources and others
(Wernefelt, 1984; Barney, 1991). However, as noted by Barney (1991, p. 110),
“physical technology, whether it takes the form of machine tools or robotics in
factories or complex information management systems, is by itself typically imitable”.
As unique creatures, human resources on the other hand, are the organizations’ internal
resources that are impossible to copy because due to issues related to scarcity,
specialization, and tacit knowledge (Polanyi, 1962; Lippman & Rumelt, 1982; Teece,
1982), “they are difficult to understand and observe” (Coff, 1997, p. 374). Because of
these reasons, human resources therefore have more potential than other duplicable
resources (i.e., machineries) to be the organizations’ asset for the attainment of
competitive advantage.
Bowen and Ostroff (2004) add that unlike other resources which can be acquired and
duplicated (so long the organizations have enough capital), human resources are value
additive, rare, inimitable and non-substitutable. With appropriate management
strategies, human resources of these qualities can indeed be developed to be
“distinctive competencies” for their organizations (Wright & McMahan, 1992).
Distinctive competence is a term that refers to an advantage an organization has which
is not possessed by its competitors (Selznick, 1957; Snow & Hrebiniak, 1980; Chou &

22
Chang, 2004). Evidence from empirical studies, especially from HRM literature, that
verify the human resources as prospective distinctive competencies for organizations
are abundance (e.g., Devanna, Fombrun, & Tichy, 1981; Arthur, 1994; Huselid, 1994,
1995; MacDuffie, 1995; Delery & Doty, 1996; Delaney & Huselid, 1996; Huselid,
Jackson, & Schuler, 1997).
The theory of resource-based view is also used to support the framework develop for
this study. Based on the principle that human resources can be the key to competitive
advantage, it is assumed that sport organizations that have employees of high OCB
levels will have great service quality potentials. It is because employees with these
behaviours are committed to give their best performances to the organizations and this
in turn will ensure the cues or signals that are used by customers to perceive service
quality, are always in presentable and excellent conditions.
1.10.4 SERVICE-PROFIT CHAIN THEORY
A service-profit chain is a theory that unravels the service-delivery process from
internal organizational operations such as human resource management activities to
employee and customer experiences which then lead to the economic proliferation of
the organization. The scholars who have come out with this theory present their ideas
in the paragraph below:

23
“The links in the chain are as follows: Profit and growth are stimulated
primarily by customer loyalty. Loyalty is a direct result of customer
satisfaction. Satisfaction is largely influenced by the value of services
provided to customers. Value is created by satisfied, loyal, and
productive employees. Employee satisfaction, in turn, results primarily
from high-quality support services and policies that enable employees to
deliver to customers.”
(Heskett et al., 1994, p. 164-165)
Heskett, Sasser, and Schlesinger (1997) suggest that if the theory is correctly
interpreted and adapted in the customer-focused firms, the results will likely be
“remarkable”. Findings from relevant studies also report quite a convincing support to
this view. For example, in the meta-analysis study on the relationships among
organizational, employee, customer and performance outcomes, Dean (2004) discloses
that many of the variables are found to be linked into linear sequences although the
evidence is found to be “not unequivocal”. This ambiguity however is attributed to the
“complexity and non-linearity of many of the proposed links, and the existence of
reciprocity between certain variables” (Dean, 2004, p. 332).
The theory of service-profit chain is used in this study to help justify the existence of a
mediating variable that is believed to exist in the relationship between HRM practices
and service quality. The service-profit chain proposed by Heskett et al. (1994) implies
that the effects of “high-quality support services and policies” (i.e., service-based HRM
practices) are transported to “profit and growth” (i.e., high service quality perceptions)
through some other elements such as employee behaviours, OCBs in particular. More
specifically, the current study foresees that service-based HRM practices affect the
customer perceived service quality through OCB.

24
1.11 RESEARCH QUESTIONS
Sport management scholars are concerned with the lack of studies that explore the role
of human resources in sport organizations (e.g., Doherty, 1998; Dixon, 2002; Taylor &
Ho, 2005). The concern is justifiable since the core products of sport organizations are
mostly services (Chelladurai, 1999; 2005) and services are well known for being non-
existent in the real world and as such, their qualities are highly dependent on the
perceptions of customers (Parasuraman et al., 1985; Parasuraman, 2002). Employees of
high OCBs levels are critically needed in sport firms. It is because only with OCB
employees, sport managers will be able to provide the quality of services as desired by
the customers. In effect, these lines of arguments have opened up several intriguing
questions intended to be answered in this study. The questions are:
1. Are service-based HRM practices significantly related to OCB?
2. Which service-based HRM practice has the strongest and weakest effect on
OCB?
3. Is OCB significantly related to perceived service quality?
4. Does OCB mediate the relationship between service-based HRM practices and
perceived service quality?
5. Are the significance of the relationships among service-based HRM practices,
OCB and perceived service quality determined by the nature of employee job
orientations, namely non- and customer-contact employees?

25
1.12 RESEARCH AIMS
Based on the questions posed above, this study therefore aims at;
1. proposing a model that hypothesizes the mediating role of an OCB in the
relationship between service-based HRM and perceived service quality, as
moderated by the nature of employee job orientation
2. testing the validity of the proposed model in a specific sport setting namely golf
clubs
1.13 RESEARCH OBJECTIVES
Several objectives are formulated to help accomplish the tasks of this study. They are
as follows:
1. It has been argued that the incorporation of service culture in the design of
HRM can elicit service-related behaviours among employees. To confirm this
argument, the present study seeks to reveal the relationships between service-
based HRM practices and employee OCBs.
2. Since OCB has been shown to be instrumental in motivating employees to
perform their jobs better, the study attempts to examine the effect of OCB on
perceived service quality in the context of golf clubs
3. If OCB is resulted from service-based HRM practices and if at the same time, it
is also related to perceived service quality, the study is then interested to affirm
the role of OCB as the mediator in the link between service-based HRM
practices and perceived service quality.
26
4. Despite the fact that service culture is important for all employees regardless of
whether they are directly or indirectly interacting with customers (Schneider &
Bowen, 1993), many service studies focus only on the customer-contact
employees, giving the impression that this type of employees are more
responsible of the organizations’ service quality. In order to reveal the truth
about this matter, the study is set out to validate the proposed model in the
separate samples of non- and customer-contact employees in the context of golf
clubs.
1.14 IMPORTANCE OF STUDY
This study is important because of its attempts to:
1. provide useful input to sport managers on the effective management of HR
activities in sport organizations.
This study highlights the essential function of human resources in the creation of
service quality. The identification of HRM practices which are found to be responsible
for this phenomenon provides a helpful tool for sport managers to manage their human
resources effectively. For example, based on the findings of the study, sport managers
can put more emphasis and invest more resources (i.e., financial and manpower
supports) on the HRM practices which are found to have more strength in their
relationships with service quality (through OCB). Based on this informative
knowledge, they will be able to formulate policies in a more strategic direction so that
the employee behaviours that are required for achieving high service quality are
available in the organizations. Most importantly, this study can be used by sport

27
managers as an evident to support their justification regarding the critical role of HRM
in the sport organizations.
2. contribute to the accumulative body of knowledge of sport management study
An empirical study such as this one is very much required to augment the body of
knowledge of sport management literature. The benefits that will be yielded from this
study, will not only provide guidelines to sport practitioners, but they also add to the
current understanding of sport management in the aspects of HRM, OCB and service
quality. A significant contribution is made when this study suggests ways in which
HRM practices can be designed to bring out more OCBs in the employees. This is an
important issue since as service-oriented firms, sport organizations must depend on
behaviours that are not prescribed in formal job descriptions. Although some of the
practices identified in this study have been recognized elsewhere as approaches to
foster employee positive work-related behaviours, this study provides valuable new
insights to sport researchers especially those who are interested to find out how HRM
can enhance organizational performances.
3. close gaps that are currently exist in the relevant literature.
It is well acknowledged that data pertaining to the HRM-performance relationship in a
customer-focused setting are still lacking in the literature (Schneider, 1994; Morrison,
1996). According to Schneider (1994), although the significance of this relationship is
widely recognized, the number of relevant research is relatively small. The variable
that is theorized to mediate this relationship is another issue which necessitates more
testimonies. As noted by Tsaur and Lin (2003), only Morrison (1996) has explicitly

28
discussed the mediating effect of OCB in the relationship between HRM and service
quality but her proposed model has never been systematically and empirically tested. In
short, these two points are currently in need of more clarifications and empirical
evidence. By addressing them, this study facilitates the effort to close the existing gaps
currently exist in the HRM and service literature.
4. produce a more substantial evidence by using interdisciplinary focus
While this study is purported to improve the research and practice of sport management
scholars and practitioners, the theoretical foundations are heavily drawn from the
studies of HRM, Organizational Behavior and Service Marketing. As having an
interdisciplinary focus with multidisciplinary interests, this study will have key
implications for both theories and practices of those areas including sport management,
especially in resolving key questions that are required for future studies. As noted by
Becker and Gerhart (1996), “…if the traditional HR discipline does not embrace the
wider interdisciplinary approach required to produce a meaningful contribution to this
area, other disciplines will, and HR as a discipline runs the same risk as the HR
function of being marginalized.” (p. 798).
1.15 DEFINITION OF TERMS
Ascribing inaccurate meanings to the assigned variables will destroy the value of a
research. To avoid this catastrophe, constitutive and operative definitions of variables
are provided in the following sections. A constitutive definition is “a formal definition
in which a term is defined by using other terms” (Ary, Jacob, & Razavieh, 1996, p. 28)
and an operational definition refers to a description of the variable in terms of specific
29
testing or measurement criteria (Fraenkel & Wallen, 2000). Next is the presentation of
both the constitutive and operational definitions for the variables investigated in the
current study.
SERVICE-BASED HRM :
This concept is conceived from the idea of Schneider
and Bowen (1993) who point out that in order for
service organizations to obtain high service quality, a
climate for employee well-being serves to be the
prerequisite. What they mean by a climate for
employee well-being is having HRM practices that
aim at achieving a service climate. In this study, such
HRM practices are operationally defined as those that
are designed to meet the needs and wants of
employees which in turn, lead to the embracement of
service climate within the organizations. The argument
is that when employees’ needs are fulfilled, their
work-related behaviours will be positive and this in
effect will facilitate the organizations’ process of
attaining admirable service quality
OCB :
It has been discussed earlier that organizations with a
service-focused climate typically have employees with
service-oriented behaviours. Employees exhibiting

30
high service behaviours normally have the capabilities
to understand the importance of service quality and are
motivated to work towards achieving it (Gummeson,
1986; Zerbe et al., 1998). As highlighted by Morrison
(1996), OCB is a good example of service related-
behaviour since it has elements that are “critical for
ensuring service excellence” (p.497). OCB has been
originally defined as “individual behaviour that is
discretionary, not directly or explicitly recognized by
the formal reward system, and that in aggregate
promotes the effective functioning of the organization”
(Organ, 1988, p. 4). In this study, OCB is
operationally interpreted as a voluntary and
discretionary behaviour, resulted from service-based
HRM practices of which in aggregate, influences
customer perceived service quality.
PERCEIVED SERVICE
QUALITY :
When the products are intangible and customers’
presences are also required to co-produce them,
service providers have no option but to accept the fact
that customers play an indispensable role in their
businesses. Being humans, customers’ wants and

31
needs are always unpredictable. However, like it or
not, the quality of service rests entirely on the hearts
and minds of customers (Bowen and Ford, 2002). The
only way for service providers to ensure that the
service experiences are perceived favourably by the
customers is by making sure that all possible cues are
readily and consistently presented in first-rate states.
In the context of this study, the operational definition
for perceived service quality is; the customers’ overall
impressions of the organizations’ service quality.
THE NATURE OF
EMPLOYEE JOB
ORIENTATION :
Because customers are a crucial entity in service
industry, it is a common idea among service scholars
that fulfilling customers’ desires is the core activity in
this business (Schneider et al., 1980; Zeithaml et al.,
1990; Bowen & Ford, 2002; Anderson, 2005). Based
on the perspective of strategic core workforce (Delery
& Shaw, 2001), this core activity must be handled by
employees with the appropriate job orientation. In this
study, what is meant by the nature of job orientation is
the job that is oriented towards direct or indirect
interaction with customers.

32
1.16 OVERVIEW OF THE REMAINING CHAPTERS
There are two main parts in Chapter 2. The first part consists of the presentations and
highlights of several concepts, important to be understood throughout this study. Past
theoretical and empirical works pertaining to those concepts as well as the studies that
examine them will be discussed at great length. In the second part, relevant issues,
arising from the preceding discussions will be brought to light. As ways to address the
issues, multiple propositions and the corresponding hypotheses will then be
established. Finally, a model that serves as the framework of this study is demonstrated
at the end of this chapter. In summary, Chapter 2 provides the flesh to the body of this
study in which it justifies and supports the subsequent stages of this research exercise.
In Chapter 3, a complete description of the study approach will be presented. This will
include detailed explanations and reasons for employing certain type of research
design, method, instruments, questionnaire and data gathering methods. Other
important contents in this chapter are the discussions on the results of pilot test and the
statistical techniques that are going to be used in the later stage of this study.
In Chapter 4, results from the analysis of data are interpreted, both statistically and
inferentially. Here, all the raw data are analyzed and reported. Prior to data analysis,
the purification and validation of the scales will be carried out. The findings will be
explained by responding to each proposition, hypothesis and research question which
has been developed in the preceding chapters.

33
An elaborate discussion on the findings of this study can be found in Chapter 5. The
results will be interpreted in light of the established theories, and literature review. The
implications of this study to research and practice will also be discussed here. Before
the chapter ends with a conclusion, limitations and directions for future research are
given.
1.17 CONCLUSION
In an increasingly competitive global business environment, what differentiates one
organization from the other is the performance of its business operations. Stakeholders
persistently demand that organizations deliver effective operations as this is one of the
measures of a booming business. This current trend affects all category of industry,
including the sport industry. To stay competitive, sport organizations must demonstrate
high performance of their business operations that would point out to the effectiveness
and efficiency of resource allocation and outflow. In this regard, contemporary sport
business organizations are constantly confronted with a multitude of challenges not
only relate to fiscal and operational matters, but local and federal governmental
intrusion and policy issues, unpredictable socio-political environment as well as the
complex nature of the sport industry itself. More importantly, the ever increasing
growth rate of rival organizations that vie for the same share of the market in addition
to the limited access to the steadily decreasing public funds compel sport organizations
to seek for competitive advantage strategies. One of the options is to make the most
efficient use of their human resources at their disposal. With that spirit in mind, this
study is therefore undertaken.

34
CHAPTER 2
REVIEW OF LITERATURE
2.1 INTRODUCTION
In this chapter, several important concepts that serve as the backbone of the study are
conceptually, theoretically and empirically discussed. Multiple research works related
to the concepts are brought to light. Some critical issues are then raised based on
preceding review of literature. In the attempts to address these issues, relevant
propositions with the corresponding hypotheses are presented for purpose of statistical
testing. The chapter concludes the discussion by proposing a model that illustrates the
whole idea of this study.
2.2 LITERATURE REVIEW
2.2.1 HUMAN RESOURCE MANAGEMENT (HRM)
Human resources management (HRM) is a new version of a term called personnel
management (Byars & Rue, 2003). Although both of them refer to an administration of
employee-related matters, HRM is considered a more comprehensive term than
personnel management as it deals with more than personnel activities which include
broader issues such as motivation, leadership, organizational structure, group dynamics
and communication (Bratton & Gold, 2003). Unlike HRM, personnel management is
seen as “being much narrower and more clerically oriented than human resource
management” (Byars & Rue, 2003, p. 4). For the purpose of this study, HRM is the
term chosen to be used in the following discussion.

35
According to Schuler, Jackson, and Luo (2003), HRM is defined as "all the dedicated
activity that an organization uses to affect the behaviours of all the people who work
for it” (p.6). By this definition, it is suggested that there is a close association between
HRM and the behaviours of employees, especially those that are related to work
performances. As the focal point of HRM activities, human resources are seen as
having an impact on the productivity of an organization. Implying the same weight on
the role of human resources, Armstrong (2006) refers HRM as “a strategic and
coherent approach to the management of the organization’s most valued assets – the
people working there who individually and collectively contribute to the achievement
of its objectives” (p.3).
In short, HRM is an organization’s tool to influence the behaviours of employees. The
activities include “strategic and workforce planning, recruiting prospective employees,
selecting employees, training and developing employees, managing employee rewards
and recognitions, evaluating employee performance, classifying positions, creating a
positive and safe work environment (employee relations), and administering employee
benefits” (Selden & Jacobson, 2007, p. 83).
The HRM literature consistently argues that HRM practices do have an impact on an
organization’s performance. This theoretical notion is continuously supported by a
great number of empirical research (e.g., Devanna et al., 1981; Schuler & Jackson,
1987; Arthur, 1994; Huselid, 1994, 1995; MacDuffie, 1995; Delaney & Huselid, 1996;
Delery & Doty, 1996; Youndt, Snell, & Dean, 1996; Huselid et al., 1997; Ichniowski,
Shaw, & Prennushi, 1997; Patterson, West, Lawthom, & Nickell, 1997; Guest, Michie,

36
Conway, & Sheehan, 2000; Guest et al., 2003). Among the seminal works are those
produced by Russell, Terborg, and Powers (1985), who show the link between training
programs and financial performance, Terpstra and Rozell (1993) who demonstrate the
relationship between selection of employees and firm profit, and Gerhart and
Milkowich (1992), who reveal the association between compensation system and
organizational objectives.
Another important study that should also be highlighted is the one conducted by
Huselid (1995). In this study, the researcher provides evident on the impact of thirteen
HR practices of which he called high performance work practices, on multiple
indicators namely turnover, employee productivity and company financial
performance. Later in 1996, Delaney and Huselid (1996) investigate the effect of
selection, training and compensation, grievance procedures, decision making and
internal promotional practices and the interaction of these practices on perceptual
measures of market and organizational performances. They have discovered that
decentralized decision making is not related to the perception of market performance
and only incentive compensation is linked to the perception of organizational
performance.
In short, HRM is about managing human resources to the extent to which the
objectives of the organization are achieved by their assistance. Some basic functions of
HRM include planning, selection, recruitment, training, performance appraisals,
37
compensation and industrial relations (Byars & Rue, 2003). The literature so far has
been successful in linking the HRM activities to the organization’s performance.
2.2.1a HRM AND SPORT MANAGEMENT
Of late, sport is no longer an activity for people merely to seek fun, relaxation or good
health. It has transformed into a serious business as it is able to provide a huge source
of income for a lot of individuals. As a result, managing sport is not a simple task
anymore. Only personnel with the suitable qualifications, skills and interest are able to
bring sport organizations to success. Employees with such qualities can only be
produced through effective management of human resources. Sport is one of the
industries that requires highly organized, well-trained and committed workforce in
order to survive in today's competitive environment. The need to have an effective way
of managing these resources is therefore vital in this business. This view is shared by
Chelladurai, the leading scholar in the sport management study. In his support to the
critical role of human resources in sport organizations, he states that,
“Because most sport organizations produce services, management of
human resources is a critical concern of sport managers. An
understanding of the dynamics of human resources and their
management is necessary to be an effective manager.”
(Chelladurai, 2006, p. ix)
The argument that advocates human resources as a significant factor related to
organizational success is applied in sport management as well. For example, it has been
verified that the most distinguishing element that separates high performing teams from
the poor ones in the National Collegiate Athletic Association (NCAA) Division 1 in
America is the athletes (Trail & Chelladurai, 2000). Therefore, activities pertaining to

38
recruiting and securing the best athletes are seen as the best strategies in order to
success. Another example can be taken from the studies that focus on cheating and
unethical behaviours among athletes (e.g., Dixon, 2000; Mahony, Fink, & Pastore,
2000). Some relevant authorities such as coaches are found to be compromising with
such negative conducts for the reason that athletes of excellent performances will
provide a cutting edge to the team.
In sum, sport organizations also recognize the paramount contribution of human
resources in their businesses. This has been illustrated by several sport-related studies
that have investigated the importance of athletes as the crucial assets that determine
success in the organizations (e.g. Trail & Chelladurai, 2000; Mahony et al., 2000;
Smart and Wolfe, 2000).
2.2.1b HRM AND SERVICE
As research on HRM-performance is burgeoning in the literature, a disturbing pattern
is noted by some concerned HRM scholars. They begin to see that an abundance of
findings is drawn from the manufacturing sector, while relatively very little evidence
are gathered from the service setting (Schneider, 1994; Bartel, 2004; Dean, 2004).
With the exception of a few scholars such as Batt (1999, 2002), Banker, Lee, Potter,
and Srinivasan (1996) and Delery and Doty (1996), the majority of previous HRM
studies is conducted in the manufacturing context, “despite the fact that today most
employees work in service sector industries” (Bartel, 2004, p. 183). Most importantly,
little effort has been made to understand the characteristics of HRM with a service

39
focus orientation. Thus, although the positive consequences of HRM practices on
organizational performance have been emphasized by many scholars and practitioners
(e.g., Delaney & Huselid, 1996; Fey, Bjorkman, & Pavlovskaya, 2000; Khatri, 2000),
their results on outcomes pertaining to services such as employee service-related
behaviors and customer perceptions of service quality have not been given sufficient
attention.
In service, because the products that are offered to customers are intangible and
presented in a form of experience (Hill, 1977; Sasser et al., 1978; Solomon,
Surprenant, Czepiel, & Gutman, 1985; Lovelock, 1991; Zeithaml & Bitner, 2003;
Vargo & Lusch, 2004), the performance of the service operation therefore, cannot be
measured in a tangible manner. Instead, as the ultimate judges of service performance
(Schneider et al., 1980; Zeithaml et al., 1990; Galloway & Ho, 1996; Bowen & Ford,
2002), customers make their evaluations based on their interactions with employees
and the whole environment where their service experiences take place (Schneider &
Bowen, 1985; 1993). Apparently, both variables (interactions with employees and the
whole environment) that serve as service quality indicators are related to employees
and their commitments in making the customers contented. Many researchers have
underscored the importance of employees in creating and providing wonderful service
quality (Zeithaml, Parasuraman, & Berry, 1985; Bitner et al., 1990; Hartline & Ferrell,
1996; Kelley & Hoffman, 1997). For instance, customers have been shown to evaluate
service quality on dimensions such as concern and civility (Winsted, 2000) and

40
listening and understanding demonstrated by the employees (Chandon, Leo, &
Philippe, 1997).
The fact that the role of employees is so prevalent in service, it should be expected that
there are plenty of research conducted on this HRM-service issues (Schneider &
Bowen, 1993; Bowen & Ford, 2002). However, the little coverage available in the
relevant literature indicates that this is not the case. As mentioned by Schneider (1994)
in his article, “Because HRM concerns the employees who deliver service to
customers, it might be supposed that there is vast literature on the HRM-customer
service; there is not” (p.65). This issue seems to be currently unresolved when the
author once again expresses his concern in later years by stating “As I noted earlier,
within HRM the strategic implications of being in a service business have not received
much attention, though there are some exceptions” (2004, p. 147). To sum up, as much
as service quality is believed to be affected by HRM policies and practices, the
understanding of the relationship between these two variables “remains incomplete”
(Haynes & Fryer, 2000, p. 240) and “are typically only inferred” (Redman & Mathews,
1998, p. 71).
Schneider, who is pioneering a work on climate for service research (Parkington &
Schneider, 1979; Schneider, 1980; Schneider et al., 1980; Schneider, Wheeler, & Cox,
1992; Schneider, White, & Paul, 1998), also has a special interest in looking at service-
oriented HRM as a critical determinant of service quality. In one of his HRM-service
quality studies, it is stipulated that,

41
“…the key to managing the customer’s experience of service quality is to
manage employees’ experiences within their own organizations. And
when it comes to managing employee experiences at work, human
resources management is crucial”
(Schneider & Bowen, 1993, p. 40).
Schneider reiterates this view in the recent article by stating that “A business is not in the
business of service quality if its HRM practices are not suffused with a focus on service
quality” (2004, p. 148). Thus, if the objective of the firm is to provide quality service to
customers, the corresponding values and cultures must be reinforced and communicated
to the deliverers of the service. Or otherwise stated, in any service-based organizations,
the HRM practices must be service oriented or service-based.
The idea of HRM for service quality is originated from a proliferation of research on
organizational climate in the 1960s. Organizational climate is best understood as
practices and procedures, of which employees believe, are embedded with certain
elements intended to encourage members of the organization to adopt a certain set of
behaviors (Schneider et al., 1998). In its early inception, the construct of organizational
climate is claimed to have no purpose or target. The review on existing literature in
1975 has made Schneider to conclude that “the generic concept of organizational
climate is so amorphous and inclusive that the results from the measurement of climate
are conceptually amorphous” (Schneider, Bowen, Ehrhart, & Holcombe, 2000, p. 25).
This argument is supported by giving an example of one existing study which utilizes
an organizational climate measure of 10 dimensions. The resulting impact of this
observation witnesses an increasing number of research starting to focus on a

42
strategically oriented climate. Evidently, a more focused climate has been shown to
produce stronger relationships with specific organizational outcomes than less-focused
measures (e.g., Pritchard & Karrasick, 1973; Zohar, 1980; Schneider & Bowen, 1985;
Schneider et al., 1992).
In service firms, service or customer orientation is the pillar of the business (Schneider
et al., 1980; Heskett et al., 1994; Strong & Harris, 2004). As customers are the key to
profits, it is suggested that service companies strive towards providing services that
meet customers wants (Day & Wensley, 1983; Dean & Bowen, 1994; Noble, Rajiv, &
Kumar, 2002). Research particularly from service marketing has confirmed that
significant associations exist between customer orientation of a firm and its financial
and market performance (e.g. Doyle & Wong, 1998; Ambler, 1999; Day, 2000). While
insights into the outcomes of service or customer focus have been extensively
investigated (e.g., LaBaraba & Mazursky, 1993; Srivastava, Shervani, & Fahey, 1998;
Steinman, Deshpande, & Farley, 2000), the antecedents of this variable, specifically
human resource aspects are relatively understudied and often described as in need of
more clarifications and evidence (Schneider, 2004).
A ground-breaking research on climate for service or customer is first conducted by
Parkington and Schneider (1979), in bank branches. In that particular research, it is
discovered that customers base their perceptions of service quality not only on their
interactions with the customer-contact staff but on the whole process of service
experiences ranging from the appearances of physical facilities to the rules and
procedures of the organizations. This means that besides those whose jobs are
43
attending to customers at the counter, the contributions of non-contact-customer
employees, such as the technicians, clerical staff and janitors, are also crucial in the
overall service quality impressions of customers. Although there are no employee-
customer interface activities, the resulting work of the non-customer contact employees
in making the customers’ service experiences satisfactory, such as providing a clean
and safe environment or ensuring all the electrical and machinery equipments
functioning well, are very critical in this context.
In line with Schneider’s idea of climate for service, other service scholars begin to
recognize the need to change the traditional managerial functions of service employee
management (e.g., Grönroos, 1983; Bowen & Schneider, 1985). Some of the given
recommendations include (1) getting the employees involved in the planning and
organizing of service activities, (2) acknowledging the influence of employee work
environments on customer experiences of service quality (3) recognizing that the way
employees are managed can predict customer perceived service quality (Hartline &
Ferrell, 1996; Chebat et al., 2002). The main principle in these recommendations is that
in service-focused companies, the role of HRM must also be service-focused. Thus, to
ensure this notion is materialized, the design of HRM practices must be geared towards
achieving the service-related goals. In short, the match between the goals of the service
organizations and the design of their HRM practices is very fundamental in securing
high levels of service-related outcomes (e.g., perceived service quality) (Grönroos,
2000; Haynes & Fryer, 2000; Zeithaml & Bitner, 2000; Furunes, 2005).

44
In the beginning, research on HRM for service is only mentioned as parts of the
organizational service variable in the examination of its relationship with service
quality. For example, the facets of service-focused or service-based HRM are inferred
from a construct called work environment (Tornow & Wiley, 1990; Wiley, 1991),
service climate dimensions (Johnson, 1996), supportive management (Yoon, Beatty, &
Suh, 2001), organizational conditions (Lux, Jex, & Hansen, 1996), drivers of customer
orientation (Strong & Harris, 2004) and development and reward-based activities
(Elmadağ et al., 2008). Although not specifically examined as an individual construct,
through the findings of those studies, the HRM practices have been shown to be
significantly related to employee behavioural and organizational outcomes (e.g.,
customer satisfactions, service quality, service behaviours and service culture).
For instance, in a bank setting, Tornow and Wiley (1990) who extend previous works
(e.g., Schneider et al., 1980; Schneider & Bowen, 1985) assess organizational
performances in relations to the association between employee perceptions of various
aspects of working environment and customer perceptions of service quality. They also
seek out to identify which of the eight aspects of work environment have the greatest
potential to influence customer and organizational outcome measures. Out of the eight,
four of them are related to HRM practices namely management practices, work group
climate, pay and benefits and reward for performance. The results show that there are
four aspects of work environment that depict strongest relationships (ranging from
r=0.42 to 0.69). From those four, one is related to customer satisfaction and three are
HRM practices (management practices, work group and reward for performance).
Overall, it is concluded that the findings are consistent with the replicated studies

45
(Schneider et al., 1980; Schneider & Bowen, 1985) and additional evident provided by
this particular study is that both employee attitudes towards working environment and
customer perceptions of service quality are independently correlated with
organizational performance.
Meanwhile, in the context of insurance and financial industry, Lux et al. (1996) have
included reward/recognition, training, work environment, work design and two other
non-HRM-related elements as the organizational conditions that are hypothesized to
affect organizational commitment and customer service climate. All of these HR
practices are found to be significantly related to both of the dependent variables with
correlation values ranging from 0.33 to 0.72. The researchers also hypothesize that
organizational commitment partially mediates the relationship between the independent
and dependent variables. The regression results indicate support for that particular
hypothesis.
A more complex HRM-service framework is produced by Yoon et al.’s (2001) study
which has been conducted in retail banks. In this study, the researchers observe the
relationships among work climate variables (service climate, supportive management),
work effort, job satisfactions and employee service quality. Among the predictions that
are made, the researchers hypothesize indirect effects of supportive management on job
satisfactions (through work effort) and supportive management on employee service
quality (via job satisfactions). Based on the review of the items developed in the Yoon
et al.’s instruments, it can be implied that the scale of supportive management reflects
HRM dimension which earlier has been described by Schneider (1994) as supervisory
46
behavior. Based on the results, all the hypotheses are generally supported. Again,
evidence on the significant role of HRM practices in the promotion of service quality is
provided here.
Perhaps, triggered by a call that has been made by Schneider in the International
Journal of Service Industry Management in an article entitled “HRM – A Service
Perspective: Towards a Customer-focused HRM” (1994), several researchers begin to
investigate the HRM practices as an independent construct, representing the
independent variable in its relationship with service-related outcome indicators
(dependent variables). For example, using a self-report measure that relies on the
perceptions of employees, Zerbe et al. (1998) analyze the role of service culture
variable in the relationship between HRM practices and service behavior. The practices
that are used for HRM measures are leadership and direction, rewards and benefits,
work demands, career opportunities, performance appraisal, and training. The
correlation results indicate that HRM practices have significant direct associations with
the 5 dimensions of service behavior and specific HRM practices such as leadership
and work demands have significant indirect effects on service behavior through service
culture.
Unlike Zerbe and his colleagues (1998), who conduct their research in an airline
industry, Rogg, Schmidt, Shull, and Schmitt (2001) adopt similar framework and
validate it in franchise dealerships whose nature of business is related to a single large
automotive manufacturer. Using training, performance review, policy, hiring, testing
and job description as the variables for service-focused HRM construct, this study
47
investigates the relationships among HRM practices, service climate and customer
service indices. Based on inter-correlation results, the researchers report that the
associations between the HR practice components and service climate variables are
moderate in magnitude and most of them are statistically significant, providing support
for HR practices and climate linkage.
Further, using the analysis of structural equation model (SEM), Rogg et al. (2001) also
find that the change from full to partial mediation model yields no significant chi-
square value (∆χ2=0.28, df=1, p>0.05). This result indicates support to the full
mediation model, which implies the existence of a mediating variable (organizational
climate) that links HRM practices to customer satisfaction. In short, with a sizeable and
significant indirect effect of HRM practices on customer satisfaction via organizational
climate, this study provides evidence that supports Schneider’s earlier theory which
postulates the importance of correlating the HRM practices with organizational climate
as the match between the two will lead to superior customer related outcomes.
Within a healthcare sector, another related study is conducted by Scotti, Driscoll,
Harmon, and Behson (2007). In this study, the researchers term the HRM construct as
high-performance work system (HPWS) and regard it as a catalyst for excellent service
quality. The HPWS is measured by ten items, each of which assesses goal alignment,
communication, involvement, empowerment, teamwork, training, trust, creativity,
performance enablers, and performance-based rewards. Taking all the items together as
a composite variable, this HPWS is observed in terms of its connection to customer
orientation, employee and customer perceptions of service quality and customer

48
satisfaction. The sequential relationships that have been hypothesized show significant
supports. For example, the direct effect of HPWS on customer orientation is 0.74, on
employee-perceived service quality is 0.60, and the indirect effect of HPWS on
employee-perceived service quality through customer orientation is 0.60 and on
customer-perceived service quality through employee-perceived service quality is 0.40.
In sum, this study also confirms the positive and significant relationship between HRM
and service-related measures.
In another study, Browning (2006) examines the effects of HRM practices on the
perception of service behavior as mediated by organizational commitment. However
this time, the framework is tested in three different settings namely retail, hospitality
and car rental. HRM practices are measured by selection, training, development, pay,
rewards, performance appraisals and management support. Based on the results of
regression analysis, the findings show that although the relationship between HRM
practices and service behavior is overall, significant across all samples, the mediating
effect is only significant in the retail sector, partially significant in the car rental and
non-significant in the hospitality industry.
Specific HRM practices have been shown to impact service behaviors more than
others. For example, Schmitt and Allscheid (1995) have found support for a significant
relationship between employee evaluations on policies and practices that facilitate the
provision of quality customer service and their intentions to serve. Several studies such
those conducted by Schneider and Bowen (1995), Bettencourt and Brown (1997) and
Chebat et al. (2002) have also pointed out to the idea that employee perceptions of

49
fairness in workplace which include pay rules, job supervision, recruitment and
selection, is a key determinant of service behavior. Davidow and Uttal (1989) and
Peccei and Rosenthal (1997) in similar vein, have found that training in particular
multiskilling, helps to upgrade employee’s sense of confidence in dealing with the
conflicting demands of customers.
To sum up, in service-based businesses, the practices of HRM must also be service-
based. According to Schneider (2004), “generic HRM will not suffice in an
increasingly competitive marketplace; organizations must, to use a phrase from
marketing, focus or falter” (p.147). What he means by that is, having HRM practices
such as high performance work system, is not enough. These seemingly profitable set
of practices evidently help to produce talented and inimitable workforce (e.g., Huselid,
1995; Becker & Huselid, 1998; Delery & Shaw, 2001). However, a much more
competitive advantage can be achieved if those HRM practices are designed with a
focus on superior service and service quality delivery, especially in a context of high
intangibility where the performance of employees becomes an indicator of quality
service. Furthermore, the socio-political, national culture and economic situation in the
country within which the service organization is operating should be taken into
consideration when determining the relevancy of specific HRM practices that are
geared towards fostering service climate (Browning, 2006).
Hence, for the current study, the service-based HRM is conceptualized as the
managerial practices intended to inculcate customer-focus values in the attitudes and
behaviors of employees. This objective can be accomplished by focusing on satisfying
50
the needs and wants of employees, through the implementation of service-based HRM
practices. The underlying premise for this strategy is that a positive treatment given by
the management to the employees will be reflected or mirrored in the quality of
performances exhibited by the employees (Grönroos, 1983; Schneider & Bowen, 1985;
Zerbe et al., 1998).
2.2.2 SERVICE-BASED HRM PRACTICES
In terms of the practices used to capture the service-oriented HRM concept, it is found
that this particular variable has various versions. For example, there are six scales of
HRM practices employed in the Zerbe et al.’s (1998) study, which include leadership
and direction, rewards and benefits, work demands, career opportunities, performance
appraisal, and training. Four of the scales are drawn from Dunham, Aldag, and Brief’s
(1977) work while the other two are developed for the study itself based on the
researchers’ review of literature. Meanwhile, in the study conducted by Tsaur and Lin
(2004), the aspects of HRM practices being examined are recruitment and selection,
training and development, compensation and benefits and performance appraisal.
These HRM scales are borrowed from Khatri’s (2000) study.
In contrast, instead of looking at each practice, adopting a scale developed by Harmon,
Scotti, Behson, and Farias (2003), Scotti et al. (2007) utilize an HRM scale
comprising of ten items each measuring goal alignment, communication, involvement,
empowerment, teamwork, training, trust, creativity, performance enablers, and
performance-based rewards. Apart from that, there is a considerable debate pertaining
to whether individual practices (e.g., Taylor & Ho, 2005) or overall system (e.g.,

51
Becker & Huselid, 1998) contribute more to organizational performances. As said by
Schneider and Bowen (1993), the famous HRM-service quality scholars, “Service
managers need to know which HRM investments yield the largest returns on different
dimensions of service quality” (p.40). For purpose of effective management of human
resources, this statement suggests the use of individual practices rather than global
measure of service-based HRM.
The suggestion to use individual practices as the independent variables in the HRM-
performance relationship can also be implied from the sport HRM model proposed by
Doherty (1998). Although not specifically articulated, the author argues that HRM
individual practices such as job design, staffing and development, personnel
evaluation, rewards and leader behaviour independently influence the outcomes of
organizations.
Benjamin Schneider, the scholar who first initiated the concept of service-based HRM
also looks at the effects of HRM as individual variables (1980; 1994). In one of his
breakthrough studies, individual HRM practices named as supervision, status, career
facilitation, socialization and work facilitation have been found to be correlated with
customer perceived service quality (Schneider & Bowen, 1985). Hence, while
acknowledging the fact that as a system, it can show a stronger indicator of an
investment in human capital (Dixon, 2002), this study however chooses to assess the
effects of HRM practices individually mainly because this decision enables an
identification of which practices are more or less influential in the HRM-performance

52
relationship. This information can help sport managers to be more specific and cost-
effective in planning their HRM strategies.
The HRM practices that have been selected to constitute the service-based HRM
construct are the ones which are proposed to be heavily linked to service orientation
and considered crucial for the context of study. The choice of the selected practices is
made based on the review of several studies which are related to this service-based
HRM topic. Appendix A provides the list of studies that have been referred to in
conceptualizing the concept of service-based HRM for this study.
2.2.2a SUPPORT AT WORK
Support at work is a measurement deduced from the integration of previous scales that
consider this dimension as fundamental in the effort to foster service climate for the
organizations (e.g., Schneider & Bowen, 1985; Wiley, 1991; Johnson, 1996; Lux et al.,
1996; Rogg et al., 2001; Little & Dean, 2006). Support at work is an HRM practice
that refers to the physical aspects of organization and workplace environment that
potentially hinder or facilitate employees’ effort in accomplishing the given tasks. In
the case of golf clubs, support at work may include organizational rules, policies and
procedures, job descriptions, workload distributions, work demands, safety measures,
work design, scheduling system, and others.
The idea that the dimension of support at work can affect productivity is inferred from
the principle of scientific management introduced by an industrial engineer, Frederick
Taylor (1911). The premise of Taylor’s theory is that employee performances can be

53
increased by providing them opportunities to earn more financial returns. Although this
philosophy can be considered narrow by contemporary standard (Schneider, 1994), the
fact that employee motivation and productivity go hand in hand has made
organizations begin to find ways on how to motivate their workforce.
Soon after the initiation of Taylor’s theory, the idea of work design, time-and-motion
technique and many other industrial engineering devices are applied to each facet of a
job. It is believed that once the employees are fully equipped with appropriate work
equipments and working in a conducive environment, they will be prompted to produce
more (Griffin & Ebert, 2006). Extending this concept to golf club situations, employees
can be expected to be committed in doing their jobs if for example, all necessary
equipments work efficiently, the workplace is secured with adequate safety measures,
the rules and procedures are easy to be understood and followed and there are always
enough people to ask for assistance.
Empirical evidence have also shown that support at work is found to be generally
positive in the promotion of high service-related outputs. For example, in Schneider
and Bowen’s (1985) seminal study, the correlation between work facilitation and
customer perceptions of service quality yields a significant value of 0.42. Adopting and
modifying Schneider and Bowen’s scale, similar result has been depicted in the study
carried out by Little and Dean, (2006). In this particular study, the value of correlation
is 0.44.

54
Tornow and Wiley (1990) also provide substantiation when they find work rules and
policies, health conditions and safety are highly associated with customer satisfaction.
In somewhat similar study, Wiley (1991) reveals that, employee perceptions of the
support at work (characterized by problems related to physical work context and safety
level at the workplace) and work obstacles (demonstrated by priority issues such as
deadlines, keeping costs down and providing quality services) have been found to be
significantly correlated with various dimensions of customer satisfactions (e.g.,
r≥0.31).
2.2.2b TRAINING
Training serves to furnish employees with certain sets of knowledge, skills and
behaviors related to the goals espoused by the organizations (Davis, Davis, & Van
Wert, 1998; Swanson & Holton, 2001). Another purpose of training is to hint to
employees that organizations are committed to take care of their well-being (Elmadağ
et al., 2008) and value them as their valuable assets (Moreland & Levine, 2001). There
are two types of training; formal (off-the-job training) and informal (on-the-job)
training (Liu & Batt, 2007; Elmadağ et al., 2008). Formal training typically requires
employees to be relieved from daily work and the training program is conducted
systematically based on a standardized curriculum. Meanwhile, informal training
occurs in the context of daily work, expects employees to learn on their own by
observing how their co-workers or supervisors do their jobs. Both formal and informal
training have been found to be related to organizational productivity (e.g., Bartel, 1994;
Liu & Batt, 2007).

55
Human resource professionals have long acknowledged the importance of employee
training in boosting the efficiency of service processes and outcomes (Yoo & Park,
2007), the organization’s competitive ability (Smith, 1998; Frabotta, 2000) and overall
performance (Guzzo, Jette, & Katzell, 1985; Barron, Black, & Loewenstein, 1987;
Campbell, 1989; Mathieu, Tannenbaum, & Salas, 1992; Colbert, 2004). It has also
been argued that training allows service firms to “provide a better class of quality of
service, or to develop a competitive niche market” (Davies, Taylor, & Savery, 2001, p.
367) which ultimately fosters repeat purchases from customers. In golf clubs, examples
of training may range from acquiring basic skills in performing their jobs to making
decisions in solving customer-related problems or complaints as well as learning about
the clubs’ new service-related policies and procedures. Lytle, Hom, dan Mokwa (1998)
observe that leading service providers are investing substantial resources in
implementing their service training programs which include advanced quality-based
team training, problem-solving training, inter-personal skills training, and other
advanced training purported to empower employees with excellent work performance
skills.
Training is exceptionally critical to employees whose main orientation is to delight
customers (Albrecht & Zemke, 1985; Schneider & Bowen, 1985; Heskett, Sasser, &
Hart, 1990; Benoy, 1996; Johnson, 1996). Hence, for service quality purposes, training
is claimed to be an essential facet of HRM practices (Schneider et al., 1993; Brown,
1994; Patel, 1994; Perry, 1995; Ueno, 2008). Based on Heskett et al.’s (1994) model of
the service-profit-chain, it can be implied that the achievement of customer loyalty and
customer satisfaction is heavily dependent on an efficient service provision which

56
certainly includes the capability, knowledge and motivation of service employees.
Wexley and Latham (1991) also add that employee behavior can be influenced through
the behavior modeling process of thorough training programs.
Where employees are sufficiently trained and committed to providing a superior
quality of service, there is evidence to suggest that customer perceptions of service
quality are increased significantly (Armistead & Kiely, 2003). Studies related to
service quality for example have shown that training is a significant contributor in the
employee own perceptions of customer orientation (β=0.133, Strong & Harris, 2004),
employee role-prescribed (prosocial) behaviors (β=0.78, Chebat et al., 2002) and extra-
role (prosocial) behaviors (β=0.64, Chebat et al., 2002), job satisfaction (β=0.17,
Elmadağ et al., 2008), commitment to firm (β=0.13, Elmadağ et al., 2008), two aspects
of service quality measures namely, responsiveness and assurance (β=0.41, β=0.48,
Tsaur & Lin, 2004) and perceived service quality (β=0.26, Yoo & Park, 2007).
Training has also been shown to be highly correlated with four service climate
variables (between r=0.22 and r=0.34, Rogg et al., 2001), service behavior (r=0.45,
Browning, 2006), organizational commitment (r=0.72, Lux et al., 1996), customer
service climate (r=0.49, Lux et al., 1996), customer satisfaction (r≥0.31, Wiley, 1991)
and service culture (r=0.37, Zerbe at al., 1998).
2.2.2c REWARD SYSTEM
People do not work for free. Even volunteers expect rewards except that their rewards
are typically more intangible intended to satisfy their intrinsic needs. In the context of
human resource management, the reward system constitutes an economic exchange

57
thereby representing a key element of the employment relationship. In this exchange,
employees “undertake a certain amount of physical and mental effort and accepts the
instructions of others” (Bratton & Gold, 2003, p. 277) and for these reasons, it is
natural for employees to expect some compensations from the management in return to
what employees have given and done for the management.
Reward system in this study refers to all monetarily and non-monetarily compensations
and incentives provided by the organizations to employees as a form of appreciation to
the contributions which have expended by the employees to the organizations.
According to Bau and Dowling (2007), there are five categories of rewards or
incentives. The first one is the incentives provided by the work itself such as autonomy
and growth through career development and the recognition of individual performance.
The second type of rewards is called social incentives and this is characterized by
information distribution and communication with employees. The third category is the
incentives related to the internal organizational environment such as the size of the
company, organizational structure and leadership style. The next two rewards
categories are monetarily oriented, classified as direct and indirect financial groups.
Direct incentives are pay-for-performance while indirect incentives include things such
as free access to phone and internet at the office, and recreational facilities such as
cafeterias or pantries, hospital bills (with certain limitations).
The importance of rewards in eliciting desired performances from employees can be
justified by using the reinforcement theory (Skinner, 1953). Its basic assertion is that
“employee behavior is a function of its contingent consequences” (Luthans &

58
Stajkovic, 1999, p. 50). When this premise is applied to the workplace, it yields a
concept of you get what you reinforce. Building on the same foundation, a reward
system can be seen as an approach to inculcate the employees’ commitment towards
helping the organizations in achieving their business goals (Bowen & Johnston, 1999).
That is because, when it is strategically designed with certain purposes, rewards are
able to motivate the behaviors and actions of employees accordingly (Elmadağ et al.,
2008). The employees’ high motivations to engage in service-related behaviors are
assumed to result from fair (Dubinsky & Levy, 1989; McFarlin & Sweeney, 1992),
conspicuous and specific compensation practices and programs (O’Connor &
Shewchuck, 1995; Benoy, 1996; Hartline & Ferrell, 1996). Establishing rewards
contingencies and recognizing employee superior service deliveries as well as
rewarding them in a timely manner are also found to be significant indicators of
employee commitment to service quality (George & Grönroos, 1989; Schneider &
Bowen, 1993).
In general, the reward system has been found to be highly instrumental in stimulating
the causal chain from employee behaviors to service quality (Heskett et al., 1990;
Roach, 1991; Schlesinger & Heskett, 1991; Berry, Parasuraman, ,& Zeithaml, 1994;
Schneider & Bowen, 1995; Lytle, 1998; Elmadağ et al., 2008). Specifically, there is an
existence of a high correlation value in the relationship between rewards and a climate
for service (r=0.43, Schneider et al., 1992), organizational commitment (r=0.72, Lux et
al., 1996), service culture (r=0.15, Zerbe et al., 1998), customer satisfaction (r=0.46,
Johnson, 1996), service behavior (r=0.17, Browning, 2006), extra-role behavior
(β=0.36, Tsaur & Lin, 2004).
59
2.2.2d SUPERVISORY ASSISTANCE
Supervisors are leaders or persons whom employees are answerable to. With their
leaderships, supervisors are potentially influential in shaping positive service
orientation within an organization (Church, 1995; Lytle et al., 1998). Supervisors’ roles
are often associated with providing assistance in terms physical and emotional supports
necessary in the successful accomplishment of the given tasks (Goleman, 2000;
Elmadağ et al., 2008). In short, it is believed that supervisory assistance can be
considered as a critical component in the dissemination of organizational strategies to
employees and a productive approach for affecting changes in their attitudes (Katz &
Miller, 1996; Den Hartog & Verbug, 2002; Elmadağ et al., 2008).
A similar concept of supervisory assistance is seen in Schneider and Bowen’s (1985)
study. In this study, the dimension is labeled as supervisory behaviors and they are
described by the supervisors’ or managers’ acts of providing feedback, establishing
rewards contingencies, and sharing information. In some other studies, this dimension
is known as managerial practices (Tornow & Wiley, 1990; Schneider et al., 1998),
supervisory practices (Wiley, 1991), management service orientation (Johnson, 1996),
leadership (Schneider et al., 1998; Zerbe et al., 1998), supportive management (Yoon
et al., 2001) and coaching (Elmadağ et al., 2008).
Effective supervisors are when they are able to influence the attitudes and actions of
their subordinates for the betterment of the organizations (Bovee, Thill, Wood, &
Dovel, 1993). Employees believe supervisors to be supportive when the supervisors
allow them “to fail without fear or reprisal” (Yoon et al., 2001, p. 504). If positively
60
perceived by employees, supervisor supportive assistance can be a catalyst for
employees to develop the proper attitudes and behaviours towards quality service. In
golf clubs for example, employees who are unwell will feel cared for when their
supervisors give them a day off or let them go out to see a doctor. In addition, if the
supervisors recognize them for their involvements in successful golf competitions and
make this known to everybody else in the clubs, the esteem needs of the employees
will likely be heightened and this consequently enhances their motivations to give
greater performances in the future. Being supportive and appreciative of the workers’
work efforts have been shown to strongly related to employees’ willingness to provide
good services (Schneider & Bowen, 1993). Singh (2000) also finds that with
supervisory assistance, service employees perceive their roles to be less stressful and
their burnout tendencies to be less likely, and thus their performances and perceived
commitment level are prone to be elevated.
Most of the studies demonstrate that supervisory assistance is facilitative in the
organizational achievement of high service quality. For example significant
associations are found between supervision and customer perceptions of service quality
(Schneider & Bowen, 1985), between managerial service orientation and overall
service climate (Johnson, 1996), between managerial practices and customer
satisfaction (Tornow & Wiley, 1990), between leadership and service behavior (Zerbe
et al., 1998), between coaching and employee service quality commitment (Elmadağ et
al., 2008), and between supportive management and job satisfaction (Yoon et al.,
2001).

61
2.2.2e PERFORMANCE APPRAISALS
Performance appraisals or evaluations of employee current performances are another
crucial component in the management of human resources as it is very predictive of
various human resource actions and outcomes (Judge & Ferris, 1993; Murphy &
Cleveland, 1995; Boswell & Boudreau, 2002). This particular HRM practice refers to
an “observation and assessment of employee performance against pre-determined job-
related standards, for purpose(s) delineated by the organization” (Cheung & Law,
1998, p. 404). In line with this definition, Bratton and Gold (2003) add that the
objectives of performance appraisals are to judge and develop the qualities of
employees’ performances. According to Dixon (2002), performance appraisals work on
two levels. First, they facilitate employee efficiency by making employees understand
that they are responsible of their own performances. Second, if properly conducted,
performance appraisals can help direct employees on how to improve their current
performances.
The need to evaluate the performances of employees is a conclusion that can be drawn
from the famous Hawthorne Study. In 1925, a group of researchers conducted a study
at Hawthorne Works of Western Electric outside Chicago. These researchers have
discovered that the productivity of the workers who involve in the study have increased
and this outcome is attributed to the attentions that have been given to the workers
throughout the experiment process (Griffin & Ebert, 2006). This study is an evident
that shows human beings appreciate attentions because through those attentions, they
have the opportunities to demonstrate their capabilities to the observers. This sequence
of events is used to explain the high productivity that has been revealed in the study.

62
In the case of golf clubs, performance appraisals are believed to work the same way.
Performance appraisals can be used as an avenue for employees to know the standard
of their work performances particularly in terms of serving and satisfying their
customers. Formal, structured and periodical evaluation system communicates a
message to employees that the club management makes a serious effort to pay
considerable attention to them. Based on the Hawthorne Study mentioned earlier, such
a message will motivate employees to upgrade their current work performance levels.
Research in general has shown that performance appraisals are linked to firm
performances (e.g., Delery & Doty, 1996). Work in the area of performance
management has confirmed that appraisals from multiple sources or upward feedback
from subordinates are contributive to individual high performance (e.g., Smither,
London, Vasilopoulos, Reilly, Millsap, & Salvemini, 1995; Walker & Smither, 1999;
Johnson & Ferstl, 1999; Sanwong, 2008;). In their meta-analysis study, Kluger and
DeNisi (1996) have found that the groups that receive feedback gain higher
performances than those that do not. While significant link has been produced by many
studies in the literature, some organizations are still dissatisfied with their evaluation
schemes due to complaints from employees regarding the process of performance
appraisals which are perceived as unfair by them (Fletcher, 1997). It is therefore
suggested that in order for performance appraisal to be supportive of employee
behaviours, employees must first be satisfied with the way performance appraisals is
implemented (Kuvaas, 2007).

63
Jawahar (2007) has noted that “in practice, perceived fairness of evaluation, the
procedures used to evaluate performance, and the manner in which performance-
related information is communicated likely play an integral role in shaping ratees’
reactions to critical elements of the appraisal process” (p.736). The same author has
also provided empirical evidence that shows satisfaction with appraisal feedback is
related to job satisfaction and organizational commitment. In short, performance
appraisal can be a powerful HRM tool to influence the attitudinal behaviors of the golf
clubs’ employees, as long the employees accept or are satisfied with the management
of that performance appraisals process (e.g., Muczyk & Gable, 1987; Pettijohn,
Pettijohn, & D'Amico, 2001).
According to the social exchange theory, an employee behavior at the workplace is
actually a form of reciprocation of the treatment he or she receives from the
organization (Rousseau, 1990; Rousseau & Parks, 1993). Inferentially, this theory
implies that there is a relationship between organizational practices such as HRM, and
employee behaviour. This also means that the kind of behaviors that organizations
hope their employees to possess will depend on the kind of treatment that organizations
are willing to expend to their employees. Thus, using the social exchange theory as the
theoretical foundation, the present research assumes that HRM practices which place a
strong emphasis on employee well-being are bound to produce employees with the
aspired behaviors. In other words, customer-focused or service-based HRM practices
will correspondingly unearth service-focused behaviors from the employees. In this
present research, the sort of service behaviour that is predicted to result from service-
based HRM practices is called organizational citizenship behavior (OCB).

64
2.2.3 ORGANIZATIONAL CITIZENSHIP BEHAVIOR (OCB)
In search of the appropriate employee behavior related to service quality, the
framework of service-profit chain (Heskett et al., 1994) is referred to again. In this
framework, it is learned that employee satisfactions are the key to positive employee
performances. Employee satisfactions are a state when employees perceive their
“needs, wants and expectations are satisfied across a range of related variables”
(O’Neill, 2005, p. 135) pertaining to job-related experiences.
The relationship between employee satisfactions and organizational performances has
long been the focus of enormous number of writings and empirical research from as far
back as the famous work of Frederick Taylor (1911) up until today. “Although not
often realized, Taylor’s basic motivation for his scientific management is the design of
work so that employees might be satisfied at work and, thus, more productive”
(Schneider, 1994, p. 65). In their review of this subject, Schneider and Brief (1992)
estimate that over 5,000 articles and research dissertations have examined employee
satisfaction as one of the critical antecedents of organizational success.
In the study conducted by Smith et al. (1983), they have found that employee
satisfactions stimulate personnel to perform desirable behaviors that help the
organizations to be effective and productive. This landmark work has served as an
impetus for Organ (1988) to introduce an organizational citizenship behavior (OCB), a
behavior that is theorized to be the consequence of employee satisfaction. This
behaviour is believed to be a useful instrument in the performance enhancement of

65
employees as well as organizations. In the context of service environment, it is
suggested that,
“employees who have positive appraisals of their work environment
have higher levels of job satisfaction. Employees who have high levels
of job satisfactions are more likely to engage in prosocial and helping
behavior, leading to higher levels of customer satisfaction”
(Payne & Webber, 2006, p. 366).
Emerging evidence also show that these proactive behaviors resemble another form of
service-oriented behavior which is called as OCB (Bettencourt, Gwinner, & Meuter,
2001; Hui et al., 2001; Groth, 2005).
Also known as a “good soldier syndrome” OCB is originally defined as “individual
behaviour that is discretionary, not directly or explicitly recognized by the formal
reward system, and that in aggregate promotes the effective functioning of the
organization” (Organ, 1988, p. 4). Basically, OCB is a non-prescribed behavior
exhibited by an employee by his or her own choice, with no expectation of getting any
recognition or rewards from his or her management. OCB is sometimes likened to
“prosocial organizational behavior” (Brief & Motowidlo, 1986; O’Reilly & Chatman,
1986; George, 1990; George & Bettenhausen, 1990) “organizational spontaneity”
(George & Brief, 1992; George & Jones, 1997), and “extra-role behavior” (Van Dyne,
Cummings, & Parks, 1995).
In order to distinguish OCB from those related terms especially “contextual
performance” (Borman & Motowidlo, 1993; 1997; Motowidlo & Van Scotter, 1994;

66
Borman, White, & Dorsey, 1995; Motowidlo, 2000), Organ later redefines her
definition by including the fact that OCB is a “non-task” behavior that serves to
support task performance (1997, p. 91). Regardless of the specifics of the definitions,
Acquaah (2004) observes that most organizational behavior scholars agree that OCB
helps the achievement of organizational effectiveness by:
“(1) enhancing coworker and managerial productivity, (2) freeing up
scarce resources for more productive purposes, (3) reducing the need to
devote scarce resources to purely maintenance functions, (4) facilitating
the coordination of activities between employee workgroups or teams
and across workgroups, (5) strengthening the ability of organizations to
attract and retain high quality employees by making the work
environment a more interesting and fulfilling place to work (6) making
an organization’s performance more stable by reducing the variability in
a work unit’s performance and (7) increasing an organization’s ability to
adopt to environmental change”.
(p.126-127)
In short, if OCB has been found to be contributive to organizational effectiveness
based on the earlier discussion, then it is wise for sport managers as well to inculcate
such behaviors among their employees.
2.2.3a OCB MEASURES
There exists various measures of OCB in the literature (e.g., Podsakoff et al., 1990;
Van Dyne, Graham, & Dienesch, 1994; Konovsky & Organ, 1996; Lievens & Anseel,
2004). While a variety of OCB measures have been proposed and operationalized,
LePine, Erez, & Johnson (2002) conclude that the most frequently used model is the
one with five dimensions namely altruism, conscientiousness, sportsmanship, courtesy
and civic virtue. Based on review of OCB literature (e.g., Organ, 1988; Podsakoff et

67
al., 1990; MacKenzie, Podsakoff, & Fetter, 1991; Moorman, 1991, 1993; Moorman,
Niehoff, & Organ, 1993; Niehoff & Moorman, 1993; Podsakoff, MacKenzie, & Fetter,
1993; Tansky, 1993; Podsakoff & MacKenzie, 1994; Podsakoff, MacKenzie, &
Bommer, 1996; Koys, 2001; LePine et al., 2002; Bienstock et al., 2003; Yoon & Suh,
2003; Lievens & Anseel, 2004), the following are the descriptions of the five
dimensions that have commonly been used by researchers to conceptualize OCB.
ALTRUISM
Altruism is known for a discretionary behavior that aims at helping coworkers or
customers in alleviating problems at hand. This includes assisting others with heavy
workloads, coaching new recruits or less skilled workers and offering helps to
colleagues and customers who are in needs. These helping behaviours are not required
in the job descriptions and they are readily performed with no time limits (i.e., even if
the time exceeds the employees’ working hours).
CONSCIENTIOUSNESS
Conscientiousness refers to a voluntary behavior performed for the purpose of
complying with the rules prescribed by the organizations. High conscientious
employees are more apt to be punctual, do not waste time, use the given resources
efficiently and always go beyond minimally required levels of attendance.

68
SPORTSMANSHIP
Sportsmanship consists of actions that refrain employees from making trivial matters
into big issues. Instead of making complaints or file grievances, these employees will
try to look at the matters positively or try to solve them in less controversial ways.
Overall, sportsmanship is a behaviour that tolerates the inevitable inconveniences of
work without complaining.
COURTESY
Courtesy is an OCB behavior that attempts to maintain harmonious and peaceful
relationships among individuals in the organizations. Examples of courtesy are
consulting with others before taking any actions, being patient with the demands of
customers or coworkers and allowing others to explain the reasons for their actions. In
short, it is the acts of informing others to prevent the occurrence of work-related
problems.
CIVIC VIRTUE
Another behavior that reflects OCB is called civic virtue. Civic virtue is demonstrated
by employees who show efforts in keeping up with matters that affect the organization.
For example, employees with high civic virtue participate in and are concerned with
the life of the firm. They are willing to attend to any events organized by the
organizations, make genuine efforts to read or understand the organizations’ new

69
services/products or rules/policies and offer their ideas or suggestions that can improve
the performances of organizations.
LOYALTY
As the literature of OCB develops, several other related dimensions are introduced. For
example loyalty has been identified as an important component of OCB by scholars
such as Graham (1991), Van Dyne et al. (1994), Bettencourt et al. (2001), Acquaah
(2004), and González and Garazo (2006). Loyalty is seen as a behavior that cares
about and concerns with the image, reputation and success of organization. Loyal
employees are likely to defend their organizations against any threats, speak favorably
about their organizations, encourage their own friends and families to purchase the
offered services, and always like to show off their organizations’ logo to the outsiders
(i.e., wearing t-shirts or using pens that have the company’s logo).
TEAMBUILDING
Another measure of OCB which is recently introduced in the literature is teambuilding.
Acknowledging the importance of team-based performance and the contribution of
discretionary behavior in ensuring the success of team productivity, Piercy, Cravens,
Lane, and Vohies (2006) have created this new OCB domain. The scale assessment
reports teambuilding to be a distinct measure with an internal consistency indicates
quite a strong Cronbach’s alpha (α = 0.70). Examples of teambuilding are actions taken

70
to resolve disagreement or conflicts among colleagues and encourage each other to do
well-done jobs.
2.2.3b ANTECEDENTS OF OCB
The social exchange theory posits that employee behaviors towards their jobs are the
results of the treatments they receive from their organizations (Blau, 1964). Building
on this theory, relevant determinants of OCB has been rigorously examined. Hitherto,
empirical evidence has shown antecedents of OCB are job satisfaction (e.g.,
Netemeyer, Boles, McKee, & McMurrian, 1997; MacKenzie, Podsakoff, & Ahearne,
1998; Bettencourt et al., 2001), organizational commitment (e.g., Podsakoff et al.,
1996; MacKenzie et al., 1998), fairness perception (e.g., Moorman, 1991; Netemeyer
et al., 1997), personal disposition (e.g., Bolino, 1999; Bettencourt et al., 2001),
transformational leader behaviours (e.g., Podsakoff et al., 1990) and leader-member
exchange relationship (e.g., Kent & Chelladurai, 2001). However, despite the growing
evidence of the predictors of OCB, researchers have paid relatively little attention to
HRM practices as another significant contributor of OCB.
Sun, Aryee and Law (2007) point out the role of HRM practices as an indicator of
organizations’ attitudes towards employees. For example, the extent to which the
organizations are concerned with the employee well-being is indicated by the design of
the HRM practices. These researchers propose in their study that employees’ OCBs
will be enhanced if they perceive there is an existence of supportive HRM practices
(i.e., positive work environment) implemented by the organizations. The results of their

71
investigation has provided evidence (r=0.35) that advocates the proposition. Hence, in
line with the social exchange theory, it is hypothesized in this research exercise that
service-oriented HRM practices which are focusing on satisfying both customers and
employees (Schneider & Bowen, 1993) will create an environment where employees
are motivated to work for the benefits of their organizations. This motivation is
assumed to be resulted from their obligations to repay the organizations’ kindness
towards them.
2.2.3c CONSEQUENCES OF OCB
Apart from being studied as the outcome of various determinants (e.g., HRM
practices), OCB is also investigated in terms of its consequences related to
organizational performances. Empirical research that substantiates the relationship
between OCB and organizational outputs are various. For example, Karambayya
(1989) finds that employees working in high-performing organizational units exhibit
higher levels of OCBs than employees working in low-performing units. In the years
that follow, Podsakoff et al. (1997) examine employees’ helping behaviors and their
tolerance towards job difficulties in a paper mill. Their findings reveal that those OCB-
related behaviors correlate highly with workgroup performance.
In a more recent study, Koys (2001) also discovers that an OCB influences customer
satisfaction, quality of service and generation of revenues. Earlier than Koys’ study, the
data gathered by Walz and Niehoff (2000) indicate that some citizenship behaviors are
found to be contributive to at least some measures of organizational performances.

72
Overall, according to the meta-analytic study conducted by Organ and Ryan (1995) on
55 previous research, most of the work has focused on the employee-level variables
such as attitudes, perceptions and personal dispositions as the functions of OCB.
Without trying to underestimate the importance of those findings, Yoon and Suh
(2003) suggest an examination of other outcome variables related to organizational
measures as the dependent variable for OCB. One promising variable that has been
recommended is perceived service quality.
Bienstock et al. (2003) provide three reasons why OCB is able to affect customer
perceptions of service quality. The first one relates to the fact that OCB is a non-
mandated behavior. The standard guideline for employees for example, may include
the specific amount of time spent by employees to entertain each customer at the
registration counter. However, depending on the moods of customers due to multiple
causes unknown to but felt by employees, the employees may strictly follow the
standard procedures, reduce the interaction to a minimum or extend the interaction for
the purpose of cheering up the customers. The employees’ decisions on this
hypothetical occasion are largely dependent on their varying levels of discretionary
behaviors.
The second reason concerns with the characteristics of OCB that promotes
independent, individual initiative. For example, it may not be specified in their job
descriptions but employees with high levels OCBs have high tendencies to propose
relevant suggestions that can improve the performances of organizations such as
73
instituting new scheduling or merit systems. Such initiatives will help improve the
management of organization and this efficient management will impress customers
who will then evaluate service quality more satisfactorily. Finally the last reason why
OCB can function as the predictor of positive customer perceived service quality is
because this behavior contributes to performance at an organization level. For instance,
employees of high levels of OCBs are very tolerant to emotional pressures imposed by
their co-workers or organizational system and policy. Their avoidances from getting
themselves involved in any workplace conflicts help to secure the costs that have to be
unnecessarily spent by the organizations in the process of resolving those conflicts.
Furthermore, organizations that are free from internal conflicts will be perceived
positively by the customers.
There is however an indication of an interest to explore OCB in service organizations.
For example Morrison (1996) proposes a model that links HR practices and OCB to
service quality. Vaughan and Renn (1999) develop a framework that draws a link
between customer service OCB and customer loyalty and perceptions of service
quality. Empirical evidence provided by Hui et al. (2001) has confirmed a significant
path between customer-focused OCB and service quality. In another study conducted
by Yoon and Suh (2003), it is demonstrated that contact employee job satisfactions and
trusts in their managers contribute to employee levels of OCBs and these OCBs later
help to enhance customer perceptions of service quality.

74
2.2.3d OCB AND SPORT MANAGEMENT
Within the context of sport management, at least two studies have been found to
examine OCB. The first one is carried out by Kent and Chelladurai (2001). In that
study, the researchers have investigated OCB as the result of transformational
leadership (TL) in the American university athletic departments. In contrast to the
positive relationship between TL and OCB which has been consistently shown in the
non-sport management literature, this study finds no evidence of such relationship.
Only one dimension of TL, which is leader-member exchange (LMX) yields
significant correlation value with OCB-altruism (r=-0.314) and OCB-generalized
compliance (r=-0.248). The lack of consistency with the common findings suggests
further exploration of the concept of OCB in sport setting.
The second study is conducted by Chang and Chelladurai (2003a). In the context of
Korean sport organizations, the study examines the attitudes of part-time and full-time
workers of in terms of their commitment and OCBs. The kappa results report that full-
time employees are more affectively committed (kappa difference=2.69, t=3.98) and
more OCB oriented (kappa difference=2.61, t=3.92) than the part-time employees. The
findings are considered consistent with the social exchange theory which predicts that
employees who perceive that they are treated fairly by their employers will exhibit
positive attitudes and behaviours towards their jobs. In this case, because the full-time
workers receive better remuneration than the part-time workers, it is therefore expected
that their perceptions towards the organizations are better than those of the part-time
workers. Evidently, the results provide supports to this prediction.

75
2.2.4 SERVICE QUALITY
According to the Maslow’s needs hierarchy theory, once the basic requirements for
food and shelter are fulfilled, people begin to seek physical goods and consequently
aspire to achieve personal development. This is what has been characterizing the
people living in the post-industrial society currently.
“The postindustrial society is concerned with the quality of life, as
measured by services such as health, education and recreation. The
central figure is the professional person, because rather than energy or
physical strength, information is the key resources. Life now is a game
played among persons”
(Fitzsimmons & Fitzsimmons, 2006, p. 8).
The transitions from pre-industrial to industrial and later to post-industrial have
resulted in an increase in the family income. Based on the Engel’s Law, the more
money people earn the more likely for them to spend their extra income, not on buying
more food, but on enriching the qualities of their lives in terms of health, education and
recreation (Grönroos, 1988). Therefore, as the disposable income is accumulating, the
extra spending has been more on getting better quality of life, as served by the service
industry rather than acquiring larger quantity of goods, as produced by the
manufacturing companies.
The prevalent issue related to better quality of life is service quality. Service quality is
a concept that is not easy to explain (Parasuraman, 2002; Parasuraman et al., 1985;
Berry et al., 1988). This difficulty is most often attributed to the unique features of
services, in terms of how they are produced, consumed and evaluated (Chelladurai,
1999; 2006). To begin with, the concept of quality is even more complex within the

76
service than the goods context (Grönroos, 1984, 1988; Zeithaml et al., 1990; Lehtinen
& Lehtinen, 1991;). In the traditional production of goods, every single mistake or flaw
that appears in the physical body of goods can be detected and corrections can be made
before they are out to be purchased by customers. Unfortunately, because of the unique
nature of services which is described as intangible, perishable, heterogeneous, and
simultaneous (Sasser et al., 1978; Schmenner, 1995; Lovelock, 2001; Chelladurai,
2006), the outcomes of services cannot be physically measured and presented in a
tangible and consistent manner. This happens because services are abstract entities and
that is why to some scholars they are defined subjectively as “actions that transfer
values” (O'Sullivan et al., 2002), “transactions with the absence of ownership”
(Lovelock & Gummesson, 2004), “games between persons” (Bowen & Schneider,
1988) and “deeds, processes and performances” (Zeithaml & Bitner, 1996).
Perhaps, because of the non-universal definition of service quality, the instrument used
to measure it also suffers from being inconsistent. Many issues regarding the
inconsistency of service quality have been raised (Reeves & Bednar, 1994). One of
them is regarding whether to evaluate the quality of service based on disconfirmation
paradigm (e.g., SERVQUAL; Parasuraman et al., 1985) or performance perception
(e.g., SERVPERF; Cronin & Taylor, 1992; Brady & Cronin Jr., 2001) of the overall
performance (Zhou, 2004). Despite the widely used of SERVQUAL (e.g., Choi, Lee,
Kim, & Lee, 2005; Dabholkar & Overby, 2005; Mukherjee & Nath, 2005; Kouthouris
& Alexandris, 2005) or its replications (e.g., Asubonteng, McCleary, & Swan, 1996;
Mels, Boshoff, & Nel, 1997; Robinson, 1999), this disconfirmation paradigm
measurement has been criticized for “its use of difference scores, dimensionality,

77
applicability and the lack of validity of the model” (Kang & James, 2004, p. 267). To
overcome this problem, direct measures have been suggested (Brown, Churchill, &
Peter, 1993; Peter, Churchill, & Brown, 1993). Dropping the expectation portion of the
disconfirmation framework, only the perception of overall service quality is used as an
alternative to the gap-based measurement (Brady & Cronin Jr., 2001). Empirical
evidence also have shown that performance perception is superior to the gap analysis
especially for the reasons that it is able to capture the variance in consumer overall
perceptions of service quality and validate the conceptualization of service quality as a
determinant of customer satisfaction (Brady, Cronin Jr., & Brand, 2002).
Another common issue that is often debated is whether service quality and customer
satisfaction are the same or different constructs (Dabholkar, 1993; Oliver, 1993;
Iacobucci, Grayson, & Ostrom, 1994). The issue is particularly valid since some
empirical attempts purported to distinguish these two constructs have always been
unsuccessful. For example, discriminant validity is found to be non-existence between
service quality and customer satisfaction in the study carried out by Spreng and Singh
(1993) in banking industry. Another concern regarding similar issue is the link between
these two constructs (assuming that they are of distinct entities). Some researchers
assert that customer satisfaction is the antecedent of overall service quality (e.g.,
Oliver, 1981; Parasuraman et al., 1988; Bitner, 1990) while others posit the opposite
relationship (e.g., Oliver, 1983; Anderson & Sullivan, 1993; Spreng & Mackoy, 1996).
To address these two issues, Dabholkar, Shepherd, and Thorpe (2000) conduct a study
that investigates the relationship between these two constructs and behavioral

78
intentions. Based on confirmatory factor analysis, they have found significant evidence
that supports the presence of discriminant validity between service quality and
customer satisfaction constructs. In other words, service quality and customer
satisfaction are distinctively different from each other. Furthermore, through the SEM
analysis the authors also find that service quality has an impact on behavioral
intentions through customer satisfaction and this proves that customer satisfaction is
not a determinant but a consequence of service quality.
2.2.4a PERCEIVED SERVICE QUALITY
According to Chelladurai (2006), the core activities of sport and recreation
organizations concern with the production of services rather than goods. This implies
that the perspective of quality in the sport settings is better understood by referring to
the service quality literature. Based on literature review of service quality in sport,
Chang et al. (2002) and Tsitskari, Tsiotras, and Tsiotras (2006) have observed that
dimensions of service quality also vary within sport settings. For example, there are
five dimensions of service quality in the fitness services (Chelladurai et al., 1987),
eleven in the sport centers (Kim & Kim, 1995), five in professional sport (McDonald et
al., 1995), four in sport and leisure centers (Howat et al., 1996), and four in
recreational sport centers (Ko & Pastore, 2005). In one of the most recent development
of service quality conceptualization in sport setting, Chang and Chelladurai (2003b)
have used the system-based approach as their basis of input-throughput-output scale of
service quality in fitness services. The output component consists of a four item-
construct called perceived service quality, of which it measures the customer overall
perceptions of the organization’s level of service quality.

79
The “boundary-spanning” literature (Thomson, 1967; Bennis, 1970; Aldrich and
Herker, 1977; Katz & kahn, 1978; Schneider, 1980) suggests that whatever feelings
employees have towards their service organizations are inevitably transparent to
customers. The source of this phenomenon is attributed to the nature of service which
is intangible. The intangibility of the business makes all employee job related activities
visible and therefore cannot be hidden from customers. For example, if employees feel
that they are not treated fairly by the management, they will likely be less enthusiastic
to perform their jobs. Since the product of service is measured by the quality of service
delivery (Grönroos, 2000), the employees’ non-committed attitudes will influence the
quality of their work performances which in effect, impact the organizations’ service
delivery to the customers. Eventually, the customers’ evaluations on the organizations’
service quality will be affected by these chains of events.
The first study that attempts to examine the extent of the connection between
employees’ and customers’ perceptions of service quality has been carried out by
Schneider, Parkington, and Buxton in 1980. With a revelation of a significant
correlation value of 0.67, this study becomes the cornerstone of more boundary-
spanning studies in the literature. (e.g., Schneider, 1980; Schneider et al., 1992;
Schneider & Bowen, 1993; Schneider, 1994; Schneider et al., 1998; Schneider, 2000;
Schneider, 2004). Hence, based on the accumulated evidence, there is reason to believe
that there is an existence of a positive association between employee and customer
experiences of service quality.

80
The boundary-spanning or spillover effect is further rationalized and advocated by the
recent theory of service-profit chain (Heskett et al., 1994). In this theory, employees’
satisfaction with the organizations’ internal service quality is posited to be the causal
factor of the employees’ work productivity. The theory asserts that employees who
perceive their organizations as not customer-oriented in their human resource processes
and procedures are expected to exhibit non-customer-oriented attitudes towards the
customers. When this occurs, there is a high tendency for customers to receive
attention that is not properly and adequately given by the respective unfriendly
employees. This in turn will result an outcome that is certainly detrimental to the
customers’ overall impressions of the organizations’ service quality performances.
To put succinctly, boundary-spanning and service-profit chain theories propose that
employees’ feeling, ideas and opinions correlate well with those of the customers’.
Previous empirical evidence that support this correlation is sufficient. For example,
after the 1980’s study, Schneider and Bowen (1985) once again investigate the
relationship in a different service setting and this time, they find a somewhat similar
significant correlation value which is 0.63. This significant relationship is also steadily
shown in other studies such as those conducted by Johnson (1996, r=0.45), Yoon et al.
(2001, t=2.98,), and Scotti et al. (2007, β=0.66). This convincing significant employee-
customer relationship is so well recieved by researchers that some of them even
utilized employees as substitutes to customers’ perceptions of service quality (e.g.,
Tzafrir and Gur, 2007). In short, based on the available evidence, it can be concluded

81
that “employees of service organizations constitute not only a delivery mechanism but
a strategic diagnostic resource for service organizations” (Schneider, 1994, p. 74).
2.2.5 STRATEGIC CORE WORKFORCE
The strategic core workforce proposes an idea of having different employment systems
on different groups of employees within an organization (Delery & Shaw, 2001). This
idea points out that successful firms normally have a certain group of employees who
are more equipped with distinctive competencies than the rest of other employees.
These distinctive competencies which are possessed by this particular group of
employees differentiate the organizations from competitors.
Apparently the concept of strategic core workforce is similar to what has been
promoted by other researchers. For example, drawing on the resource-based view,
human capital and transactional cost theories, Lepak and Snell (1999) have contended
that the value and uniqueness of employee skills serve as key predictors of four
different employment modes namely internal development, acquisition, contracting,
and alliance. Each employment mode requires different employment arrangement.
They state that “So, just there may be no universally best set of HR practices for every
firm, we argue that there may actually be no one best set of practices for every
employee within a firm” (Lepak & Snell, 1999, p. 45).
Other examples are shown by Osterman (1987) who elaborately discusses the four
categories of employment subsystems as alternatives for different types of jobs within
organizations, Sonnenfeld and Peiperl (1988) who view the composition of firms’

82
workforce as reflective of different career systems and Tsui, Pearce, Porter, and Tripoli
(1997) who provide empirical evidence that also advocates the principle of providing
different treatment to different employees of different employment relationships.
The strategic core workforce of an organization is believed to be determined by the
firm’s strategy (Delery & Shaw, 2001). As said by Pfeffer and Baron (1988, p. 273),
“if a company is to build an internal culture around its expertise, say, as a marketing
company, it may find it more convenient to de-emphasize – and perhaps externalize
altogether – those functions that are peripheral to this core activity of the organization”.
In the case of service companies for example, the strategies of the firms are
fundamentally related to customer and service quality (Bowen & Ford, 2002;
Anderson, 2005). Because customer-contact employees are the group of human
resources who are in contact with customers and have always been the focus of many
service studies, to consider them as the strategic workforce of the service firms is
therefore justifiable.
2.3 DEVELOPMENT OF PROPOSITIONS AND HYPOTHESES
Overall, based on the empirical research described earlier, as well as other relevant
works available in the literature (e.g., O’Connor & Shewchuck, 1995; Haskett et al.,
1994; Benoy, 1996; Hallowell, Schlesinger, & Zornitsky, 1996; Johnson, 1996), it can
be concluded that there is adequate support to relate HRM practices to service quality.
This current study however, attempts to extend the previous works by addressing a
number of issues arising from the review of previous literature.

83
The first issue is regarding the HRM practices that represent the construct of service-
based HRM. As stated by Lytle et al. (1998) “little is known about the integral
ingredients required to create and produce service excellence” (p.459). Similarly,
evidence have shown that there is no consistency in the practices of service-based
HRM. Moreover, the practices chosen to be employed in the studies are not well
justified by some researchers. (e.g., Wiley, 1991; Yoon et al., 2001; Tsaur & Lin,
2004; Elmadağ et al., 2008). The point of departure from those studies is that, this
current study closely examines the relevant service-HRM research available in the
literature (See Appendix A). Integrating those that are believed to be suitable in the
context of this study, five HRM practices have been considered as representative of
service-based HRM and they are called support at work, training, reward system,
supervisory assistance, and performance appraisals. Conceptually and theoretically,
these practices have been discussed to be instrumental in the creation of a causal chain
which starts from HRM to OCB and subsequently from OCB to service quality.
“How an organization manages its human resources establishes the tone and conditions
of the employee-employer relationship, and in turn this impacts on employee behavior”
(Tsaur & Lin, 2004, p. 472). For the purpose of effective management of human
resources, it is therefore important to understand the kinds of behaviors that will be
produced by certain orientations of managerial practices such as service-based HRM.
This concern leads to the second issue that is going to be addressed in this study.
Within the context of HRM-service quality relationship, the employee behavioral
outcomes of service-oriented HRM practices that have been studied by previous
researchers heretofore are usually service behavior (Zerbe et al., 1998; Browning,

84
2006), extra-role and role-prescribed behaviors (Chebat et al., 2002; Tsaur & Lin,
2004) and organizational/employee commitment (Lux et al., 1996; Browning, 2006;
Little & Dean, 2006).
While the mentioned variables have been found to be playing paramount roles in the
causal relationships that have been investigated, there is an issue of limited evidence on
other behavioral elements, which also have great potentials in affecting service-related
outcomes (Bell & Menguc, 2002). In one of the most widely cited article, Morrison
(1996) suggests organizational citizenship behaviour (OCB) as an alternative to other
customer-oriented behaviours. OCB is a discretionary behaviour displayed by the
concerned employees who are committed to contribute to the positive development of
the organizations (Organ, 1988). The fact that OCB can be a significant consequence of
service-based HRM has been inferred from the studies conducted by Chebat et al.
(2002) and Tsaur and Lin (2004). However, in those studies, the OCB is called extra-
role behavior and the significance of this particular behavior is not highly stressed nor
discussed at great length. Although there are strong theoretical justifications to predict
the relationship between HRM practices and OCB (i.e., social exchange theory), to
date there is no empirical evidence that suggests the incorporation of service
orientation in the design of HRM practices can strongly encourage employees to
perform this voluntary behavior.
In relating service-based HRM practices to OCB, the construct of OCB is now the next
concern; Is OCB a first-order or a second-order (global) construct in this study? For
reasons to achieve parsimony and to reduce complexity, most scholars treat different

85
OCB measures as composite indicators of a global construct (Allen & Rush, 1998;
Chen, Hui, & Sego, 1998; Deckop, Mangel, & Cirka, 1999; Hui et al., 1999;
Netemeyer et al., 1997). Supports for opting OCB as a global construct is provided by
a meta-analysis study carried out by LePine et al. (2002). In that study, it is reported
that “the predictive relationships with the broader OCB criterion were as good as, or
superior to, those with the narrower dimensional criteria” (p.60). Based on these
arguments, OCB has been decided to be a global construct in this study. Hence, with
regard to the highlighted issues, the following proposition is established in this study:
PROPOSITION 1
Service-based HRM Practices inculcate organizational citizenship behaviors
(OCBs) among employees
This proposition can be empirically tested by examining the following hypotheses;
H1. Support at work has a significant relationship with OCB
H2. Training has a significant relationship with OCB
H3. Reward system has a significant relationship with OCB
H4. Supervisory assistance has a significant relationship with OCB
H5. Performance appraisals have a significant relationship with OCB
The third issue is related to the inadequate evidence regarding the relationship between
OCB and service quality in the relevant literature. While the relationship has been
theoretically established (Morrison, 1996), the existing literature is still limited and
insufficient (Kelley & Hoffman. 1997; Bell & Menguc, 2002; Castro, Armario, &

86
Ruiz, 2004). Early conceptualization of OCB predominantly focuses on behaviors that
are directed at other coworkers of the organization in general (e.g., Organ, 1988;
Podsakoff et al., 1990). Its effect on organizational performances, perceived service
quality in particular, is still not fully explored (Bolino & Turnley, 2003).
Some studies however have been successful in proving the existence of a link between
OCB and service quality (e.g., Walz & Niehoff, 1996; Vaughan & Renn, 1999; Hui et
al., 2001; Bell & Menguc, 2002; Yoon & Suh, 2003; Castro et al., 2004). Nevertheless,
it has never been studied how the context of sport may alter this relationship. The need
to address this issue is critical especially when employees’ behaviours are found to be
one of the important success factors in sport organizations (e.g., Dixon, 2002; Chang &
Chelladurai, 2003b). For that purpose, the present study will examine the relationship
between OCB and customer perceptions of service quality in the context of sport,
specifically, golf clubs in Malaysia. Thus, the second proposition for this study will be:
PROPOSITION 2
Employee OCBs determine perceived service quality
The corresponding hypothesis that needs to be statistically tested therefore:
H6. OCB has a significant relationship with perceived service quality
The fourth issue concerns with the role of HR outcome as the mediator in the
relationship between service-based HRM practices and quality service performances.
HRM scholars in general, aim at providing evidence on the significant role played by

87
HRM in the organizations’ performances. While most of the empirical research reveal
positive linkages (e.g., Arthur, 1994; Huselid, 1995; Batt, 2002; Way, 2002;
Zacharatos, Barling, & Iverson, 2005), some others are found to be inconsistent with
the general findings. For example, Wright, Gardner, Moynihan, and Allen (2005)
observed that when past firm performance is included as the controlled variable, the
existing association between the HRM and organizational effectiveness becomes no
longer significant. Similarly, in the study conducted by Park, Mitsuhashi, Fey, and
Björkman (2003), with the presence of workforce attitudinal characteristics, the
relationship between HRM and firm performance is subsequently diminished.
In similar argument, Rogg et al. (2001) notice that many prior HRM-performance
research such as those carried out by Huselid (1995), Delaney and Huselid (1996), and
Huselid et al. (1997), generally disclose significant but small effects of HRM on
performance. This observation is further supported by their own findings (Rogg et al.,
2001) which report a small magnitude of correlation between HR practice components
and climate variables (average result, r=0.23). As said by Haynes and Fryer (2000, p.
240) “Importantly, these attempts to demonstrate statistically the effects of HRM leave
the exact nature of the relationship between particular bundles (HRM practices) and
organizational performance unclear”.
Little understanding of the “black box” (Delery & Shaw, 2001, p. 170) that underlies
the HRM-performance relationship has been given as the reason for this “unclear”
conclusion (Guest, 1997; Peccei & Rosenthal, 1997; Delery, 1998; Wright & Gardner,
2003). Apart from that, according to Dyer and Reeves (1995), the most immediate

88
impact of HRM practices is seen on employee-related behaviors, followed by
organizational productivity and consequently organizational financial outcomes. This
conception clearly supports the idea of a mediator that is presumably presence in the
HRM-performance relationship. Hence, understanding and identifying the existence of
a mediating variable in this relationship are considered important as the information
can help explain how the HRM practices influence the organizations’ performances
(Wright, Gardner, & Moynihan, 2003).
The question of how the effects of HRM practices are transported to a specific
organizational outcome, service quality in particular, is also not sufficiently answered
within the study of HRM in the service industry. As service quality has been
consistently found to be the result of organizational service-based elements, including
HRM practices (e.g., Schneider & Bowen, 1985; Yoon et al., 2001; Tsaur & Lin,
2004), not many studies attempt to confirm whether the association is purely direct or
caused by the mediating factors such as employee behaviors. Even those that examine
this mediating issue provide mixed results. A classic example is shown by Browning
(2006) where the researcher examines the effects of HRM practices on the perception
of service behavior as mediated by organizational commitment in three different
settings namely retail, hospitality and car rental. The results report that the mediating
effect is only significant in the retail sector, partially significant in the car rental and
non-significant in the hospitality industry. Extending the concept of mediation to the
sport setting, this study departs from the earlier research by looking at employee OCBs
as the mediator in the relationship between service-based HRM practices and perceived

89
service quality. Therefore, the proposition that is developed for this study is stated as
follows:
PROPOSITION 3
Employee OCBs serve as the linking variable that connects service-based HRM
practices to perceived service quality
With a purpose to verify the above proposition, the following hypotheses will be
tested:
H7. OCB mediates the relationship between support at work and perceived service
quality
H8. OCB mediates the relationship between training and perceived service quality
H9. OCB mediates the relationship between reward system and perceived service
quality
H10. OCB mediates the relationship between supervisory assistance and perceived
service quality
H11. OCB mediates the relationship between performance appraisals and perceived
service quality
The study samples of most service literature have always been workers who are
directly in contact with customers. Does this mean that customer-contact employees
are the strategic core workforce of the organizations? Assuming the strategic core
workforce is correct, the service-based HRM framework therefore is more valid and
applicable on this type of employees. Nevertheless, the issue of whether customer-

90
contact employees are the strategic core workforce of the service organizations and as
such should receive more attentions from the management has never been addressed by
any study before. Similarly, whether the non-contact-customer employees are equally
important in the achievement of service quality goals is another concern that should
also be resolved so that deserving attentions can be given to this group of employees as
well.
Oliva and Sterman (2001) state that “customers do not evaluate service quality solely
in terms of the outcome of the interaction; they also consider the process of service
delivery” (p.894). As far as this definition is concerned, the quality of its delivery
process is dependent on the performances of both non- and contact-customer
employees. Schneider and Bowen (1993) strongly believe that customer impressions of
service quality are derived from the whole picture of the service experiences which
include not only their interactions with the contact staff, but also with the systems and
conditions of the environment where the experiences take place. His belief is consistent
with the various service quality scales which suggest the results of work performances
of both non- and customer-contact employees as dimensions of service quality. This
also means that the contributions of the non-customer-contact staff in making the
service firms of high quality service are also as instrumental as those contributed by
customer-contact employees. In other words, the performances of both worker types
are highly related to customer perceptions of service quality.
Despite Schneider’s early conceptualization of the role of employees in the service
firms regardless of whether they are directly or indirectly attending to the needs of

91
customers, many studies have only concentrated on understanding the nature of service
from the perspective of customer-service employees. For example, Davies et al. (2001)
argue that the “permeable boundary” (Van Looy, Van Den Bossche, & Buyens, 1998,
p. 200) between customer-contact employees and customers “in the form of
observation and interaction, creates a situation where the employees’ experiences at
work is communicated to their clients and in turn reflects the overall service quality
impression of the organization” (Davies et al., 2001, p. 366). These researchers seem to
imply that the link between management strategy and service quality can be more
established by the contact-customer service staff because “employees who deal directly
with customers are likely to have a good idea of how satisfied their customers are”
(Johnson, 1996, p. 835). This possibly is the main rationale why this type of workers is
preferable to be the subjects of most observations (e.g., Wiley, 1991; Chebat et al.,
2002; González et al., 2006). Obviously, this rationale is shared by advocates of the
strategic core workforce principle.
The strategic core workforce is a concept that believes some management strategies
should not necessarily be applied to all employees within a firm (Delery & Shaw,
2001). According to this belief, if the management is targeting at achieving the
organization’s goals, the strategy to accomplish that should be implemented on
employees who directly deal with this core process. Not only the same strategy may
not be relevant to other employees who are at the non-core of the business but the
implementation may incur unnecessary cost and resources. Correspondingly, based on
the trend of service research, customer-contact employees have been given the central
attention and as such, it can be implied that they are the ones involve in the core of the

92
service business (as they directly deal with customers). Thus, assuming the idea of
strategic core workforce is correct, the model which is proposed in this study will only
be valid or fit in the samples of customer-contact employees. In the samples of non-
customer contact employees, the same validity is not expected to be demonstrated.
In short, based on the proposition of strategic core workforce, this study predicts that
the model that illustrates the mediating role of OCB as the mediator in the relationship
between service-based HRM practices and customer perceptions of service quality will
be moderated by the nature of employee job orientation (whether they are directly or
indirectly interacting with customers in performing their jobs). More specifically, the
model is expected to be valid only in the samples of customer-contact employees but
not in the non-customer contact employees. Thus, in order to confirm this prediction,
the current study formulates the following proposition:
PROPOSITION 4
The model that depicts the mediating effect of OCB in the relationship between
service-based HRM practices and perceived service quality only fits the customer-
contact employee but not the non-customer-contact employee sample.
In order to obtain empirical evidence for this proposition, the following hypothesis is
therefore developed:

93
H12. The nature of employee job orientation (direct or indirect contact with
customers) moderates the proposed model
The sixth and final issue that has arisen from the literature review is regarding the
context in which the studies have taken place. To date, empirical data related to HRM-
service quality relationship has been extracted from the contexts of insurance (George,
1990; Hallowell et al., 1996), banking (Schneider et al., 1980; Schneider & Bowen,
1985), telecommunication (Batt, 2002), healthcare (Scotti et al., 2007) and car rental,
hospitality, and retail (Browning, 2006) industries. Apparently, none of them has
examined this subject in a sport-related context. The need to understand the HRM-
service framework in the sport setting is further heightened by the fact that HRM
research is generally lacking within the sport literature (Gibson, 1998; Taylor & Ho,
2005). Although it is widely acknowledged that human resources are considered
critical elements in sport organizations (Chelladurai, 2005; Linnehan, 2005), very few
studies have examined an HRM related topic.
Exceptions however can be made to some studies such as the one conducted by Wright,
Smart, and McMahan (1995) who investigate the connection between strategy, human
resources, and performance among the American National Collegiate Athletic
Association (NCAA) basketball teams, Dixon (2002) who proposes a multi-level
model for the relationship between HRM practices and organizational performances in
the American NCAA Division III level, and Taylor and Ho (2005) who explore the
effects of convergence and divergence issues and how they influence the HR practices
in the Australian sport organizations.

94
While several attempts have been made to address some HRM issues in the sport
setting, little is known about how HRM operates within profit-oriented sport
organizations such as golf clubs. Heretofore, no research has been found to identify
specific practices of HRM in sport organizations (e.g., golf clubs) that can be linked to
employee customer-oriented behaviors and subsequently customer perceptions of
service quality.
Based on Chelladurai’s (1987) descriptions of service firm classifications, golf clubs
can be categorized as the type of firms that offers both primary and secondary services.
The primary services are associated with golfing experiences such as game rules,
competition system, provision of instructors, caddies, playing courses and reservation
process. The secondary segment includes all those complementary services that do not
directly relate to golfing activities but important in the enhancement of customer
experiences. For example, food and beverages at the restaurants, cleanliness of the
changing rooms, adequacy of locker rooms and safety at parking facilities. Given such
complex nature of industry, there is a need to identify certain service-based HRM
practices that are critical in the development of certain employee behaviors,
particularly OCB, which are deemed to be important in customer perceived service
quality.
As stated by Scotti et al. (2007, p. 111), “Despite considerable progress in specifying
and empirically testing various linkage models, the specific matrix of strategic human
resource management practices that drive the “chain-reaction” remains unsettled”. The
call for effective management of human resources that are designed to enhance service

95
quality has been echoed by many concerned scholars. Within the sport management
study of which the HRM topic relatively receives little coverage, this concern is
therefore particularly more valid and relevant. Hence, the issues that have been raised
heretofore provide justifications for the present study to propose and test the following
model in the sport context such as the Malaysian golf clubs.
Figure 2.1: The Conceptual Framework of the Mediating Role of Organizational
Citizenship Behaviour in the Relationship between Service-Based HRM Practices and
Perceived Service Quality as Moderated by the Nature of Employee Job Orientation
2.4 CONCLUSION
Based on extensive literature review which has been covered in this chapter, there is
evidence to show that HRM is strongly related to performance. The concern of this
study however is to search for the kind of HRM that is more suitable to be practiced in
the context of service, particularly sport and understand the process that links the
service-based HRM to perceived service quality. Such an investigation has never been
conducted by any past studies. Using findings from service climate research as
Service-based HRM
Practices
OCB
Perceived
Service Quality
The nature of employee job
orientation (direct or indirect
contact with customers)

96
guidelines, service-based HRM is conceptualized and considered as the predictor of an
OCB, a work-related behaviour exhibited by employees. This behaviour is believed to
be elicited from employees if they perceive their well-being have been well taken care
of by the management. Several conceptual and empirical work that are related to OCB
have been referred to and it is found that OCB is a behaviour that can be resulted from
service-based HRM and it is also facilitative in the creation of high service quality.
Following from this argument is the development of a model which illustrates the
mediating role of OCB in the relationship between service-based HRM practices and
perceived service quality. This model is expected to match the data collected from the
customer-contact employees only. In the non-customer –contact employee samples, the
model is presumed to have no validity.

97
CHAPTER 3
RESEARCH METHODOLOGY
3.1 INTRODUCTION
Based on the review of literature in the previous chapter, multiple propositions with
corresponding hypotheses have been established. Testing these hypotheses will (or will
not) provide support to those propositions. The aims and objectives of this study will
be accomplished once the hypotheses are examined and discussed. However, the
results of hypotheses testing will only be meaningful if they have been tested and
analysed using the appropriate research methodology. For that purpose, this chapter
presents the employed research methodology which gives detail explanations on how
the study has been carried out. The details include the research design, instrumentation,
sampling technique, data collection process, pilot test and data analysis procedures.
3.2 OVERVIEW OF RESEARCH DESIGN
The discussion in this section is made based on the following classification:

98
Figure 3.1: A Classification of Research Design (Source: Malhotra, 2004)
As illustrated in Figure 3.1 above, the design of any research is generally divided into
exploratory and conclusive. As the name implies, exploratory research is pioneering in
nature. Researchers’ main goal in this type of research is “to become familiar with an
issue, gain more insights, and to help formulate more specific research questions or
hypotheses” (Miller & Swaddling, 2002, p. 92). Conducted in a more informal manner,
the finding of an exploratory research is regarded “as tentative and as input to further
research” (Malhotra, 2004, p. 75). The word “further research” here introduces the
other type of research design. It is called conclusive research. Conclusive research is a
formal and structured way of “collecting primary data, analyzing data, making
recommendations, and implementing findings” (Sandhusen, 2000, p. 188). This
research typically quantifies or verifies the insights obtained from the exploratory
research.
Research Design
Conclusive Exploratory
Descriptive Causal
Cross-sectional Longitudinal
Single Cross-
sectional
Multiple
Cross-sectional

99
An exploratory research depends on qualitative or non-numerical data to obtain
information for the intention of understanding the problems at hand. In contrast to the
exploratory, the conclusive research design uses the existing information which is
normally found in the literature review, tests specific hypotheses and examines certain
relationships among studied variables (Wilson, 1996; Lee, Lindquist, & Acito, 1997;
Creswell, 2002). Clearly, the characteristics of a conclusive research design fit the
design of the current study. The available conceptual work in the academic literature
and several related empirical studies have been referred to and used to prepare this
study especially in the formulation of hypotheses and research methodology.
Furthermore, within the confine of a conclusive research design there are two major
research types namely descriptive and causal. The descriptive research is purported to
describe some characteristics or association of variables within interested phenomena
while the causal research intends to generate evidence of a cause-and-effect
relationship (Zikmund, 2003). According to Wrenn, Loudon, and Stevens (2001)
although the descriptive research is able to explain the associations between the
observed variables, it lacks the capability to explain the causal link between variables
as what the causal research is capable to. The causal research is conducted in a
controlled environment, using an experimentation method. This design involves
manipulating or introducing changes in people or environment that presumably affect
outcomes of interest (Fraenkel & Wallen, 2000). Since the present research is only
interested to examine relationships that already exist in their natural states, it does not
require external manipulation. With this reason, a descriptive research is more
appropriate to describe the design of the current study.
100
The descriptive research is further classified into the cross-sectional and longitudinal
design. The longitudinal design features a repetition of study for a certain period of
time, using the same samples of respondents, measuring the same variables.
Attempting to offer “a snapshot of one point in time” (Cooper & Schindler, 2003, p.
148), the cross-sectional is what characterizing the present study. Moreover, if only one
sample is drawn from the target population, the study is categorized as a single cross-
sectional. If the drawn samples are more than one, then it is called multiple cross-
sectional. Employing the former design, the target population of the current study is
represented by one sample of respondents, namely the employees.
3.3 RESEARCH METHOD - SURVEY
Survey, as the most popular data collection tool within the descriptive research, is
usually defined by its structured nature in gathering data from a large sample (Ruane,
2004). As a result to this special quality, survey is relatively an easy method to
administer as well as comparatively very economical and efficient in reaching its target
population (Malhotra, 2004). The pre-coded answers that are prepared beforehand
helps to reduce variability in results and make the process of analyzing and interpreting
the collected data easier. For these reasons and the fact that it is a suitable research
method for a descriptive research design, survey in a form of self-administered
questionnaire therefore, has been chosen to be used in this study.

101
3.4 MEASUREMENT OF CONSTRUCTS
In general, research is a methodological process of obtaining information so as to solve
specific problems. The main purpose of descriptive research is to examine the
relationships among certain variables. At the theoretical level, variables are known as
constructs of which they cannot be observed and the meanings are conceptualized for a
given context depending on the purpose of the research. At the empirical level,
variables are the properties being studied and they are used to test the hypotheses
established at the early stage of research (Cooper & Schindler, 2003).
There are four types of variables investigated in this study. They are independent,
dependent, mediating and moderating variables. Also described as treatments,
independent variables are antecedent entities that are believed to affect other variables
which are termed as dependent variables (Walker, 1999). Meanwhile, mediating
variables are the linking elements that transfer the effects of independent to dependent
variables. If a study has a hypothetical causal sequence of three (or more) variables, the
middle variable is considered a mediator (indirect effect) that represents at least part of
the factors leading to changes in the dependent variables (Tabachnick & Fidell, 2007).
Finally, moderating variables are the qualitative (e.g., level of satisfaction) or
quantitative variables (e.g., gender, race, and employee job types) that are responsible
for the different levels of strength in the relationships among variables (Baron &
Kenny, 1986).
The instruments that are used to measure all the mentioned variables in this study
consist of negative and positive items. This is in accordance with the scale

102
development as recommended by Churchill (1979). The rationale of doing this is to
ensure that “the items pool is kept reasonably balanced” (Oppenheim, 1986, p. 117). It
means that the items ranging from one extreme to another, have an equal proportion of
positive and negative views. The following paragraphs discuss the development of
scale items which have been used to measure the variables observed in the present
study.
In this study, service-based HRM is a concept that reflects the management’s concern
with its employees’ well-being. The practices that represent this concept are support at
work, training, reward system, supervisory assistance and performance appraisals.
Rather than using managers as the raters of service-based HRM variables, this study
employs employees as the evaluators of the concept. According to Bartel (2004),
although this approach has not been commonly opted by most previous studies of
HRM and organizational performance, it has two advantages. First, employees are the
recipients of HR practices. Thus, their information is more relevant and direct as
compared to managers who have the tendencies to provide idealized descriptions of the
environment. Second, the chances of getting distorted results resulting from a person’s
peculiar opinion or interpretation of questions are very slim because an employee
survey gathers many responses from the worksite. This anomaly will be eliminated by
the large number of respondents.

103
3.4.1 SUPPORT AT WORK
Support at work in this study is operationally defined as “organizational and job
attributes that facilitate or inhibit task performances” (Schneider & Bowen, 1993, p.
42). This independent variable is purported to demonstrate employees’ perceptions of
the extent to which golf clubs are concerned with the provision of work environment
that could ease the employee work related problems which in turn enables the creation
of service climate within the clubs.
As listed in Table 3.1 below, support at work is assessed by five items adapted from
several studies. Each of these items requires employees to state their perceptions of the
aspects of overall work conditions (Schneider & Bowen, 1985), policy (Rogg et al.,
2000), safety (Tornow & Wiley, 1990), procedures and adequacy of manpower (Wiley,
1991).
Table 3.1: Support at Work Measurement
No. Items Sources
1. Conditions on the jobs do not permit employees to
reach the work goals*
2. All employees are provided with handbooks.
3. In this club, safety is adequate.
4. The club’s processes and procedures help to promote
employees’ work efficiencies.
5. In this club, employees have enough people to get the
jobs done.
Schneider & Bowen,
1985; Tornow &
Wiley, 1990; Wiley,
1991; Rogg et al.,
2000
* Reverse score

104
3.4.2 TRAINING
Training is conceptualized as the degree to which employees believe that the training
given by the golf clubs is meant to improve the current levels of their work
performances. The training scale is borrowed and modified from the research
conducted by Lytle et al. (1998). In that particular research, training is one of the
subscales consisted in the instrument (SERV*OR) measuring the policies, practices
and procedures that are geared towards organizational service orientation. Based on
literature review and in-depth interviews, SERV*OR has been developed and validated
and finally claimed to be a scale comprising of ten components, two of which are under
the realm of HRM practices (training and reward system). SERV*OR scale is now
widely used in other empirical research related to investigations of the relationship
between employees’ perceptions of organizational service climates and service quality
(e.g., Solnet & Paulsen, 2005; González & Garazo, 2006; Yoon, Choi,., & Park, 2007).
The training scale, adapted from SERV*OR is used to gather information regarding the
content (1 item) and the method of how the training is conducted (2 items). To further
relate the scale to the golf clubs context, two more items are generated for this purpose.
The additional two items are concerned with the sufficiency and the objective of the
training provided by the golf clubs. These items are modified versions of the training
practice indicators which have been used by Johnson (1996) to describe the service-
related HRM practices in his study.

105
Table 3.2: Training Measurement
No. Items Sources
1. Employees receive personal skill training that
enhances their abilities to deliver high quality job
performances.
2. Employees spend much time and effort in simulated
training activities that help them demonstrate higher
levels of performances.
3. During training sessions employees work through
exercises to identify and improve their attitudes
toward customers.
4. Employees receive sufficient training on how to do
their jobs.
5. Through training, the club communicates regularly
about the importance of providing excellent services.
Johnson, 1996; Lytle
et al., 1998
3.4.3 REWARD SYSTEM
The meaning of reward system in this study is; the process of rewarding, as practiced
by the golf clubs, which is perceived as fair and conspicuous by employees. Based on
literature review, it is believed that reward system with such characteristics will
motivate employees to display OCBs in doing their jobs (Dubinsky & Levy, 1989;
McFarlin & Sweeney, 1992; O’Connor & Shewchuck, 1995; Benoy, 1996; Hartline &
Ferrell, 1996). Three questions that are formulated to generate the employees’
perceptions regarding their perceptions of the golf clubs’ rewarding system are drawn
from the study carried out by Tornow and Wiley (1990). In that particular study, the
researchers develop an employee opinion survey of which three of the items measure
the employees’ perceptions of the ways their organizations compensate work
excellences. These three items (“good performance gets rewarded”, “I am satisfied
with the recognition I receive for doing a good job” and “Where I work, promotions go
to the people who really deserve them”) are named as “rewards for performance” in

106
that survey. As an individual construct, it has been found to be significantly associated
with customer satisfaction.
Besides Tornow and Wiley’s study, the invention of reward system variable for this
present study resembles the work of Lytle et al. (1998) again. Two items which are
related to reward system are drawn from Lytle et al.’s SERV*OR scale. These two
items are adopted and adapted to suit the context of the current study. They are
believed to be relevant as they respectively gauge the fair and conspicuous qualities of
reward system, in other aspects that are not specified by Tornow and Wiley’s.
Table 3.3: Reward System Measurement
No. Items Sources
1. In this club, good performance does not necessarily
get rewarded*.
2. Employees are satisfied with the recognition they
receive for doing good jobs.
3. In this club, promotions go to the people who really
deserve them.
4. Management provides excellent incentives and
rewards to every employee at all levels.
5. This club noticeably celebrates excellent service.
Tornow & Wiley,
1990; Lytle et al.,
1998
* Reverse score
3.4.4 SUPERVISORY ASSISTANCE
The construct of supervisory assistance in this study is created to capture employees’
perceptions of their supervisors’ efforts in assisting them to excel in their jobs. It is
assumed that when the supervisory assistance is perceived by employees as beneficial
or positive, the likelihood for the employees to deliver quality job performances will
increase. The items of this scale as shown in Table 3.4 are designed to reveal the
employees’ perceptions of their supervisors’ traits that are considered facilitative in

107
their work performances. The traits are related to being appreciative for employees’
hard work (Schneider & Bowen, 1985), responsive to employees’ work-related needs
(Schneider et al., 1998), supportive of employees’ work efforts (Yoon et al., 2001),
compensative with the rewards that they have (Tornow & Wiley, 1990) and clear in
giving instruction (Wiley, 1991).
Table 3.4: Supervisory Assistance Measurement
No. Items Sources
1. Supervisors recognize employees for doing high-
quality work.
2. Supervisors are responsive to employees’ requests for
help or guidance.
3. Supervisors are supportive of employees’ ideas and
ways of getting things done.
4. Supervisors use the rewards they have to let
employees know when they have done fine jobs.
5. Employees are always unclear of what their
supervisors expect them to do.*
Schneider & Bowen,
1985; Tornow &
Wiley, 1990; Wiley,
1991; Schneider et
al., 1998; Yoon et al.,
2001
* Reverse score
3.4.5 PERFORMANCE APPRAISALS
In assessing the effects of HRM practices on organizational service climate, Rogg et al.
(2001) have developed a 28-item HRM scale. The scale is intended to underscore
employees’ perceptions of the organization’s attempts in fostering a climate for
service. Under the HRM construct, five items are invented to reveal the nature and
process of evaluating the employees’ performances. This particular subscale is believed
to be suitable to be used in the present study. However, out of the five items, one of
them is dropped as it is considered irrelevant to the study context (“percent of fixed
operations employees who had a formal, document performance review last year”).

108
The other four items are retained because they are found to be useful in reflecting an
appraisal process in golf clubs. These items elicit employees’ perceptions on the
linkage between appraisal and compensation system, the formalization of performance
appraisals, its connection to performance objectives and the way standards for
evaluation is communicated (Rogg et al., 2001). Another important aspect that needs
attention is about the contributions of clients in the employees’ performance appraisals.
As discovered by Jackson and Schuler (1992) in their 1992’s research, clients’ input in
the performance appraisals of employees is one of the distinguishing factors that
differentiate the service from manufacturing firms. Hence, in order to determine
whether the golf clubs are exhibiting this characteristic of service firms, another item is
created to obtain this information. Altogether, five items have been prepared to
measure the performance appraisals construct in this study.
Table 3.5: Performance Appraisals Measurement
No. Items Sources
1. The performance appraisal process is linked to
compensation plan
2. The performance appraisal process is not standardized
and documented.*
3. Promotions and pay increases are based on achieving
documented performance objectives.
4. Managers consistently tell employees about the
standards used to evaluate job performances.
5. Client input is important in the performance appraisal.
Jackson & Schuler,
1992; Rogg et al.,
2001
*Reverse score
3.4.6 PERCEIVED SERVICE QUALITY
In service, customers are the ultimate judges of the quality of service products
(Parasuraman et al., 1985; Zeithaml et al., 1990; Galloway & Ho, 1996; Schneider,

109
2004; Anderson, 2005;). “The only criteria that count in evaluating service quality are
defined by customers. Only customers judge quality, all other judgments are essentially
irrelevant” (Zeithaml et al., 1990, p. 16). Building on this widely accepted notion, a
great number of research from various settings have utilized customer perceptions of
service quality as the dependent variable in their studies. The evidence can be extracted
from the health care (Arcelay et al., 1999; Lagrosen, 2000; Papadimitriou &
Karteroliotis, 2000; Lagrosen & Lagrosen, 2007), hotels (Hill et al., 1998; Tat & Chu,
1999; Haynes & Fryer, 2000), restaurants (Bojanic & Rosen, 1994; Lynn, 2001),
airlines (Mat Zaid, 1995; Rhoades & Waguespack Jr, 2004), banking (Bowen et al.,
2000; Allred, 2001; Gelade & Young, 2005), and sport and fitness industries
(Papadimitriou & Karteroliotis, 2000; Chang et al., 2002).
The theories of boundary-spanning and service-profit chain assert that due to the
intangibility nature of service, there is no boundary that separates employees from
customers. This fact leads to the similarity of service quality opinions from both
employees and customers. Hence, “if employees believe that customers receive poor
service, it is likely that they do” (Schneider & Bowen, 1985, p. 425). In short, there is
reason to believe that employees’ opinions are reflective of those of the customers’ and
as such, they can be used to diagnose the state of the organizations’ service quality
performances as perceived by customers. Based on these lines of argument, employees’
evaluations are used to represent customers’ perceptions of service quality in this
present study.

110
The decision to utilize employees as a proxy to customers is in line with the practice
adopted by Tzafrir and Gur (2007). In their study, the researchers have utilized a
modified version of SERVQUAL questionnaire (O’Connor, Trinh, & Shewchuk,
2000), an instrument originally designed to measure customer perceptions of service
quality. They have adjusted that particular instrument so as to measure employee
perceptions of how customer rate service quality. Given to 411 employees, the
collected and analyzed data were used to conclude their investigation on the influence
of HRM practices on customer perceived service quality in the health sector. In
addition to that, Shahani-Denning (2001, p. 293) claims that, “employees are easier to
access than customers and may be a source of rich information that may otherwise get
ignored”. Finally, support for this approach is also gained from the analysis of 80
respondents (employees, n=40, golfers, n=40) who took part in the pilot test of this
study. The results have produced a significant correlation (r=0.425) between employee
perceptions of what customers think of service quality and customers’ own perceptions
of service quality. The detail of the pilot test will be discussed further in the later
sections.
In a significant study conducted by Dabholkar et al. (2000), one of their objectives is to
find out whether service quality is better conceptualized by multiple factors or a single
factor with multiple items. The result of the study indicates that dimensions of service
quality are not defining the concept of service quality. Instead, they function as
antecedents of service quality. The researchers then conclude that service quality is
therefore better measured by its own multiple indicators. Using that finding as a
support, the present study employs a single factor of multi-items instrument to capture

111
the concept of perceived service quality. This approach is consistent with several
previous studies that adopt multi-items measures as opposed to dimensional measures
in assessing the perceived service quality construct (e.g., Spreng & Singh, 1993; Taylor
& Baker, 1994; Dabholkar et al., 1996; Spreng & Mackoy, 1996).
The items for the perceived service quality measurement are borrowed and adapted
from the study carried out by Chang and Chelladurai (2003b). This study is considered
relevant to be used as the main reference for this construct because the services offered
by fitness clubs in which the study takes place, are somewhat similar to the services
provided by golf clubs. As paid members, the customers of both organizations receive
services that are shared with other clients and the nature of services is “frequent,
prolonged, agonistic participation” (p.66). In that particular study, the perceived
service quality dimension has been rigorously developed and its reliability has been
ascertained with a value of α = 0.90. Given these unique features of both fitness and
golf clubs, it deems justifiable to adopt the perceived service quality scale from Chang
and Chelladurai’s work and modify it to suit the context of this study. In short, the
perceived service quality construct in this study measures the employees’ perceptions
of the customers’ overall impressions of the golf clubs’ service quality.

112
Table 3.6: Perceived Service Quality Measurement
No. Items Sources
1. Employees are certain that customers do not receive
the service they expect.*
2. Employees are confident that the club’s service
outcomes meet the customers’ expectations.
3. Employees believe that the club provides reliable
service to customers.
4. Employees agree that the quality of service provided
by the club is outstanding.
Chang & Chelladurai,
2003(b)
* Reverse score
A mediating variable is the element postulated to be a determinant of one or more
dependent variables, and concurrently functioning as the consequence of one or more
independent variables. In essence, a mediating variable explains the extent to which the
variable “accounts for the relation between the predictor and the criterion” (Baron &
Kenny, 1986, p. 1176). In the case of the relationship between service-based HRM
practices and perceived service quality, the review of relevant literature has revealed
that OCB can be the mediating factor that links the two variables.
This study employs self-report measures for the OCB construct. Although most
previous studies use manager-ratings of OCBs (e.g., MacKenzie, Podsakoff, & Fetter,
1993; Organ & Ryan, 1995; Sun et al., 2007), employee self-report measures can also
be utilized as they have been found to be consistent with manager evaluations
(Churchill et al., 1985; Dubinsky et al., 1986; Oliver & Anderson, 1994; Netemeyer et
al., 1997). While some previous research treat each OCB dimension as a separate
behavior or variable (e.g., Van Dyne, 1998; Podsakoff et al., 1990; LePine & Van
Dyne, 2001), some others model the OCB dimensions as composite indicators of a
global (second-order) construct (e.g., Konovsky & Pugh, 1994; Netemeyer et al., 1997;

113
MacKenzie et al., 1998; Koys, 2001; LePine et al., 2002; Sun et al., 2007). Following
the latter approach, the present study treats OCB as a second-order (latent) construct.
This decision is in line with the finding of LePine et al.’s (2002) study which confirms
the superiority of a second-order to the first order OCB construct. After all, as stated by
the founder of this concept (Organ, 1988), OCB “in aggregate promotes the effective
functioning of the organization” (p. 4).
Previous research also show that there is no universal agreement in terms of the
dimensions that are used to measure OCB (Law, Wong, & Mobley, 1998; LePine et al.,
2002; Piercy et al., 2006). The difficulty in searching for appropriate measures to
define OCB in the present research is amplified by the unavailability of the previous
work that examines OCB in a golf clubs setting. Due to this problem, the approach
taken by Tsui et al. (1997) in developing an OCB scale has been used as a guideline to
conceptualize OCB. Accordingly, a number of related studies have been critically
analysed and finally, four domains of OCB which include altruism, loyalty,
teambuilding and conscientiousness are selected and considered as sufficient in
capturing the concept of OCB in this study. The following paragraph justifies for the
exclusion of three other OCB domains (courtesy, sportsmanship and civic virtue) in the
developed scale.
In the seminal study of Podsakoff et al. (1990), it is revealed that altruism is highly
correlated with courtesy (r=0.86). This implies that altruism and courtesy are not
distinctly different from each other. In other words, utilizing one of the dimensions is
already sufficient to describe both of them. Meanwhile, based on the review of

114
previous literature, LePine and his associates (2002) notice that some of the
behavioural elements of OCB overlap with each other. The example given is the
overlap among loyalty, sportsmanship and civic virtue. This in other words means that
the employment of only one of those dimensions is representative of the rest of other
elements. All in all, although they are not included as parts of the OCB measures,
through altruism and loyalty, the elements of courtesy, sportsmanship and civic virtue
still exist in the OCB scale of this study. The items assessing OCB are pooled from
various sources, including Smith et al. (1983), Podsakoff et al. (1990), Bettencourt et
al. (2001), Yoon & Suh (2003), González and Garazo (2006), and Piercy et al. (2006).
3.4.7 ALTRUISM
Altruism refers to the act of helping coworkers or customers at the workplace
regardless of whether it is within or outside the job descriptions (Organ, 1988;
Podsakoff et al., 1990). To gauge this altruistic behavior, the respondents are asked
about the extent to which they are willing to give up their time in order to help others
who are in various difficult conditions such as those who are absent, with heavy
workloads or with work-related problems. For the purpose of this study, the altruism
items are developed based on the modification of indicators introduced by Podsakoff et
al. (1990).
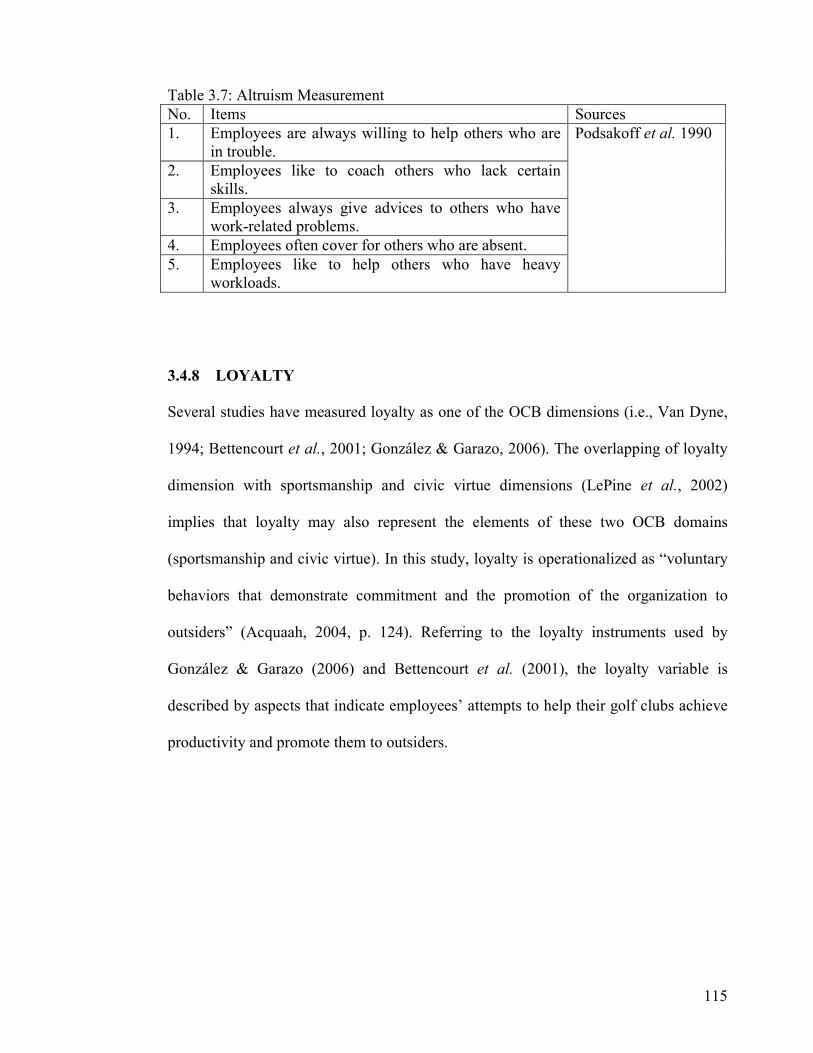
115
Table 3.7: Altruism Measurement
No. Items Sources
1. Employees are always willing to help others who are
in trouble.
2. Employees like to coach others who lack certain
skills.
3. Employees always give advices to others who have
work-related problems.
4. Employees often cover for others who are absent.
5. Employees like to help others who have heavy
workloads.
Podsakoff et al. 1990
3.4.8 LOYALTY
Several studies have measured loyalty as one of the OCB dimensions (i.e., Van Dyne,
1994; Bettencourt et al., 2001; González & Garazo, 2006). The overlapping of loyalty
dimension with sportsmanship and civic virtue dimensions (LePine et al., 2002)
implies that loyalty may also represent the elements of these two OCB domains
(sportsmanship and civic virtue). In this study, loyalty is operationalized as “voluntary
behaviors that demonstrate commitment and the promotion of the organization to
outsiders” (Acquaah, 2004, p. 124). Referring to the loyalty instruments used by
González & Garazo (2006) and Bettencourt et al. (2001), the loyalty variable is
described by aspects that indicate employees’ attempts to help their golf clubs achieve
productivity and promote them to outsiders.

116
Table 3.8: Loyalty Measurement
No. Items Source
1. Employees often tell outsiders how much they like
working here.
2. Employees are not willing to work extra hours.*
3. Employees like to take the club’s logo everywhere
they go.
4. Employees encourage friends and families to use the
club’s services.
5. Employees like to tell the club’s positive attributes to
outsiders.
Bettencourt et al.,
2001; González &
Garazo, 2006
*Reverse score
3.4.9 TEAMBUILDING
Teambuilding is first introduced as a part of the OCB construct in a study conducted by
Piercy et al. (2006). This new dimension is added because the researchers believe that
a behavior that is supportive of team effectiveness is also instrumental in the overall
performance of the organization. Most importantly, this sort of behavior is also a form
of discretionary behaviors which is not prescribed in formal job descriptions. Since
team-based performance is increasingly important in many business operations
(Corcoran, Petersen, Baitch, & Barret,1995; Hurley, 1998; Landy & Conte, 2006)
including in sport organizations (Ross, 2008; Schnytzer & Weinberg, 2008), this study
therefore views teambuilding as a critical component of OCB. As such, in this study,
the teambuilding scale is adopted to assess the degree to which employees of golf clubs
exhibit efforts aimed at encouraging and supporting each other as well as avoiding
conflicts for the benefits of the group.

117
Table 3.9: Teambuilding Measurement
No. Items Source
1. Employees avoid from helping others in solving
conflicts that occur among them.*
2. Employees encourage others to do well in their jobs.
3. Employees cheer up others who are in distress.
4. Employees consult with others before taking actions
that might affect them.
5. Employees often act as “peacemakers” when others
have disagreements.
Piercy et al., 2006
*Reverse score
3.4.10 CONSCIENTIOUSNESS
Similar to the description of “generalized compliance”, conscientiousness is a type of
discretionary behaviors that is reflected by employees’ willingness to comply with the
organization’s unwritten norms, rules, regulations and any procedures governing their
work performances (LePine et al., 2002). Employees of high conscientiousness
typically do what they “ought” to do even when no one is watching them (Chang &
Chelladurai, 2003a). In order to measure this behavior, respondents are solicited to
state the extent to which they adhere to the norm that characterizes them as “good
employees” (Smith et al., 1983; Podsakoff et al., 1990).
Table 3.10: Conscientiousness Measurement
No. Items Source
1. Employees are often absent from work.*
2. Employees are always punctual in coming to work.
3. Employees do not take unnecessary time off work
4. Employees do not spend time in idle conversations.
5. Employees conscientiously follow rules and
procedures.
Smith et al., 1983;
Podsakoff et al., 1990
*Reverse score

118
3.4.11 MODERATING VARIABLE
When a relationship between variables is changed due to the change level of an
additional variable, a moderating or contingency effect is said to exist in that
relationship. The additional variable that causes the change effect is called a
moderating variable (Cooper & Schindler, 2003; Hayes, 2005). A moderating variable
can be metric or non-metric (Hair, Black, Babin, Anderson, & Tatham, 2006). In this
study, a non-metric categorical variable which is known as the nature of employee job
orientation (direct or indirect interactions with customers) is hypothesized to influence
the model that proposes the mediating effect of OCB in the relationship between
service-based HRM practices and perceived service quality. The data for this
moderating variable are gathered from the respondents’ responses to the question that
inquires the nature of their job orientations (“Which group of service your job is related
to?”).
3.5 QUESTIONNAIRE
The data of this study are collected by using a survey method in a form of mailed
questionnaires. The questionnaire is designed as a double-sided seven-page booklet
(Appendix B). The front page of the questionnaire is a covering letter, coded with the
name of a golf club written at the top right hand side. The cover letter provides brief
information of the research project, requesting participation from the respondent,
explaining how and when to return the completed questionnaire and assuring the
respondent’s anonymity in any future publication related to this project. The code is
used for a purpose of identifying the number of responses that are received from the

119
respective golf clubs. Those clubs that return less than three questionnaires are
contacted again and requested to improve the rate of their responses.
There are three sections contained in the questionnaire. The first section requires
respondents to circle the given statements which closely describe their demographic
backgrounds. The second section consists of items intended to reveal the respondents’
perceptions regarding service-based HRM, their levels of OCBs and their perceptions
of customers’ perceived service quality. In order to prevent the respondents from being
aware of the measured constructs, the questions are not arranged in their own
respective variables but in a random manner.
Using a six-point Likert scale (e.g., Howat et al., 1990; Murray & Howat, 2002; Taylor
& Ho, 2005), respondents are asked to indicate the extent to which they agree with the
stated statements, from “1” if they strongly disagree to “6” if they strongly agree. The
reason for choosing an even number of Likert scale (six points) is to reduce the
likelihood of respondents to give a mid-point or median value which represents their
unwillingness to side in any position (agree or disagree). The mid-point value can be
perceived as an indication of a neutral response and respondents are likely to select this
value for purpose of quick completion of the task (Krosnick, 1991). “The indicated
response [mid-point value] may therefore not truly reflect the respondents’ actual
expectations or perceptions” (Coulthard, 2004, p. 488).
Another reason for discarding the mid-point value is related to cultural issues. Relevant
studies from cultural literature have shown that Asian people in general are relatively

120
modest in giving their opinions (Kim & Jin, 2001; Laroche, Ueltschy, Abe, Cleveland,
& Yannopoulos, 2004). To ensure harmonious relationships, the Asians tend to avoid
giving scores that are extreme at the either side of a rating continuum. The mid-point
value tends to be the most suitable response for typical Asians. Hence, by eliminating
the mid-point score, the Asian respondents in this present study are somewhat
discouraged from being neutral in their responses. Instead, they are “forced” to state
either to disagree (between 1 and 3) or agree (between 4 and 6) with each statement
written in the survey. The final section comprises of a blank space where respondents
are requested to provide voluntary comments or inputs pertaining to anything related to
the research project.
In the scale development process, the items have been modified from the previously
established scales using the language of which they have been originally developed
from. Considering the varying levels of English proficiency among Malaysian
individuals in general, it is deemed necessary then to have the modified items
translated into the first or national language of this country, that is Bahasa Malaysia.
Due to several factors such as issues related to culture and translator’s competency, a
simple translation process may distort the meaning of the original language (Zikmund,
2003; Wang, Lee, & Fetzer, 2006). In order to ensure the equivalence of meaning
between the original and translated measures, a back-translation method, introduced by
Brislin (1970) is adopted.
Widely used for maintaining the original meaning in the translated version (Behling &
Law, 2000), the back-translation method requires the translated scale to be translated

121
back into the original language. The original and the back-translated versions are then
compared for identification of inconsistencies (Brislin, Lonner, & Thorndike, 1973;
Cha, Kim, & Erlen, 2007). It is recommended that the back-translation process is
carried out by a person “whose native tongue is the language that will be used in the
questionnaire” (Zikmund, 2003, p. 361). In this case, the questionnaire has been sent to
a Malay linguistic lecturer to be back-translated into the English version. Both the
original and the back-translated scales are then compared by another language expert.
The results of comparison are then discussed with the advisors of this study and where
necessary, some of the items in the translated scale have been modified accordingly.
3.6 SAMPLING
Sampling refers to the information regarding the characteristics of the population under
study (Malhotra, 2004). The following sections discuss the study’s samples, sample
size and sampling unit.
3.6.1 SAMPLES
The samples of this study are made of non-executive employees. Non-executive
employees are selected here because in a service setting, the work results of the low-
level employees most often than not, are more transparent than customers (Bowen &
Ford, 2002). For purpose of testing hypothesis 12, (whether the proposed model in this
study is moderated by the nature of the respondents’ job orientation), the samples are
later divided into two. One sample comprises of non-customer-contact employees
(n=160) and the other is customer-contact employees (n=160).

122
3.6.2 SAMPLE SIZE
It has been acknowledged by many researchers that the size of samples is important as
it affects the magnitude of difference in covariance matrices (e.g., Hoyle, 1995; Kline,
1998; Loehlin, 2004). Samples which are below the appropriate number will be of
little scientific value because the findings cannot be generalized as representative to
the existing population (Bartlett, Kotrlik, & Higgins, 2001; Pallant, 2005). An analysis
using structural equation modeling (SEM) technique generally expects a sample size
that ranges from 150 to 200. However, a large sample size (e.g., 400 – 500), is more
preferable as the larger the sample is, the easier the model to converge properly or
achieve accurate solution (Anderson & Gerbing, 1988).
Based on the review of relevant literature, Schumacker and Lomax (2004) have
concluded that the general guideline for adequate sample size which is agreeable to
many researchers is anything larger than 150. One rule of thumb is to allow as few as
five respondents for each parameter estimate if other multivariate assumptions are met
(Bentler & Chou, 1987). In this study, the total number of parameter estimates (items)
is 49 and in order to follow Bentler and Chou’s standard, the minimum sample size
should be 245 (49 x 5). With 325 usable responses, the sample of the present study is
clearly above the threshold size. As said by Bartlett et al. (2001, p. 50), “Using an
adequate sample along with high quality data collection efforts will result in more
reliable, valid, and generalizable results”.

123
3.6.3 SAMPLING UNIT
The sampling unit is where the samples are gathered from (Malhotra, 2004). In this
study, the samples of non-executive employees are drawn from golf clubs located in
Malaysia. Currently, there are 204 golf clubs in the country. To limit the scope, only
privately-owned golf clubs with 18-hole courses are selected to be included in the
study. A club directory list that is obtained from the Malaysian Golf Association
(MGA) indicates that there are 84 golf clubs around Malaysia which have such
characteristics (privately-owned with 18-hole golf course). After contacting the
management of those 84 golf clubs through official letters, telephones and facsimiles,
68 of them have agreed to participate in this study.
3.7 DATA COLLECTION PROCESS
Ideally speaking, the selection of samples should be made based on a complete listing
of all employees in all participating golf clubs. However, since disclosing employee
profiles to the public is against any company policy, requesting for the addresses of
employees for selection of samples and direct mailing purposes is certainly impossible.
After several discussions with relevant golf club managers, the only method that is
agreeable to them is; by mailing 10 questionnaires to each golf club management.
The distribution of questionnaire begin by mailing a package containing 10
questionnaires to the management of every participating golf clubs (n=68). Each
questionnaire is attached with a self-addressed stamped return envelope and a key-
chain as a token of appreciation for the respondent’s participation in the study. The

124
management then distributes the questionnaires to their non-executive employees. The
management is also reminded to give five questionnaires to employees whose jobs are
related to direct interactions with customers and another five copies to employees
whose jobs do not involve customers. Those recipients of questionnaires are expected
to return the completed questionnaire using the given self-addressed stamped return
envelope. Nevertheless, they can also submit the completed questionnaires to the
management since some of the club managements offer to collect those completed
questionnaires from all participating employees and return them together in one big
envelope. All in all, a total of 680 questionnaires (10 questionnaires x 68 golf clubs)
have been mailed to 68 identified golf clubs.
Reminder phone-calls have been made one week after the mailing. Finally, several
follow-up phone-calls have been made again to those clubs of which only few (less
than 3) of their employees return the questionnaires.
3.8 CONTENT VALIDITY
Face or content validity is “a subjective but systematic evaluation of how well the
content of a scale represents the measurement task at hand” (Malhotra, 2004, p. 269).
In this case, it is to verify that the instruments are appropriate to be used for employees
of golf clubs. Content validity can be determined by having a panel of experts
examining whether the items sufficiently describe the constructs being measured in the
context being studied. For this research, eight individuals who are familiar with HRM
and golf club management have been selected to evaluate the instruments. Three
individuals are pure HRM scholars, two are sport management lecturers who are also

125
avid golfers and the other three are staff of three golf clubs. The comments and
suggestions that have been given by those individuals are thoroughly discussed with
the advisors of this study and where necessary, changes have been made to the original
questionnaire.
3.9 PILOT TEST
None of the previous research, whose scales are adapted from in this study, is
conducted in a golf club setting. Hence, although the scales might have been found to
have high instrument reliability in their respective research work, the modifications and
integrations of the scales’ items with items from other research’ scales might cause the
new developed scales unreliable in this present context. In order to ensure that the
measurements developed for this particular study possess the level of reliability which
is generally accepted in the literature, a pilot study has been carried out for this
purpose.
A total of one hundred questionnaires have been personally handed over to personnel
executives of five golf clubs located at the Klang Valley. Through the attached cover
letter, respondents have been requested to complete the questionnaires and return them
to the executives in-charge within two weeks. A week after the submission of the
questionnaires, the executives in-charge have been reminded by phone-calls of the
forthcoming questionnaire collection. For a response rate of 60%, a total of 60
completed questionnaires have been personally retrieved.

126
Aiming at reducing random error in measurement, reliability testing identifies the
extent to which a measurement is internally consistent in measuring whatever it is
supposed to measure (Ary et al., 1996; Fraenkel & Wallen, 2000). The internal
consistency of a measurement can be ascertained by examining the Cronbach’s alpha
value, produced from a reliability analysis output.
The results of pilot study are displayed in Table 3.11 below. According to Nunnally
(1978), Cronbach’s alpha is a superior estimate of a measure’s internal consistency. A
value that ranges from 0.5 to 0.6 is considered sufficient in the early stages of research.
As shown in Table 3.11, the lowest value of Cronbach’s alpha is 0.671 (Teambuilding)
while the highest is 0.874 (Loyalty). None of the instrument subscales indicates any
value that is below the Nunnally’s minimum level. Overall, the pilot test has confirmed
that all instruments that are going to be used in this study have achieved an adequate
level of reliability.
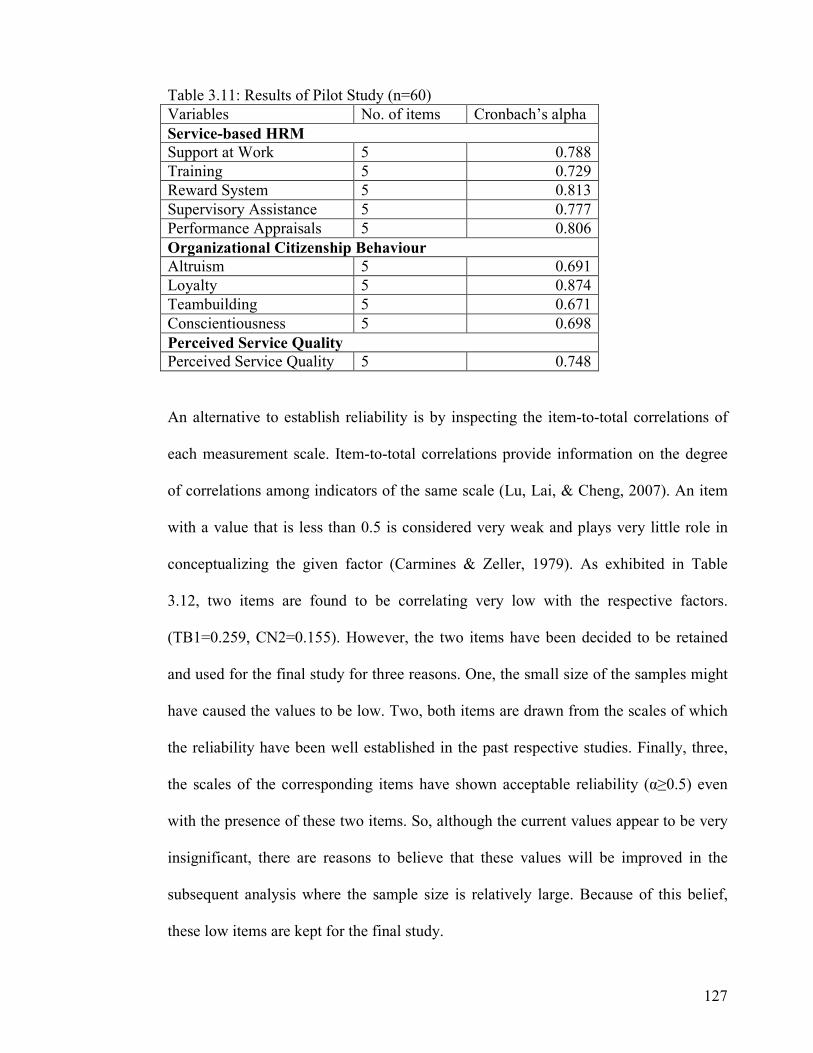
127
Table 3.11: Results of Pilot Study (n=60)
Variables No. of items Cronbach’s alpha
Service-based HRM
Support at Work 5 0.788
Training 5 0.729
Reward System 5 0.813
Supervisory Assistance 5 0.777
Performance Appraisals 5 0.806
Organizational Citizenship Behaviour
Altruism 5 0.691
Loyalty 5 0.874
Teambuilding 5 0.671
Conscientiousness 5 0.698
Perceived Service Quality
Perceived Service Quality 5 0.748
An alternative to establish reliability is by inspecting the item-to-total correlations of
each measurement scale. Item-to-total correlations provide information on the degree
of correlations among indicators of the same scale (Lu, Lai, & Cheng, 2007). An item
with a value that is less than 0.5 is considered very weak and plays very little role in
conceptualizing the given factor (Carmines & Zeller, 1979). As exhibited in Table
3.12, two items are found to be correlating very low with the respective factors.
(TB1=0.259, CN2=0.155). However, the two items have been decided to be retained
and used for the final study for three reasons. One, the small size of the samples might
have caused the values to be low. Two, both items are drawn from the scales of which
the reliability have been well established in the past respective studies. Finally, three,
the scales of the corresponding items have shown acceptable reliability (α≥0.5) even
with the presence of these two items. So, although the current values appear to be very
insignificant, there are reasons to believe that these values will be improved in the
subsequent analysis where the sample size is relatively large. Because of this belief,
these low items are kept for the final study.

128
Table 3.12: Item-to-total Correlations
Support at
Work
Training
Reward
System
Supervisory
Assistance
Performance
Appraisals
SW1 0.717
SW2 0.584
SW3 0.560
SW4 0.529
SW5 0.453
TR1 0.681
TR2 0.451
TR3 0.422
TR4 0.512
TR5 0.417
RS1 0.691
RS2 0.658
RS3 0.614
RS4 0.543
RS5 0.513
SA1 0.709
SA2 0.555
SA3 0.556
SA4 0.524
SA5 0.437
PA1 0.714
PA2 0.647
PA3 0.596
PA4 0.557
PA5 0.472
Altruism Loyalty Teambuilding Conscien-
tiousness
Perceived
Service
Quality
AL1 0.527
AL2 0.433
AL3 0.463
AL4 0.399
AL5 0.414
LO1 0.822
LO2 0.781
LO3 0.740
LO4 0.735
LO5 0.467
TB1 0.259
TB2 0.643
TB3 0.615
TB4 0.445
TB5 0.318
CN1 0.617
CN2 0.155
CN3 0.671
CN4 0.464
CN5 0.337
PSQ1 0.600
PSQ2 0.608
PSQ3 0.602
PSQ4 0.394
For purpose of correlating employees’ perceptions of service quality to those of
customers’, further analysis on the perceived service quality scale has been performed.
The results have demonstrated that an eigenvalue greater than one has generated one
factor with a total variance of 58% and with a significant Bartlett’s test of sphericity,
the KMO is 0.713. All these values provide evidence on the existence of the
instrument’s construct validity. This evidence allows for the use of these data for
correlation analysis.
In addition to the one hundred questionnaires that have been personally handed over to
the management of five golf clubs, fifty other questionnaires have also been passed up
at the same time. These questionnaires however, are to be completed by the clubs’
members who frequent the clubs to play golf at least once a week. In these
questionnaires, the golfers’ perceptions of the clubs’ service quality are solicited. For a
response rate of 80%, 40 completed questionnaires have been retrieved. The reliability

129
and validity of the instrument for this sample have been established by a Cronbach’s
alpha value of 0.769, total variance of 69% (eigenvalue greater than 1 yielded one
factor), KMO value of 0.719 and the Bartlett’s test of sphericity is less than 0.001. In
short, the results prove that this scale when utilized on customer samples, generate
excellent construct reliability and validity. Thus, the data are valid and reliable to be
correlated with the data collected from the employee sample.
For the correlation test purposes, the sizes of the analyzed samples have to be equal.
Hence, 40 cases have been randomly selected from the portion of the employee sample
to match the 40 subjects in the golfer sample. The employees’ responses on the
perceived service quality dimension are then correlated with the golfers’. Similar to the
studies (e.g., Johnson 1996; Yoon et al., 2001; Scotti et al., 2007) that have correlated
the perceptions of service quality between these two samples (employees and
customers), a significant and positive correlation is also displayed here. As shown in
table Table 3.13 below, the correlation between employee and customer perceptions of
service quality is significant with a Pearson Correlation value of 0.425.
Table 3.13: Correlation between Employee and Customer Perceived Service Quality
Total Customers Total Staffs
Total Customers
Pearson Correlation
Sig. (2-tailed)
N
1
40
0.425(**)
0.006
40
Total Staffs
Pearson Correlation
Sig. (2-tailed)
N
0.425(**)
0.006
40
1
40
** Correlation is significant at the 0.01 level (2-tailed).

130
3.10 DATA ANALYSIS PROCEDURES
As discussed earlier, the main objective of this study is to investigate the relationships
among service-based HRM practices, OCB, perceived service quality and the nature of
employee job orientation (direct or indirect interaction with customers). To achieve
that objective, a relevant model has been developed and proposed. The results of
investigation will be generated by several statistical tests, using Statistical Package for
Social Sciences 15 (SPSS 15) and AMOS 7 software. The following are discussions of
the procedures for analyzing the data.
.
3.10.1 SCALES PURIFICATION
Twelve hypotheses (H1 – H12) have been formulated in response to the propositions
stated in this study. Before testing the hypotheses, the utilized instruments will have to
undergo a scale purification process which involves examinations of Cronbach’s alpha
and item-to-total correlations (Churchill, 1979). Item-to-total correlations refer to the
correlations of indicators with their own respective factors (Lu et al., 2007), while
Cronbach’s alpha is a measure that gauges the extent to which an internal consistency
exists among the indicators within the same factor (Malhotra, 2004). Churchill’s (1979)
method of such a scale purification process is found to be a common practice in many
empirical studies (e.g., Koufteros, 1999; Koufteros, Vonderembse, & Doll, 2001;
Chang and Chelladurai, 2003(b), Bauer, Sauer, & Schmitt, 2005; Lu et al., 2007).
In addition to the assessment of the Cronbach’s alpha and item-to-total correlations, Lu
et al. (2007) also suggest the purification of scales to be conducted based on an
evaluation of exploratory factor analysis (EFA) results. EFA is a type of factor analysis

131
that is used to identify the number of latent variables that underlies a complete set of
items (Coakes & Steed, 2003). This analytic approach is considered exploratory
because the links between the indicators and factors are unknown or uncertain. Since in
this study, most of the items have been developed and integrated from a combination of
previous research, it is imperative to ensure that they are correctly connected to their
underlying factors. To accomplish that, the use of EFA in this study is therefore
deemed necessary.
However, prior to the analysis of EFA, the value of Kaiser-Meyer Olkin (KMO) has to
be referred to. KMO is a measure of sampling adequacy that tests the appropriateness
of using EFA. A value close to 1 implies the presence of significant correlations among
items and this enables the EFA to produce distinct and valid factors (Field, 2000).
According to Kaiser (1970), a value below 0.5 is unacceptable and thus, EFA should
not be performed. A value between 0.5 and 0.7 is considered mediocre, 0.7 and 0.8 is
good, 0.8 and 0.9 is great and above 0.9 is superb. Another inspection is on the
Bartlett’s test of sphericity value. This measure reports the result of the null hypothesis
which states the original correlation matrix is an identity matrix (Field, 2000; George
& Mallery, 2003). A significant value of Bartlett’s test of sphericity indicates further
support to the appropriateness of using EFA in the study.
There are two types of rotations in the analysis of EFA. One is orthogonal using
Varimax method and the other is oblique rotation using direct oblimin method. The
first rotation mode assumes that factors are uncorrelated and independent of each other
when rotated. The second one allows factors to be correlated with each other

132
(Zikmund, 2003). Varimax orthogonal rotation is chosen to be used in this study
because as compared to the oblique method, this form of rotation is more robust and it
is able to simplify factor loadings which in turn enable easy interpretation (Churchill &
Iacobucci, 2002).
Factor loadings are another important values to be assessed when performing EFA.
They represent the strength of relationships between indicators and the latent variables
or factors. A coefficient of greater than 0.5 demonstrates an acceptable loading (Hair et
al., 2006), and therefore is used as the cut-off point in this study. Another relevant
analysis is regarding the eigenvalue that reflects the amount of total variance explained
by the emerging factors. Common research practices usually accept and interpret
factors with eigenvalue larger than 1 (De Vaus, 2002; Pallant, 2005). Finally, based on
the EFA results, convergent validity can be established when all items load strongly on
one factor and discriminant validity can be verified when the item loadings load
weakly on all other factors (Zikmund, 2003; Brown, 2006).
3.10.2 MULTIVARIATE ASSUMPTIONS
For multivariate assumptions purposes, the existence of normality, outliers, linearity,
homoscedasticity, and multicollinearity are assessed in the data.

133
3.10.2a NORMALITY, OUTLIERS, LINEARITY AND
HOMOSCEDASTICITY
Normality is used to describe a curve that is symmetrical and bell-shaped. The highest
score frequency is depicted in the middle with lower frequencies towards the extremes
(Gravetter & Wallnau, 2000). Normality can be determined by assessing the variables’
levels of skewness and kurtosis. According to Miles and Shevlin (2001, p. 74), “if the
value of skew or kurtosis (ignoring any minus sign) is greater than twice the standard
error, then the distribution significantly differs from a normal distribution”. However,
these authors also caution that the skewness and kurtosis values greatly depend on the
sample size. “the larger your sample size, the less departures from normality matter”
(p. 74).
Outliers are cases that have out-of-range values as compared to the majority of other
cases. The presence of outliers in the data may distort statistical test results (Hair et al.,
2006). Outliers can be detected from the residual scatterplot. According to Tabachnick
and Fidell (2007), cases that have a standardized residual of more than 3.3 or less than
-3.3 as displayed in the scatterplot are considered as outliers. However, a few outliers
in large samples are common and most of the time, taking any action is not necessary.
Another important assumption is that the relationship between independent and
dependent variables is linear and should exhibit homoscedasticity. The violation of
these assumptions will underestimate the extent of the correlation between the
variables and this will result a degradation of analysis (De Vaus, 2002). Linearity is
assumed when a straight-line relationship is presence between the two variables

134
(independent and dependent variables) (Hair et al., 2006). The fulfillment of this
assumption leads to the existence of homoscedasticity, a desirable condition where
“dependent variables exhibit equal levels of variance across the range of predictor
variables” (Stamatis, 2001, p. 140). The examination of these assumptions can be
performed by conducting partial regression plots and regression standardized residuals
(Pallant, 2005).
3.10.2b MULTICOLLINEARITY
Multicollinearity means there is high intercorrelations among the independent
variables. In investigating relationships between independent and dependent variables,
the presence of multicollinearity can cause several problems including inaccurate
results of regression coefficient estimation (Tabachnick and Fidell, 2007). One of the
ways to check for the presence of multicollinearity in the data is by assessing the
tolerance and the variable inflation factor (Pallant, 2005). Tolerance is a value that
measures the degree of the independent variable’s variability that is not explained by
the other independent in the model and it is computed by using the formula 1-R2 for
each variable. Variance inflation factor (VIF) is the inverse of Tolerance and is
calculated simply by inverting the tolerance value (1 divided by Tolerance). An
indication of multicollinearity is when the value of Tolerance is less than 0.10 and VIF
is more than 10 (Belsley, Kuh, & Wiklund, 1980).
3.10.3 CONFIRMATORY FACTOR ANALYSIS
In this study, a confirmatory factor analysis (CFA) is used to validate the proposed
measurement model. CFA is a technique where it analyses the extent to which the

135
specification of the assigned factors matches the data collected in the study (Segar &
Grover, 1993; Chau, 1997; Brown, 2006). Unlike EFA of which the factors are
computed from statistical results, the existence of factors in CFA is justified by the set
of measured variables specified by a measurement theory. In that sense, the
measurement theory plays a crucial role in CFA because without a strong support from
it, the proposed model will not likely be in consistent with reality (Hair et al., 2006).
CFA assesses the measurement model by examining the constructs’ unidimensionality,
reliability and validity (Garver & Mentzer, 1999; Brown 2006). The existence of
unidimensionality can be established by evaluating the goodness-of-fit (GOF) of the
proposed model (Bagozzi & Baumgartner, 1994; Garver & Mentzer, 1999), and each
of the variable’s direction of path and significant level (Garver & Mentzer, 1999). The
goodness-of-fit (GOF) measures describe how well the proposed model
“approximates” the collected data (Narsky, 2003). A model with good fit provides a
valid platform for researchers to subsequently analyze the hypothesized relationships
among constructs.
The model of this study is evaluated using multiple fit criteria namely the chi-square
statistics (χ2), degree of freedom (df), p-value of the chi-square statistic (Satorra &
Bentler, 1988), relative chi-square (χ2/df; Carmines & McIver, 1981), comparative fit
index (CFI; Bentler, 1990), the root mean square error of approximation (RMSEA;
Saenz, Marcoulides, Junn, & Young, 1999), and the standardized root mean square
residual (SRMR; Kline 1998; Hair et al., 2006;). The choice of those indices satisfy the
requirement prescribed by Hair et al., (2006) who state that,

136
“A researcher need not report all of these indices [all available fit
indices] because of the redundancy among them. However, the
researcher should report at least one incremental index and one absolute
index, in addition to the χ2 value and the associated degrees of freedom.
At least one of the indices should be a badness-of-fit index [e.g.,
SRMR]. A model reporting the χ2 value and degrees of freedom, the
CFI, and the RMSEA will often provide sufficient unique information to
evaluate a model.” (p.748).
Construct reliability is best understood as “…the degree to which measures are free
from error and therefore yield consistent results” (Peter, 1979, p. 6). Otherwise stated,
it seeks to confirm that the scales are measuring the concepts of study (Hair et al.,
2006). This quality can be determined by assessing the item reliability (squared
multiple correlation), composite reliability and average variance extracted. Given that
the survey instruments have been appropriately developed through a comprehensive
review of related literature and then have been refined based on the suggestions from
relevant experts, both the face and content validity of the instruments of this study
therefore have been confidently established (Bohrnstedt, 1983; Kaplan & Sacuzzo,
1993; Abdullah, 2005). Through CFA, evidence of construct validity can be obtained,
that is by examining the extent to which items of the same latent variable are
measuring the same construct (convergent validity) and at the same time, they do not
measure constructs other than their own (discriminant validity) (Garver and Mentzer,
1999).
3.10.4 STRUCTURAL EQUATION MODELING
This study employs a structural equation modeling (SEM) as the statistical technique
to analyze the hypothesized relationships. All other multivariate techniques are either
from a family of dependence or independence statistical techniques. Only SEM has the

137
characteristics of both groups because the foundations of SEM are derived from
multiple regression analysis (dependence technique) and factor analysis (independence
technique) (Hair et al., 2006).
What makes SEM a more powerful and popular than other multivariate techniques
(Shah & Goldstein, 2006) is that, besides having an attractive graphical modeling
interface that makes model interpretation an easy task (Kumar, Smart, Maddern, &
Maull, 2008), SEM can examine a chain of dependence relationship concurrently. As
asserted by Hair et al. (2006, p. 706), “None of the previous techniques [except SEM]
enable us to assess both measurement properties and test the key theoretical
relationships in one technique”. SEM reveals the structure of interrelationships among
the studied variables by using a series of equations similar to multiple regression
technique and by modeling interactions, nonlinearities, correlated independents,
measurement errors, correlated error terms, and multiple latent
independents/dependents, all at the same time (Kumar et al., 2008).
SEM can be performed by adopting the one-step approach or two-step approach. In the
one-step approach, the estimation of both the measurement and structural relationships
of an SEM model is carried out simultaneously in a single analysis. On the other hand,
the two-step approach separates the estimation in two different analyses. The two-step
approach is more preferable among researchers because this approach overcomes the
problems particularly related to interpretational confounding (Burt, 1976) and
misspecification (Lance, Bollen, Kirby, Curran, Paxton, & Chen, 2007) which are quite
inherent in the one-step approach (Gallagher, Ting, & Palmer, 2008).

138
Based on Anderson and Gerbing’s (1988) two-step approach, Byrne (2001) outlines
two important procedures in the application of SEM. The first one concerns with the
series of structural equation that represent the causal processes observed in the study.
The second part is the depiction of these structural links in a pictorial path model. In
this graphical picture, the hypothesized relationships proposed in the model can then be
statistically analyzed and the results that are produced can simultaneously verify the
extent to which the model fits the data. “If the goodness of fit is adequate, the model
argues for the plausibility of postulated relations among variables; if it is inadequate,
the tenability of such relations is rejected” (p.3). In other words, hypothesis testing is
performed only when the model has already achieved acceptable level of goodness of
fit.
3.11 CONCLUSION
There are a number of ways to investigate the relationships among the variables that
are examined in the current research. Because of the quantitative nature of this work
which is descriptive and requires the utilization of one sample of respondents at one
point of time, a single cross-sectional descriptive research characterizes the design of
this study. The data are collected through survey using mailed and self-administered
questionnaires. The survey instruments are developed based on previous research work
and modified accordingly in order to suit the context of study. A pilot test has been
carried out to ensure the instruments are generally reliable and valid to be used in the
final study. Several statistical techniques which are employed for the purpose of
hypotheses testing have been elaborately discussed in this chapter.

139
CHAPTER 4
RESULTS
4.1 INTRODUCTION
This study employs a structural equation model (SEM) technique to reveal the
relationships among service-based HRM practices, OCB, perceived service quality
(PSQ) and the nature of employee job orientation. The study instruments are purified
by analyses of item-to-total correlations, Cronbach’s alpha, and factor loadings. As a
prerequisite to SEM analysis, the measurement model is validated using CFA. The
results of all analyses are reported in this chapter.
4.2 RESPONSE RATES
Upon approval of the management of 68 golf clubs, ten questionnaires have been sent
to each of them through registered mail. These ten questionnaires have been completed
by their non-executive employees whose jobs are related to direct or indirect
interaction with customers. In summary, a total of 680 questionnaires have been sent to
the respective golf clubs.
390 responses later have been received for a response rate of 57%. This number is
reduced into 325 (48%) once the data have been screened, checked and cleaned. The
nature of the variables is inspected and the data are then ready for further analyses.

140
4.3 DESCRIPTIVE CHARACTERISTICS
Table 4.1: Descriptive Characteristics of Respondents (n = 325)
Characteristic N %
Job Customer-contact service
Non-customer-contact service
Total
Missing
160
160
320
5
49.2
49.2
98.5
1.5
Age <30 years old
30 – 40 years old
>40 years old
Total
Missing
153
96
72
321
4
47.1
29.5
22.2
98.8
1.2
Gender Male
Female Total
Missing
147
173
320
5
45.2
53.2
98.5
1.5
Marital Not married
Married
Total
Missing
130
191
321
4
40.0
58.8
98.8
1.2
Race Malay
Non-Malay
Total
Missing
284
35
319
6
87.4
10.8
98.2
1.8
Qualification Secondary level
Tertiary level
Total
Missing
274
45
319
6
84.3
13.8
98.2
1.8
Tenure <5 years 5 – 15 years
>15 years
Total
Missing
155
136
29
320
5
47.7
41.9
8.9
98.5
1.5
Income <RM1,001
RM1,001 – RM2,000
>RM2,001
Total
Missing
192 113
15
320
5
59.1
34.8
4.6
98.5
1.5

141
Table 4.1 reports that the samples in general, are equally represented by non- and
customer-contact employees (49% each). The majority of the samples are below 30
years old which is 47% of the total population, 53% of them are female workers while
59% are married. With a percentage of 87%, the Malays appear to be the dominant race
in the samples. The qualification that is frequently checked by the respondents is the
secondary or school level (84%). There are three groups of seniority, those who have
worked less than 5 years, between 5 and 15 years and more than 15 years. Among
these three group categories, the biggest population is those who have worked less than
5 year period (48%). Finally, most of the subjects earn below RM1,001 a month (59%).
Overall, the samples are consisting of equal number of non- and customer-contact
employees, dominated by the staff who are below 30 years old, female, married,
Malays and qualified with school level certificates. Most of them have less than 5 year
experiences and earn a monthly salary of less than RM1,001.
4.4 SCALES PURIFICATION
According to Churchill (1979), the scale can be purified by assessing its item-to-total
correlation and Cronbach’s alpha. The results are reported in Table 4.2 below.
Table 4.2: Mean, Standard Deviation, Item-to-total Correlation and Cronbach’s alpha
Items Mean SD Item-to-total
Correlations
Cronbach’s alpha
Support at Work
SW1
SW2
SW3
SW4
SW5
4.22
4.21
4.22
4.16
4.25
1.270
1.274
1.278
1.346
1.256
0.917
0.934
0.944
0.812
0.932
0.967
Training
TR1
TR2
3.41
3.30
1.620
1.540
0.750
0.826
0.918
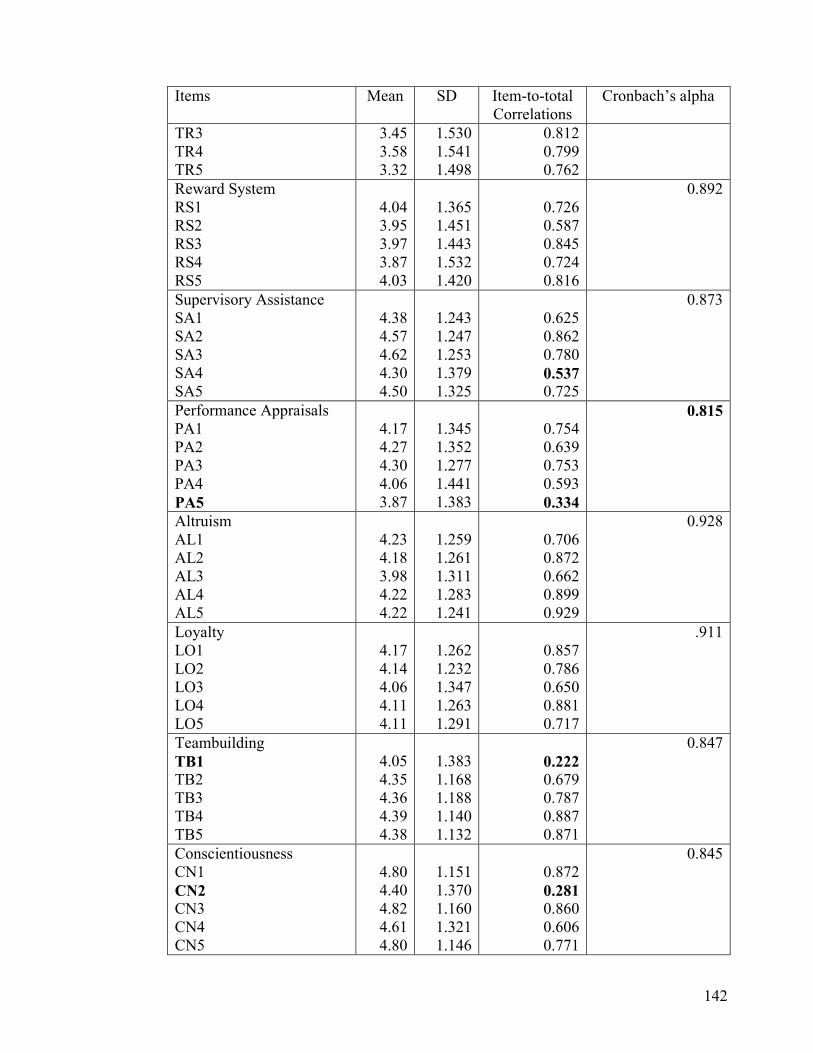
142
Items Mean SD Item-to-total
Correlations
Cronbach’s alpha
TR3
TR4
TR5
3.45
3.58
3.32
1.530
1.541
1.498
0.812
0.799
0.762
Reward System
RS1
RS2
RS3
RS4
RS5
4.04
3.95
3.97
3.87
4.03
1.365
1.451
1.443
1.532
1.420
0.726
0.587
0.845
0.724
0.816
0.892
Supervisory Assistance
SA1
SA2
SA3
SA4
SA5
4.38
4.57
4.62
4.30
4.50
1.243
1.247
1.253
1.379
1.325
0.625
0.862
0.780
0.537
0.725
0.873
Performance Appraisals
PA1
PA2
PA3
PA4
PA5
4.17
4.27
4.30
4.06
3.87
1.345
1.352
1.277
1.441
1.383
0.754
0.639
0.753
0.593
0.334
0.815
Altruism
AL1
AL2
AL3
AL4
AL5
4.23
4.18
3.98
4.22
4.22
1.259
1.261
1.311
1.283
1.241
0.706
0.872
0.662
0.899
0.929
0.928
Loyalty
LO1
LO2
LO3
LO4
LO5
4.17
4.14
4.06
4.11
4.11
1.262
1.232
1.347
1.263
1.291
0.857
0.786
0.650
0.881
0.717
.911
Teambuilding
TB1
TB2
TB3
TB4
TB5
4.05
4.35
4.36
4.39
4.38
1.383
1.168
1.188
1.140
1.132
0.222
0.679
0.787
0.887
0.871
0.847
Conscientiousness
CN1
CN2
CN3
CN4
CN5
4.80
4.40
4.82
4.61
4.80
1.151
1.370
1.160
1.321
1.146
0.872
0.281
0.860
0.606
0.771
0.845

143
Items Mean SD Item-to-total
Correlations
Cronbach’s alpha
Perceived Service Quality
PSQ1
PSQ2
PSQ3
PSQ4
4.10
4.15
4.03
4.15
1.163
1.230
1.342
1.247
0.642
0.702
0.656
0.858
0.863
Using the conventional cut-off point of 0.5 (Carmines & Zeller, 1979), three items are
identified as weak as their item-to-total correlations are below the threshold value
(PA5=0.334, TB1=0.222 and CN2=0.281). The rest of other items indicate acceptable
item-to-total correlation scores which range from 0.537 (SA4) to 0.944 (SW3). As for
the Cronbach’s alpha, all subscales report values which are well above the satisfactory
standard (α≥0.75, Nunnally, 1978; Churchill, 1991; Litwin, 1995). The results range
from 0.815 (Performance Appraisals) to 0.967 (Support at Work).
In order to further support the scale purification decision, Lu et al. (2007) suggest an
exploratory factor analysis (EFA) is performed on each construct. The EFA is then
conducted using principal component analysis and Varimax rotation methods with
Kaiser normalization (Kinnear & Gray, 1997). Prior to the analysis of EFA, the
appropriateness of using EFA is determined by the results of KMO and Bartlett’s test
of sphericity (Tehrani, 2004). As displayed in Table 4.3, service-based HRM, OCB and
PSQ constructs respectively achieves a KMO statistic value of 0.880, 0.876 and 0.756.
Based on the guidelines specified by Kaiser (1970), the KMO values obtained by
service-based HRM and OCB are considered great and the KMO of PSQ is good. The
encouraging KMO and significant Bartlett’s test of sphericity results as shown by all
constructs, allow for the application of EFA in this study.

144
Table 4.3: KMO and Bartlett's Test for the Constructs of Service-based HRM, OCB
and PSQ
Service-based
HRM OCB PSQ
Kaiser-Meyer-Olkin Measure of Sampling
Adequacy. 0.880 0.876 0.756
Bartlett's Test of
Sphericity
Approx. Chi-Square 6933.517 6263.222 693.024
df 300 190 6
Sig. 0.000 0.000 0.000
Next is the interpretation of the EFA results. The decision on retaining items is made
on Kaiser’s criterion which only tolerates those factors that have an eigenvalue value
greater than one (Bryman & Cramer, 2001). The results of EFA for service-based
HRM, OCB and PSQ constructs are presented in Table 4.4, 4.5 and 4.6 respectively.

145
Table 4.4: The EFA Results of Service-Based HRM Construct
FACTOR
1 2 3 4 5
SW1 0.898
SW2 0.900
SW3 0.903
SW4 0.789
SW5 0.913
TR1 0.840
TR2 0.890
TR3 0.877
TR4 0.879
TR5 0.848
RS1 0.794
RS2 0.699
RS3 0.831
RS4 0.757
RS5 0.814
SA1 0.569
SA2 0.798
SA3 0.794
SA4 0.728
SA5 0.775
PA1 0.815
PA2 0.775
PA3 0.767
PA4 0.818
PA5 0.347
% of Variance 18.446 15.189 14.814 12.955 11.975
a. Total variance extracted by 4 factors = 73%
b. Extraction Method: Principal Component Analysis.
c. Rotation Method: Varimax with Kaiser Normalization.
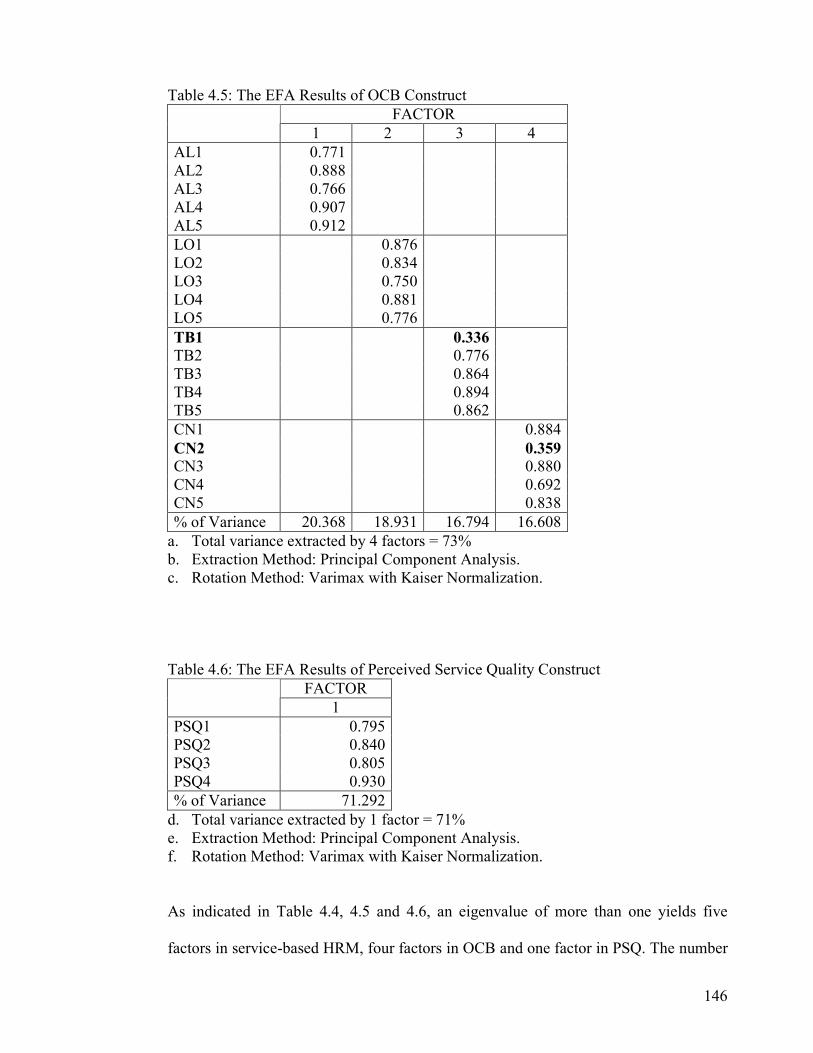
146
Table 4.5: The EFA Results of OCB Construct
FACTOR
1 2 3 4
AL1 0.771
AL2 0.888
AL3 0.766
AL4 0.907
AL5 0.912
LO1 0.876
LO2 0.834
LO3 0.750
LO4 0.881
LO5 0.776
TB1 0.336
TB2 0.776
TB3 0.864
TB4 0.894
TB5 0.862
CN1 0.884
CN2 0.359
CN3 0.880
CN4 0.692
CN5 0.838
% of Variance 20.368 18.931 16.794 16.608
a. Total variance extracted by 4 factors = 73%
b. Extraction Method: Principal Component Analysis.
c. Rotation Method: Varimax with Kaiser Normalization.
Table 4.6: The EFA Results of Perceived Service Quality Construct
FACTOR
1
PSQ1 0.795
PSQ2 0.840
PSQ3 0.805
PSQ4 0.930
% of Variance 71.292
d. Total variance extracted by 1 factor = 71%
e. Extraction Method: Principal Component Analysis.
f. Rotation Method: Varimax with Kaiser Normalization.
As indicated in Table 4.4, 4.5 and 4.6, an eigenvalue of more than one yields five
factors in service-based HRM, four factors in OCB and one factor in PSQ. The number

147
of factors that fall into those variables is in accordance with what have been
theoretically predicted in this study. Both the service-based HRM and OCB constructs
extracts 73% while the construct of PSQ extracts 71% of the total variance. Consistent
with the results of item-to-total correlations earlier, the same three items are found to
be weak, as their factor loadings are lower than 0.5, the threshold value for “practical
significance” (Hair et al., 2006). The identified items are PA5 (0.347), TB1 (0.336) and
CN2 (0.359).
Based on Hair et al.’s (2006) guidelines, items of the underlying constructs are retained
if:
1. they load 0.5 or more on a factor
2. do not load more than 0.5 on two factors, and
3. their item-to-total correlation values are larger than 0.4.
In this case, all items satisfy Hair et al.’s factor loading standard except for items PA5,
TB1 and CN2. The results of item-to-total correlations and factor loadings have
consistently indicated that these items are below the respective cut-off values. Because
of this reason, the three items are decided to be eliminated from the study. When they
are deleted, the Cronbach’s alphas of their own respective scales are improved. For
example, the deletion of PA5 has increased the Cronbach’s alpha from 0.815 to 0.856,
TB1, from 0.847 to 0.937 and CN2, from 0.845 to 0.916.
As the number of items has been reduced in the service-based HRM and OCB
constructs, reliability and EFA tests are once again performed on them respectively.

148
The results of the analyses (item-to-total correlations, factor loadings, % of variance
and Cronbach’s alpha) are shown in Table 4.7 and 4.8 below.
Table 4.7: Results of Item-to-total Correlations, Factor loadings, % of Variance and
Cronbach’s Alpha of Service-Based HRM Constructs
FACTOR
Item-to-
total
correlation
Support at
Work
Training
Reward
System
Super-
visory
Assistance
Perfor-
mance
Appraisals
SW1 0.917 0.899
SW2 0.934 0.902
SW3 0.944 0.906
SW4 0.812 0.793
SW5 0.932 0.915
TR1 0.750 0.840
TR2 0.826 0.891
TR3 0.812 0.878
TR4 0.799 0.879
TR5 0.762 0.847
RS1 0.726 0.790
RS2 0.587 0.696
RS3 0.845 0.836
RS4 0.724 0.766
RS5 0.816 0.819
SA1 0.625 0.581
SA2 0.862 0.801
SA3 0.780 0.799
SA4 0.537 0.723
SA5 0.725 0.771
PA1 0.781 0.814
PA2 0.657 0.776
PA3 0.745 0.757
PA4 0.628 0.825
% of Variance 19.237 15.806 15.259 13.537 11.792
Cronbach’s alpha 0.97 0.92 0.89 0.87 0.86
a. Total variance extracted by 4 factors = 76%, KMO = 0.883, Bartlett’s Test p<0.001
b. Extraction Method: Principal Component Analysis.
c. Rotation Method: Varimax with Kaiser Normalization.

149
Table 4.7 illustrates that there are five factors (eigenvalue >1) that make up the concept
of service-based HRM. The total variance that is accounted for by these five factors is
76%. Each factor is identified as support at work, training, reward system, supervisory
assistance and performance appraisals and respectively, they explain 19%, 16%, 15%,
14% and 12% of the total variance.
Table 4.8: Results of Item-to-total Correlations, Factor loadings, % of Variance and
Cronbach’s Alpha of OCB Constructs
Component
Item-to-total
correlation Altruism Loyalty Teambuilding Conscientiousness
AL1 0.706 0.771
AL2 0.872 0.882
AL3 0.662 0.758
AL4 0.899 0.906
AL5 0.929 0.911
LO1 0.857 0.877
LO2 0.786 0.839
LO3 0.650 0.746
LO4 0.881 0.885
LO5 0.717 0.780
TB2 0.717 0.790
TB3 0.844 0.874
TB4 0.934 0.903
TB5 0.923 0.872
CN1 0.933 0.896
CN3 0.891 0.883
CN4 0.638 0.703
CN5 0.804 0.843
% of Variance 22.120 21.128 18.534 17.894
Cronbach’s alpha 0.93 0.91 0.94 0.83
a. Total variance extracted by 4 factors = 80%, KMO = 0.878, Bartlett’s Test p<0.001
b. Extraction Method: Principal Component Analysis.
c. Rotation Method: Varimax with Kaiser Normalization.

150
In Table 4.8, four factors (eigenvalue >1) are revealed to be the components that
underlie the construct of OCB. The factors are labeled as altruism, loyalty,
teambuilding and conscientiousness. With a respective variance of 22%, 21%, 19% and
18%, the four factors explain 80% of the total variance in the OCB construct.
In summary, after the scales are purified, all the remaining items show loadings that are
well above 0.5, item-to-total correlations that are greater than 0.5 and Cronbach’s
alphas that exceed 0.75. The results of EFA support the earlier predictions regarding
the factors which converge under the scales theoretically proposed in this study. At this
preliminary analysis stage, the results of reliability and factor analyses have presented
sufficient evidence of unidimensionality in the constructs proposed to be utilized in the
subsequent analyses (Lu et al., 2007).
4.5 MULTIVARIATE ASSUMPTIONS
Multivariate analysis such as performed in this study requires several assumptions to
be met. Violations of assumptions can lead to a number of problems which ranges from
inaccurate results of significant coefficients to biased and wrong predictions of the
hypothesized relationships (Hair et al., 2006).
4.5.1 NORMALITY, OUTLIERS, LINEARITY AND HOMOSCEDASTICITY
Based on Miles and Shevlin’s (2001) guideline, skewness and kurtosis values of
greater than twice their respective standard errors are indicative of non-normal
distributions. Using these values (skewness>0.27, kurtosis >0.54) as benchmarks,
Table 4.9 shows that some variables are significantly skewed (i.e., Support at Work,

151
Supervisory Assistance, Performance Appraisals, Altruism, Teambuilding and
Conscientiousness) and peaked (i.e., Training, and Conscientiousness). However, since
some other variables are below the specified values, it can be concluded that the data in
general, do not seriously depart from normality. Furthermore, issues of non-normality
should not be a concerned here because of the study’s large sample size (n=325).
Hair et al, (2006) highlight that for sample sizes of 200 or more, the “detrimental effect
of nonnormality” is negligible (p.80). The decision to treat the results as negligible in
this case is further supported by Tabachnick & Fidell (2007) who explain that in a large
sample, variables with significant skewness or kurtosis “often does not deviate enough
from normality to make substantive difference in the analysis” (p.80). Nevertheless, for
purpose of understanding the extent to which normality distribution is assumed in the
sample (Hair et al., 2006), results of graphical plots are analyzed.
Table 4.9: The Levels of Skewness and Kurtosis of All Variables
Skewness Kurtosis N
Statistic Std. Error Statistic Std. Error
Support at Work 325 -0.379 0.135 -0.340 0.270
Training 325 -0.101 0.135 -0.649 0.270
Reward System 325 -0.198 0.135 -0.518 0.270
Supervisory Assistance 325 -0.668 0.135 0.300 0.270
Performance Appraisals 325 -0.359 0.135 -0.184 0.270
Altruism 325 -0.407 0.135 -0.298 0.270
Loyalty 325 -0.228 0.135 -0.268 0.270
Teambuilding 325 -0.299 0.135 -0.294 0.270
Conscientiousness 325 -0.871 0.135 0.653 0.270
Perceived Service Quality 325 -0.192 0.135 -0.292 0.270

152
As presented in Appendix C, visual inspections of the graphical plots do not indicate
any pattern of non-linearity (e.g., the dots are far from a straight-line relationship) and
heteroscedasticity (the dots are not concentrated in the center but spread out across the
scatterplot graph) and no extreme outliers are found as all cases are generally located at
the specified residual range (between 3.3 and -3.3). These results show that there is no
serious case of outliers in the data and as such, evidence of linearity and
homoscedasticity are obtained in the relationship between independent and dependent
variables of this study. In short, based the graphical plots, the variables in the samples
reasonably exhibit univariate normality.
4.5.2 MULTICOLLINEARITY
As suggested by Pallant (2005), multicollinearity among independent variables can be
examined by the Tolerance and VIF values resulted from the analysis of standard
multiple regression between the independent and dependent variables. Remedies for
multicollinearity problems should be considered to be taken if the Tolerance value
shows less than 0.10 and VIF more than 10 (Belsley et al., 1980). In this case, the
results of the standard multiple regression pertaining to the multicollinearity issue as
displayed in Table 4.10 and 4.11 indicates that all Tolerance and VIF values are above
the cut-off values. As such, there are no detrimental correlations among the
independent variables of the study.

153
Table 4.10: Tolerance and VIF Values of Service-Based HRM Variables
Collinearity Statistics Model
Tolerance VIF
1 (Constant)
Support at Work 0.623 1.606
Training 0.982 1.019
Reward System 0.631 1.585
Supervisory Assistance 0.569 1.757
Performance Appraisals 0.752 1.330
a Dependent Variable: OCB
Table 4.11: Tolerance and VIF Values of OCB Variables
Collinearity Statistics Model
Tolerance VIF
1 (Constant)
Altruism 0.744 1.345
Loyalty 0.741 1.349
Teambuilding 0.677 1.478
Conscientiousness 0.633 1.579
a Dependent Variable: PSQ
4.6 MEASUREMENT MODEL
“No valid conclusions exist without valid measurement” (Hair et al., 2006, p. 770).
Hence, before the proposed model is interpreted for hypotheses testing purposes, a
confirmatory factor analysis (CFA) is performed to validate the measurement model.
Cheng (2001) has noted that there are two alternatives of validating a measurement
model. It is either by running a CFA on each individual variable or on all of them
simultaneously. In order to improve the psychometric properties of the measures, the
author suggests the second alternative. He argues that a measurement which is found to
be in good fit (based on individual variable test) will not guarantee an equally
acceptable fit when it is concurrently analyzed together with other variables of the

154
same model. He states that an “inconsistency of such results is attributed to the
unexpected relationships between indicators and non-underlying constructs” (p.653).
The simultaneous test of all latent variables with their respective indicators is also
adopted by many researchers such as Clark, Dobbins, and Ladd, (1993), Gwinner and
Swanson (2003), and Lu et al. (2007).
In line with Cheng’s (2001) argument and the procedure adopted by those mentioned
researchers, a CFA using AMOS 7 is performed on all variables at the same time.

155
Figure 4.1: The Measurement Model
Training
TR5e10
11 TR4e9
1 TR3e8
1 TR2e7
1 TR1e6
1
Reward System
RS5e15
RS4e14
RS3e13
RS2e12
RS1e11
11
1
1
11
Supervisory
Assistance
SA5e20
SA4e19
SA3e18
SA2e17
SA1e16
11
1111
Performance
Appraisals
PA4e24
11 PA3e23
1 PA2e22
1 PA1e21
1
Altruism
AL5e29
11 AL4e28
1 AL3e27
1 AL2e26
1 AL1e25
1
Loyalty
LO5e34
LO4e33
LO3e32
LO2e31
LO1e30
11
1
1
1
1
Support at Work
SW5e5
SW4e4
SW3e3
SW2e2
SW1e1
11
1
1
1
1
Teambuilding
TB5e38
TB4e37
TB3e36
TB2e35
11
1
1
1
Conscientiousness
CN5e42
CN4e41
CN3e40
CN1e39
11
1
1
1
Perceived
Service Quality
PSQ4e46
PSQ3e45
PSQ2e44
PSQ1e43
11
1
1
1

156
Garver and Mentzer (1999) assert that a measurement model is tested for evaluations of
the model’s:
1. unidimensionality
2. construct reliability
3. construct validity
4.6.1 UNIDIMENSIONALITY
With 945 degrees of freedoms, the model of this study yields a χ2 value of 2321.532.
Using a Type I error rate of 0.05, the ρ-value associated with this result is 0.000. The
large χ2 and significant p-value suggest that the observed sample and SEM estimated
covariance matrices are significantly not equal and this is indicative of an unfit model.
However, researchers are constantly cautioned against using a χ2 statistics index as the
sole determinant of the model’s fit (Rigdon, 1996; Byrne, 2001; Narsky, 2003; Hair et
al., 2006; Tsuji, Bennet, & Zhang, 2007). Tickle, Hull, Sargent, and Dalton (2006)
state that “Although we report the χ2 goodness-of-fit test, it is widely acknowledged to
have a variety of undesirable properties such as a bias towards significance with large
sample sizes” (p. 122). An alternative to this measure is a relative likelihood ratio
between a χ2 and its degrees of freedom (χ
2/df). According to Eisen, Wilcox, and Leff
(1999), a relative likelihood ratio of 5 or less is considered an acceptable fit. Since the
value of χ2/df for this model is 2.457, this measurement model is considered to have
achieved an adequate fit.

157
Proposed by Bentler (1990), CFI index is measured based on non-centrality, least
affected by sample size and not linked to statistical significance test. By convention,
CFI value should be equal or greater than 0.9 in order to support the fit of the model
(Bentler, 1990; Hoyle, 1995; Kline, 1998; Sureshchandar, Rajendran, &
Anantharaman, 2002; Kulas et al., 2007). Using this as a benchmark, it is assured that
90% (or more) of the covariations in the data are explained by the given model. The
CFI value that is produced by the model in this study is 0.907 and therefore, it satisfies
the CFI requirement.
RMSEA is another goodness-of-fit (GOF) index which is commonly found in the
literature. It measures discrepancy per degree of freedom. The closer to zero the value
of RMSEA is, the lesser the variances and covariances are left unexplained (Saenz et
al., 1999). It is suggested that an RMSEA value that is less than 0.05 is regarded as
good fit, between 0.05 and 0.08 is considered acceptable fit, 0.08 and 0.10 is deemed as
marginal fit, and a value larger than 0.10 is concluded as poor fit (Browne & Cudeck,
1992). Since the proposed model yields a RMSEA value of 0.067, it means that only
about 7% of the variance and covariances are left unexplained, making the fit of the
model reasonably acceptable.
Also known as a badness-of-fit, an SRMR index gauges the average difference
between the hypothesized and observed variances and covariances in the model, based
on standardized residuals (Hair et al., 2006). A model with an SRMR value of 0.10 or
lower is considered as good fit (Kline 1998). With SRMR value of 0.050, the model of
this study exceeds the given cutoff point. In short, the results of the GOF index indicate
158
that the measurement model fits the data quite well (χ2=2321.532, df=945, χ
2/df=2.457,
p=0.000, CFI=0.907, RMSEA=0.067, SRMR=0.050).
.
Apart from the assessment of the model’s fit, the element of unidimensionality can also
be determined by examining the items’ path directions and significant levels. This
information can be obtained from the regression weight output as shown by Table 4.13
below. The parameters’ variances compared across groups are shown in the “Estimate”
column. Based on the results, the value of each parameter estimate, which ranges from
0.801 (LO to LO3) to 1.529 (PSQ to PSQ4) is all positive. When the estimates are
divided by their respective standard error (S.E), they produce values which are called
critical ratios (C.R). A C.R score that is larger than 1.96 is significant at 0.05 level
(Byrne, 2001). All C.R values as shown in the table are greater than 1.96, indicating
the achievement of significance level. The highest value of C.R is 57.110 (CN to CN3)
while the lowest is 8.997 (SA to SA4). In the AMOS output, the significance of C.R is
calculated and prepared by the software. As illustrated in the last column of Table 4.13,
all parameters are shown to be significant.
In summary, since the values of all parameters’ estimates are all positive and
significant, this implies that all items are significantly associated with their respective
latent variables as hypothesized in this study. Hence, besides the achievement of
acceptable model fit presented earlier, the existence of unidimensionality in this model
is further supported by the items’ positive and significant path directions.

159
Table 4.12: Regression Weights
Estimate S.E. C.R. P
SW1 <------------ SW 1.000
SW2 <------------ SW 1.020 0.029 35.268 ***
SW3 <------------ SW 1.039 0.027 37.795 ***
SW4 <------------ SW 0.934 0.041 22.593 ***
SW5 <------------ SW 1.015 0.028 36.810 ***
TR1 <------------ TR 1.000
TR2 <------------ TR 1.053 0.060 17.492 ***
TR3 <------------ TR 1.029 0.060 17.130 ***
TR4 <------------ TR 1.021 0.061 16.813 ***
TR5 <------------ TR 0.944 0.060 15.776 ***
RS1 <------------ RS 1.000
RS2 <------------ RS .847 0.080 10.564 ***
RS3 <------------ RS 1.342 0.077 17.395 ***
RS4 <------------ RS 1.166 0.083 14.032 ***
RS5 <------------ RS 1.278 0.076 16.869 ***
SA1 <------------ SA 1.000
SA2 <------------ SA 1.397 0.086 16.297 ***
SA3 <------------ SA 1.201 0.084 14.351 ***
SA4 <------------ SA .818 0.091 8.997 ***
SA5 <------------ SA 1.237 0.088 13.987 ***
PA1 <------------ PA 1.000
PA2 <------------ PA 0.831 0.058 14.265 ***
PA3 <------------ PA 0.947 0.052 18.186 ***
PA4 <------------ PA 0.820 0.064 12.877 ***
AL1 <------------ AL 1.000
AL2 <------------ AL 1.192 0.065 18.206 ***
AL3 <------------ AL 0.907 0.072 12.537 ***
AL4 <------------ AL 1.261 0.066 19.127 ***
AL5 <------------ AL 1.284 0.063 20.308 ***
LO1 <------------ LO 1.000
LO2 <------------ LO 0.938 0.043 21.918 ***
LO3 <------------ LO 0.801 0.056 14.258 ***
LO4 <------------ LO 1.047 0.040 26.380 ***
LO5 <------------ LO 0.886 0.049 17.974 ***
TB2 <------------ TB 1.000
TB3 <------------ TB 1.242 0.075 16.589 ***
TB4 <------------ TB 1.324 0.071 18.540 ***
TB5 <------------ TB 1.284 0.071 18.140 ***
CN1 <------------ CN 1.000

160
Estimate S.E. C.R. P
CN3 <------------ CN 0.964 0.017 57.110 ***
CN4 <------------ CN 0.764 0.048 15.954 ***
CN5 <------------ CN 0.861 0.028 30.549 ***
PSQ1 <------------ PSQ 1.000
PSQ2 <------------ PSQ 1.160 0.093 12.512 ***
PSQ3 <------------ PSQ 1.282 0.101 12.659 ***
PSQ4 <------------ PSQ 1.529 0.102 15.029 ***
***p<0.001
4.6.2 CONSTRUCT RELIABILITY
Construct reliability is defined as “…the degree to which measures are free from error
and therefore yield consistent results” (Peter, 1979, p. 6). Otherwise stated, it
demonstrates the degree to which the scale indicators reflect an underlying factor.
Construct reliability can be ascertained by assessing the item reliability (squared
multiple correlation), composite reliability and average variance extracted.
Table 4.13: Item Reliability, Standardized Regression Weights, Composite Reliability
and Average Variance Extracted
Std. Reg.
Weight
P r2 CR AVE
Support at Work
SW1
SW2
SW3
SW4
SW5
0.935
0.951
0.965
0.824
0.960
***
***
***
***
***
0.873
0.904
0.932
0.679
0.921
0.969 0.862
Training
TR1
TR2
TR3
TR4
TR5
0.787
0.871
0.857
0.845
0.804
***
***
***
***
***
0.619
0.759
0.735
0.713
0.646
0.919 0.695
Reward System
RS1
RS2
RS3
RS4
RS5
0.739
0.589
0.938
0.767
0.907
***
***
***
***
***
0.546
0.347
0.880
0.588
0.823
0.895 0.637
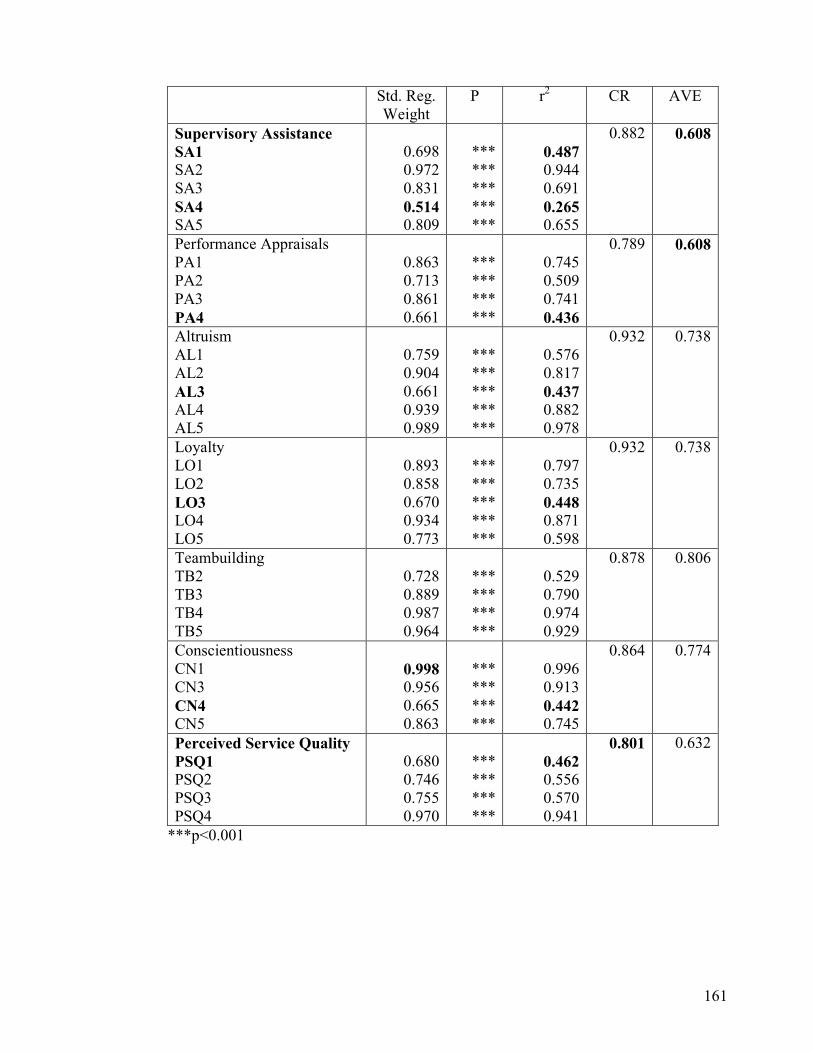
161
Std. Reg.
Weight
P r2 CR AVE
Supervisory Assistance
SA1
SA2
SA3
SA4
SA5
0.698
0.972
0.831
0.514
0.809
***
***
***
***
***
0.487
0.944
0.691
0.265
0.655
0.882 0.608
Performance Appraisals
PA1
PA2
PA3
PA4
0.863
0.713
0.861
0.661
***
***
***
***
0.745
0.509
0.741
0.436
0.789 0.608
Altruism
AL1
AL2
AL3
AL4
AL5
0.759
0.904
0.661
0.939
0.989
***
***
***
***
***
0.576
0.817
0.437
0.882
0.978
0.932 0.738
Loyalty
LO1
LO2
LO3
LO4
LO5
0.893
0.858
0.670
0.934
0.773
***
***
***
***
***
0.797
0.735
0.448
0.871
0.598
0.932 0.738
Teambuilding
TB2
TB3
TB4
TB5
0.728
0.889
0.987
0.964
***
***
***
***
0.529
0.790
0.974
0.929
0.878 0.806
Conscientiousness
CN1
CN3
CN4
CN5
0.998
0.956
0.665
0.863
***
***
***
***
0.996
0.913
0.442
0.745
0.864 0.774
Perceived Service Quality
PSQ1
PSQ2
PSQ3
PSQ4
0.680
0.746
0.755
0.970
***
***
***
***
0.462
0.556
0.570
0.941
0.801 0.632
***p<0.001

162
In Table 4.13, item reliability is represented by the r2 value reported by each measured
indicator. The magnitude of this value reflects the amount of variance that is accounted
for by the latent variable associated with the item (Koufteros, 1999; Lu et al., 2007).
To be accepted as a reliable item, it is required to have at least 50% of the variance
(R2≥0.5) (Bollen, 1989). As shown in Table 4.10, eight of the indicators are found to
have low item reliability (RS2=0.347, SA1=0.487, SA4=0.265, PA4=0.436,
AL3=0.437, LO3=0.448, CN4=0.442, PSQ1=0.462). These flaws however are
considered acceptable since not only the paths that linked these items to their
respective latent variables show significant p-values, the rest of other items yielded R2
values above 0.5, ranging from 0.509 (PA2) to 0.996 (CN1). Thus, in terms of item
reliability, the model is claimed to have reasonable construct reliability.
According to many researchers, a scale is deemed to have a reasonable internal
consistency if the CR value ( for standardized estimates) is 0.6 or higher (Nunnally,
1978; Aubert, Rivard, & Patry, 1996; Lawson-Body & Limayem, 2004). Based on the
results reported in Table 4.13, all indicators obtained good CR values which range
from 0.801 (Perceived Service Quality) to 0.969 (Support at Work). The results
therefore prove that the constructs are highly reliable as they are very consistent in
explaining the variances constituted in them.
Another important aspect of construct reliability is the average of variances extracted
(AVE) for each individual construct. Average variance extracted is an estimate that
calculates the average amount of variances in indicators that are accounted for by the
underlying factor (Taylor & Hunter, 2003). A reliable variable is when its AVE

163
achieves 0.5 or greater (Fornell & Larcker, 1981). This cut-off value assures that at
least 50% or more of the variances in the observed variables are explained by the set of
indicators.
An observation from Table 4.13 reveals that none of the variables have an AVE value
below 50%. The lowest AVE is generated by the Supervisory Assistance and
Performance Appraisals variables, both with a percentage of 60.8 and the highest AVE
is scored by support at work variable with a percentage of 86.2. Therefore, it is
conclusive to state that the constructs in the model are reliable as the measures of
average variance extracted supersede the value typically outlined in the literature.
4.6.3 CONSTRUCT VALIDITY
Construct validity can be determined by examining the extent to which items of the
same latent variable are measuring the same construct (convergent validity) and when
the items do not measure constructs other than their own (discriminant validity)
(Garver & Mentzer, 1999).
Based on Campbell and Fiske’s (1959) work, Ahire and Devaraj (2001) define
convergent validity as “the degree to which multiple methods of a construct, yield the
same results” (p.321). The existence of convergent validity is verified when the
standardized factor loadings (standardized regression weights) are significant
(ρ<0.001) and above the recommended value of 0.7 (Segar, 1997; Gefen, Straub, &
Boudreau, 2000; Byrne, 2001; Hair et al., 2006; Lu et al., 2007).

164
It can be seen from table 4.13 that the p-values of all items with respect to their
respective factors indicate significant scores. This means that convergent validity is
presence in the model. Convergent validity is further established by the results of high
factor loadings (standardized regression weights), ranging from 0.514 (SA4) to 0.998
(CN1). Although by convention, 0.6 is below the ideal threshold level, Hair et al.
(2006) allow for a minimum value of 0.5 as long as the overall fit of the model remains
acceptable. In this case, the earlier analysis has shown that the overall fit of the model
is good and therefore, based on Hair et al.’s guideline, items with less than 0.6 loadings
such as 0.514 (SA4) is considered acceptable. The positive results related to the items’
significance levels and the overall results of factor loadings have reasonably confirmed
the existence of convergent validity in each of the construct in the model.
The procedures for determining the presence of discriminant validity is first, obtain the
AVE score from each latent variable. Second, compare with the squared correlation
value that is shared between it and other variables (Fornell & Larcker, 1981).
Discriminant validity is established if the AVE score is higher than the squared
correlation that is shared between two variables (Fornell & Larcker, 1981; Lawson-
Body & Limayem, 2004).
Presented in a matrix, Table 4.14 exhibits the outcomes pertaining to the discriminant
validity of each construct proposed in the model. The AVE values are reported
diagonally while the squared correlations values are shown below the diagonal. The
results show that the lowest average AVE value is 0.608 (Supervisory Assistance and
Performance Appraisals) and none of the squared correlation value falls above this

165
score. This indicates that all the ten variables utilized in this study are distinct
constructs, indicating an existence of discriminant validity.
Table 4.14: Results of Average Variance Extracted and Squared Correlations of Each
Construct
SW TR RS SA PA AL LO TB CN PSQ
SW 0.862
TR 0.001 0.695
RS 0.256 0.000 0.637
SA 0.367 0.003 0.312 0.608
PA 0.218 0.000 0.215 0.245 0.608
AL 0.161 0.010 0.052 0.155 0.125 0.738
LO 0.285 0.001 0.346 0.382 0.196 0.127 0.690
TB 0.215 0.003 0.146 0.272 0.194 0.224 0.138 0.806
CN 0.233 0.002 0.192 0.256 0.166 0.186 0.233 0.253 0.774
PSQ 0.244 0.003 0.226 0.272 0.221 0.207 0.311 0.222 0.187 0.632 Note: Values for the diagonal elements are those for the average variance extracted. Values
below the diagonal are squared correlations
In short, the exploratory evaluations of the measurement model have demonstrated that
the items, constructs and overall model have displayed elements of unidimensionality,
construct reliability and construct validity. Therefore, it is concluded that the
measurement model fits quite well with the data and as such, the outcomes of this
study can be reasonably generalized as representative of the targeted population.
4.7 OCB AS A SECOND ORDER MODEL
OCB has been recommended by priori theoretical structure that it is a second order
construct comprising of multiple dimensions. For a statistical reason, this has to be
established by first, ensuring that the dimensions of this construct are indeed correlated
with each other and second, the model demonstrates the structural relationship between
the dimensions (Byrne, 2001; Hair et al., 2006; Schmidt, 2005). Garver and Mentzer

166
(1999) also add that “Whether specifying constructs in the measurement model as a
first or second order, it is imperative that both the first order and second order
measurement (phases) models be tested for unidimensionality and reliability” (p.38).
In the first step, the correlations of OCB dimensions are analysed and the results are
depicted in Figure 4.2 below. The Goodness-of fit statistics report that the model fits
the data very well (χ2=335.618, df=132; P<0.001; χ
2/df=2.543; CFI=0.967;
RMSEA=0.069; SRMR=0.042). Evidence of unidimensionality is further supported
when the model shows that all the parameter estimates are significant and item
loadings are higher than 0.5 (Anderson & Gerbing, 1988; Kline, 1998).
Figure 4.2: OCB – The Measurement Model
0,Altruism
AL1
0,
e11
AL2
0,
e21
AL3
0,
e31
AL4
0,
e41
AL5
0,
e51
0,Loyalty
LO1
0,
e6
LO2
0,
e7
LO3
0,
e8
LO4
0,
e9
LO5
0,
e10
1
1
1
1
1
0,Teambuilding
TB2
0,
e12
TB3
0,
e13
TB4
0,
e14
TB5
0,
e15
1
1
1
1
0,Conscientiousness
CN1
0,
e16
CN3
0,
e18
CN4
0,
e19
CN5
0,
e20
1
1
1
1
1
1
1
1

167
In the second step, the structural relationships between the OCB dimensions are
examined by comparing the proposed model (second-order construct) with two other
alternative models namely, the first-order and one-factor model. This comparison is
important as it provides an additional test for common method bias (Davvy, Kinick, &
Scheck, 1997). The following graphs (Figure 4.3) illustrate the models to be compared
with.
Figure 4.3: The Competing OCB Models
AL
1
1
1
1
1
1
LO
1
1
1
1
1
1
TB
1
1
1
1
1
CN
1
1
1
1
1
OCB
1
1
1
1
1
AL
1
1
1
1
1
1
LO
1
1
1
1
1
1
TB
1
1
1
1
1
CN
1
1
1
1
1
OCB
1
1
1
1
1
1
1
1
1
1
1
1
1
1
1
1
1
1
1
Second-order OCB First-order OCB One-factor OCB
Table 4.15: Comparative Fit Statistics & Indexes for Competing Models of OCB
χ2 df P<0.001 χ
2/df CFI RMSEA SRMR
Second-order OCB 335.618 132 0.000 2.543 0.967 0.069 0.042
First-order OCB 329.615 130 0.000 2.535 0.968 0.069 0.037
One-factor OCB 3961.196 135 0.000 29.342 0.379 0.296 0.167

168
As shown in Table 4.15 above, the worst overall fit is exhibited by the one-factor
model (χ2=3961.196, df=135, p<0.000, χ
2/df=29.342, CFI=0.379, RMSEA=0.296,
SRMR=0.167). In this case, the one-factor model is therefore rejected. When the
second- and first-order model is compared, it is seen that both of them yield near
identical GOF results. With a difference of 2 degree of freedoms (∆df), the chi-square
difference of ∆χ2=6.003 is not significant (p>0.001). Since both models produced
acceptable fit and there is no significant chi-square difference between the two, the
proposed (second-order) model is preferable in this study. The reasons are; the second-
order OCB is suggested by theoretical structure (Organ, 1988; LePine et al., 2002) and
using second-order model will increase the validity of the construct (Garver &
Mentzer, 1999; Byrne, 2001; Hair et al., 2006). Hence, on the bases of priori
theoretical status and construct validity of the scale, the second-order OCB is chosen to
be used in this study.
4.8 STRUCTURAL MODEL
Once the proposed model has been validated by the CFA, the model can now be tested
using SEM for hypotheses testing purposes. In this stage, the predictive validity is
considered achieved when the correlations (standardized regression weights or
structural regression coefficients, β) between the observed variables are substantial in
magnitude and statistically significant (Garver & Mentzer, 1999). Figure 4.4 exhibits
the structural model to be tested using SEM technique.

169
Figure 4.4: The Proposed Structural Model
The analysis of SEM on the proposed model has generated results which are illustrated
in Table 4.16 below. Except for the non-significant p-value, which is common when a
sample size is larger than 200 (Tickle et al., 2006), all of the other displayed fit indices
appeared to be superseding the cut-off values commonly suggested in the literature. As
such, it can be concluded that the fit of the proposed model is reasonably good.
Table 4.16: The Overall Fit of the Proposed Structural Model
χ2 df P<0.001 χ
2/df CFI RMSEA SRMR
Proposed Model 2395.610 970 0.000 2.470 0.904 0.067 0.058
Support at Work
Training
Reward System
Supervisory Assistance
OCB
-Altruism
-Loyalty
-Teambuilding
-Conscientiousness
Perceived
Service Quality
Performance Appraisals
The nature of employee job
orientation (direct or indirect
contact with customers)

170
4.8.1 HYPOTHESES TESTING
The results of structural coefficients exhibited in Figure 4.5 are now used to examine
hypotheses H1, H2, H3, H4, H5 and H6 below.
H1. Support at work has a significant relationship with OCB
The path that connects support at work to OCB yields a significant coefficient value of
0.269 (SE=0.027; C.R=4.478). In other words, support at work is significantly
correlated with employee OCBs. The results therefore supported H1.
H2. Training has a significant relationship with OCB
The link between training and OCB as shown in Figure 4.5 generated a coefficient
value of 0.069 and this is not significant at 0.001 (SE=0.018; C.R=1.636; p=0.102).
This means that training has no significant relationship with OCB. Hence, H2 is not
supported in this study.
H3. Reward system has a significant relationship with OCB
The coefficient value for the route from reward system to OCB is 0.194 (SE=0.031;
C.R=3.375). Thus, H3 is supported, indicating a significant relationship between
reward system and OCB.
H4. Supervisory assistance has a significant relationship with OCB
With a coefficient value of 0.393 the association between supervisory assistance and
OCB is deemed to be significant (SE=0.045; C.R=5.417). These data provide support
to H4.
171
H5. Performance appraisals have a significant relationship with OCB
As shown in Figure 4.5, the coefficient value that is produced between performance
appraisals and OCB is 0.221. This is a significant results (SE=0.027; C.R=3.863). In
effect, this path is also considered significant and as such supports H5.
In general, except for training (H2), all paths from service-based HRM practices to
OCB are significant, indicating supports to all the respective hypotheses (H1, H3, H4,
and H5). Among these significant paths, the highest coefficient values is scored by
supervisory assistance-OCB link (β=0.393) and the lowest one is shown by reward
system-OCB link (β=0.194). This result implies that among the observed service-based
HRM practices, the strongest predictor of OCB is supervisory assistance while the
weakest is reward system.
H6. OCB has a significant relationship with perceived service quality
The significant relationship between OCB and PSQ is revealed by the coefficient value
of 0.716. This value is also significant (SE=0.140; C.R=7.485). In short, there is
evidence to state that employee OCBs are a significant determinant of perceived
service quality. Hence, H6 is supported.
Hypothesis 7, 8, 9, 10 and 11 are predictions that concern with OCB as the mediating
variable. James, Mulaik, and Brett, (2006) assert that the goal of SEM in testing
mediation is “…to contrast alternative models and identify those that appear to offer
useful explanations versus those that do not” (p.243). For this purpose, the complete
mediation model is recommended to be taken as the focal or baseline parameter. The

172
reason is that in mediation test, the complete mediation model is the most parsimonious
mediation model and “parsimonious models are taken as the theoretical baselines in
science because they are the easiest to reject” (James et al., 2006, p. 240). With this
spirit, a partial mediation model is used as an alternative model. A complete mediation
is confirmed when the chi-square difference between the mediation and alternative
(partial mediation) model is not significant. The non-significant change difference
implies that the change which is made on the proposed model (complete mediation)
does not significantly add to the improvement of the model’s overall fit (Griffin, 1977;
Wang, Law, Hackett, Wang, & Chen, 2005; Saparito & Colwell, 2007).
The mediation test begins by first, obtaining the GOF measures of the proposed
complete mediation model. Next, for comparison purposes, direct lines that connect the
independent variables (SW, TR, RS, SA, and PA) to the dependent variable (perceived
service quality) are added in the existing model. This new structural model is called a
partial mediation model. The new overall fit generated by the partial mediation model
is then compared with the overall fit yielded earlier by the proposed model (complete
mediation model). The results of this mediation test are reported in Table 4.17.
Table 4.17: The Overall Fit of the Complete Mediation and Partial Mediation Model
χ2 df P<0.001 χ
2/df CFI RMSEA SRMR
Complete Mediation 2395.610 970 0.000 2.470 0.904 0.067 0.058
Partial Mediation 2392.801 965 0.000 2.480 0.903 0.068 0.058 Difference (∆) between
complete and partial
mediation models
2.809 5 0.000 0.010 0.001 0.001 0.000

173
As shown in Table 4.17, the fit of the partial mediation model generates very little
difference from that of the complete mediation model. To determine if the change is
significant, the difference in chi-square between both models is examined. For a chi-
square difference of 2.809, with 5 degrees of freedom, the associated p-value is not
significant (p=0.729). Thus, the additional paths created within the complete mediation
model do not cause any significant change to the overall fit of the original model. As
such, for parsimonious reason (James et al., 2006), the partial mediation model is
rejected and the complete mediation model which is proposed in this study is accepted.
For hypotheses testing purposes, Figure 4.5 provides the parameter estimates of the
related paths (the complete mediation model).

174
Figure 4.5: Parameter Estimates of the Related Paths
Support
at Work
SW5e5
11 SW4e4
1 SW3e3
1 SW2e2
1 SW1e1
1
Training
TR5e10
TR4e9
TR3e8
TR2e7
TR1e6
111111
Reward
System
RS5e15
RS4e14
RS3e13
RS2e12
RS1e11
111111
Performance
AppraisalsPA4e24
11 PA3e23
1 PA2e22
1 PA1e21
1
Altruism
AL1
e251
AL2
e261
AL3
e271
AL4
e281
AL5
e291
Loyalty
LO1
e301
LO2
e311
LO3
e321
LO4
e331
LO5
e341
Teambuilding
TB5
e38
1TB4
e37
1TB3
e36
1TB2
e35
1
Conscientiousness
CN5
e42
1CN4
e41
1CN3
e40
1CN1
e39
1
OCB
Supervisory
Assistance
SA5e20
SA4e19
SA3e18
SA2e17
SA1e16
111111
1 1
1 1
e431
Perceived
Service
Quality
PSQ1 e44
PSQ2 e45
PSQ3 e46
PSQ4 e47
11
1
1
1
e481
e49 e50
e51 e52
1 1
1 1
H7. OCB mediates the relationship between support at work and perceived service
quality
As shown in Figure 4.7, both direct effects of support at work on OCB (β=0.269) and
OCB on PSQ (β=0.716) are significant. Referring to the results of indirect effects
reported in the output of AMOS (Appendix), it is indicated that the indirect path which
connects support at work to PSQ through OCB is 0.193. Based on Sobel test
calculation (Soper, 2004), this indirect effect value is significant (Sobel test = 4.549).
Hence, with a significant magnitude of indirect coefficient value, OCB appears to be a
strong mediator, indicating a support to H7.
0.716*
0.269*
0.069
0.194*
0.393*
0.221*
175
H8. OCB mediates the relationship between training and perceived service quality
For a variable to be recognized as a mediator, one of the conditions is, a significant
effect must be established between independent and mediator variables (Baron &
Kenny, 1986). In this study, the results show that the direction from training to OCB is
found to be non significant (β=0.069, S.E=0.018, C.R=1.636, p=0.102) while the path
from OCB to PSQ is significant (β=0.716, S.E=0.140, C.R=7.485, p<0.001). Using
Baron and Kenny’s guideline, since the path from training (independent variable) to
OCB (mediator variable) is not significant, OCB as a mediator therefore is not
supported in this relationship. This non significant result is also supported by the
generated value of non-significant Sobel test (3.067). Hair et al. (2006) add that,
“Small indirect effects (i.e., less than 0.08) are rarely of interest and seldom add to the
substantive conclusions.” (p.870). In short, OCB does not mediate the relationship
between training and perceived service quality in this study. This result is further
confirmed by the non significant and trivial size of the indirect effect as shown in that
relationship. In sum, H8 is not supported.
H9. OCB mediates the relationship between reward system and perceived service
quality
With a significant coefficient value of 0.194 that is shown by the relationship between
reward system and OCB and 0.716 between OCB and PSQ, it is concluded that OCB
functions as the mediator in the relationship between reward system and PSQ. The
route from reward system to PSQ via OCB is represented by a significant coefficient
value of 0.139 (Sobel test = 3.960). As such, it is claimed that OCB is a significant
176
mediator in the relationship between reward system and PSQ. This means that H9 is
supported with a significant value of indirect effect.
H10. OCB mediates the relationship between supervisory assistance and perceived
service quality
As indicated in Figure 4.5 earlier, the paths between supervisory assistance and OCB
(β=0.393) and between OCB and PSQ (β=0.716) are both significant. The product of
those direct effects resulted a significant indirect effect of 0.282 (Sobel test = 4.413).
These findings confirm the significant role of OCB in mediating the relationship
between supervisory assistance and PSQ. Thus, H10 is supported.
H11. OCB mediates the relationship between performance appraisals and perceived
service quality
Finally, since both links that tie performance appraisals to OCB (β=0.221) and OCB to
PSQ (β=0.716) are significant, OCB then is again found to be playing a mediating role
here. The significant indirect effect of performance appraisals on PSQ (through OCB)
is 0.158 (Sobel test = 4.337). All these results conclude that OCB serves as a
significant mediator in the relationship between performance appraisals and PSQ.
Otherwise stated, H11 is supported with a significant magnitude of indirect effect.
All in all, the role of OCB as the mediator is strongest in the supervisory assistance-
PSQ link (β=0.282) and weakest in reward system-PSQ link (β=0.139). In conclusion,
this study has confirmed that except for the training-PSQ link, the effects of other

177
service-based HRM practices on the perceived service quality are mediated by the
OCB.
Finally, to examine the last hypothesis in this study (H12), the model is analyzed again
but this time, in two separate samples (non- and customer-contact employees). The
results of the model’s overall fit in both samples are displayed in Table 4.18 below.
Table 4.18: The Model’s Overall Fit in Non- and Customer-Contact Employee
Samples
χ2 df P<0.001 χ
2/df CFI RMSEA SRMR
Non-customer-
Contact Staff
(n=160)
2479.096 970 0.000 2.556 0.830 0.099 0.070
Customer-contact
Staff (n=160)
2169.894 970 0.000 2.237 0.829 0.088 0.073
H12. The nature of employee job orientation (direct or indirect contact with
customers) moderates the proposed model
Using the same SEM model structure, the fit that is produced in the non- and customer-
contact samples are somewhat similar as both of them achieved adequate fit (non-
customer-contact, CFI=0.830, RMSEA=0.099, SRMR=0.070; customer-contact,
CFI=0.829, RMSEA=0.088, SRMR=0.073). The results mean that although marginal,
the model fits quite well in both samples. Thus, it can be concluded that the model is
not moderated or affected by the nature of employee job orientation, in terms of
whether the employees interact directly or indirectly with customers in performing
their daily work. Hypothesis 12 is therefore not supported in this study.
178
4.9 ANSWERS TO RESEARCH QUESTIONS
Based on the results of hypotheses testing, all the research questions that have been
posed in Chapter 1 earlier are answered below;
6. Are service-based HRM practices significantly related to OCB?
Yes, except for training. Training is not related to OCB.
7. Which service-based HRM practice has the strongest and weakest effect on
OCB?
Among all of the examined service-based HRM practices, the strongest
predictor of OCB is supervisory assistance while the weakest is reward system
8. Is OCB significantly related to perceived service quality?
Yes.
9. Does OCB mediate the relationship between service-based HRM practices and
perceived service quality?
OCB does not mediate the link between training and perceived service quality
but it significantly mediates in all other links between service-based HRM
practices and perceived service quality.
10. Are the significance of the relationships among service-based HRM practices,
OCB and perceived service quality determined by the nature of employee job
orientations, namely non- and customer-contact employees?
No. The reason being the model is not moderated by the nature of employee job
orientation.

179
4.10 CONCLUSION
For a response rate of 48%, 325 cases are used to be the samples of the study. Based on
analyses of item-to-total correlations, Cronbach’s alpha and factor loadings (EFA),
three items are considered weak and therefore dropped from the scales. The assessment
of the sample size, values of skewness, kurtosis, Tolerance, VIF and visual inspection
of standardized residuals and scatterplots, provide evidence on the non-violation of the
several multivariate assumptions. The validity of the data is further determined by
subjecting them to CFA. Multiple fit indices are then examined and most of them
showed values that are above the minimum standards as prescribed in the literature.
The analyses of unidimensionality, construct reliability and validity are also positive
and overall, they have lent support to the compatibility of the proposed model with the
given data. Before the data are sent to SEM for hypotheses testing purposes, the test to
confirm OCB as a second order construct is performed. Based on theory and statistical
results, it has been decided that OCB is best conceptualized as a second-order construct
in the proposed model. Finally, using SEM, the paths in the structural model are
analyzed and the analyses have reported that three of the twelve hypotheses have not
been supported. These findings will be discussed further in the next chapter.

180
CHAPTER 5
DISCUSSION OF RESULTS AND CONCLUSION
5.1 INTRODUCTION
This chapter devotes to a summary and discussions of the twelve hypotheses tested
earlier. Limitations of the study and directions for future research will also be
highlighted and elaborated.
5.2 RESULTS OF HYPOTHESES
Although human resources have been recognized as a vital variable in the success of
sport businesses, exploration of human resource topic using empirical research is
relatively very little in the literature of sport management. Specifically, the nature of
service industry and its relations to the way human resources is managed has been
given little attention by researchers so far. How the incorporation between these two
elements lead to employee service related behaviours and subsequently influence
customers’ perceptions of service quality have never been examined. But most
importantly the question of how these relationships occur in a sport setting has never
been raised. Hence, for the purpose of enlarging the study of sport management,
particularly in the area of human resource management, the present study has tested
twelve hypotheses and the results are as follows:

181
Table 5.1: A Summary of Hypotheses Testing
Hypothesis
Number
Hypothesis Results
H1 Support at work has a significant relationship with OCB
Supported
H2 Training has a significant relationship with OCB
Not
Supported
H3 Reward system has a significant relationship with OCB
Supported
H4 Supervisory assistance has a significant relationship with
OCB
Supported
H5 Performance appraisals have a significant relationship with
OCB
Supported
H6 OCB has a significant relationship with perceived service
quality
Supported
H7 OCB mediates the relationship between support at work
and perceived service quality
Supported
H8 OCB mediates the relationship between training and
perceived service quality
Not
Supported
H9 OCB mediates the relationship between reward system and
perceived service Quality
Supported
H10 OCB mediates the relationship between supervisory
assistance and perceived service quality
Supported
H11 OCB mediates the relationship between performance
appraisals and perceived service quality
Supported
H12 The nature of employee job orientation (direct or indirect
contact with customers) moderates the proposed model
Not
Supported

182
5.3 DISCUSSIONS
The first five hypotheses are established based on the proposition that postulates the
existence of relationships between service-based HRM practices and OCB. Except for
training, all other service-based HRM practices are shown to be predictors of OCB.
The findings overall show similarities to Social Exchange Theory where people are
believed to behave in a way that reciprocates the treatment they receive from the
involving party. In other words, if employees perceive the organizations are treating
them well, they will return the kindness by performing their jobs well too. This service-
based HRM-OCB relationship however has never been examined by any previous
study. The current results therefore cannot be compared with any available literature.
The next proposition is about the spillover effect of OCB on the perceived service
quality. As reasoned out by Bienstock et al. (2003), OCB is a predictor of service
quality because this behaviour aids employees to entertain unpredictable customers in
unpredictable situations, provide important input to the management and refrain
themselves from creating unnecessary conflicts within the organization. The influence
of OCB on service quality has been confirmed in the contexts of restaurant (Walz &
Niehoff, 1996), insurance (Bell & Menguc, 2002), travel agencies (Yoon & Suh, 2003)
and retail banking (Castro et al., 2004). The main concern of this study is not to dispute
the strength of OCB in playing a significant role in the promotion of organizational
service quality, but to further validate its capability in the context of profit-oriented
sport organizations, a context in which OCB has never been studied before.

183
Consistent with the studies mentioned earlier, the result from hypothesis 6 concludes
that employees with high OCBs, described by this study as those who are always ready
to help (altruism), concerned with group performance (teambuilding), loyal to their
organization (loyalty) and conscientious (conscientiousness), are indicators of service
quality in golf clubs. In short, golf clubs is also a context where OCB functions as a
very influential factor in the achievement of high service quality.
In the study of HRM, a growing concern is voiced by many scholars regarding the
mechanism that ties HRM to organizational performance. Thus, hypotheses 7, 8, 9, 10,
and 11 offer to explain the underlying process that relates service-based HRM to
perceived service quality. The mediator that is proposed to exist in this relationship is
OCB.
Without the involvement of a mediating variable, it is actually unconvincing to relate
HRM practices to the outcome of the organizations such as the perceived service
quality. This however is no longer a problem because when the results of the present
study indicate the acceptance of the full mediated model rather than the partial
mediated model, the hypotheses that predict the significant role of OCB in the
relationships between service-based HRM practices and perceived service quality
(except for the training-service quality relationship) are supported. This means that,
there is indeed a significant relationship between HRM practices and service quality
except that the effects are not direct but indirect. Perhaps, that is the main reason why
previous studies often reveal significant but small sizes of coefficient values in the
regression of HRM and organizational performances. It is all because employee-related
184
behaviours receive the most immediate impacts of HRM practices before they are
transported to the perceived service quality. Hence, it is understandable to expect the
small but significant values of the direct effect of HRM practices on organizational
outcomes. The findings nevertheless cannot be compared with any past studies since to
date, this model has never been put forward by any research work before.
The final proposition has been made based on the idea that customer-contact
employees are the strategic core workforce of the firms. This idea has been conceived
after reviewing past service studies. The review observes that most of the studies
utilized customer-contact employees as their study samples. The reason given is that
customer-contact employees directly interact with customers and whatever feelings
they have towards their firms will have more effects on customers than those who
interact with customers indirectly. The result of the present study however does not
support this proposition.
On the other hand, the results are consistent with Schneider’s (1993) view that
considers all types of employees in the service industry, translate their attitudes
towards the treatment they receive from the organizations into their jobs, regardless of
whether they are dealing with customers or not. The rationale behind it is customers
observe every cue that is present during their service experiences. All the cues include
not only the physical interactions with employees but the interactions with the systems,
processes and the environment of the service firms. Such intangible interactions require
contributions from employees whose jobs not only related to entertaining customers
but everything else that is specified in the job descriptions, such as taking care of the

185
golf playing field, the cleanliness of the building and the clubs’ inventories. This
argument is also strengthened by the various service quality instruments available in
the literature, specifying facets of service quality that are related to the work
performance quality of both employee types.
In conclusion, except for the training aspect, this study has shown that service-based
HRM such as support at work, reward system, supervisory assistance and performance
appraisals affect employee OCBs and these in effect influence employee perceived
service quality. Hence, the model that proposes the mediating effects of OCB in the
relationship between service-based HRM variables and perceived service quality is
validated in the context of golf clubs.
5.4 IMPLICATIONS TO RESEARCH AND PRACTICE
The underlying theme of this research is that when employees’ commitments to
perform well are made easier by the management’s support in the form of favourable
support at work, reward system, supervisory assistance and performance appraisals,
“both employees and consumers are likely to react positively – that is, employees
should have feelings of satisfaction [in this context, OCB], not frustration, and so on;
customers should feel great about the quality of the service they receive” (Schneider,
1980, p. 54).
The major implication of this study is on the research development of sport
management study in the area of human resource management. As stated by Doherty
(1998) in her review of organizational behaviour in sport, “If the proportion of

186
literature that focused on OE [organizational effectiveness] is an indication, it would
seem that we know relatively little about OE, including the contribution of human
resources [in sport]” (p.18). The author has suggested more sport related research to be
conducted using an HRM framework. Except for a very few number of studies (e.g.,
Dixon, 2002; Taylor & Ho, 2005), empirical evidence related to HRM in sport
organizations is extremely limited. Therefore, besides benefiting human resources
managers of sport organizations in heightening their organizational performances, this
study also advances the theory of sport management in the aspect of human resource
management.
Furthermore, it has been acknowledged in the HRM literature that empirical evidence
is lacking on the HRM-performance relationship within a customer-focused setting
(Schneider, 1994, 2004; Morrison, 1996). Hence, apart from addressing this HRM-
customer-focused relationship issue, this study provides an understanding of the
mediating process through which HRM practices might have an impact on
performance. By investigating the efficacy of HRM practices in promoting the quality
of services through OCB as the mediating property, this study therefore helps to
expand the HRM theory through the sport management literature.
Most HRM researchers have utilized heavily tested HRM scales such as high
commitment (Walton, 1985), high-involvement (Lawler, 1992), and high performance
work system (Becker & Huselid, 1998) in their studies. Wood, De Menezes, & Lasaosa
(2003) have noted that these scales which have been interchangeably termed by various
scholars actually refer to an HRM system which involves “flexible job assignments,

187
rigorous and selective staffing, extensive training and development, developmental and
merit-based performance appraisal, competitive compensation, and extensive benefits”
(Takeuchi, Lepak, Wang, & Takeuchi, 2007, p. 1069).
However, despite these seemingly effective measures of HRM, many HR managers are
still relatively uninformed on which HR activities to be practiced within their
organizations (Kane, Crawford, & Grant, 1999; Kaye, 1999; Hsu & Leat, 2000;
Gratton & Truss, 2003) especially those that concern with developing employees of
high OCBs. In relation to this scaling issue, this present study suggests measures of
service-based HRM concept based on the conceptualization of HRM practices that
have been used in service research (e.g., Schneider & Bowen, 1985; Tornow & Wiley,
1990; Wiley, 1991; Jackson & Schuler, 1992; Johnson, 1996; Lytle et al., 1998;
Schneider et al., 1998; Rogg et al., 2000; Yoon et al., 2001) and utilize the measures to
gauge service-based HRM in golf clubs, a business context which has never been study
hitherto. Hence, by employing a new combination of service-based HRM practices to
represent service-oriented HRM, this study has contributed upon existing literature on
the conceptualization of HRM for service industry, particularly those operating in the
context of sport environment.
In addition, despite the fact the human resources have more potential than other
organizational resources to be the major source of competitive advantage (Resource-
based theory), human resources have always been the first to be targeted at when the
organizations decide to minimize operational costs. One of the factors attributed to this
phenomenon is the assumption that employees are often ineffective resources and

188
therefore they have frequently become the “unnecessary source of costly overhead”
(Bowen & Greiner, 1986, p. 35). This is evidence when challenged by difficult
financial situations, most firms resort to retrenchment of manpower as one of their
immediate actions. Based on the results of the current study, this retrenchment strategy
can be considered especially detrimental because it has been shown that employees’
behaviours connect the chain that links organizations to customers.
It is also revealed in this study that there is a significant and positive relationship
between employee OCBs and customer perceived service quality (β=0.716). This
means that the levels of employee OCBs go hand in hand with the levels of the
perceived service quality. The finding supports the contention that whatever employees
feel towards their jobs and organizations will be mirrored to customers. Otherwise
stated, when employees are satisfied, customers will also be satisfied and vice versa..
It has been well established in the literature that OCB is a voluntary or discretionary
behaviour which is not stated or written in the employee job descriptions. Although the
demonstration of this behaviour is not formally required by the organizations, it is
highly important in the achievement of organizational competitive advantage.
According to previous organizational behaviour research, high level of OCB exists in
an employee who is satisfied with the job-related treatment received from his or her
organization. As shown by this study, employee satisfactions which subsequently
stimulate their levels of OCBs are resulted from the ways employees are managed
specifically in terms of the provisions of positive support at work, reward system,
supervisory assistance and performance appraisals. The significant connections from

189
these variables to OCB and OCB to customer perceived service quality provide reasons
for HR managers to assert the importance of human resources in the generation of
profits for the organizations.
Perhaps, with such a strong support of the associations between the observed HRM
variables and service quality outcome, it is timely for the HR managers to justify their
roles in the strategic development of organizations. As employees are evidently critical
determinants of service quality, their needs and wants require deserving attention and
resources from the top management of the organization. Hence, if the organizations
intend to improve the current level of service quality, the management should pay more
attention to the present practices of HRM with regard to support at work, reward
system, supervisory assistance, and performance appraisals. For example, based on the
current states of employee support at work, the management may want to allocate more
relevant equipment and machineries to employees or allowing more flexibility in the
employee work designs.
Contrary to the findings typically found in the literature, training is found to have no
significant relationship with employee OCBs (p=0.102). The small value of regression
coefficient leads to a non-significant indirect effect of training on service quality
(β=0.049). According to Elmadağ et al. (2008), there are two reasons that might cause
such findings. One is the domination of high experienced employees in the samples
and two, the quality of training might be perceived as ineffective by the participating
employees. Should these two factors are eliminated from the study, there is high
likelihood for the relationship to be significant. After all, based on most previous

190
research, the relationship between training and service-related outcomes is most often
than not, found to be significant (e.g., Wiley, 1991; Lux et al., 1996; Rogg et al., 2001;
Strong & Harris, 2004; Tsaur & Lin, 2004; Yoo & Park, 2007).
The implication for HR managers with regard to this non-significant finding is to be
aware of the quality of the training provided to employees. Once they are perceived as
ineffective by employees, the expected positive impacts of training on perceived
service quality will not be materialized. In essence, it is always good to make
continuous evaluations on the contents of the training so that it is deemed to be
meaningful to employees. Employees’ perceptions of training is critical because based
on prior empirical studies, this factor influences the achievement of positive customer
perceptions of service quality.
Another implication that can be made from this study is the result regarding the non-
moderating effect of the nature of employee job orientations in the proposed model.
Using the concept introduced by Delery and Shaw (2001), only customer-contact
employees (the strategic core workforce) will significantly connect service-based HRM
practices to service quality (through OCB). When the results show no moderation, that
means that regardless of whether the employees are directly or indirectly in contact
with customers, the model is valid in both samples. This also shows that in sport
organizations such as golf clubs, the strategic core workforce includes both types of
employees, non- and customer-contact employees. Further, in order to enhance the
service quality, the firms have to improve the levels of OCBs among all of their non-
executive employees, without discriminating whether they are non- or customer-

191
contact employees. The improvement can be done by implementing service-based
HRM strategies through aspects of support at work, reward system, supervisory
assistance and performance appraisals.
Based on the moderation finding revealed in this study, the Schneider and Bowen’s
(1993) idea to suggest the embracement of service culture to all employees is
particularly legitimate in this context. This points out to the fact that all employees,
regardless whether they are in direct or indirect contact with customers, evidently
require the sort of management which is focused towards a climate for employee well-
being (service-based HRM). That is because, as disclosed by this study, service-based
HRM practices (i.e., support at work, reward system, supervisory assistance and
performance appraisals) have the elements that can foster high OCBs among those
employees and these particular behaviours have been found to be facilitative in the
attainment of favourable customer perceptions of service quality.
The clerks for example, although they do not have direct interactions with customers
such as those staff at the registration counter, also need to be convinced that they have
been treated well by the management. Through aspects of support at work, reward
system, supervisory assistance and performance appraisals, the management can
communicate to these clerks that the emphasis of the HRM is on their well-being. As
soon as this aspiration is well-perceived by the clerks, there is a high tendency for them
to repay the management’s kindness by demonstrating above-average work
performances. As theorized and supported in numerous research works, employee

192
performances will influence the efficiency of the firms’ administrations which in
corollary affect the customers’ perceptions of service quality.
In the opposite scenario, employees who are dissatisfied with the way they are
managed will likely to have low levels of OCBs. Previous studies have suggested that
low levels of OCB employees will have no or little inclinations to do things more than
what they are expected to do. So, when this happens, the paper works that are needed
to be done in time for example, will not be materialized efficiently by these low OCB
clerks. As a result of the mediocre level of paper work preparations, the relevant
outcomes such as golf competition events would be just other ordinary events with
below or average level of performances. Competitive advantage as desired by all
companies will definitely not be attained by the firms that have low OCB employees.
In short, this particular finding suggests that the strategic core workforce of golf clubs
includes both types of employees namely non- and customer-contact employees. As
such, in order to promote high service quality, the sport managers are recommended to
plan for service-based HRM strategies (i.e., support at work, reward system,
supervisory assistance and performance appraisals) to be implemented on both of these
groups of employees.

193
5.5 LIMITATIONS AND DIRECTIONS FOR FUTURE RESEARCH
Although the study has accomplished the stated objectives, the generated findings must
be interpreted in the lights of several limitations. First, it is conducted in a specific
setting. While implications can be made, the generalizability of the results must be
viewed within the context of this study (i.e., golf clubs). Further validation of the
model is required to verify the existence of relationships in a different contextual
environment such as tourism, education or telecommunication industry.
Based on the review made by Dean (2004), the results of studies that test the causal
chain from customer’s experience to the ultimate organizational measures, particularly,
financial outcome, have been mixed. This means, there is a possibility that in this case,
the outcome of service evaluation that has been used as the dependent variable in this
study, may not be able to imply anything on the bottom line performance of the
organization. Failure to relate the perceived service quality with the ultimate indicator
of the organization’s performance, such as the financial outcome, is the second
limitation of this study. Cautions therefore are required when perceived service quality
is generalized as the potential property in affecting the profitability of an organization.
In short, further studies should be performed to confirm the link between customer
perceived service quality and the ultimate performance indicators of sport
organizations (i.e., financial outcomes).
Specific facets of service-based HRM and OCB have been selected for the study
because of their significant relevance to service quality as shown by previous research.
As the third limitation in this study, it is possible that other facets of service-based

194
HRM and OCB can produce the same results. Continuous research efforts must be
carried out to explore the mediating effect of OCB with the combination of other
relevant dimensions (i.e., loyalty, sportsmanship) in the link between other facets of
service-based HRM (i.e., recruitment/selection) and service quality.
The fourth limitation concerns with the use of OCB as the second-order construct in
this study. Although this method is consistently adopted in many past studies,
individual examination of the mediating effect of each OCB dimension would allow
for greater understanding and explanation of the relationships among the observed
variables in the model. Therefore, it is advisable that future studies enrich the
understanding by explaining which OCB dimension has the strongest/weakest
mediating effect on the relationships between variables of service-based HRM and
service quality.
The final limitation is pertaining to the study samples which are dominated by senior
employees. Using Elmadağ et al.’s (2008) justification, the domination of samples by
this type of employees is given as the most probable reason for the non-significant
relationship that is found between training and perceived quality. The same pattern of
results seems to be produced when the same characteristic of samples is presence
(majority of respondents are senior employees). Thus, there is basis to believe that
employee tenure may have a significant role in the relationship between HRM
practices (i.e., training) and employee behaviours. Future research are therefore
suggested to explore this intuition further.

195
5.6 CONCLUSION
Sport managers have realized that there are certain limitations to the inputs of
technology, however advanced. With enough money, any organization can acquire
highly sophisticated facilities. But only those that possess workforce with the proper
behaviours will be able to utilize the hi-tech resources and generate revenue from them.
Ultimately, it is the employees who are going to make a difference between success
and failure in the sport business.
This study has shown that service organizations can achieve excellent level of service
quality by ensuring that their employees are satisfied with the way they are managed
specifically in the aspects related to support at work, reward system, supervisory
assistance and performance appraisals. Once these aspects of HRM are perceived by
employees as beyond and above satisfactory, they will reciprocate by exhibiting OCBs
which in turn enhance the level of service quality as perceived by customers. Although
further research are needed to refine the study framework, this research serves as an
initial inquiry for sport management scholars in their efforts to explain the underlying
process that relate HRM practices to sport organizational performances.
To sum up, the first purpose of this study is to propose a model that depicts OCB as the
mediator in the relationship between service-based HRM and perceived service quality.
This particular model is predicted to be moderated by the nature of employee job
orientation. The first task of this study has been accomplished when, based on the
extensive review of literature, a model designed to achieve the first aim of this study is
developed and introduced in Chapter 2.

196
The second main purpose of this study is to validate the developed model in the context
of golf clubs. After undergoing data analysis procedures and hypotheses testing using
SEM technique, the results have shown that the model fits well with the collected data.
This implies that, in the context of golf clubs, (except for training) OCB is found to be
a strong mediator in the relationship between service-based HRM practices and
perceived service quality and these relationships are relevant among all non-executive
employees (regardless of the nature of their job interactions – direct or indirect
interactions with customers). With the revelation of these findings, the second aim of
this study has been fulfilled and the study is therefore complete.

197
REFERENCES
Abdullah, F. (2005). The Development of HEdPERF: A New Measuring Instrument of
Service Quality for the Higher Education Sector. International Journal of
Consumer Studies, 30(6), 569-581.
Acquaah, M. (2004). Human Factor Theory, Organizational Citizenship Behaviors and
Human Resources Management Practices: An Integration of Theoretical
Constructs and Suggestions for Measuring the Human Factor. Review of Human
Factor Studies, 10(1), 118-151.
Ahire, S. L., & Devaraj, S. (2001). An Empirical Comparison of Statistical Construct
Validation Approaches. IEEE Transactions on Engineering Management,
48(3), 319-329.
Albrecht, K., & Zemke, R. (1985). Service America!, Doing Business in the Service
Economy. Homewood, IL: Dow Jones-Irwin.
Aldrich, H. E. & Herker, D. (1977). Boundary-spanning Roles and Organizational
Structure. Academy of Management Review, 2, 217-230.
Allen, T. D., & Rush, M. C. (1998). The Effects of Organizational Citizenship
Behavior on Performance Judgments: A Field Study and a Laboratory
Experiment. Journal of Applied Psychology, 83(2), 247-260.
Allred, A.T. (2001), Employee evaluations of service quality at banks and credit
unions, International Journal of Bank Marketing, 19(4), 179-85.
Ambler, T. (1999). Where Does the Cash Flow from? Journal of Marketing
Management, 15, 705-710.
Anderson, E. W., & Sullivan, M. W. (1993). The Antecedents and Consequences of
Customer Satisfaction for Firms. Marketing Science Institute Report, 12(2),
125-143.
Anderson, J. C., & Gerbing, D. W. (1988). Structural Equation Modeling in Practice: A
Review and Recommended Two-Step Approach. Psychological Bulletin,
103(3), 411-423.
Anderson, J. R. (2005). Managing Employees in the Service Sector. A Literature
Review and Conceptual Development. Journal of Business and Psychology,
20(4), 501-523.
Arcelay, A., Sánchez, E., Hernández, L., Inclán, G., Bacigalupe, M., Letona, J., et al.
(1999). Self-Assessment of All the Health Centres of a Public Health Service
through the European Model of Quality Management. International Journal of
Health Care Quality Assurance, 12(2), 54-58.
Armistead, C., & Kiely, J. (2003). Creating Strategies for Managing Evolving
Customer Service. Managing Service Quality, 13(2), 164-170.
Armstrong, M. (2006). A Handbook of Human Resource Management Practice (10th
ed.). London: Kogan Page Publishers.
Arthur, J. B. (1994). Effects of Human Resource Systems on Manufacturing
Performance and Turnover. Academy of Management Journal, 37, 670-687.
Ary, D., Jacob, L. C., & Razavieh, A. (1996). Introduction to Research in Education
(5th ed.). London: Harcourt Brace.
Aryee, S., Budhwar, P. S., & Chen, Z. X. (2002). Trust as a Mediator of the
Relationship between Organizational Justice and Work Outcomes: Test of a
Social Exchange Model Journal of Organizational Behavior, 3, 267-285.

198
Asubonteng, P., McCleary, K., & Swan, J. (1996). SERVQUAL Revisited: A Critical
Review of Service Quality. Journal of Services Marketing, 10(6), 62-81.
Aubert, B., Rivard, S., & Patry, M. (1996). Development of Measures to Assess
Dimensions of IS Operation Transactions. Omega, 24(6), 661-680.
Bagozzi, R. P. (1980). Causal Models in Marketing. New York, NY: John Wiley &
Sons.
Bagozzi, R. P., & Baumgartner, H. (1994). The Evaluation of Structural Equation
Models and Hypothesis Testing. In R. Bagozzi (Ed.), Principles of Marketing
Research (pp. 386-422). Oxford: Blackwell Business.
Banker, R. D., Lee, S., Potter, G., & Srinivasan, D. (1996). Contextual Analysis of
Performance Effects of Outcome-Based Incentive Compensation. Academy of
Management Journal, 39(4), 920-948.
Barker, R. L. (Ed.). (1999). The Social Work Dictionary (4th ed.). Washington, DC:
NASW Press.
Barney, J. (1991). Firm Resources And Sustained Competitive Advantage. Journal of
Management Studies, 17(1), 99-120.
Baron, R. M., & Kenny, D. A. (1986). The Moderator-Mediator Variable in Social
Psychological Research: Conceptual, Strategic, and Statistical Considerations.
Journal of Personality and Social Psychology, 51(6), 1173-1182.
Barron, J., Black, D. A., & Loewenstein, M. (1987). Employer Size: The Implications
for Search, Training, Capital, Investment, Starting Wages, and Wages Growth.
Journal of Labor Economics, 5(1), 76-89.
Bartel, A. P. (1994). Productivity Gains from the Implementation of Employee
Training Programs. Industrial Relations Review, 33, 411-425.
Bartel, A. P. (2004). Human Resource Management and Organizational performance:
Evidence from Retail Banking. Industrial and Labor Relations Review, 57(2),
181-204.
Bartlett, J. E., Kotrlik, J. W., & Higgins, C. (2001). Organizational Research:
Determining Appropriate Sample Size for Survey Research. Information
Technology, Learning, and Performance Journal, 19(1), 43-50.
Batt, R. (1999). Work Organization, Technology, and Performance in Customer
Service and Sales. Industrial and Labor Relations Review, 52(4), 539-564.
Batt, R. (2002). Managing Customer Services: Human Resource Practices, Quit Rates,
and Sales Growth. Academy of Management Journal, 45(3), 587-597.
Bau, F., & Dowling, M. (2007). An Empirical Study of Reward and Incentive Systems
in Germany Enterpreneurial Firms. Schmalenbach Business Review, 59, 160-
175.
Bauer, H., Sauer, N., & Schmitt, P. (2005). Customer-Based Brand Equity in the Team
Sport Industry: Operationalization and Impact on the Economic Success of
Sport Teams. European Journal of Marketing, 39(5/6), 496-513.
Becker, B., & Gerhart, B. (1996). The Impact of Human Resource Management on
Organizational Performance: Progress and Prospects. Academy of Management
Journal, 39(4), 23-41.
Becker, B. E., & Huselid, M. A. (1998). High Performance Work Systems and Firm
Performance: A Synthesis of Research and Managerial Implications. In G. R.
Ferris (Ed.), Research in Personnel and Human Resource Management (Vol.
16, pp. 53-101). Greenwich, CT: JAI Press.

199
Behling, O., & Law, K. S. (2000). Translating Questionnaires and Other Research
Instruments. Thousand Oaks, CA: Sage Publications, Inc.
Bell, S. J., & Menguc, B. (2002). The Employee-organization Relationship,
Organizational Citizenship Behaviors, and Superior Service Quality. Journal of
Retailing, 78(2), 131-146.
Belsley, D. A., Kuh, E., & Wiklund, I. (1980). Regression Diagnostics: Identifying
Influential Data and Source of Collinearity. New York: Wiley.
Bennis, W. G. ((1970). Beyond Bureaucracy. In W. G. Bennis (Ed.), American
Bureaucracy (pp. 3-16). Chicago: Aldine.
Benoy, J. W. (1996). Internal Marketing Builds Service Quality. Journal of Health
Care Marketing, 16(1), 54-59.
Bentler, P. M. (1990). Comparative Fit Indexes in Structural Models. Psychological
Bulletin, 107, 238-246.
Bentler, P. M., & Chou, C. P. (1987). Practical Issues in Structural Modeling.
Sociological Methods and Research, 16(1), 78-117.
Berry, L. L., Parasuraman, A., & Zeithaml, V. (1994). Improving Service Quality in
America: Lesson Learned. Academy of Management Executive, 8(2), 32-52.
Berry, L. L., Parasuraman, A., & Zeithaml, V. A. (1988). The Service Quality Puzzle.
Business Horizons, September-October, 35-43.
Bettencourt, L. A., & Brown, S. W. (1997). Contact Employee: Relationships among
Workplace Fairness, Job Satisfaction And Prosocial Service Behaviors. Journal
of Retailing, 73(1), 39-61.
Bettencourt, L. A., Gwinner, K. P., & Meuter, M. L. (2001). A Comparison of Attitude,
Personality, and Knowledge Predictors of Service-Oriented Organizational
Citizenship Behaviors. Journal of Applied Psychology, 86(1), 29-41.
Bienstock, C. C., De Moranville, C. W., & Smith, R. K. (2003). Organizational
Citizenship Behavior and Service Quality. Journal of Services Marketing,
17(4), 357-378.
Bitner, M. J. (1990). Evaluating Services Encounters: The Effects Of Physical
Surroundings And Employee Responses. Journal of Marketing, 54, 69-82.
Bitner, M. J., Boom, B. H., & Tetreault, M. S. (1990). The Service Encounter:
Diagnosing Favorable and Unfavorable Incidents. Journal of Marketing, 54,
71-84.
Bitner, M. J., Booms, B. H., & Mohr, L. A. (1994). Critical Service Encounters - The
Employees Viewpoint. Journal of Marketing, 58(4), 95-106.
Blau, P. (1964). Exchange and Power in Social Life. New York: Wiley.
Bohrnstedt, G. (1983). Measurement. In P. Rossi, J. Wright & A. Anderson (Eds.), A
Handbook of Survey Research (pp. 57-65). San Diego, CA: Academy Press.
Bojanic, D. C., & Rosen, L. D. (1994). Measuring Service Quality in Restaurants: An
Application of the Servqual Instrument. Journal of Hospitality & Tourism
Research, 18(1), 3-14.
Bolino, M. C. (1999). Citizenship and Impression Management: Good Soldiers or
Good Actors. Academy Management Review, 24(1), 82-98.
Bolino, M. C., & Turnley, W. H. (2003). Going the Extra Mile: Cultivating and
Managing Citizenship Behavior in Organizations. Academy of Management
Executive, 17, 60-71.

200
Bollen, K. A. (1989). Structural Equations with Latent Variables. Wiley-Interscience
Publication.
Bollen, K. A., & Long, J. S. (1993). Testing Structural Equation Models. Newbury
Park, CA: Sage Publications.
Borman, W. C., & Motowidlo, S. J. (1993). Expanding the Criterion Domain to Include
Elements of Contextual Performance. In W. C. Schmitt & A. Borman (Eds.),
Personnel Selection in Organizations (pp. 71-98). San Francisco, CA: Jossey-
Bass.
Borman, W. C., White, L. A., & Dorsey, D. W. (1995). Effects of Ratee Task
Performance and Interpersonal Factors on Supervisor and Peer Performance
Ratings. Journal of Applied Psychology, 80, 168-177.
Boswell, W. R., & Boudreau, J. W. (2002). Separating the Developmental and
Evaluative Performance Appraisal Uses. Journal of Business and Psychology,
16, 391-412.
Bovee, C., Thill, J., Wood, M., & Dovel, G. (1993). Management. New York, NY:
McGraw-Hill.
Bowen, D. E. (1990). Interdisciplinary Study of Service: Some Progress, Some
Prospects. Journal of Business Research, 20, 71-79.
Bowen, D. E., & Greiner, L. E. (1986). Moving from Production to Service in human
Resources Management. Organizational Dynamics, 15(1), 35 - 46.
Bowen, D. E., & Hallowell, R. (2002). Suppose We Took Service Seriously? An
Introduction to the Special Issue. Academy of Management Executive, 16(4),
69-72.
Bowen, D. E., & Johnston, R. (1999). Internal Service Recovery: Developing a New
Construct. International Journal of Service Industry Management, 10(2), 118-
131.
Bowen, D. E., & Ostroff, C. (2004). Understanding HRM - Firm Performance
Linkages: The Role of the "Strength" of the HRM System. Academy of
Management Review, 29(2), 203-221.
Bowen, D. E., & Schneider, B. (1985). Boundary Spanning Role Employees and the
Service Encounter: Some Guidelines for Management Research. In J. A.
Czepiel, M. R. Soloman & C. F. Surprenant (Eds.), The Service Encounter.
Lexington, MA: Lexington Books.
Bowen, D. E., Schneider, B., & Kim, S. (2000). Shaping Service Cultures through
Strategic Human Resource Management: Handbook of Services Marketing.
Beverly Hills, CA: Sage Publications.
Bowen, J., & Ford, R. C. (2002). Managing Service Organizations: Does Having a
"Thing" Make a Difference? Journal of Management Studies, 28(3), 447-469.
Brady, M. K., & Cronin Jr., J. J. (2001). Some New Thoughts on Conceptualizing
Perceived Service Quality: A Hierarchical Approach. Journal of Marketing, 65,
34-39.
Brady, M. K., Cronin Jr., J. J., & Brand, R. (2002). Performance-Only Measurement of
Service Quality: A Replication and Extension. Journal of Business Research,
55(1), 17-31.
Bratton, J., & Gold, J. (2003). Human Resource Management: Theory and Practice (3rd
ed.). New York, NY: Palgrave Macmillan.

201
Brief, A. P., & Motowidlo, S. J. (1986). Prosocial Organizational Behaviors. Academy
of Management Review, 11, 710-725.
Brislin, R. (1970). Back-Translation for Cross-Cultural Research. Journal of Cross-
Cultural Psychology, 1, 185-216.
Brislin, R. W., Lonner, W. J., & Thorndike, R. M. (1973). Cross-Cultural Research
Methods. New York: John Wiley.
Brown, A. (1994). TQM: Implications for Training. Training for Quality, 2(3), 4-10.
Brown, C. S., & Sulzer-Azaroff, B. (1994). An Assessment of the Relationship
between Customer Satisfaction and Service Friendliness. Journal of
Organizational Behavior Management, 14(2), 55-75.
Brown, S. W., & Swartz, T. A. (1989). A Gap Analysis of Professional Service Quality
Journal of Marketing, 53, 92-98.
Brown, T. A. (2006). Confirmatory Factor Analysis for Applied Research. New York,
NY: The Guildford Press.
Brown, T. J., Churchill, G. A. J., & Peter, J. P. (1993). Improving the Measurement of
Service Quality. Journal of Retailing, 69(1), 127-139.
Browne, M. W., & Cudeck, R. (1992). Alternative Ways of Assessing Model Fit.
Sociological Methods and Research, 21, 230-258.
Browning, V. (2006). The Relationship between HRM Practices and Service Behaviour
in South African Service Organizations. International Journal of Human
Resource Management, 17(7), 1321-1338.
Bryman, A., & Cramer, D. (2001). Quantitative Data Analysis with SPSS Release10
for Windows. London: Routledge.
Burt, R. S. (1976). Interpretational Confounding of Unobserved Variables in Structural
Equation Models. Sociological Methods and Research, 5(1), 3-52.
Byars, L. L., & Rue, L. W. (2003). Human Resource Management (International
edition ed.). New York: McGraw-Hill.
Byrne, B. M. (2001). Structural Equation Modeling with AMOS: Basic Concepts,
Applications and Programming. New Jersey: Lawrence Erlbaum Associates
Inc.
Campbell, D. T., & Fiske, D. W. (1959). Convergent and Discriminant Validation by
the Multitrait-Multimethod Matrix. Psychological Bulletin, 56(1), 81-105.
Campbell, J. (1989). An Agenda for Theory and Research. In I. Goldstein (Ed.),
Training and Development in Organizations. San Fransisco, CA: Jossey-Bass.
Campbell, M. (1994). The Encyclopaedia of Golf. London: Dorling Kindersley.
Carmines, E., & McIver, J. P. (1981). Analyzing Models with Unobserved Variables:
Analysis of Covariance Structures. In G. Bohrnstedt & E. Borgatta (Eds.),
Social Measurement: Current Issues (pp. 65-115). Beverly Hills, CA: Sage
Publications, Inc.
Castro, C. B., Armario, E. M., & Ruiz, D. M. (2004). The Influence of Employee
Organizational Citizenship Behavior on Customer Loyalty. International
Journal of Service Industry Management, 15(1), 27-53.
Cha, E., Kim, K. H., & Erlen, J. A. (2007). Translation of Scales in Cross-Cultural
Research: Issues and Techniques. Journal of Advanced Nursing, 58(2), 1-10.
Chandon, J., Leo, P., & Philippe, J. (1997). Service Encounter Dimensions - A Dyadic
Perspective: Measuring the Dimensions of Service Encounters as Perceived by

202
Customers and Personnel. International Journal of Service Industry
Management, 8 (1), 65-86.
Chang, C., Chen, C., & Hsu, C. (2002). A Review of Service Quality in Corporate and
Recreational Sport/Fitness Programs. The Sport Journal, 5(3), 1-10.
Chang, K., & Chelladurai, P. (2003a). Comparison of Part-time Workers and Full-time
Workers: Commitment and Citizenship Behaviors in Korean Sport
Organizations. Journal of Sport Management, 17, 394-416.
Chang, K., & Chelladurai, P. (2003b). System-Based Quality Dimensions in Fitness
Services: Development of the Scale of Quality. The Service Industries Journal,
23(5), 65-83.
Chau, P. Y. K. (1997). Reexamining a Model for Evaluating Information Center
Success Using a Structural Equation Modeling Approach. Decision Sciences,
28(2), 309-334.
Chebat, J., Babin, B., & Kollias, P. (2002). What Makes Contact Employees Perform?
Reactions to Employee Perceptions of Managerial Practices. International
Journal of Bank Marketing, 20(7), 325-332.
Chelladurai, P. (1994). Sport Management: Defining the Field. European Journal of
Sport Management, 1, 7-21.
Chelladurai, P. (1999). Human Resource Management in Sport and Recreation.
Champaign, IL: Human Kinetics.
Chelladurai, P. (2006). Human Resource Management in Sport and Recreation (2nd
ed.). Champaign, IL: Human Kinetics.
Chelladurai, P., Scott, F. L., & Haywood-Farmer, J. (1987). Dimensions of Fitness
Services: Development of a Model. Journal of Sport Management, 1(2), 159-
172.
Chen, X., Hui, C., & Sego, D. J. (1998). The Role of Organizational Citizenship
Behavior in Turnover: Conceptualization and Preliminary Tests of Key
Hypotheses. Journal of Applied Psychology, 83, 922-931.
Cheng, E. (2001). SEM Being More Effective than Multiple Regression in
Parsimonious Model Testing for Management Development Research. Journal
of Management Development, 20(7), 650-667.
Cheung, C., & Law, R. (1998). Hospitality Service Quality and the Role of
Performance Appraisal. Managing Service Quality, 8(6), 402-406.
Choi, K., Lee, H., Kim, C., & Lee, S. (2005). The Service Quality Dimensions and
Patient Satisfaction Relationships and South Korea: Comparisons across
Gender, Age, and Types of Service. Journal of Service Marketing, 19(3), 140-
149.
Chou, C., & Chang, P. (2004). Core Competence and Competitive Strategy of the
Taiwan Shipbuilding Industry: A Resource-Based Approach. Maritime Policy
& Management, 31(2), 125-137.
Church, A. H. (1995). Linking Leadership Behaviors to Service Performance: Do
Managers Make a Difference? Managing Service Quality, 5(6), 26-31.
Churchill, G., & Iacobucci, D. (2002). Marketing Research, Methodological
Foundations (8th ed.). London: Harcourt Publishing.
Churchill, G. A. (1979). A Paradigm for Developing Better Measures of Marketing
Constructs. Journal of Marketing Research, 16, 64-73.
203
Clark, C. S., Dobbins, G. H., & Ladd, R. T. (1993). Exploratory Field Study of
Training Motivation: Influences of Involvement, Credibility, and Transfer
Climate. Group and Organization Management, 18(3), 292-307.
Coakes, S. J., & Steed, L. G. (2003). SPSS Analysis without Anguish Version 11.0 for
Windows. Australia: John Wiley & Sons.
Coff, R. W. (1997). Human Assets and Management Dilemmas: Coping with Hazards
on the Road to Resource-Based Theory. Academy of Management Review,
22(2), 374-402.
Colbert, B. A. (2004). The Complex Resource-Based View: Implications for Theory
and Practice in Strategic Human Resource Management. Academy of
Management Review, 29(3), 341-358.
Cooper, D. R., & Schindler, P. S. (2003). Business Research Methods. New York, NY:
McGraw-Hill.
Corcoran, K. J., Petersen, L. K., Baitch, D. B., & Barret, M. F. (1995). High
Performance Sales Organizations: Creating Competitive Advantage in the
Global Marketplace. Chicago: Irwin.
Coulthard, L. J. M. (2004). Measuring Service Quality - A Review and Critique of
Research Using SERVQUAL. International Journal of Market Research, 46(4),
479-497.
Creswell, J. W. (2002). Research Design: Qualitative, Quantitative and Mixed Method
Approaches (2nd ed.). Thousand Oaks, CA: Sage Publications.
Cronin, J. J., & Taylor, S. A. (1992). Measuring Service Quality: A Reexamination and
Extension. Journal of Marketing, 56, 55-68.
Dabholkar, P. A. (1993). Customer Satisfaction and Service Quality: Two Constructs
or One? In D. W. Cravens & P. Dickson (Eds.), Enhancing Knowledge
Development in Marketing (Vol. 4, pp. 10-18). Chicago, IL: American
Marketing Association.
Dabholkar, P. A., & Overby, J. W. (2005). Linking Process and Outcome to Service
Quality and Customer Satisfaction Evaluations: An Investigation of Real Estate
Agent Service. International Journal of Service Industry Management, 16(1),
10-27.
Dabholkar, P. A., Shepherd, C. D., & Thorpe, D. I. (2000). A Comprehensive
Framework for Service Quality: An Investigation of Critical Conceptual and
Measurement Issues through a Longitudinal Study. Journal of Retailing, 76(2),
139-173.
Davidow, W. H., & Uttal, B. (1989). Total Customer Service: The Ultimate Weapon.
New York: Harper and Row.
Davies, D., Taylor, R., & Savery, L. (2001). The Role of Appraisal, Remuneration and
Training in Improving Staff Relations in the Western Australian
Accommodation Industry: A Comparative Study. Journal of European
Industrial Training, 25(7), 366-373.
Davis, A., Davis, J., & Van Wert, F. (1998). Effective Training Strategies A
Comprehensive Guide to Maximizing Learning in Organizations. San
Fransisco: Berrett-Koehler Publishers.
Davvy, J. A., Kinick, A. J., & Scheck, C. L. (1997). A Test of Job Security's Direct and
Mediated Effects on Withdrawal Cognition. Journal of Organizational
Behaviour, 18(4), 323-349.

204
Day, G. (2000). The Market-Driven Organization. Direct Marketing, 62(10), 20-30.
Day, G. S., & Wensley, R. (1983). Marketing Theory with a Strategic Orientation.
Journal of Marketing, 47(Fall), 79-89.
De Vaus, D. (2002). Surveys in Social Research (5th ed.). London: Routledge.
Dean, A. M. (2004). Links between Organizational and Customer Variables in Service
Delivery: Evidence, Contradictions and Challenges. International Journal of
Service Industry Management, 15(4), 332-350.
Dean, J., & Bowen, D. (1994). Management Theory and Total Quality: Improving
Research and Practice through Theory Development. Academy of Management
Review, 19(3), 392-418.
Deci, E. L. (1975). Intrinsic Motivation. New York: Plenum.
Deckop, J. R., Mangel, R., & Cirka, C. C. (1999). Getting More than You Pay for:
Organizational Citizenship Behavior and Pay-for Performance Plans. Academy
of Management Journal, 42(4), 420-428.
Delaney, J. T., & Huselid, M. A. (1996). The Impact of Human Resource Management
Practices on Performance in for-Profit and Nonprofit Organizations. Academy
of Management Journal, 39(4), 949-970.
Delery, J. E. (1998). Issues of Fit in Strategic Human Resource Management:
Implications for Research. Human Resource Management Review, 8(3), 289-
310.
Delery, J. E., & Doty, D. H. (1996). Modes of Theorizing in Strategic Human Resource
Management: Tests of Universalistic, Contingency, and Configurational
Performance Predictions. Academy of Management Journal, 39, 802-835.
Delery, J. E., & Shaw, J. D. (2001). The strategic Management of People in Work
Organizations: Review, Synthesis and Extension. Research in Personnel and
Human Resource Management, 20, 165-197.
Den Hartog, D. N., & Verburg, R. M. (2002). Service Excellence from the Employees’
Point of View: The Role of First Line Supervisors. Journal: Managing Service
Quality, 12(3), 159-164.
Devanna, M. A., Fombrun, C., & Tichy, N. (1981). Human Resource Management: A
Strategic Perspective. Organizational Dynamics, 9(3), 51-68.
Dixon, M. A. (2002). The Relationship between Human Resource Management and
Organizational Effectiveness in Non-Profit Sport Organizations: A Multi-Level
Approach. Retrieved from ProQuest Dissertation and Theses Database. (UMI
3039465)
Doherty, A. J. (1998). Managing Our Human Resources: A Review of Organizational
Behaviour in Sport. Sport Management Review, 1, 1-24.
Donavan, D. T., & Hocutt, M. A. (2001). Customer Evaluation of Service Employee's
Customer Orientation: Extension and Application. Journal of Quality
Management, 6, 293-306.
Doyle, P., & Wong, V. (1998). Marketing and Competitive Performance: An Empirical
Study. European Journal of Marketing, 32(5/5), 514-535.
Dubinsky, A. J., & Levy, M. (1989). Influence of Organizational Fairness on Work
Outcomes of Retail Salespeople. Journal of Retailing, 65(Summer), 221-252.
Dunham, R. B., Aldag, R. J., & Brief, A. P. (1977). Dimensionality of Task Design as
Measured by the Job Diagnostic Survey Academy of Management Journal, 20,
209-223.

205
Dyer, L., & Reeves, T. (1995). Human Resource Strategies and Firm Performance:
What do We Know and Where do We Need to Go? International Journal of
Human Resource Management, 6, 656-670.
Edvardsson, B. (2005). Service Quality: Beyond Cognitive Assessment. Managing
Service Quality, 15(2), 127-131.
Eisen, S. V., Wilcox, M., & Leff, H. S. (1999). Assessing Behavioral Health Outcomes
in Outpatient Programs: Reliability and Validity of the BASIS-32. Journal of
Behavioural Health Science and Research, 26, 5-17.
Eisenberger, R., Fasolo, P., & Davis-LaMastro, V. (1990). Perceived Organizational
Support and Employee Diligence, Commitment, and Innovation. Journal of
Applied Psychology, 75(1), p. 51-59.
Elmadağ, A. B., Ellinger, A. E., & Franke, G. R. (2008). Antecedents and
Consequences of Frontline Service, Employee, Commitment to Service Quality.
Journal of Marketing Theory & Practice, 16(2), 95-110.
Fey, C. F., Bjorkman, I., & Pavlovskaya, A. (2000). The Effect of Human Resource
Management Practices on Firm Performance in Russia. The International
Journal of Human Resource Management, 11(1), 1-18.
Field, A. (2000). Discovering Statistics Using SPSS: Advanced Techniques for the
Beginner. London: Sage.
Fitzsimmons, J. A., & Fitzsimmons. (2006). Service Management: Operations,
Strategy, Information Technology (5th ed.). New York, NY: McGraw-Hill.
Fletcher, C. (1997). Appraisal: Routes to Improved Performance (2nd ed.). London:
Institute of Personnel and Development.
Fornell, C., & Larcker, F. D. (1981). Evaluating Structural Equation Models with
Unobservable Variables and Measurement Error. Journal of Marketing
Research, 18(1), 39-50.
Frabotta, D. (2000). Human Resources Director Praises Culture at Marriot. Hotel and
Motel Management, 215(19), 136-139.
Fraenkel, J. R., & Wallen, N. E. (2000). How to Design and Evaluate Research in
Education (4th ed.). Boston: McGraw-Hill.
Furunes, T. (2005). Training Paradox in the Hotel Industry. Scandinavian Journal of
Hospitality and Tourism, 5(3), 231-248.
Gallagher, D., Ting, L., & Palmer, A. (2008). A Journey into the Unknown: Taking the
Fear out of Structural Equation Modeling with AMOS for the First-Timer User.
The Marketing Review, 8(3), 255-275.
Galloway, L., & Ho, S. (1996). A Model of Service Quality for Training. Training for
Quality, 4(1), 20-26.
Garver, M. S., & Mentzer, J. T. (1999). Logistics Research Methods: Employing
Structural Equation Modeling to Test for Construct Validity. Journal of
Business Logistics, 20 (1), 33-57.
Gefen, D., Straub, D. W., & Boudreau, M. C. (2000). Structural Equation Modeling
and Regression: Guidelines for Research Practice. Communication of The
Association for Information Systems, 4(4), 1-79.
Gelade, G. A., & Young, S. (2005). Test of a Service Profit Chain Model in the Retail
Banking Sector. Journal of Occupational and Organizational Psychology, 78,
1-22.

206
George, D., & Mallery, P. (2003). SPSS for Windows Step by Step: A Simple Guide and
Reference, 11.0 Update (4th ed.). Boston: Allyn and Bacon.
George, J. M., & Bettenhausen, K. (1990). Understanding Prosocial Behavior, Sales
Performance, and Turnover: A Group-Level Analysis in a Service Context.
Journal of Applied Psychology, 75(6), 698-709.
George, J. M., & Brief, A. P. (1992). Feeling Good - Doing Good: A Conceptual
Analysis of the Mood at Work-Organizational Spontaneity Relationship.
Psychological Bulletin, 112, 310-329.
George, J. M., & Jones, G. R. (1997). Organizational Spontaneity in Context. Human
Performance, 10, 153-170.
George, W. R. (1990). Internal Marketing and Organizational Behavior: A Partnership
in Developing Customer-Conscious Employees at Every Level. Journal of
Business Research, 20(10), 63-70.
George, W. R., & Grönroos, C. (1989). Developing Customer-Conscientious
Employees at Every Level: Internal Marketing. In C. A. Congram & M. L.
Friedman (Eds.), Handbook of Services Marketing (pp. 85-100). New York:
AMACOM.
Gerbing, D. W., & Anderson, J. C. (1988). An Updated Paradigm for Scale
Development Incorporating Unidimensionality and its Assessment. Journal of
Marketing Research, 25, 186-192.
Goleman, D. (2000). Leadership that Gets Results. Harvard Business Review, Mar-
Apr, 78-88.
González, J. V., & Garazo, T. G. (2006). Structural Relationship between
Organizational Service Orientation, Contact Employee Job Satisfaction and
Citizenship Behavior. International Journal of Service Industry Management,
17(1), 23-50.
Gouldner, A. (1960). The Norm of Reciprocity. American Sociological Review, 25(2),
161-178.
Govt Reviewing Foreign Equity Ownership Policy (2006, September 4). Bernama.
Retrieved May 15, 2009, from the Bernama database.
Graham, J. W. (1991). An Essay on Organizational Citizenship Behavior. Employee
Responsibilities and Rights Journal, 4, 249-270.
Gratton, L., & Truss, C. (2003). The Three-Dimensional People Strategy: Putting
Human Resources into Action. Academy of Management Executive, 17(3), 74-
86.
Gravetter, F. J., & Wallnau, L. B. (2000). Statistics for the Behavioral Sciences (5th
ed.). Belmont, CA: Wadsworth.
Green R. (1993). The Illustrated Encyclopaedia of Golf. London: CollinsWillow.
Griffin, L. J. (1977). Causal Modeling of Psychological Success in Work
Organizations. Academy of Management Journal, 20, 6-33.
Griffin, R. W., & Ebert, R. J. (2006). Business: International Edition (8th ed.): Pearson
Higher Education.
Grönroos, C. (1983). Strategic Management and Marketing in the Service Sector.
Cambridge, MA: Marketing Science Institute.
Grönroos, C. (1984). A Service Quality Model and its Marketing Implications.
European Journal of Marketing, 18(4), 36-44.

207
Grönroos, C. (1988). Service Quality: The Six Criteria of Good Perceived Service
Quality. Review of Business, 9, 10-13.
Grönroos, C. (2000). Service Management and Marketing: A Customer Relationship
Management Approach (2nd ed.). West Sussex: John Wiley.
Groth, M. (2005). Customers as Good Soldiers: Examining Citizenship Behaviors in
Internet Service Deliveries. Journal of Management, 31(1), 7-27.
Guest, D. E. (1997). Human Resource Management and Performance: A Review and
Research Agenda. International Journal of Human Resource Management,
8(3), 263-290.
Guest, D. E., Michie, J., Conway, N., & Sheehan, M. (2003). Human Resource
Management and Corporate Performance in the UK. British Journal of
Industrial Relations, 41, 291-314.
Guest, D. E., Michie, J., Sheehan, M., Conway, N., & Metochi, M. (2000). Effective
People Management: Initial Findings of the Future of Work study. London:
Chartered Institute of Personnel and Development.
Gummeson, E. (1986). Using Internal Marketing to Develop New Culture - The Case
of Ericsson Quality. In J. Czepiel, C. A. Congram & J. Shanahan (Eds.), The
Services Challenge: Integrating for Competitive Advantage (pp. 13-16). USA:
American Association Proceedings Series.
Guzzo, R. A., Jette, R. D., & Katzell, R. A. (1985). The Effect of Psychological Based
Intervention Programs in Worker Productivity: A Meta Analysis. Personnel
Psychology, 38, 275-291.
Gwinner, K., & Swanson, S. R. (2003). A Model of Fan Identification: Antecedents
and Sponsorship Outcomes. Journal of Service Marketing, 17(3), 275-294.
Hair, J. F., Black, W. C., Babin, B. J., Anderson, R. E., & Tatham, R. L. (2006).
Multivariate Analysis (6th ed.). New Jersey: Pearson Education Inc.
Hallowell, R., Schlesinger, L. A., & Zornitsky, J. (1996). Internal Service Quality,
Customer and Job Satisfaction: Linkages and Implications for Management.
Human Resource Planning, 19(2), 20-30.
Harmon, J., Scotti, D. J., Behson, S. J., & Farias, G. (2003). Effects of High-
Involvement Work Systems on Employee Satisfaction and Service Costs in
Veterans Healthcare. Journal of Health Care Management, 48(6), 393-406.
Hartline, M. D., & Ferrell, O. C. (1996). The Management of Customer-Contact
Service Employees: An Empirical Investigation. The Journal of Marketing,
60(October), 52-70.
Hattie, J. R. (1985). Methodological Review: Assessing Unidimensionality of Tests
and Items. Applied Psychological Measurement, 9(June), 139-164.
Hayes, A. F. (2005). Statistical Methods for Communication Science. Mahwah, NJ:
Lawrence Erlbaum Associates.
Haynes, R., & Fryer, G. (2000). Human Resources, Service Quality and Performance:
A Case Study. International Journal of Contemporary Hospitality
Management, 12(4), 240-248.
Heskett, J. L., Sasser, W. E., & Hart, C. W. L. (1990). Service Breakthroughs:
Changing the Rules of the Games. New York: Free Press.
Heskett, J. L., Jones, T. O., Loveman, G. W., Sasser Jr., W. E., & Schlesinger, L. A.
(1994). Putting the Service-Profit Chain to Work. Harvard Business Review,
72(2), 164-175.

208
Heskett, J. L., Sasser, W. E., & Schlesinger, L. A. (1997). The Service Profit Chain.
New York, NY: Free Press.
Hill, A. V., Geurs, S., Hays, J. M., John, G., Johnson, D. W., & Swanson, R. A. (1998).
Service Guarantees and Strategic Service Quality Performance Metrics at
Radisson Hotels Worldwide. Journal of Strategic Performance Measurement,
2(6), 27-31.
Hill, T. P. (1977). On Goods and Services. Review of Income and Wealth,
23(December), 315 - 333.
Howat, G., Absher, J., Crilley, G., & Milne, I. (1996). Measuring Customer Service
Quality in Sport and Leisure Centres. Managing Leisure, 1, 77-89.
Hoyle, R. H. (1995). Structural Equation Modeling: Concepts, Issues, and
Applications. Thousand Oaks, CA: Sage.
Hsu, Y. R., & Leat, M. (2000). A Study of HRM and Recruitment and Selection
Policies and Practices in Taiwan. International Journal of Human Resource,
11(2), 413-435.
Hui, C., Lam, S. S. K., & Schaubroeck, J. (2001). Can Good Citizens Lead the Way in
Providing Quality Service? A Field Experiment. Academy of Management
Journal, 44, 988-995.
Hui, C., Law, K., & Chen, Z. X. (1999). A Structural Equation Model of the Effects of
Negative Affectivity, Leader-Member Exchange, and Perceived Job Mobility
on in-Role and Extra-Role Performance: A Chinese Case. Organizational
Behavior and Human Decision Processes, 77, 3-21.
Hurley, S. (1998). Application of Team-Based 360° feedback systems. Team
Performance Management, 4(5), 202 - 210.
Huselid, M. A. (1994). Documenting Human Resources Effect on Company
Performance. Human Resource Magazine, 39(January), 79-85.
Huselid, M. A. (1995). The Impact of Human Resource Management Practices on
Turnover, Productivity, and Corporate Financial Performance. Academy
Management Review, 38(3), 635-672.
Huselid, M. A., Jackson, S. E., & Schuler, R. S. (1997). Technical and Strategic
Human Resource Management Effectiveness as Determinants of Firm
Performance. Academy of Management Journal, 40(1), 171-188.
Iacobucci, D. K., Grayson, A., & Ostrom, A. L. (1994). The Calculus of Service
Quality and Customer Satisfaction: Theoretical and Empirical Differentiation
and Integration. In T. A. Swartz, D. E. Bowen & S. W. Brown (Eds.), Advances
in Services Marketing and Management (Vol. 3 pp. 1-67). Greenwich, CT JAI
Press Inc.
Ichniowski, C., Shaw, K., & Prennushi, G. (1997). The Effects of Human Resource
Management Practices on Productivity: A Study of Steel Finishing Lines.
American Economic Review, 87(3), 291-313.
Jackson, S. E., & Schuler, R. S. (1992). HRM Practices in Service-Based
Organizations: A Role Theory Perspective. Advances in Services Marketing
and Management, 1, 123-157.
James, L. R., Mulaik, S. A., & Brett, J. M. (2006). A Tale of Two Methods.
Organizational Research Methods, 9(2), 233-245.
Jawahar, I. M. (2007). The Influence of Perceptions of Fairness on Performance
Appraisal Reactions. Journal of Labor Research, 28, 735-754.

209
Johnson, J. W. (1996). Linking Employee Perceptions of Service Climate to Customer
Satisfaction. Personnel Psychology, 49, 831-851.
Johnson, J. W., & Ferstl, K. L. (1999). The Effects of Inter-rater and Self-other
Agreement on Performance Improvement Following Upward Feedback.
Personnel Psychology, 52, 271-303.
Judge, T. A., & Ferris, G. R. (1993). Social Context of Performance Evaluation
Decisions. Academy of Management Journal, 36, 80 - 105.
Kahn, R. L., Wolfe, D. M., Quinn, R. P., Snoek, J. D., & Rosenthal, R. A. (1964).
Organizational Stress: Studies in Role Conflict and Ambiguity. New York, NY:
John Wiley & Sons.
Kaiser, H. F. (1970). A Second Generation Little-Jiffy. Psychometrika, 35, 401-415.
Kane, B., Crawford, J., & Grant, D. (1999). Barriers to Effective HRM. International
Journal of Manpower, 20(8), 494-515.
Kang, G., & James, J. (2004). Service Quality Dimensions: An Examination of
Grönroos’ Service Quality Model. Managing Service Quality, 14(4), 266-277.
Kaplan, R. M., & Sacuzzo, D. P. (1993). Psychological Testing: Principles,
Applications and Issues (3rd ed.). Pacific Grove, CA: Brooks Cole.
Karambayya, R. (1989). Contexts for Organizational Citizenship Behavior: Do High
Performing and Satisfying Units Have Better “Citizenships”? Unpublished
Working Paper Series, York University, North York, Ontario.
Katz, D., & Kahn, R. L. (1978). The social psychology of organizations, 2nd Ed. New
York, NY: John Wiley and Sons.
Katz, J. H., & Miller, F. A. (1996). Coaching Leaders through Culture Change.
Consulting Psychology Journal: Practice and Research, 48(2), 104-114.
Kaye, L. (1999). Strategic Human Resources Management in Australia: The Human
Cost. International Journal of Management, 20(8), 577-587.
Kelley, S. W., & Hoffman, K. D. (1997). An Investigation of Positive Affect, Prosocial
Behaviors and Service Quality. Journal of Retailing, 73(3), 407-427.
Kelloway, E. K. (1995). Structural Equation Modeling in Perspective. Journal of
Organizational Behavior, 16(3), 215-224.
Kent, A., & Chelladurai, P. (2001). Perceived Transformational Leadership,
Organizational Commitment and Citizenship Behavior: A Case Study in
Intercollegiate Athletics. Journal of Sport Management, 15, 135-159.
Khatri, N. (2000). Managing Human Resources for Competitive Advantage: A Study
of Companies in Singapore. The International Journal of Human Resource
Management, 11(2), 336-365.
Kim, D., & Kim, S. (1995). QUESC: An Instrument for Assessing the Service Quality
of Sport Centers in Korea. Journal of Sport Management, 9, 208-220.
Kim, S., & Jin, B. (2001). An Evaluation of the Retail Quality Scale for U.S. and
Korean Customers of Discount Stores. Advance in Consumer Research, 28,
169-176.
Kinnear, P. R., & Gray, C. D. (1997). SPSS for Windows (2nd ed.). Hove, UK:
Psychology Press.
Kline, R. B. (1998). Principles and Practice of Structural Equation Modeling New
York: Guilford Press.

210
Kluger, A. N., & DeNisi, A. (1996). The Effects of Feedback Interventions on
Performance: Historical Review, a Meta-Analysis and a Preliminary Feedback
Intervention Theory. Psychological Bulletin, 119, 254-284.
Ko, Y. J., & Pastore, D. L. (2005). A Hierarchical Model of Service Quality for the
Recreational Sport Industry. Sport Marketing Quarterly, 14(2), 84-97.
Kohn, A. (1993). Punished by Rewards. Boston: Houghton-Mifflin.
Konovsky, M. A., & Organ, D. W. (1996). Dispositional and Contextual Determinants
of Organizational Citizenship Behavior. Journal of Organizational Behavior,
17(3), 253-266.
Konovsky, M. A., & Pugh, S. D. (1994). Citizenship Behavior and Social Exchange.
Academy of Management Journal, 37(3), 656-669.
Koufteros, X. A. (1999). Testing a Model of Pull Production: A Paradigm for
Manufacturing Research Using Structural Equation Modeling. Journal of
Operations Management, 17, 467-488.
Koufteros, X. A., Vonderembse, M. A., & Doll, W. J. (2001). Concurrent Engineering
and its Consequences. Journal of Operations Management, 19, 97-115.
Kouthouris, C., & Alexandris, K. (2005). Can Service Quality Predict Customer
Satisfaction and Behavioral Intentions in the Sport Tourism Industry? An
Application of the SERVQUAL Model in an Outdoors Setting. Journal of Sport
Tourism, 10(2), 101-111.
Koys, D. J. (2001). The Effects of Employee Satisfaction, Organizational Citizenship
Behavior, and Turnover on Organizational Effectiveness: A Unit Level
Longitudinal Study. Personnel Psychology, 54(1), 101-114.
Krosnick, J. A. (1991). Response Strategies for Coping with the Cognitive Demands of
Attitude Measures in Surveys. Applied Cognitive Psychology, 5, 213-236.
Kulas, J. T., McInnerney, J. E., Frautschy DeMuth, R., & Jadwinski, V. (2007).
Employee Satisfaction and Theft: Testing Climate Perceptions as a Mediator.
The Journal of Psychology, 141(4), 389-402.
Kumar, V., Smart, P. A., Maddern, H., & Maull, R. S. (2008). Alternative Perspectives
on Service Quality and Customer Satisfaction: The Role of BPM. International
Journal of Service Industry Management, 19(2), 176-187.
Kuvaas, B. (2007). Different Relationships between Perceptions of Developmental
Performance Appraisal and Work Performance. Personnel Review, 36(3), 378-
397.
LaBarabra, P., & Mazursky, D. (1993). A Longitudinal Assessment of Consumer
Satisfaction/Dissatisfaction: The Dynamic Aspect of the Cognitive Process.
Journal of Marketing Research, 20(November), 393-404.
Lagrosen, S. (2000). Born with Quality, TQM in a Maternity Clinic. The International
Journal of Public Sector Management, 13(5), 467-475.
Lagrosen, S., & Lagrosen, Y. (2007). Exploring Service Quality in the Health and
Fitness Industry. Managing Service Quality, 17(1), 41-53.
Lance, C. E., Bollen, K. A., Kirby, J. B., Curran, P. J., Paxton, P. M., & Chen, F.
(2007). Latent Variable Models under Misspecification: Two-Stage Least
Squares (2SLS) and Maximum Likelihood (ML) Estimators. Sociological
Methods and Research, 36(1), 48-86.

211
Landy, F. L., & Conte, J. M. (2006). Work in the 21st Century: An Introduction to
Industrial and Organizational Psychology (2nd ed.). London: Blackwell
Publishing, Inc.
Laroche, M., Ueltschy, L. C., Abe, S., Cleveland, M., & Yannopoulos, P. (2004).
Service Quality Perceptions and Customer Satisfaction: Evaluating the Role of
Culture. Journal of International Marketing, 12(3), 58-85.
Law, K. S., Wong, C. S., & Mobley, W. H. (1998). Toward a Taxonomy of
Multidimensional Constructs. Academy of Management Review, 23, 741-755.
Lawler, E. (1992). The Ultimate Advantage: Creating the High-Involvement
Organization. San Francisco: Jossey-Bass.
Lawson-Body, A., & Limayem, M. (2004). The Impact of Customer Relationship
Management on Customer Loyalty: The Moderating Role of Web Site
Characteristics. Journal of Computer-Mediated Communication, 9(4), 1-37.
Lee, H., Lindquist, J. D., & Acito, F. (1997). Managers' Evaluation of Research Design
and Its Impact on the Use of Research: An Experimental Approach. Journal of
Business Research, 39(3), 231-240.
Lehtinen, U., & Lehtinen, J. R. (1991). Two Approaches to Service Quality
Dimensions. The Service Industries Journal, 11(3), 287-303.
Lepak, D. P., & Snell, S. A. (1999). The Human Resource Architecture: Toward a
Theory of Human Capital Allocation and Development. Academy Management
Review, 24(1), 31-48.
LePine, J. A., Erez, A., & Johnson, D. E. (2002). The Nature and Dimensionality of
Organizational Citizenship Behavior: A Critical Review and Meta-Analysis.
Journal of Applied Psychology, 87(1), 52-65.
Lievens, F., & Anseel, F. (2004). Confirmatory Factor Analysis and Invariance of an
Organizational Citizenship Behaviour Measure across Samples in a Dutch-
Speaking Context. Journal of Occupational and Organizational Psychology,
77, 299-306.
Linnehan, F. (2005). Human Resource Management in Sport. In B. L. Parkhouse (Ed.),
The Management of Sport: Its Foundation and Application (pp. 286-300). New
York, NY: McGraw-Hill.
Lippman, S. A., & Rumelt, R. P. (1982). Uncertain Imitability: An Analysis of Interim
Differences in Efficiency under Competition. The Bell Journal of Economics,
13, 803-839.
Little, M. M., & Dean, A. M. (2006). Links between Service Climate, Employee
Commitment and Employees' Service Quality Capability. Journal: Managing
Service Quality, Volume: 16(5), 460-476.
Litwin, M. S. (1995). How to Measure Survey Reliability and Validity. London: Sage
Publication.
Liu, X., & Batt, R. (2007). The Economic Pay-Offs to Informal Training: Evidence
from Routine Service Work. Industrial and Labor Relations Review, 61(1), 75-
89.
Loehlin, J. C. (2004). Latent Variable Models: An Introduction to Factor, Path, and
Structural Analysis. Hillsdale, NJ: Lawrence.
Lovelock, C. (1983). Classifying Services to Gain Strategic Marketing Insights Journal
of Marketing, 47(3), 9-20.
Lovelock, C. (1991). Services Marketing. Englewood Cliffs, NJ: Prentice-Hall.
212
Lovelock, C. (2001). Service Marketing: People, Technology and Strategy. Upper
Saddle River: Prentice Hall.
Lu, C., Lai, K., & Cheng, T. C. E. (2007). Application of Structural Equation Modeling
to Evaluate the Intention of Shippers to Use Internet Services in Liner Shipping.
European Journal of Operational Research, 180, 845-867.
Luthans, F., & Stajkovic, A. D. (1999). Reinforce for Performance: The Need to Go
Beyond Pay and Even Rewards. Academy of Management Executive, 13(2), 49-
57.
Lux, D. J., Jex, S. M., & Hansen, C. P. (1996). Factors Influencing Employee
Perceptions of Customer Service Climate. Journal of Market-Focused
Management, 1, 65-86.
Lynn, M. (2001). Restaurant Tipping and Service Quality: A Tenuous Relationship.
Cornell H.R.A. Quarterly, 42(1), 4-20.
Lytle, R. S., Hom, P. W., & Mokwa, M. P. (1998). SERV*OR: A Managerial Measure
of Organizational Service-Orientation. Journal of Retailing, 74(4), 455-489.
MacDuffie, J. P. (1995). Human Resource Bundles and Manufacturing Performance:
Organizational Logic and Flexible Production Systems in the World Auto
Industry. Industrial and Labor Relations Review, 48, 197-221.
MacKenzie, S. B., Podsakoff, P. M., & Ahearne, M. (1998). Some Possible
Antecedents and Consequences of In-Role and Extra-Role Salesperson
Performance. Journal of Marketing, 62(3), 87-98.
MacKenzie, S. B., Podsakoff, P. M., & Fetter, R. (1991). Organizational Citizenship
Behavior and Objective Productivity as Determinants of Managerial
Evaluations of Salespersons' Performance. Organizational Behavior and
Human Decision Processes, 50, 123-150.
MacKenzie, S. B., Podsakoff, P. M., & Fetter, R. (1993). The Impact of Organizational
Citizenship Behavior on Evaluations of Salesperson Performance. Journal of
Marketing, 57, 70-80.
Mahony, D., Fink, J. S., & Pastore, D. L. (2004). Ethics in Intercollegiate Athletics: An
Examination of NCAA Violations and Penalties - 1952-1997. In S. Rosner &
K. L. Shropshire (Eds.), The Business of Sport (pp. 447-456). Pensylvania:
Jones & Bartlett Publishers.
Mahony, D. F., & Pitts, B. G. (1998). Research Outlets in Sport Marketing: The Need
for Increased Specialization. Journal of Sport Management, 12, 259-272.
Malhotra, N. K. (2004). Marketing Research. An Applied Orientation (4th ed.). Upper
Saddle River, NJ: Pearson.
Mat Zaid, A. (1995). Measuring and Monitoring Service Quality at Malaysia Airlines.
Managing Service Quality, 5(2), 25-27.
Mathieu, J., Tannenbaum, S., & Salas, E. (1992). Influences on Individual and
Situational Characteristics on Measures of Training Effectiveness. Academy of
Management Journal, 35(4), 828-847.
McDonald, M. A., Sutton, W. A., & Milne, G. R. (1995). TeamqualTM
: Measuring
Service Quality in Professional Team Sport. Sport Marketing Quarterly, 4(2),
9-15.
McFarlin, D. B., & Sweeney, P. D. (1992). Distributive and Procedural Justice as
Predictors of Satisfaction with Personal and Organizational Outcomes.
Academy of Management Journal, 35(August), 626-637.
213
Mels, G., Boshoff, C., & Nel, D. (1997). The Dimensions of Service Quality: The
Original European Perspective Revisited. The Service Industries Journal, 17(1),
173-189.
Miller, C., & Swaddling, D. C. (2002). Focusing NPD Research on Customer-
Perceived Value. In P. Belliveau, A. Griffin & S. Somermeyer (Eds.), The
PDMA Toolbook: for New Product Development 1 (pp. 87-114). New York,
NY: John Wiley and Sons Ltd.
Miles, J.N.V. and Shevlin, M.E. (2001). Applying Regression and Correlation: A
Guide for Students and Researchers. London: Sage Publications.
Moorman, R. H. (1991). Relationship between Organizational Justice and Citizenship
Behaviors: Do Fairness Perceptions Influence Employee Citizenship? Journal
of Applied Psychology, 76, 845-855.
Moorman, R. H. (1993). The Influence of Cognitive and Affective based Job
Satisfaction Measures on the Relationship between Satisfaction and
Organizational Citizenship Behavior. Human Relations, 46(759-776).
Moorman, R. H., Niehoff, B. P., & Organ, D. W. (1993). Treating Employees Fairly
and Organizational Citizenship Behavior: Sorting the Effects of Job
Satisfaction, Organizational Commitment, and Procedural Justice. Employee
Responsibilities and Rights Journal, 6, 209-225.
Moreland, R. J., & Levine, J. M. (2001). Socialization in Organizations and Work
Groups. In M. E. Turner (Ed.), Groups at Work: Theory and Research (pp. 69-
112). Mahwah, NJ: Lawrence Erlbaum Associates.
Morrison, E. W. (1996). Organizational Citizenship Behavior as a Critical Link
between HRM Practices and Service Quality. Human Resource Management,
35(4), 493-512.
Motowidlo, S. J. (2000). Contextual Performance and Organizational Citizenship
Behavior in Human Resource Management. Human Resource Management
Review, 10(1), 1-2.
Motowidlo, S. J., & Van Scotter, J. R. (1994). Evidence that Task Performance Should
be Distinguished from Contextual Performance. Journal of Applied Psychology,
79, 475-480.
Muczyk, J. P., & Gable, M. (1987). Managing Sales Performance through a
Comprehensive Performance Appraisal System. Journal of Personal Selling &
Sales Management, May, 41-52.
Mukherjee, A., & Nath, P. (2005). An Empirical Assessment of Comparative
Approaches to Service Quality Measurement. Journal of Service Marketing,
19(3), 174-184.
Murphy, K. R., & Cleveland, J. N. (1995). Understanding Performance Appraisals:
Social, Organizational and Goal-Based Perspectives. Thousand Oaks, CA:
Sage Publications.
Murray, D., & Howat, G. (2002). The Relationship among Service Quality, Value,
Satisfaction, and Future Intentions of Customers at an Australian Sport and
Leisure Centre. Sport Management Review, 5, 25-43.
Narsky, I. (2003). Goodness of Fit: What do We Really Want to Know? Unpublished
manuscript, Stanford, California.
214
Netemeyer, R. G., Boles, J. S., McKee, D. O., & McMurrian, R. (1997). An
Investigation into the Antecedents of Organizational Citizenship Behaviors in a
Personal Selling Contact. Journal of Marketing, 61(July), 85-98.
Niehoff, B. P., & Moorman, R. H. (1993). Justice as a Mediator of the Relationship
between Method of Monitoring and Organizational Citizenship Behavior.
Academy of Management Journal, 36, 527-556.
Noble, C. H., Rajiv, K. S., & Kumar, A. (2002). Market Orientation and Alternative
Strategic Orientations: A Longitudinal Assessment of Performance Implication.
Journal of Marketing, 66(4), 25-40.
Nordin, N. (2008, August 7). Industri Golf Tarik Pelancong Asing. Utusan Malaysia,
Retrieved May 15, 2009, from http://www.utusan.com.my.
Nunnally, J. C. (1978). Psychometric Theory (2nd ed.). New York: McGraw-Hill.
O'Connor, S. J, Trinh, H. Q., & Shewchuk, R. M. (2000). Perceptual Gaps in
Understanding Patient Expectations for Health Care Service Quality. Health
Care Management Review, 25(2), p. 7-23.
O'Connor, S. J., & Shewchuck, R. M. (1995). Service Quality Revisited: Striving for a
New Orientation. Hospital & Health Services Administration, 40(4), 535-552.
O'Neill, M. (2005). Employee Care, a Vital Antecedent to Customer Care in the Health
Care industry: An Exploratory Investigation of the Employee Satisfaction
Construct at North East Alabama Regional Medical Center. International
Journal of Health Care Quality Assurance, 18(2), 131-151.
O'Reilly, C., & Chatman, J. (1986). Organizational Commitment and Psychological
Attachment: The Effects of Compliance, Identification and Internalization on
Prosocial Behavior. Journal of Applied Psychology, 71, 492-499.
Ooi, S. H. (2006, July 1). Golfing Paradise Lost. Malaysian Business. Retreived May
15, 2009, from http://findarticles.com/p/articles.
Oliva, R., & Sterman, J. D. (2001). Cutting Corners and Working Overtime: Quality
Erosion in the Service Industry. Management Science, 47(7), 894-914.
Oliver, R. L. (1981). Measurement and Evaluation of Satisfaction Processes in Retail
Settings. Journal of Retailing, 57(3), 25-48.
Oliver, R. L. (1993). Cognitive, Affective, and Tribute Base of the Satisfaction
Response. Journal of Consumer Research, 20(December), 418-430.
Oppenheim, A. N. (1986). Questionnaire Design and Attitude Measurement. Hants,
England: Gower.
Organ, D. W. (1988). Organizational Citizenship Behavior: The Good Soldier
Syndrome. Lexington, MA: Lexington Books.
Organ, D. W. (1997). Organizational Citizenship Behavior: It's Construct Clean-Up
Time. Human Performance, 10, 85-97.
Organ, D. W., & Ryan, K. (1995). A Meta-analytic Review of Attitudinal and
Dispositional Predictors of Organizational Citizenship Behavior. Personnel
Psychology, 48(4), 1-22.
Osterman, P. (1987). Choice of Employment Systems in Internal Labor Markets.
Industrial Relations 26, 46-67.
Pallant, J. (2005). SPSS Survival Manual (2nd ed.). New York, NY: Open University
Press.
215
Palmer, C. (2004). More than Just a Game: The Consequences of Golf Tourism. In B.
Ritchie & D. Adair (Eds.) Sport Tourism: Interrelationships, Impacts and
Issues (pp. 117-34). Clevedon: Channel View.
Papadimitriou, D.A. & Karteroliotis, K. (2000). The Service Quality Expectations in
Private Sport and Fitness Centers: A Re-examination of the Factor Structure,
Sport Marketing Quarterly, 9(3), p. 157-64.
Parasuraman, A. (2002). Service Quality and Productivity: A Synergistic Perspective.
Managing Service Quality, 12(1), 6-9.
Parasuraman, A., Berry, L. L., & Zeithaml, V. A. (1985). A Conceptual Model of
Service Quality and Implications for Future Research. Journal of Marketing,
49(Fall), 41-50.
Parasuraman, A., Zeithaml, V. A., & Berry, L. L. (1988). SERVQUAL: A Multiple-
Item Scale for Measuring Consumer Perceptions of Service Quality. Journal of
Retailing, 64(1), 12-40.
Park, H. J., Mitsuhashi, H., Fey, C. F., & Björkman, I. (2003). The Effect of Human
Resource Management Practices on Japanese MNC Subsidiary Performance: A
Partial Mediating Model. International Journal of Human Resource
Management, 14(8), 1391-1406.
Parkington, J. P., & Schneider, B. (1979). Some Correlates of Experienced Job Stress:
A Boundary Role Study. Academy of Management Journal, 22, 270-281.
Patel, A. (1994). Assessing Total Quality Training in Wales. Training for Quality, 2(2),
13-21.
Patterson, M., West, M., Lawthom, R., & Nickell, S. (1997). The Impact of People
Management Practices on Business Performance: Issues in People
Management. London: Institute of Personnel and Development.
Payne, S., & Webber, S. S. (2006). Effects of Service Provider Attitudes and
Employment Status on Citizenship Behaviors and Customers' Attitudes and
Loyalty Behavior. Journal of Applied Psychology, 91(2), 365-378.
Peccei, R., & Rosenthal, P. (1997). The Antecedents of Employee Commitment to
Customer Service: Evidence from a UK Service Context. The International
Journal of Human Resource Management, 8(1), 66-70.
Perry, L. (1995). Effective Facilitators - A Key Element in Successful Continuous
Improvement. Training for Quality, 3(4), 9-14.
Peter, J. P. (1979). Reliability: A Review of Psychometric Basics and Recent
Marketing Practices. Journal of Marketing Research, 16(6-17).
Peter, J. P., Churchill, G. A., & Brown, T. J. (1993). Caution in the Use of Difference
Scores in Consumer Research. Journal of Consumer Research, 19, 655-662.
Pettijohn, C. E., Pettijohn, L. S., & D'Amico, M. (2001). Characteristics of
Performance Appraisals and Their Impact on Sales Force Satisfaction. Human
Resource Development Quarterly, 12, 127-146.
Pfeffer, J., & Baron, J. N. (1988). Taking the Workers Back Out: Recent Trends in the
Structuring of Employment. In B. M. Staw & L. L. Cummings (Eds.), Research
in Organizational Behavior: An Annual Series of Analytical Essays and Critical
Reviews (Vol. 10, pp. 257-303). London: JAI Press.
Piercy, N. F., Cravens, D. W., Lane, N., & Vohies, D. W. (2006). Driving
Organizational Citizenship Behaviors and Salesperson In-Role Behavior

216
Performance: The Role of Management Control and Perceived Organizational
Support. Journal of the Academy of Marketing Science, 34(2), 244-262.
Podsakoff, P. M., Ahearne, M., & MacKenzie, S. B. (1997). Organizational Citizenship
Behavior and the Quantity and Quality of Work Group Performance. Journal of
Applied Psychology, 82, 262-270.
Podsakoff, P. M., & MacKenzie, S. B. (1994). Organizational Citizenship Behavior
and Sales Unit Effectiveness. Journal of Marketing Research, 31, 351-363.
Podsakoff, P. M., MacKenzie, S. B., & Bommer, W. H. (1996). Transformational
Leadership Behaviors and Substitutes for Leadership as Determinants of
Employee Satisfaction, Commitment, Trust, and Organizational Citizenship
Behaviors. Journal of Management, 22, 259-298.
Podsakoff, P. M., MacKenzie, S. B., & Fetter, R. (1993). Substitutes for Leadership
and the Management of Professionals. Leadership Quarterly, 4, 1-44.
Podsakoff, P. M., MacKenzie, S. B., Moorman, R. H., & Fetter, R. (1990).
Transformational Leader Behaviours and Their Effects on Followers' Trust in
Leader, Satisfaction, and Organizational Citizanship Behaviors. Leadership
Quarterly, 1(2), 107-142.
Polanyi, M. (1962). Personal Knowledge: Toward a Post Critical Philosophy.
Chicago: University of Chicago Press.
Pritchard, R. D., & Karrasick, B. W. (1973). The Effects of Organizational Climate on
Managerial Job Performance and Job Satisfaction. Organizational Behavior
and Human Performance, 9, 126-146.
Readman, M. (2003). Golf Tourism. In S. Hudson (Ed.), Sport and Adventure Tourism
(pp.165-201). New York: Haworth.
Redman, T., & Mathews, B. P. (1998). Service Quality and Human Resource
Management: A Review and Research Agenda. Personnel Review, 27, 57-77.
Reeves, C. A., & Bednar, D. A. (1994). Defining Quality: Alternatives and
Implications. Academy of Management Review, 19, 419-445.
Rhoades, D. L., & Waguespack Jr, B. P. (2004). Service and Safety Quality in US
Airlines: Pre- and Post-September 11th. Managing Service Quality, 14(4), 307-
316.
Rigdon, E. E. (1996). A Comparison of Two Fit Indices for Structural Equation
Modeling. Structural Equation Modeling, 3, 369-379.
Rizzo, J. R., House, R. J., & Lirtzman, S. L. (1970). Role Conflict and Ambiguity in
Complex Organizations. Administrative Science Quarterly, 15, 150-163.
Roach, S. S. (1991). Service under Siege - The Restructuring Imperative. Harvard
Business Review, 69(5), 82-91.
Robinson, S. (1999). Measuring Service Quality: Current Thinking and Future
Requirements. Marketing Intelligence and Planning, 17(1), 21-32.
Rogg, K. L., Schmidt, D. B., Shull, C., & Schmitt, N. (2001). Human Resource
Practices, Organizational Climate, and Customer Satisfaction. Journal of
Management, 27, 431-450.
Ross, S. D. (2008). Assessing the Use of the Brand Personality Scale in Team Sport.
International Journal of Sport Management and Marketing, 3(1/2), 23-38.
Rousseau, D. M. (1990). New Hire Perceptions of Their Own and Their Employer's
Obligations: A Study of Psychological Contracts. Journal of Organizational
Behavior, 11, 389-400.

217
Rousseau, D. M., & Parks, J. M. (1993). The Contracts of Individuals and
Organizations. In L. L. Cummings & B. M. Staw (Eds.), Research in
Organizational Behavior (Vol. 15, pp. 1-43). Greenwich, CT: JAI Press.
Ruane, J. M. (2004). Essentials of Research Methods: A Guide to Social Science
Research. London: Blackwell Publishing.
Russell, J. S., Terborg, J. R., & Powers, M. L. (1985). Organizational Performance and
Organizational Level Training and Support. Personnel Psychology, 38, 849-
863.
Saenz, T., Marcoulides, G. A., Junn, E., & Young, R. (1999). The Relationship
between College Experience and Academic Performance among Minority
Students. The International Journal of Educational Management, 13(4), 199-
207.
Sandhusen, R. L. (2000). Marketing (3rd ed.). Hauppauge, NY: Barron's Educational
Series, Inc.
Sanwong, K. (2008). The Development of a 360-degree Performance Appraisal
System: A University Case Study. International Journal of Management, 25(1),
16-22.
Saparito, P., & Colwell, K. (2007). The Mediating Role of Bank Knowledge in Small
and New Firm Access to Debt Finance. National Academy of Management
Proceedings, 1-6.
Sasser, W. E., Olsen, R. P., & Wyckoff, D. D. (1978). Management of Service
Operations. Rockleigh, NJ: Allyn & Bacon.
Satorra, A., & Bentler, P. M. (1988). Scaling Corrections for Statistics in Covariance
Structure Analysis. ASA 1988 Proceedings of the Business and Economic
Statistics Section (pp. 308-313). Virginia: American Statistical Associations.
Satorra, A., & Bentler, P. M. (1994). Corrections to Test Statistic and Standard Errors
in Covariance Structure Analysis. In A. Von Eye & C. C. Clogg (Eds.),
Analysis of Latent Variables in Development Research (pp. 399-419). Newbury
Park, CA: Sage.
Schlesinger, L. A., & Heskett, J. L. (1991). The Service-Driven Service Company.
Harvard Business Review, 69(5), 71-81.
Schlesinger, L. A., & Zornitsky, J. (1991). Job Satisfaction, Service Capability, and
Customer Satisfaction: An Examination of Linkages and Management
Implications. Human Resource Planning, 14(2), 141-149.
Schmenner, R. W. (1995). Service Operations Management. Englewood Cliffs, NJ:
Prentice Hall.
Schmidt, P. (2005, 8th-12 August). SEM and longitudinal Data. Paper presented at the
38th Essex Summer School in Social Science Data Analysis and Collection,
University of Essex, Essex.
Schmitt, M. J., & Allscheid, S. P. (1995). Employee Attitudes and Customer
Satisfaction: Making Theoretical and Empirical Connections. Personnel
Psychology, 48, 521-536.
Schneider, B. (1980). The Service Organization: Climate is Crucial. Organizational
Dynamics, 9(2), 52-65.
Schneider, B. (1994). HRM - A Service Perspective: Towards a Customer-Focused
HRM. International Journal of Service Industry Management, 5(1), 64-76.

218
Schneider, B. (2004). Welcome to the World of Services Management. Academy of
Management Executive, 18(2), 144-150.
Schneider, B., Bowen, D., Ehrhart, M., & Holcombe, K. (2000). The Climate for
Service: Evolution of a Construct. In N. Ashkanasy, C. Wilderom & M.
Peterson (Eds.), Handbook of Organizational Culture and Climate (pp. 21-36).
London: Sage.
Schneider, B., & Bowen, D. E. (1985). Employee and Customer Perceptions of Service
in Banks: Replication and Extension. Journal of Applied Psychology, 70, 423-
433.
Schneider, B., & Bowen, D. E. (1993). The Service Organization: Human Resources
Management is Crucial. Organizational Dynamics, 21(4), 39-52.
Schneider, B., & Brief, A. P. (1992). Foreword. In C. J. Cranny, P. C. Smith & E. F.
Stone (Eds.), Job Satisfaction. Lexington, MA: Lexington Books.
Schneider, B., Parkington, J. P., & Buxton, V. M. (1980). Employee and Customer
Perceptions of Service in Banks. Administrative Science Quarterly, 25, 252-
267.
Schneider, B., Wheeler, J. K., & Cox, J. F. (1992). A Passion for Service: Using
Content Analysis to Explicate Service Climate Themes. Journal of Applied
Psychology, 77(5), 705-716.
Schneider, B., White, S. S., & Paul, M. C. (1998). Linking Service Climate and
Customer Perceptions of Service Quality: Test of a Causal Model. Journal of
Applied Psychology, 83(2), 150-163.
Schnytzer, A., & Weinberg, G. (2008). Testing for Home Team and Favorite Biases in
the Australian Rules Football Fixed-Odds and Point Spread Betting Markets.
Journal of Sport Economics, 9, 173-190.
Schuler, R. S., & Jackson, S. E. (1987). Linking Competitive Strategies with Human
Resources Management Practices. Academy of Management Executive, 1, 207-
219.
Schuler, R. S., Jackson, S. E., & Luo, Y. (2003). Managing Human Resources in
Cross-border Alliances. London: Routledge.
Schumacker, R. E., & Lomax, R. G. (2004). A Beginner's Guide to Structural Equation
Modeling (2nd ed.). Mahwah, NJ: Lawrence Erlbaum Associates.
Scotti, D. J., Driscoll, A. E., Harmon, J., & Behson, S. J. (2007). Links among High-
Performance Work Environment, Service Quality, and Customer Satisfaction:
An Extension to the Healthcare Sector. Journal of Healthcare Management,
52(2), 109-124.
Segar, A. (1997). Assessing the Unidimensionality of Measurement: A Paradigm and
Illustration within the Context of Information Systems Research. Omega, 25(1),
107-121.
Segar, A. H., & Grover, V. (1993). Re-examining Perceived Ease of Use and
Usefulness: A Confirmatory Factor Analysis. MIS Quarterly, 17(4), 517-525.
Selden, S. C., & Jacobson, W. (2007). Government's Largest Investment: Human
Resource Management in States, Counties and Cities. In P. W. Ingraham (Ed.),
In Pursuit of Performance: Management Systems in State and Local
Government (pp. 82-116). Maryland: JHU Press.
Selznick, P. (1957). Leadership in Administration: A Sociological Interpretation. New
York: Harper & Row.

219
Settoon, R. P., Bennett, N., & Liden, R. L. (1996). Social Exchange in Organizations:
Perceived Organizational Support, Leader-Member Exchange, and Employee
Reciprocity. Journal of Applied Psychology, 81, 219-227
Shah, R., & Goldstein, S. M. (2006). Use of Structural Equation Modeling in
Operations Management Research: Looking Back and Forward. Journal of
Operations Management, 24(2), 148-169.
Shahani-Denning, C. (2001). Employee and Customer Perceptions of Service Quality:
A Look at India. Current Psychology, 19(4), 292-300.
Singh, J. J. (2000). Performance Productivity and Quality of Frontline Employees in
Service Organizations. Journal of Marketing, 64(April), 15-34.
Skinner, B. F. (1953). Science and Human Behavior. New York: Free Press.
Smart, D. L., & Wolfe, R. A. (2000). Examining Sustainable Competitive Advantage
in Intercollegiate Athletics: A Resource-Based View. Journal of Sport
Management, 14, 133-153.
Smith, A. (1998). Development Training and Learning. In G. O'Neill & R. Kramer
(Eds.), Australian Human Resources Management (Vol. 2). Sydney: Business
& Professional Publishing.
Smith, C. A., Organ, D. W., & Near, J. P. (1983). Organizational Citizenship Behavior:
Its Nature and Antecedents. Journal of Applied Psychology, 68, 653-663.
Smither, J. W., London, M., Vasilopoulos, N. L., Reilly, R. R., Millsap, R. E., &
Salvemini, N. (1995). An Examination of the Effects on an Upward Feedback
Program over Time. Personnel Review, 48, 1-34.
Snow, C. C., & Hrebiniak, L. G. (1980). Strategy, Distinctive Competences, and
Organizational Performance. Administrative Science Quarterly, 25(2), 317-336.
Solnet, D., & Paulsen, N. (2005). Service Climate, Employee Identification, and
Customer Outcomes in Hotel Property Rebrandings. Journal of Hospitality and
Leisure Marketing, 13(3/4), 3-27.
Solomon, M. R., Surprenant, C. F., Czepiel, J. A., & Gutman, E. G. (1985). A Role
Theory Perspective on Dyadic Interactions: The Service Encounter. Journal of
Marketing, 49, 99-111.
Sonnenfeld, J. A., & Peiperl, M. A. (1988). Staffing Policy as a Strategic Response: A
Typology of Career Systems. Academy of Management Review, 13, 588-600.
Soper, D. (2004). Free Sobel Test Calculator for the Significance of Mediation.
<http://www.danielsoper.com/statcalc/calc31.aspx>, [2008, August 20].
Spreng, R. A., & Mackoy, R. D. (1996). An Empirical Examination of a Model of
Perceived Service Quality and Satisfaction. Journal of Retailing, 72(2), 201-
214.
Spreng, R. A., & Singh, A. K. (1993). An Empirical Assessment of the SERVQUAL
Scale, and the Relationship between Service Quality and Satisfaction. Paper
presented at the Enhancing Knowledge Development in Marketing, Chicago.
Srivastava, R. K., Shervani, T. A., & Fahey, L. (1998). Market Based Assets and
Shareholder Value: A Framework for Analysis. Journal of Marketing, 62, 2-18.
Stamatis, D. H. (2001). Six Sigma and Beyond: The Implementation Process (Vol.
VII). London: CRC Press.
Steinman, C., Deshpande, R., & Farley, J. U. (2000). Beyond Market Orientation:
When Customers and Suppliers Disagree. Journal of the Academy of Marketing
Science, 28(1), 109-119.

220
Strong, C. A., & Harris, L. C. (2004). The Drivers of Customer Orientation: An
Exploration of Relational, Human Resource and Procedural Tactics. Journal of
Strategic Marketing, 12, 183-204.
Sun, L. Y., Aryee, S., & Law, K. S. (2007). High-performance Human Resource
Practices, Citizenship Behaviour, an Organizational Performance: A Relational
Perspective. Academy of Management Journal, 50(3), 558-577.
Sureshchandar, G., Rajendran, C., & Anantharaman, R. (2002). Determinants of
Customer-Perceived Service Quality: A Confirmatory Factor Analysis
Approach. Journal of Service Marketing, 16(1), 9-34.
Swanson, R. A., & Holton, E. F. (2001). Foundations of Human Resource
Development. San Fransisco: Berrett-Koehler.
Tabachnick, B. G., & Fidell, L. S. (2007). Using Multivariate Statistics (5th ed.).
Boston: Allyn and Bacon.
Takeuchi, R., Lepak, D. P., Wang, H., & Takeuchi, K. (2007). An Empirical
Examination of the Mechanisms Mediating Between High Performance Work
System of Japanese Organizations. Journal of Applied Psychology, 92(4), 1069-
1083.
Tansky, J. W. (1993). Justice and Organizational Citizenship Behavior: What is the
Relationship? Employee Responsibilities and Rights Journal, 6, 195-207.
Tat, Y. C., & Chu, R. K. (1999). Consumer Perceptions of the Quality of Services in
Three Hotel Categories in Hong Kong. Journal of Vacation Marketing, 5(2),
176-189.
Taylor, F. W. (1911). Principles of Scientific Management. New York, NY: Norton.
Taylor, S., & Hunter, G. (2003). An Exploratory Investigation into the Antecedents of
Satisfaction, Brand Attitude and Loyalty within the (B2B) eCRM Industry.
Journal of Consumer Satisfaction, Dissatisfaction and Complaining Behavior,
16, 19-35.
Taylor, S. A., & Baker, T. L. (1994). An Assessment of the Relationship between
Service Quality and Customer Satisfaction in the Formation of Consumers'
Purchase Intentions. Journal of Retailing, 70(2), 163-178.
Taylor, T., & Ho, C. (2005). Global Human Resource Management Influences on
Local Sport Organizations. International Journal of Sport Management and
Marketing, 1(1/2), 110-126.
Teece, D. (1982). Towards and Economic Theory of the Multiproduct Firm. Journal of
Economic Behavior and Organization, 3, 38-63.
Tehrani, N. (2004 ). Workplace Trauma: Concepts, Assessment and Interventions.
London: Routledge
Terpstra, D. E., & Rozell, E. J. (1993). The Relationship of Staffing Practices to
Organizational Level Measures of Performance. Personnel Psychology, 46, 27-
48.
Thompson, C. (2001). Conservation of Resources Theory, a Sloan Work and Family
Encyclopedia Entry. Chestnut Hill, MA: Boston College.
Thomson, J. D. (1967). Organizations in Action. New York: McGraw-Hill.
Tickle, J. J., Hull, J. G., Sargent, J. D., & Dalton, M. A. (2006). A Structural Equation
Model of Social Influences and Exposure to Media Smoking on Adolescent
Smoking. Basic and Applied Social Psychology, 28(2), 117-129.

221
Tornow, W. W., & Wiley, J. W. (1990). Service Quality and Management Practices: A
Look at Employee Attitudes, Customer Satisfaction, and Bottom-Line
Consequences. Human Resource Planning, 14(2), 105-115.
Trail, G., & Chelladurai, P. (2000). Perceptions of Goals and Processes of
Intercollegiate Athletics: A Case Study. Journal of Sport Management, 14, 154-
178.
Tsaur, S., & Lin, Y. (2004). Promoting Service Quality in Tourist Hotels: The Role of
HRM Practices and Service Behavior. Tourism Management, 25, 471-481.
Tsitskari, E., Tsiotras, D., & Tsiotras, G. (2006). Measuring Service Quality in Sport
Services. Total Quality Management, 17(5), 623-631.
Tsoukatos, E., & Rand, G. K. (2006). Path Analysis of Perceived Service Quality,
Satisfaction and Loyalty in Greek Insurance. Managing Service Quality, 16(5),
501-519.
Tsui, A. S., Pearce, J. L., Porter, L. W., & Tripoli, A. M. (1997). Alternative Approach
to the Employee-Organization Relationship: Does Investment in Employees
Pay Off? Academy of Management Journal, 40(5), 1089-1122.
Tsuji, Y., Bennet, G., & Zhang, J. (2007). Consumer Satisfaction with an Action Sport
Event. Sport Marketing Quarterly, 16, 199-208.
Tzafrir, S., & Gur, A. (2007). The Influence of the Perceptions of HRM Practices on
Perceived Service Quality and the Contribution of Trust to the Interaction
between Them. Research and Practice in Human Resource Management: 15
(2), p. 1-20.
Ueno, A. (2008). Which management Practices are Contributory to Service Quality?
International Journal of Quality & Reliability Management, 25(6), 585-603.
Van Dyne, L., Cummings, L. L., & Parks, J. M. (1995). Extra-role Behaviors: In
Pursuit of Construct and Definitional Clarity (A Bridge over Muddled Waters).
Research in Organizational Behavior, 17, 215-285.
Van Dyne, L., Graham, J. W., & Dienesch, R. M. (1994). Organizational Citizenship
Behavior: Construct Redefinition, Measurement, and Validation. Academy of
Management Journal, 37, 765-802.
Van Looy, B., Van Den Bossche, T., & Buyens, D. (1998). The Role of Human
Resource Practices in Service Organizations. In B. Van Looy, R. Van
Dierdonck & P. Gemmel (Eds.), Services Management: An Integrated
Approach. London: Pitman Publishing
Vargo, S. L., & Lusch, R. F. (2004). The Four Service Marketing Myths - Remnants of
a Goods-Based, Manufacturing Model. Journal of Service Research, 6(4), 324-
335.
Vaughan, B. J., & Renn, R. W. (1999). Customer Service Citizenship Behavior:
Bridging the Employee-Customer Relationship. Advances in the Management
of Organizational Quality, 4, 151-186.
Vonesh, E. F. & Chinchilli, V. M. (1997). Linear and Nonlinear Models for the
Analysis of Repeated Measurements. New York: Marcel Dekker.
Walker, A. G., & Smither, J. W. (1999). A Five-year Study of Upward Feedback: What
Managers Do with Their Results Matter. Personnel Psychology, 52, 393-423.
Walker, J. T. (1999). Statistics in Criminal Justice: An Analysis and Interpretation.
USA: Aspen Publishers Inc.

222
Walton, R. E. (1985). From Control to Commitment in the Workplace. Harvard
Business Review, 63, 77-84.
Walz, S. M., & Niehoff, B. P. (1996). Organizational Citizenship Behaviors and Their
Effects on Organizational Effectiveness in Limited-Menu Restaurants. In J. B.
Key, & L. N. Dosier, (Eds.) Academy of Management Best Papers Proceedings
(pp. 307-311). Statesboro, GA: George Southern University.
Walz, S. M., & Niehoff, B. P. (2000). Organizational Citizenship Behaviors: Their
Relationship to Organizational Effectiveness. Journal of Hospitality and
Tourism Research, 24, 301-319.
Wang, H., Law, K. S., Hackett, R. D., Wang, D., & Chen, Z. X. (2005). Leader-
Member Exchange as a Mediator of the Relationship between Transformational
Leadership and Followers’ Performance and Organizational Citizenship
Behavior. Academy of Management Journal, 48(3), 420-432.
Wang, W., Lee, H., & Fetzer, S. J. (2006). Challenges and Strategies of Instrument
Translation. Western Journal of Nursing Research, 28, 310-321.
Way, S. A. (2002). High Performance Work System and Intermediate Indicators of
Firm Performance within the US Small Business Sector. Journal of
Management, 28, 765-785.
Wernerfelt, S. (1984). A Resource-Based View of the Firm. Strategic Management
Journal, 5, 171-174.
Wexley, K. N., & Latham, G. P. (1991). Developing and Training Human Resources in
Organisations (2nd ed.). New York, NY: Harper Collins Publishers.
Wiley, J. W. (1991). Customer Satisfaction: A Supportive Work Environment and Its
Financial Cost. Human Resource Planning, 14(2), 117.
Wilson, R. D. (1996). Research Design: Qualitative and Quantitative Approaches.
Journal of Marketing Research, 33(2), 252-255.
Winsted, K. F. (2000). Service Behaviours that Lead to Satisfied Customers. European
Journal of Marketing, 34(3), 399-417.
Wood, S., De Menezes, L., & Lasaosa, A. (2003). Family-Friendly Management in
UK: Testing Various Perspectives. Industrial Relations, 42(2), 221-250.
Wrenn, B., Loudon, D. L., & Stevens, R. E. (2001). Marketing Research: Text and
Cases. Binghampton, NY: The Haworth Press, Inc.
Wright, P., & Gardner, T. M. (2003). Theoretical and Empirical Challenges in
Studying the HR Practice - Firm Performance Relationship. In D. Holman, T.
D. Wall, C. Clegg, P. Sparrow & A. Howard (Eds.), The New Workplace:
People Technology, and Organization. Sussex, UK: John Wiley and Sons.
Wright, P. M., Gardner, T. M., & Moynihan, L. M. (2003). The Impact of HR Practices
on the Performance of Business Units. Human Resource Management Journal,
13(3), 21-36.
Wright, P. M., Gardner, T. M., Moynihan, L. M., & Allen, M. R. (2005). The
Relationship between HR Practices and Firm Performance: Examining Causal
Order. Personnel Psychology, 58, 409-446.
Wright, P. M., & McMahan, G. C. (1992). Theoretical Perspectives for Strategic
Human Resource Management. Journal of Management Studies, 18(2), 295-
320.

223
Wright, P. M., Smart, D. L., & McMahan, G. C. (1995). Matches between Human
Resources and Strategy among NCAA Basketball Teams. Academy of
Management Journal, 38(4), 1052-1074.
Yoo, D. K., & Park, J. A. (2007). Perceived Service Quality: Analyzing Relationships
among Employees, Customers, and Financial Performance. International
Journal of Quality & Reliability Management, 24(9), 908-926.
Yoon, M. H., Beatty, S. E., & Suh, J. (2001). The Effect of Work Climate on Critical
Employee and Customer Outcomes. International Journal of Service Industry
Management, 12(5), 500-521.
Yoon, S., Choi, D., & Park, J. (2007). Service Orientation: Its Impact on Business
Performance in the Medical Service Industry. Service Industries Journal, 27
(4), 371-388.
Yoon, M. H., & Suh, J. (2003). Organizational Citizenship Behavior and Service
Quality as External Effectiveness of Contact Employees. Journal of Business
Research, 56(8), 597-611.
Youndt, M. A., Snell, S. A., & Dean, J. W. (1996). Human Resource Management,
Manufacturing Strategy, and Firm Performance. Academy of Management
Journal, 39(4), 836-866.
Zacharatos, A., Barling, J., & Iverson, R. D. (2005). High Performance Work Systems
and Occupational Safety. Journal of Applied Psychology, 90, 77-93.
Zeithaml, V., & Bitner, M. J. (2003). Services Marketing: Integrating Customer Focus
across the Firm (3rd ed.). New York, NY: McGraw-Hill.
Zeithaml, V. A., Parasuraman, A., & Berry, L. L. (1985). Problems and Strategies in
Services Marketing. Journal of Marketing, 49(Spring), 33-46.
Zeithaml, V. A., Parasuraman, A., & Berry, L. L. (1990). Delivering Quality Service:
Balancing Customer Perceptions and Expectations. New York: Free Press.
Zerbe, W. J., Dobni, D., & Harel, G. H. (1998). Promoting Employees Service
Behaviour: The Role of Perceptions of Human Resource Management Practices
and Service Culture. Canadian Journal of Administrative Science, 15(2), 165-
179.
Zhou, L. (2004). A Dimension-Specific Analysis of Performance-Only Measurement
of Service Quality and Satisfaction in China's Retail Banking. Journal of
Service Marketing, 18(7), 534-546.
Zikmund, W. G. (2003). Business Research Methods (7th ed.). USA: Thomson
Learning, South-Western.
Zohar, D. (1980). Safety Climate in Industrial Organizations: Theoretical and Applied
Implications. Journal of Applied Psychology, 65, 96-102.