chapter 1 introduction - welcome to edwards school … painter/businessplans... · web viewchapter...
TRANSCRIPT

Sinochem Feasibility Study
Chapter 1: Introduction1.1 Background
This report constitutes a feasibility study for Sinochem1 to evaluate a fertilizer investment
opportunity in south east China. The hypothetical acquisition is between two companies:
Sinochem Group-China largest fertilizer company and ABC Fertilizer Company2- a mid-sized
fertilizer company which is located in Fujian Province of China. In 2001, ABC Company
proposed with Sinochem to use their one fertilizer production line as the capital to build a joint
venture (JV).
The feasibility study is based on the 200,000 tons/year synthetic fertilizer equipment which
ABC Company has completed the construction in year 2000. The product is a kind of granulated
compound fertilizer which contains essential nutrient for plant to grow. These nutrients include
Nitrogen, Phosphate and Potash (this kind of compound fertilizer is also named as NPK
fertilizer).3
After bilateral negotiations, Sinochem and ABC Company have signed a Letter of Intent in
2002 which includes the main principles for the future JV. A confidentiality clause was also
included. The letter pledged to exchange each party's commercial data for non-third party usage.
In 2002, the Investment Department of Sinochem Fertilizer Company had not enough
human resource to handle this project at that time; thus Sinochem had to temporary halt the
feasibility research of that project. In Dec 2003, Changfeng Liu--employee from Sinochem
Investment Department, now is assigned to U of S to study the one year MBA program--
contacted to Sinochem and ABC Company to express the willing to work on this project. Both of
them were pleased and agreed the request.
1 See more information about Sinochem at page 22 See more information about ABC company at page 43 See Figure A in Appendix 1
Changfeng Liu College of Commerce, University of Saskatchewan 1

Sinochem Feasibility Study
1.2 Parties Introduction
1.2.1 Sinochem Group
Sinochem Group, ranking among Fortune Global 500 companies for 14 consecutive years,
is one of the national foreign trade companies established immediately after the founding of P.R.
China, and has been ranked on top of the list of China’s largest import and export enterprises for
many years. It was one of the earliest Chinese companies entering Fortune Global 500 and has
enjoyed a sound reputation in the international petrochemical industry.
Triggered by factors both inside and outside, Sinochem faced a pressing challenge like
many other foreign trade companies operating mainly as an import and export agent. To make
foreign trade enterprises operating in socialist market economy fundamentally, Sinochem has
made great efforts to push forward market-oriented strategy and implement management
improvement project since 1998. It continued to nurture market-oriented core competitiveness,
extend core businesses into downstream and upstream sectors both at home and abroad, and set
up three pillar businesses including energy, agricultural inputs and chemicals. Sinochem is
striving to transform from a foreign trade agent into a commodity and service provider, and
eventually into a comprehensive player in the industries.
By extending into upstream (capital investment on resource-based projects) and
downstream (set up own logistic centers and distribution channels), Sinochem has formed an
integrated industrial chain and maintained a leading position in import and export volume.
Sinochem has also implemented Enterprise Resource Plan System (ERP) and Distribution
Management System (DMS) among its headquarters and all subsidiaries since 2000.
For fertilizer business unit, while further strengthening the position as the major fertilizer
importer and distributor, Sinochem actively participates in the restructuring of national
phosphate resources. It has built up a production capacity of 2.5 million tons of phosphate and
NPK at home and abroad, making Sinochem the largest fertilizer manufacturer in China.
Moreover, Sinochem has established a fertilizer distribution network covering 14 major
agricultural provinces.
Changfeng Liu College of Commerce, University of Saskatchewan 2
Sinochem Feasibility Study
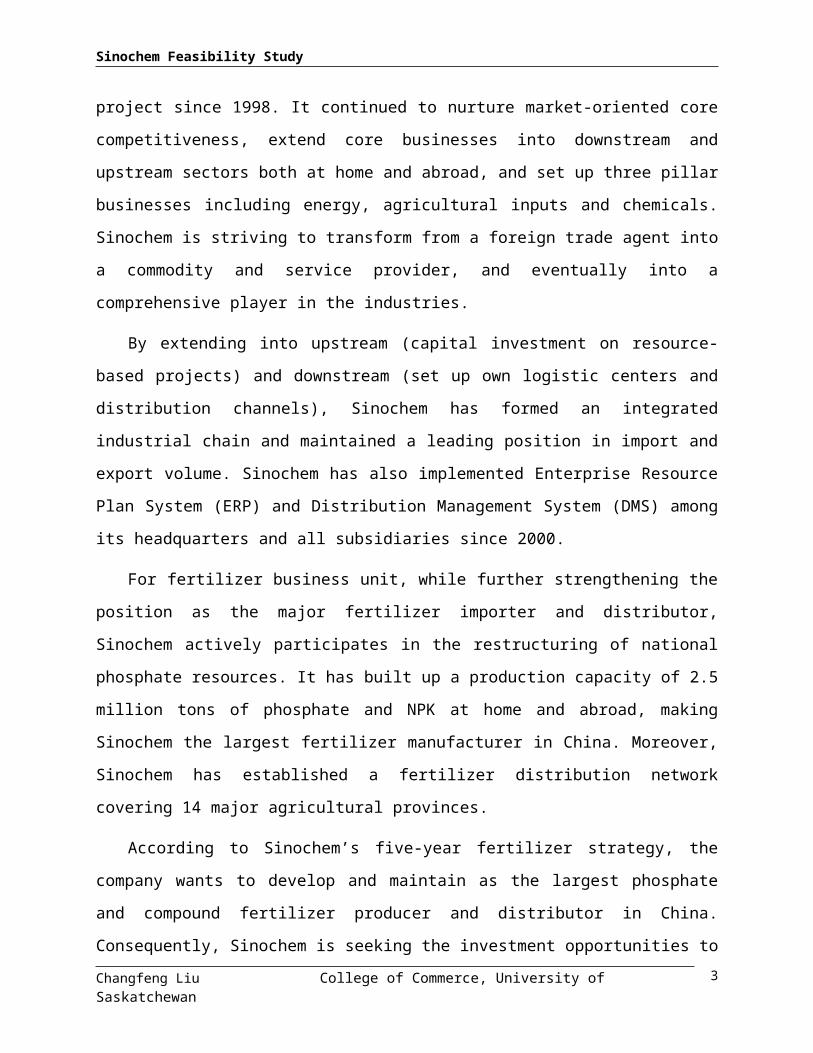
According to Sinochem’s five-year fertilizer strategy, the company wants to develop and
maintain as the largest phosphate and compound fertilizer producer and distributor in China.
Consequently, Sinochem is seeking the investment opportunities to expand its production
capacity by acquisitions in different provinces in China. The main function of investment
projects is to provide the own-brand products resource to serve the demand from different
logistic centers. This could facilitate Sinochem to establish the local distribution channels in
China promptly.
Figure 1.1 The Implementation Process for Sinochem fertilizer strategy
From the Figure 1.1, it’s clear that Sinochem need a production center in south east China to
produce own-brand fertilizer to serve for the local logistic centers.
Overall, Sinochem has four distinct strengths in fertilizer field:
Changfeng Liu College of Commerce, University of Saskatchewan
Logistic centers
Sinochem Investment projects
ABC Company
3
Sinochem Feasibility Study
Brand: Sinochem has developed and cultivated its brand over fifty years. Every year,
Sinochem sells over 6 million tons own-brand fertilizer to China market. The amount accounts
for around 60% of total China fertilizer market. Nearly 80% of them are imported from IMC,
Cargill, PCS and other main international fertilizer producers. Consequently, Sinochem’s brand
enjoys a high reputation among Chinese farmers.
Distribution network: From 1998 to 2003, Sinochem has set up 14 logistic centers in east
China. Over 200 distribution network were built to sell imported and domestic fertilizer to China
farmers.
Technical Human Resource: In 1989, Sinochem has invested a phosphate fertilizer
company (US-Agrichem) in Florida, U.S. with the capacity of 1.2 million ton per year. For 15
years, Sinochem has developed a technical expert’s team with rich operational experience which
could solve most of problems during fertilizer production.
Capital: For 5 consecutive years, Sinochem’s profit is around CAN$140 million. This
allows Sinochem has ability to implement investment activities freely.
1.2.2 ABC Fertilizer Company
ABC Fertilizer Company is the only middle-scale nitrogen and compound fertilizer
producer in Fujian Province, which is located in south-east China. The annual production
capacity is 170,000 metric tons (Mt) urea and 200,000 Mt compound fertilizers (NPK).4
From 1998 to 2000, the company inputted CANS$10 million to construct a new NPK
production line. But, the NPK line has only achieved 20% capacity because the workers could
not master the complicated technique. Also its own brand was not cognized by local market.
This leads continuous loss to ABC Company for three years. The management hoped to
cooperate with Sinochem eagerly by the NPK line to establish a JV to help them change current
urgent condition.
1.2.3 The Joint Venture (Sinochem-ABC limited Company)
The JV will be set up by Sinochem and ABC Company.
4 see Figure B in Appendix 1
Changfeng Liu College of Commerce, University of Saskatchewan 4

Sinochem Feasibility Study
ABC Company is supposed to use the total equity of the NPK production line and extra
cash as their capital. And Sinochem plan to use pure cash to invest. The amount of cash that
Sinochem would invest would meet the total demand of the projected cash meanwhile Sinochem
could be the larger shareholder for JV.5 The JV would undertake the¥41,570,000 debt of NPK
line from ABC Company.
The J-V’s equity structure is as followed:
Figure 1.2 JV Equity Structure
The JV plans to produce 200,000 Mt compound fertilizer annually after de-bottlenecking.
Sinochem authorized J-V to use “Sinochem” brand to its product. Fujian Province is the target
market which the NPK market is dominated by several foreign brands now. By leveraging
Sinochem’s logistic center and distribution network, the J-V plans to use local products to
substitute the foreign products in this market.
5 The equity structure is described in detail in Financial Plan.
Changfeng Liu College of Commerce, University of Saskatchewan
53% 47%The Joint Venture
Total equity47,000,000
5
Sinochem Group
Equity capital investment
Cash 25,000,000
ABC Fertilizer Company
Urea Production Line
NPK Production LineCapital equity 11,600,000Cash 10,400,000
Sinochem Feasibility Study
Chapter 2: Operations Plan2.1. Production Introduction
Most producers of compound fertilizers in world are producing nitrate based mineral
compound fertilizers under the product name "NPK". These products contain nitrogen in
ammoniacal (NH4) and nitrate (NO3) form, phosphorus expressed as P2O5, and normally also
potassium expressed as K2O.
The product name "NPK" is normally followed by three numbers to indicate the percent of
N, P2O5 and K2O which the product contains, e.g. 24–6–12 indicates that this particular grade
contains 24% N (nitrogen compounds), 6% P2O5 (phosphorus compounds) and 12% K2O
(potassium compounds). In addition, the fertilizer may contain magnesium, boron, sulphur,
micronutrients, etc. The typical content of nutrients (N + P2O5 + K2O) will normally be in the
range of 40-60%.
Fertilizer industry has developed over one hundred years. It’s also a kind of “setting sun”
industry, but it’s an essential industry for agriculture. Because the production techniques have
been developed into mature period, there isn’t too much significant new high-tech involved into
fertilizer production. Consequently, the efficiency and stability are the two main targets for
investors to choose the production techniques.
Nowadays, NPK fertilizers can be produced in four, basically different, ways:
Ammonium phosphate/ammonium nitrate-based NPK fertilizers
Nitrophosphate-based NPK fertilizers (mixed acid route)
Nitrophosphate-based NPK fertilizers (ODDA-route)
Mechanical blending of single or multi-nutrient components
The four processes are based on different technologies, having different investment costs,
economic impact, and energy consumptions. To save capital, this project did not invest in
phosphate rock refinery. Because the commercial phosphate acid is available in Yunnan province
which is about 1000km from the plant, it’s convenient to purchase phosphate acid outside instead
of producing by itself.
Changfeng Liu College of Commerce, University of Saskatchewan 6

Sinochem Feasibility Study
This compound fertilizer project is based on a mixed acid (phosphate acid and sulphur acid)
route with a capacity of 200,000 Mt/y of NPK. This production capacity makes it possible to
produce 660 t/d of NPK 15-15-15.
This plan describes the principles for production, pollution prevention and control and
defines achievable levels for waste and emissions to air and water for the existing NPK plants.
The plan does not give a detailed description of all the processes in operation.
Emission figures and production rates in a specific production unit will depend on the
product grade, but the grade selected for this feasibility study can be considered an average
grade: NPK grade (15–15–15 / N–P2O5–K2O).
In this project, there will be two kinds of products which grade as 15-15-15 (K2SO4 as a raw
material for potash) and 18-10-12 (KCI as a resource for potash), respectively. These two
products are designed for the different demands from grain farmers and fruit farmers according
to the local soil and plant condition. This report assumes each of the products has equal capacity.
In really case, the production would depend on the market demand.
2.2. Production Processes
The selection of the basic techniques is based on several factors:
Target product range (N/P/K ratio)
Raw material basis
Quality parameters
Flexibility of process
Size of production plant
Integration with other processes
Economic factors
There are three basic techniques for granulation:
Granulation with a pipe reactor system
Drum granulation with ammonization
Changfeng Liu College of Commerce, University of Saskatchewan 7

Sinochem Feasibility Study
Mixed acid process with phosphate rock digestion
This project chooses the Granulation with a pipe reactor system as its technique in term of
its following characters:
Broad range of formulations
Direct neutralization of phosphoric and sulphuric acid in a pipe reactor
No phosphate rock digestion
Although high costs of raw materials (P2O5), it’s easy to purchase
Simple gas scrubbing
Low costs of labor and maintenance
Low cost of investment
The process works with a classical granulation loop but incorporates one pipe reactors. A
mixture of phosphoric and sulphuric acids (optional) is neutralized in the pipe reactors with
liquid ammonia. A wide range of grades, including ammonium phosphates, can be produced.
The process is flexible and easy to operate and the pipe reactors can be operated with a high turn-
down ratio.
2.2.1 Granulation and drying section
The required solid raw materials such as mono-ammonium phosphate (MAP), potassium
chloride (KCI), potassium sulphate (K2SO4), secondary nutrients, micronutrients and filler are
metered and fed into the granulator together with the recycle. The pipe reactor fitted in the
granulator is designed to receive phosphoric acid, part of the ammonia, and all other liquid feeds
such as sulphuric acid and recycled scrubber liquor.
Concentrated ammonium nitrate solution may be added directly into the granulator and
ammoniation rates in the pipe reactor vary according to the product. Further ammoniation may
be carried out in the granulator.
In the dryer The N/P mol ratio is 1.00 (essentially production of mono-ammonium
phosphate). The MAP produced consists of very fine particles and passes via the cyclones and
Changfeng Liu College of Commerce, University of Saskatchewan 8
Sinochem Feasibility Study
screens back to the granulation drum. The granules obtained are dried in a drying section using a
heated air stream.
2.2.2 Screening, crushing, cooling and coating
The dry granules are screened into three fractions. The over-size is removed and returned
via the crusher to the granulator, together with the fines. The product-sized fraction is removed
with the possibility of returning part of this fraction to the granulator to stabilize the recycle loop.
Finally the on-spec fraction is cooled in classical cooling equipment such as a fluidized bed
cooler. The cooled product is fed into a coating drum where a surface coating is applied to
prevent caking.
2.2.3 Gas scrubbing and dust removal
Gases from the granulator and the dryer are scrubbed in Venturi scrubbers with
recirculating ammonium phosphate or ammonium sulpho-phosphate solution. Make-up
phosphoric and sulphuric acid is added for pH control if necessary. The scrubber liquor which is
being recycled is fed to the pipe reactor in the granulator.
Finally, the gases are vented through cyclonic columns irrigated with an acidic solution.
The gases coming from the dryer are de-dusted in high efficiency cyclones to remove the
majority of the dust before scrubbing. The air coming from the cooling equipment is generally
recycled as secondary air to the dryer after de-dusting. General de-dusting equipment is installed
in the entire plant.
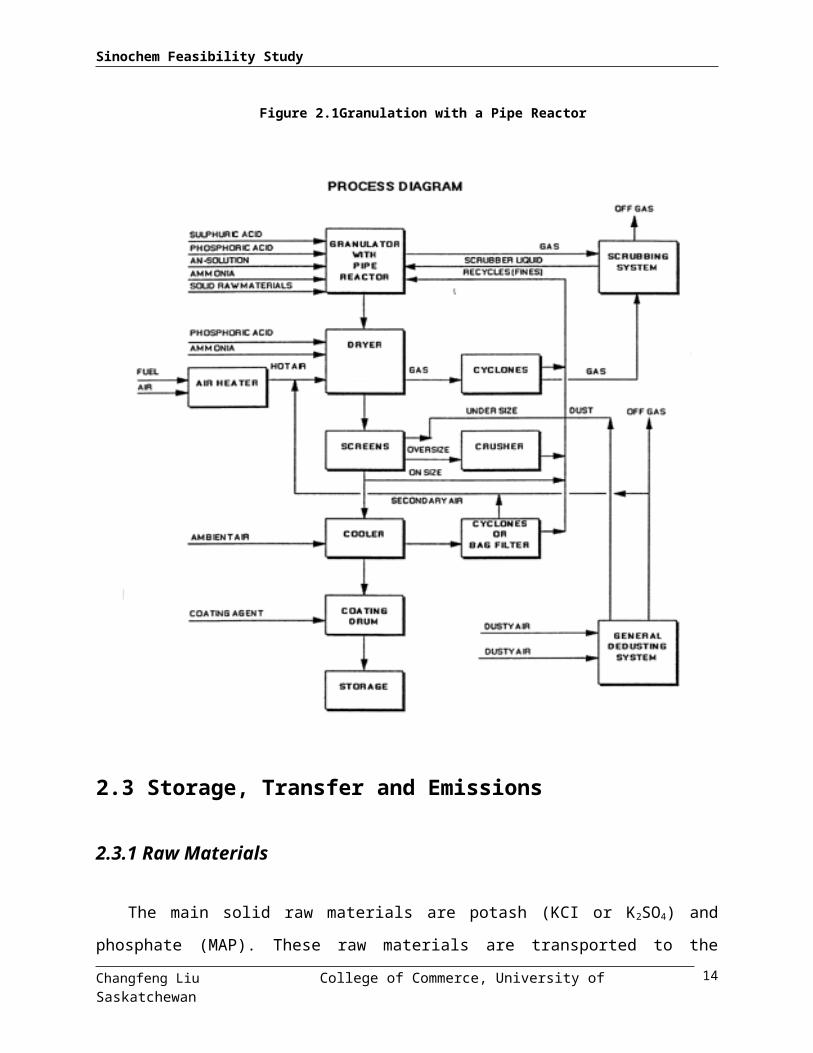
The layout of equipment is shown at the Appendix 1 as Figure C.
The main process steps are as followed:
Changfeng Liu College of Commerce, University of Saskatchewan 9

Sinochem Feasibility Study
Figure 2.1Granulation with a Pipe Reactor
2.3 Storage, Transfer and Emissions
2.3.1 Raw Materials
The main solid raw materials are potash (KCI or K2SO4) and phosphate (MAP). These raw
materials are transported to the production site by trains or trucks. They are tipped from wagons
and lorries into hoppers which feed the materials to conveyors. Belt conveyors are totally
Changfeng Liu College of Commerce, University of Saskatchewan 10
Sinochem Feasibility Study
enclosed in tunnels. Raw materials are stored in closed buildings or silos. Materials in storage are
handled by crane. The liquidized materials are H3PO4, Liquidized Urea and Liquidized ammonia.
H3PO4 will be stored into tanks and transferred to reactors. The other two would be transferred
directly to granulator by pipes from ABC Company’s storage tanks.
2.3.2 Products
Products are granulated fertilizers of different grades (the main product is 15-15-15, other
production of different grade products are determined by the demand of market). Belt conveyors
are placed in closed tunnels. Bulk storage is in closed buildings with walls to separate different
grades of product. Materials are handled by scraper. Fertilizers are hygroscopic and thus the
storage atmosphere is air-conditioned.
Fines and lumps must be screened out from the product after bulk storage for quality
reasons. The separated over- and under-sized material is recycled back to the NPK plant.
The entire final product is bagged in 50kg bags. Bagged products are normally stored under
cover.
2.3.3 Emissions
There is practically no emission to the environment from materials handling when this is
done correctly. There is no contaminated waste water and the only emission to air is the dust
collection air from the bagging plant and screening station. The average air volume through dust
filters is 4,000 Nm³.h-1 and the typical dust content after the filters is 30mg.Nm-3
2.4 Site plan
The production site has considered several factors:
Production flexibility
Production efficiency
Environmental impact
Changfeng Liu College of Commerce, University of Saskatchewan 11

Sinochem Feasibility Study
The NPK plant is adjacent to ABC Company’s urea plant where is located in Yong’an city,
Fujian Province. Therefore this could decrease the distance to transport liquidized ammonia and
urea from urea plant to NPK plant. Also, the inventory and final product building is near the
main highway. This could lower down the cost for transportation.
2.5 Supply Analysis6
N, P and K are three main materials for compounded fertilizer. Because Sinochem is the
only agent to sell imported potash, JV could get KCI and K2SO4 at a very competitive price.
ABC Company will offer urea and liquidized ammonia as the resource of N. In term of Yunnan
Province has the main phosphate rock storage in China, most of the NPK producers buy MAP
and H3PO4 from that province.
Table 2.1 Supply Analyses
Main Raw Material Price
(Per ton)
Annual Demand
(tons)
Buyer Seller
MAP
(N 10% -P2O5 50%)
132078 34100 JV Yunnan tri-circle phosphate company (by rail)
KCI (K2O 60%) 1100 60000 JV Sinochem fertilizer Co. (by rail)
K2SO4 (K2O 50%) 1460 40000 JV Sinochem fertilizer Co. (by rail)
Liquidized ammonia 1238 7320 JV ABC Company (by Pipes)
Liquidized urea
(N 46%)
940 44060 JV ABC Company (by Pipes)
H3PO4 (50%) 2780 13000 JV Yunnan tri-circle phosphate company (by rail tank)
H2SO4 (98%) (optional)
365 8160 JV Jiangxi Guixi Copper Co. (by rail tank)
6 All the currency in this feasibility study is RMB. The exchange ratio from CAN to RMB is around 6.1:1.7 All the Raw Material prices are before Value Added Tax (More introductions in Appendix 4 Financial Plan).8
Changfeng Liu College of Commerce, University of Saskatchewan 12
Sinochem Feasibility Study
2.6 Cost of Goods Manufactured
According to the nature of fertilizer manufacture, raw materials cover the most percentage
of cost for the final product. Traditional fertilizer plants are labor intensive. Because JV adapts
DCS system as its automatic production control system, the direct labor cost is rather low.
Consequently, direct materials account for 93.71% of total cost, while labor only has 0.71% for
final product.
Table 2.2 Cost of Goods Manufactured
NPK (K2SO4 based) NPK (KCI based) TotalPercenta
ge
Direct Materials¥122,348,1
00 Direct Materials¥95,168,47
6 ¥217,516,57
6 93.71%
Direct Labor Used ¥828,000 Direct Labor Used ¥828,000 ¥1,656,000 0.71%Manufacturing Overhead ¥6,474,976 Manufacturing Overhead ¥6,474,976 ¥12,949,952 5.58%Total Cost of Goods Manufactured
¥129,651,076
Total Cost of Goods Manufactured
¥102,471,452
¥232,122,528 100.00%
2.7 Capital Budget
2.7.1 Working Capital Plan
According to the <Letter of Intent>, Sinochem would invest ¥25,000,000 cash as well as
ABC invests ¥ 10,400,000 cash for JV. Meanwhile, the new company would borrow
¥20,000,000 from bank as short term liability. Therefore, the total increased cash for the JV is
¥55,400,000 at the beginning year.
After the JV sets up, the management would invest ¥8,604,700 into the construction of
new JV office building and NPK production De-bottlenecking. Consequently, the new long term
assets would be ¥61,774,700. The total working capital is ¥54,546,057 (See more detail on
Financial Plan).
Inventories
Changfeng Liu College of Commerce, University of Saskatchewan 13
Sinochem Feasibility Study
There are three kinds of inventories: raw materials, products under processing and final
products. To save cost, the final products are stored into bulk warehouse initially. When the
orders are coming, they are bagged and transported.
Figure 2.2 Average Collection Periods
10-45 days 5 days 45 days
Raw Material Processing Final Products
The total inventory periods are around 95 days.
Account Receivable
In nowadays China fertilizer market situation, credit policy only exists between companies
which had business each other over many years. Otherwise, the sellers only begin to transport
their products unless they have received buyers’ payment in advance. In this feasibility study, JV
will use 30 days as its average collection period, because most of their upstream and downstream
clients have been maintaining a good business relationship with Sinochem.
Average collection period: 30 days; recycle turnover: 360/30=12
Account receivable= total cost of sales/ recycle turnover
Account payable
Also, the average payment period is 30 days.
The total inventory, account receivable and account payable have been calculated in
Working Capital Plan.
2.7.2 Total Capital Cost
In the first year, the total capital costs will be ¥61,774,700. After the following years, JV
plan to input more money to maintains the equipments and increase the capacity. According to
Changfeng Liu College of Commerce, University of Saskatchewan 14

Sinochem Feasibility Study
the China Long term assets Depreciation Rules, the assets will be depreciated over twelve years.
The CCA rate is 8% and the salvage rate is 4%.
Table 2.3 Total Capital Cost
Description EstimatedCost ($)
Land (rental) ¥0Building Raw Material Warehouse ¥3,288,000 Products Warehouse ¥3,795,300 Bulk Warehouse ¥4,344,000 Main Production Building ¥8,723,000 Office Building ¥3,105,000 Landscaping ¥85,000 Total Cost ¥23,340,300Production Equipment: Pipe ¥740,000 Pipe Reactor ¥4,370,000 Screener ¥650,000 Pump ¥795,000 Storage Tanks ¥2,531,000 Granulator ¥3,127,000 Cooler ¥2,650,000 Bagging machine ¥400,000 Belt conveyer ¥2,120,000 Crusher ¥963,000 Dryer ¥2,542,400 Coating system ¥1,500,000 Tractor ¥1,382,000 Dust collector ¥870,000 Scrubber ¥1,204,000 Distributed Control System (DCS) ¥3,560,000 Design and Installation ¥8,580,000Office Equipment ¥450,000 Total Equipment Costs ¥38,434,400Total Capital Costs ¥61,774,700
Changfeng Liu College of Commerce, University of Saskatchewan 15

Sinochem Feasibility Study
2.8 Quality Control
From management perspective, total quality management (TQM) program and Activity
Based Management (ABM) is essential tools to help JV to improve product quality and decrease
cost in a shot time. In a long run, 6-Sigma program would set higher benchmark standard for
JV.
Because the location of plant site is near south sea, the Taiwan and south Asia markets
could be the promising target market for JV in future. Therefore, ISO registration ought to be
considered when the business is planning to export.
From a technique perspective, DCS system and de-bottlenecking plan are two crucial steps
for the new engineers to master the operation technique promptly
2.8.1 DCS system
To monitor and control day to day production, the NPK line has installed a new distributed
control system (DCS). DCS allows the plant to establish a common control room from which all
aspects of the production process could be monitored and controlled. Most of operation could be
done by computer. Thus, this decreased the probability of human mistake.
2.8.2 De-bottlenecking Plan
Because the former engineering team has not accumulated certain production experience,
the NPK line could not achieve its designed capacity steadily. By leveraging Sinochem’s
advantages, several senior engineer experts would help JV to diagnose and solve technique
problems. Also, they could train the main operation staff shifts by shifts.
2.9 Capacity Plan
Table 2.4 Capacity Expansion Plan (100%)Y1 50% Y7 115%Y2 75% Y8 120%Y3 100% Y9 125%Y4 100% Y10 125%
Changfeng Liu College of Commerce, University of Saskatchewan 16

Sinochem Feasibility Study
Y5 105% Y11 125%Y6 110% Y12 125%
The capacity expansion will fit the demand of local market demands. JV would invest more
capital every year according to the expansion plan.
Changfeng Liu College of Commerce, University of Saskatchewan 17

Sinochem Feasibility Study
Chapter 3: Human Resource Plan3.1 The period of feasibility research
3.1.1 Shareholder’s agreements
After bilateral negotiations, Sinochem and ABC Company have signed a Letter of Intent in
2002 which including the main principles for the future JV. The core content is as followed:
Company Name: Sinochem-ABC Fertilizer Company
Brand: Sinochem authorized JV to use its brand and logo—
Board of directors: the board of directors is made up of 5 people. Three come from
Sinochem and the other two will be assigned from ABC Company. Sinochem will recommend
the directors.
Management: Sinochem will recommend the candidates of CEO and chief sale officer to
the board. ABC Company will suggest the candidates of vice CEO, financial officer and
production officer to the board.
3.1.2 Project team and timetable
The Project Team consists of the personnel from two parties:
Sinochem: Financial Staff, Engineer, Lawyer and Marketing Staff.
ABC Company: Vice President and financial staff.
The project Manger should take responsibility to each part and lead the team to complete
the feasibility study during budget time.
See Appendix 2, Table A: Sinochem-ABC Company Feasibility Study Timetable.
Changfeng Liu College of Commerce, University of Saskatchewan 18

Sinochem Feasibility Study
3.2 The period of Integration
3.2.1 Strategic human resource management plan
JV develops the vision that employees and the company should be able to grow together.
JV plans to set up an employee performance management system which links performance
with income, encourages employees to seek better performance, serves as a major tool for
managers to evaluate the capacities of employees and helps raise the value of both the company
and the work force.
JV will launch the motivation system to balance the relationship between the management
and employees. The management will integrate physical and spiritual, short-term and long-term
motivations together so that employees feel their valuable work is recognized and well paid. JV
also plans to set up a sound welfare system to offer employees more benefits.
The JV’s value and culture should keep same with Sinochem’s, which is: Personality-
Honest, Cooperative, and Keen on Learning; Job Attitude- Serious, Creative, and striving for the
Top.
The purpose for strategic human resource management is: Establish strict reasonable and
effective rules; Cultivate excellent loyal and happy employees.
In the beginning period, JV needs more advanced personnel to join the company. The
recruitment channels could be: Key position-business relationship, HR company and creditable
recommendation; Common position-large scale recruitment, local HR centre and
recommendation.
3.2.2 Organizational chart
See Appendix 2; Figure A, Sinochem-ABC Company Feasibility Study Timetable
Changfeng Liu College of Commerce, University of Saskatchewan 19

Sinochem Feasibility Study
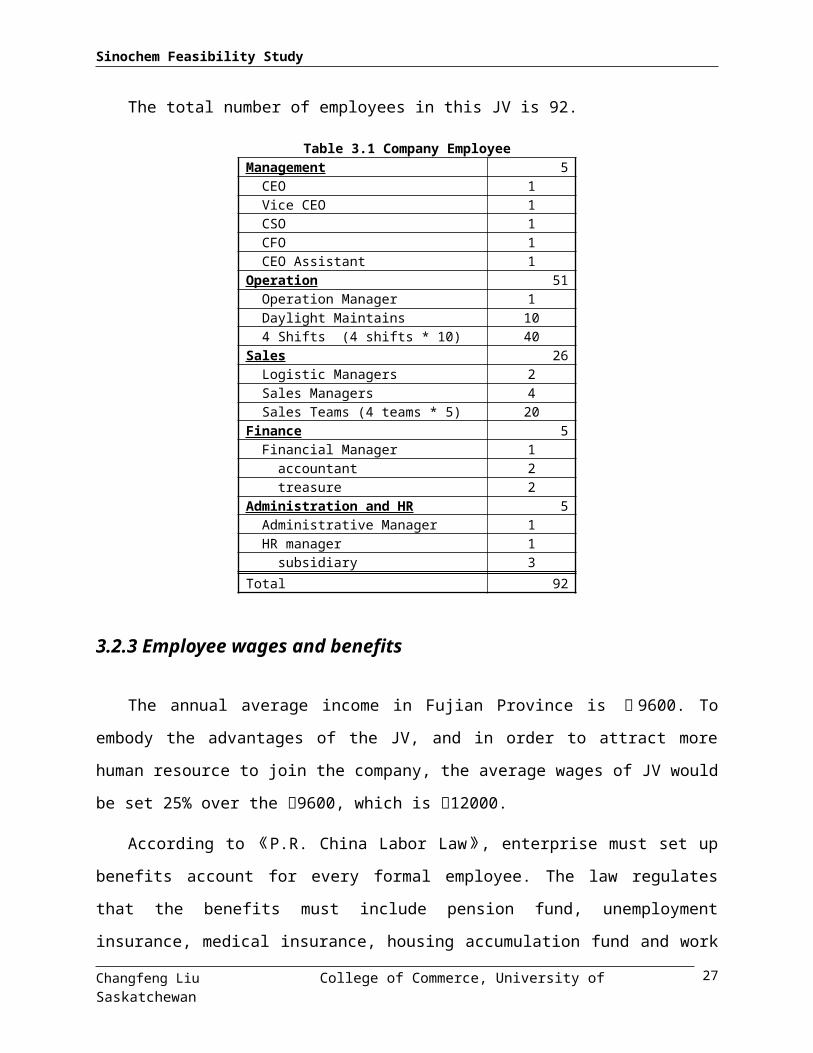
The total number of employees in this JV is 92.
Table 3.1 Company EmployeeManagement 5 CEO 1 Vice CEO 1 CSO 1 CFO 1 CEO Assistant 1Operation 51 Operation Manager 1 Daylight Maintains 10 4 Shifts (4 shifts * 10) 40Sales 26 Logistic Managers 2 Sales Managers 4 Sales Teams (4 teams * 5) 20Finance 5 Financial Manager 1 accountant 2 treasure 2Administration and HR 5 Administrative Manager 1 HR manager 1 subsidiary 3Total 92
3.2.3 Employee wages and benefits
The annual average income in Fujian Province is ¥9600. To embody the advantages of the
JV, and in order to attract more human resource to join the company, the average wages of JV
would be set 25% over the ¥9600, which is ¥12000.
According to 《P.R. China Labor Law》, enterprise must set up benefits account for every
formal employee. The law regulates that the benefits must include pension fund, unemployment
insurance, medical insurance, housing accumulation fund and work injury insurance. The
optional benefits could include family treasure insurance and maternity insurance and personal
insurance. The JV plans to pay the Compulsory and optional benefit for all the employees.
The benefits proportion to wage is shown below:
Changfeng Liu College of Commerce, University of Saskatchewan 20

Sinochem Feasibility Study
Table 3.2 Benefits proportion to wage
Items Pensio
n fund
Unemploymen
t insurance
Medical
insuranc
e
housing accumulation fund
work injury
insurance
maternity
insurance
Family
treasure
insurance
personal
insuranc
e
Total
Individual
Undertaking
Proportion
8% 0.5% 2% 8% ------ ----- ------ ----- 18.5%
Enterprise
undertaking
Proportion
20% 1.5% 10% 8% 0.4% 0.1% 3% 7% 50%
The total benefit that enterprise should undertake is 50% out of wages. Consequently, the
average human capital is ¥12000 * 150%=¥18000.
3.2.4 Training plan
In the first beginning period, training is the most important tool to integrate two different
value and culture.
JV should also cooperate with professional training and consulting organizations and well-
known domestic and overseas colleges in offering training to key managers and human resource
reserves, which helps increase the value of human capital.
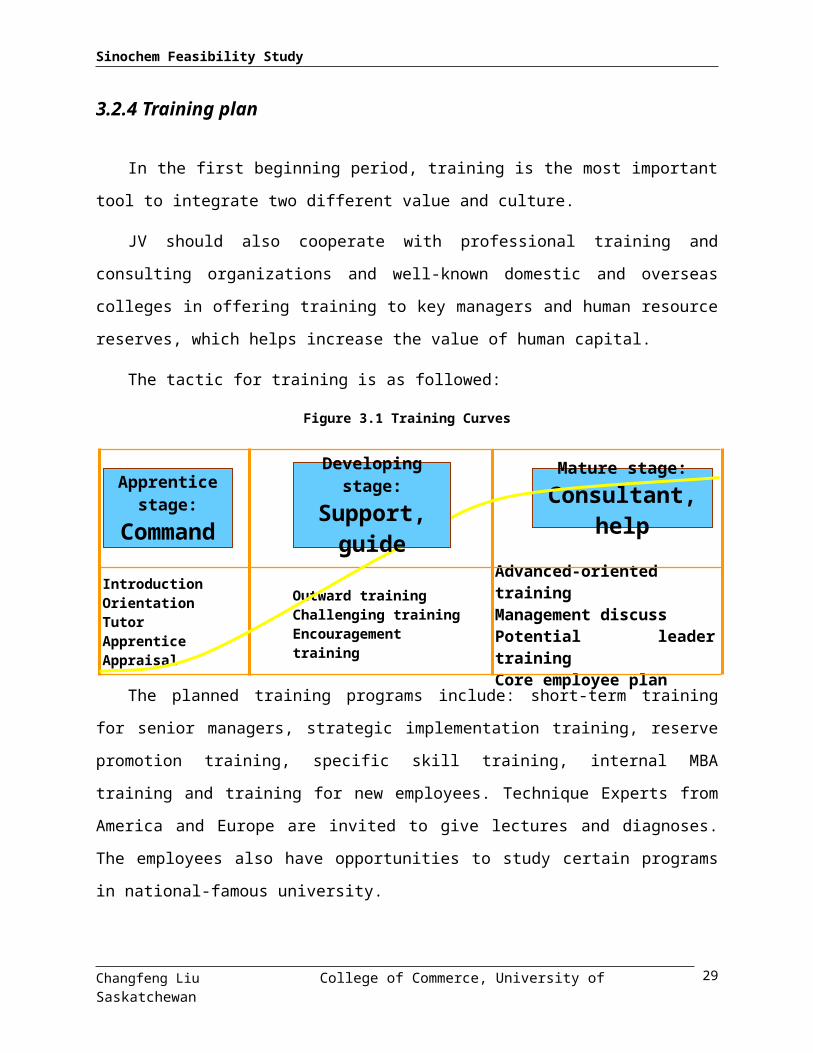
The tactic for training is as followed:
Figure 3.1 Training Curves
Changfeng Liu College of Commerce, University of Saskatchewan
IntroductionOrientationTutorApprentice Appraisal
Mature stage:Consultant, help
Outward trainingChallenging trainingEncouragement training
Advanced-oriented trainingManagement discussPotential leader training Core employee plan
Developing stage:Support, guide
Apprentice stage:
Command
21

Sinochem Feasibility Study
The planned training programs include: short-term training for senior managers, strategic
implementation training, reserve promotion training, specific skill training, internal MBA
training and training for new employees. Technique Experts from America and Europe are
invited to give lectures and diagnoses. The employees also have opportunities to study certain
programs in national-famous university.
Changfeng Liu College of Commerce, University of Saskatchewan 22

Sinochem Feasibility Study
Chapter 4: Marketing Plan4.1 Compound Fertilizer Market Analysis and Sales Forecast
4.1.1 China Compound Fertilizer Market
China’s high-grade compound fertilizer industry developed very quickly in recent years.
The production capacities developed fast; output increased. Many new projects especially high-
grade NPK started. The proportion of the output of high-grade compound fertilizer in China’s
total phosphate and compound fertilizer output increased rapidly.
4.1.1.1 The General Situation of China’s Fertilizer Industry
After 50 years of development, the technology in China’s fertilizer industry has reached a
certain level. The product diversity has been improved. The structure has turned to be
reasonable. The production capacity has much increased. By the end of 2002, there were around
1200 fertilizer enterprises in China, among which there were 644 nitrogen fertilizer enterprises,
524 phosphate fertilizer enterprises and 41 potash fertilizer enterprises.
Figure 4.1The Structure of China’s Fertilizer Industry
In 2002, China’s fertilizer output reached 33.965 Million metric tones (Mt), up 5.9% over
2001, among which the nitrogen fertilizer, the phosphate fertilizer and the potash fertilizer
Changfeng Liu College of Commerce, University of Saskatchewan 23
Sinochem Feasibility Study
outputs reached 25.267 Mt, 7.394 Mt and 1.304 Mt, making up 74.39%, 21.77% and 3.84% of
the total and increasing by 4.75%, 8.72% and 13.55% against 2001 respectively.
Figure 4.2The Structure of China’s Fertilizer Production in 2002
In 2002, on nitrogen fertilizer, the urea output reached 14.548 Mt, accounting for 58% of
China’s total nitrogen fertilizer output. However, facing intensive competition and further
development of restructuring and product mix adjustment, some producers will face bankruptcy.
Therefore, the output in total nitrogen fertilizer production has continued to decline year-on-year.
Meanwhile, the production capacities and outputs of the high-analysis phosphate and
compound fertilizers have been growing steadily in China. As a result, ammonia consumption
has been increasing accordingly. For example, ammonia consumption for the production of
DAP/MAP and chemically-produced compound fertilizers reached nearly 1.50 Mt, and
accounted for 6% of the total ammonia output.
In 2002, Chinese phosphate fertilizer output was 7.394 Mt, among which the high-analysis
phosphate and compound fertilizers output was 2.958 Mt, up 11.92% over 2001 and accounting
for 40% of Chinese total phosphate fertilizer production ; the low-analysis phosphate fertilizers
output was 4.436 Mt, accounting for 60%.
At present, there are more than 300 NPK producers that have production licenses, and most
of the product is low concentration NPK (25-30%) and the average operation rate is low. There
are 109 enterprises that produce high-analysis phosphate and compound fertilizers in China,
among which 47 enterprises are producing MAP only, 8 enterprises producing DAP only, 4
Changfeng Liu College of Commerce, University of Saskatchewan 24

Sinochem Feasibility Study
enterprises producing TSP only, 15 enterprises producing NPK only ; and the remaining 35
enterprises are able to produce both MAP/DAP and NPK.
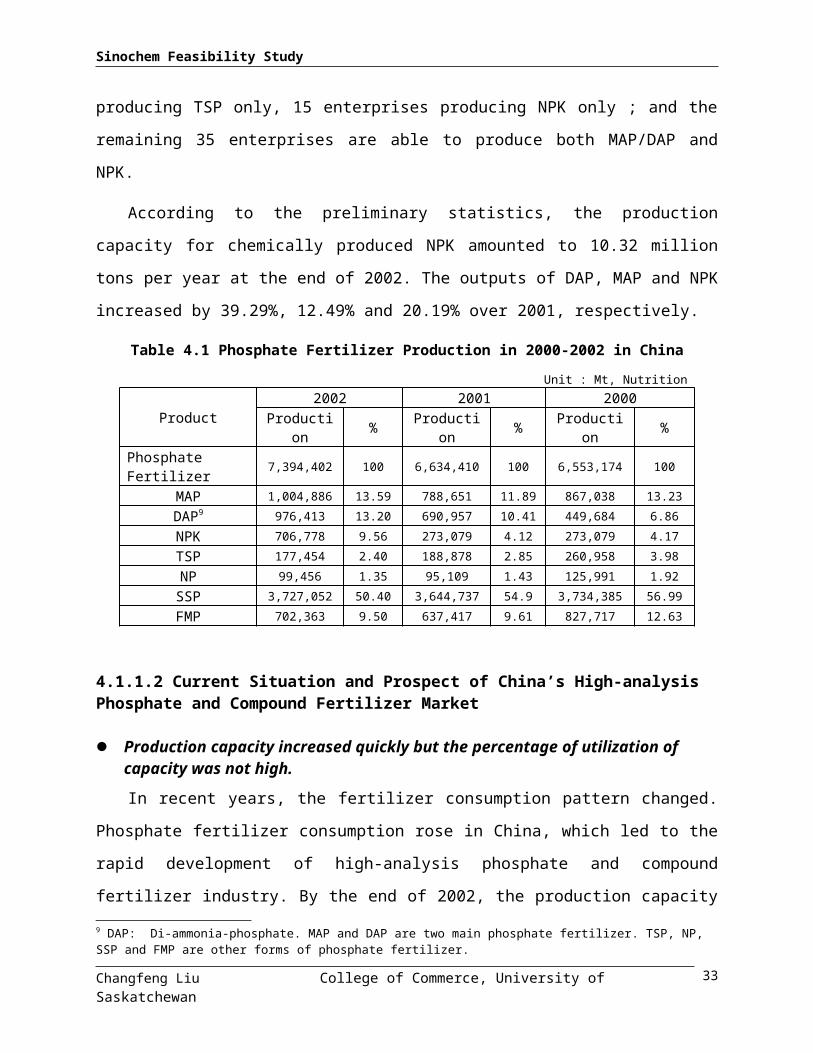
According to the preliminary statistics, the production capacity for chemically produced
NPK amounted to 10.32 million tons per year at the end of 2002. The outputs of DAP, MAP and
NPK increased by 39.29%, 12.49% and 20.19% over 2001, respectively.
Table 4.1 Phosphate Fertilizer Production in 2000-2002 in China
Unit : Mt, Nutrition
Product 2002 2001 2000
Production % Production % Production % Phosphate Fertilizer 7,394,402 100 6,634,410 100 6,553,174 100
MAP 1,004,886 13.59 788,651 11.89 867,038 13.23
DAP9 976,413 13.20 690,957 10.41 449,684 6.86
NPK 706,778 9.56 273,079 4.12 273,079 4.17
TSP 177,454 2.40 188,878 2.85 260,958 3.98
NP 99,456 1.35 95,109 1.43 125,991 1.92
SSP 3,727,052 50.40 3,644,737 54.9 3,734,385 56.99
FMP 702,363 9.50 637,417 9.61 827,717 12.63
4.1.1.2 Current Situation and Prospect of China’s High-analysis Phosphate and Compound Fertilizer Market
Production capacity increased quickly but the percentage of utilization of capacity was not high.
In recent years, the fertilizer consumption pattern changed. Phosphate fertilizer
consumption rose in China, which led to the rapid development of high-analysis phosphate and
compound fertilizer industry. By the end of 2002, the production capacity of chemically-
produced phosphate and compound fertilizer reached 17.30 Mt. The proportion of the production
capacity of high-analysis phosphate and compound fertilizer in total phosphate fertilizer capacity
went up to 48% from 10% ten years ago.
The increases of MAP/DAP and NPK capacities contributed largely to the increase of
Chinese phosphate and compound fertilizer capacity. During the period of 1991 to 2001,
MAP/DAP capacity rose at an average annual increase rate of 17.7%. The production capacity of
9 DAP: Di-ammonia-phosphate. MAP and DAP are two main phosphate fertilizer. TSP, NP, SSP and FMP are other forms of phosphate fertilizer.
Changfeng Liu College of Commerce, University of Saskatchewan 25
Sinochem Feasibility Study
chemically-produced NPK reached 1.26 Mt, growing at an average annual rate of 35.5% (see
Figure 3).
Figure 4.3The Production Capacity of Chemically Produced NPK in 1995-2001 in China
The production capacity of high-analysis phosphate and compound fertilizers increased
notably in the past two years. The production capacity of chemically-produced NPK rose by
54%. The main additional production capacities are listed in Table 4.2.
Changfeng Liu College of Commerce, University of Saskatchewan 26
Sinochem Feasibility Study
Table 4.2The main additional production capacities
Province Enterprises Additional Capacity (1000t of product) Product
Hebei Sino-Arab Chemical Fertilizers Co Ltd 700 NPK Jiangsu Jiangsu Ruihe Fertilizer Co Ltd 40 MAP
Anhui Xuanzhou Sulfuric Acid Plant 40 MAP Hefei Sifang Phosphate and Compound Fertilizer Co Ltd 20 MAP Anhui Liuguo Chemical Industry Stock Co Ltd 240 DAP
Shandong
Laizhou Jinxing Chemical Co Ltd 100 SOP-NPK Qingdao Changhua Group 100 SOP-NPK Tianli Biochemical Industry Co Ltd 100 SOP-NPK Zibo Bofeng Compound Plant 100 SOP-NPK Anqiu Aobao Chemical Co Ltd 100 SOP-NPK
Hubei Hubei Xiangyun Chemical Holding Co 80 MAP Xiangfan Inorganic Chemical Plant General 30 MAP
Chongqing
Qijiang Fertilizer Plant General 20 MAP Fuling Chemical Holding Co Ltd 20 MAP Win-win Group Nanchuan Weifeng Chemical Plant General 40 MAP
Sichuan
Sichuan Shihua Holding Co Ltd 50 MAP Sichuan Hongda Holding Co Ltd Shihua Co 60 MAP Sichuan Longmang Phosphate Product Holding Co 20 MAP
Sichuan Shifang Yingfeng Industry Co Ltd 50 MAP 20 SOP-NPK
Sichuan Sulfuric Acid Plant 60 MAP Jinhe Phosphate Mine Chemical Plant 30 MAP Gongxian Zhongzheng Chemical Industry Co Ltd 20 MAP
Guizhou Guizhou Xiyang Fertilizer Industry Co Ltd 40 SOP-NPK
Yunnan Yunnan Phosphate Fertilizer Plant
30 MAP 50 TSP
Jianglin Group Holding Co Ltd 20 MAP Yunnan Tree-Circle Sinochem Cargill Fertilizer Co 600 DAP
Changfeng Liu College of Commerce, University of Saskatchewan 27

Sinochem Feasibility Study
Figure 4.4 Capacity Distribution of Chemically Produced NPK in China by Province in 2002(%)
The proportion of capacity utilization is not high, although the capacity of phosphate and
compound fertilizers increased rapidly in China. The production of chemically-produced
phosphate and compound fertilizers only accounted for 56.3% of its total capacity.
Table 4.3 Production and Capacity of Chemically Produced Phosphate and Compound Fertilizers in 2002 in China
Unit : 1000t of product
MAP DAP NPK TSP NP Total Capacity 3630 2760 8510 1450 1050 17400
Production 2193 2134 4204 396 863 9790 Proportion of the production in capacity(%) 60.4 77.3 49.4 27.3 82.2 56.3
The utilization of NPK production plants is relatively low. Most of NPK plants are small
scale and, their technique is simple and could only produce low concentrated NPK. These small
scale plants have to cease production soon.
China’s Imports of NPK
The top importers over the years were Guangdong, Shandong, Fujian and Zhejiang
provinces. Guangdong province and Beijing imported the largest fertilizer volume. The main
complex fertilizer import ports were Jiulong, Qingdao, Shanghai, Ningbo and Nanjing ports.
Over the years, NPK imports to China have largely been carried out from Russia, Norway,
Finland, Belgium, Greece and the Netherlands.
The largest foreign NPK suppliers to China are Acron (Russia), Rossosh (Russia), Norsk
Hydro (Norway), Kemira (Finland), BASF (Belgium).
Changfeng Liu College of Commerce, University of Saskatchewan 28
Sinochem Feasibility Study
In 2002, Acron exported around 1.5 million tons of NPK from Russia to China, which
accounts for more than 50% of the total NPK imports to China.
NPK consumption in China
With the development of China’s phosphate and compound fertilizer industry and the
improvement of the farmers’ living standard and knowledge level, the usage of compound
fertilizer is rising continuously. According to the statistics from the National Bureau of Statistics
of China, the usage of compound fertilizer amounted to 10.462 million tons (nutrient) in China
by 2002, rising by 6.3% as compared with that of 9.840 million tons in 2001. In the last three
years, increases in compound fertilizer usage remained at this level.
Figure 4.5 Compound Fertilizer Usages in China, 1995-2002
Distribution system in China
Since the late 1990s, China started to launch a Fertilizer Circulation System Reform. Up to
1999, two state-owned companies (one is Sinochem) and its local branches were entitled to
distribute and market fertilizers in the domestic market. From early 1999, local fertilizer
producers and agricultural service stations gained access to China’s domestic market.
Competition between more players is supposed to reduce fertilizer distribution costs.
Foreign companies and foreign investment companies are still not entitled to distribute
fertilizers in China. They are not allowed to set up companies for handling wholesale or retail
trade on the Chinese territory. Foreign companies will be entitled to do that by December 11,
2006, at the latest (i.e. 5 years after PRC entering into WTO).
Changfeng Liu College of Commerce, University of Saskatchewan 29

Sinochem Feasibility Study
The potential is great in China’s phosphate and compound fertilizer market
The forecast on phosphate and compound fertilizer needs in China can be made on the basis
of both the practical consumption for several previous years and its consumption by main crops.
However, because China lacks a nationwide and systematic follow-up on the fertilizer
consumption by main crops, the difference is big between the relative statistic data of phosphate
fertilizer consumption and the apparent consumption of phosphate fertilizer in China. It is not
scientific to use them in evaluating China’s phosphate market potential.
At present, Chinese plowland is still in serious shortage of phosphorus. According to related
research in 2000, the equilibrium nutrient can get guarantee only when the fast effective
phosphorus (FEP for short) content reaches 20mg/kg in the plowland. It could be seen from
Table 4 that the FEP content in 83.6% of Chinese plowland is lower than that standard.
According to the calculation made by Chinese specialists in the agricultural sector, 2.30 Mt of
P2O5 should be added into the plowland annually regardless of losses and uptake of phosphorus
in plowland in order to ensure that China’s 129.2 million hectares of plowland meet the standard
within the next ten years. Meanwhile, the FEP content in plowland will show a downward
movement in the future. In order to maintain the current FEP content of 12.9mg/kg, close to 2.53
Mt of P2O5 should be added into the soil annually regardless of phosphorus uptake by crops that
needs to be compensated with 8.49 Mt of P2O5 annually (more crops, more uptake of
phosphorus).
Based on the calculation above, it is projected that at least 13.32 Mt of P2O5 will be needed
in 2005 in China.
Table 4.4 Phosphate Fertilizer Demand in Raising FEP Content in Plowland, 2000-2010 in ChinaFEP content Sample Proportion Average FEP content Plowland area Demand(%
P2O5)(mg/kg) number (%) (mg/kg) (million hectares) (1000t)
>40 46 3.37 55.16 4.35 0
25~40 86 6.30 31.74 8.14 0
20~25 92 6.74 22.79 8.71 0
15~20 172 12.60 17.79 16.28 892
10~15 319 23.37 12.51 30.19 4562
5~10 427 31.28 7.32 40.41 10377
<5 223 16.34 3.18 21.11 7188
Total 1365 100 12.93 129.2 23020
Changfeng Liu College of Commerce, University of Saskatchewan 30

Sinochem Feasibility Study
Analyzing China’s current phosphoric resources, it is found around 3.00 Mt of P2O5 that are
returned to soil in forms of organic fertilizers annually. In 2005, assuming that China’s
phosphate fertilizer demand is 13.30 Mt P2O5, then the amount of P2O5 to be provided by
chemical fertilizers will be 10.30 Mt ; if the proportion of phosphate and compound fertilizer
production in total phosphate fertilizer production is estimated at 60%, then P2O5 provided by
phosphate and compound fertilizers will be 6.18 Mt ; the import volume of phosphate fertilizer
will be around 1.64 Mt P2O5 ; the home-made high-analysis phosphate and compound fertilizer
supply in the domestic market will be around 4.54 Mt P2O5, taking up 90% of the total high-
analysis phosphate and compound fertilizer output. Meanwhile, 500,000 t of phosphate and
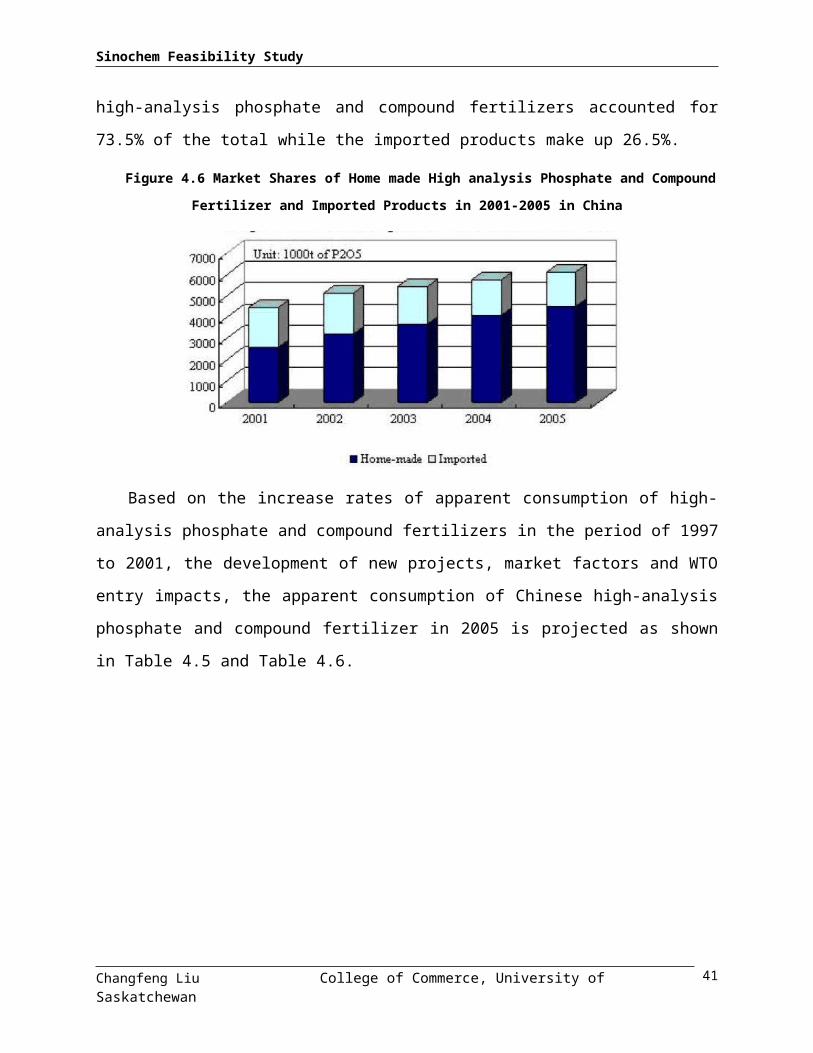
compound fertilizers will likely be exported to abroad, making up 10% of the total output. In the
domestic market, the home-made high-analysis phosphate and compound fertilizers accounted
for 73.5% of the total while the imported products make up 26.5%.
Figure 4.6 Market Shares of Home made High analysis Phosphate and Compound Fertilizer and
Imported Products in 2001-2005 in China
Based on the increase rates of apparent consumption of high-analysis phosphate and
compound fertilizers in the period of 1997 to 2001, the development of new projects, market
factors and WTO entry impacts, the apparent consumption of Chinese high-analysis phosphate
and compound fertilizer in 2005 is projected as shown in Table 4.5 and Table 4.6.
Changfeng Liu College of Commerce, University of Saskatchewan 31
Sinochem Feasibility Study
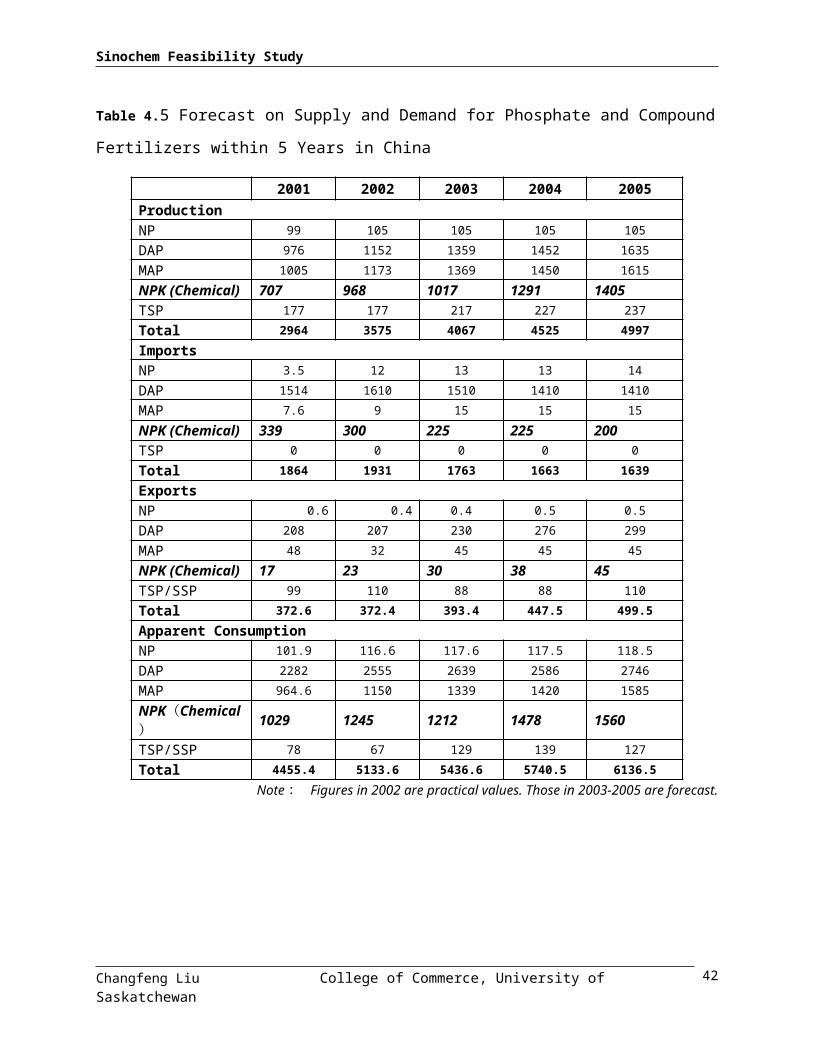
Table 4.5 Forecast on Supply and Demand for Phosphate and Compound Fertilizers within 5
Years in China
2001 2002 2003 2004 2005 Production NP 99 105 105 105 105
DAP 976 1152 1359 1452 1635
MAP 1005 1173 1369 1450 1615
NPK (Chemical) 707 968 1017 1291 1405 TSP 177 177 217 227 237
Total 2964 3575 4067 4525 4997
Imports NP 3.5 12 13 13 14
DAP 1514 1610 1510 1410 1410
MAP 7.6 9 15 15 15
NPK (Chemical) 339 300 225 225 200 TSP 0 0 0 0 0
Total 1864 1931 1763 1663 1639
Exports NP 0.6 0.4 0.4 0.5 0.5
DAP 208 207 230 276 299
MAP 48 32 45 45 45
NPK (Chemical) 17 23 30 38 45 TSP/SSP 99 110 88 88 110
Total 372.6 372.4 393.4 447.5 499.5
Apparent Consumption NP 101.9 116.6 117.6 117.5 118.5
DAP 2282 2555 2639 2586 2746
MAP 964.6 1150 1339 1420 1585
NPK(Chemical) 1029 1245 1212 1478 1560
TSP/SSP 78 67 129 139 127
Total 4455.4 5133.6 5436.6 5740.5 6136.5
Note : Figures in 2002 are practical values. Those in 2003-2005 are forecast.
Changfeng Liu College of Commerce, University of Saskatchewan 32
Sinochem Feasibility Study
Figure 4.7 Phosphate and compound Fertilizer Supplies in 2001-2005 in China
Table 4.6 Estimated Figures for Chinese Phosphate Fertilizer Demand and Supply in 2005
Unit: 1000t of P2O5Demand for raising FEP content in soil 2302
Demand for keeping reasonable FEP content in soil 2530
Demand for complementing crops’ uptake 8490
Total demand 13300
Supply from organic fertilizers 3000
Supply from chemical fertilizers 10300
Supply from phosphate and compound fertilizers, of which : 6180
Supply from home-made phosphates and compounds 4540
Supply from imported phosphates and compounds 1640
4.1.1.3 Conclusion
The production capacity of high-analysis phosphate and compound fertilizers will continue to increase in the next 5-10 years in China.
Because a lot of phosphate and compound fertilizer projects are under construction recently
in China, it is forecasted that Chinese production capacity of phosphate and compound fertilizers
will rise very fast before 2005, which can be reflected from the rapid development of capacity
expansion and new projects in Yunnan, Guizhou and Hubei provinces, which are the main
sources of domestic phosphate rock. By the end of 2010, only Yunnan province is scheduled to
add an additional capacity of 2.20 Mt P2O5 of phosphate and compound fertilizers or 2.80 Mt if
the market is bullish.
Changfeng Liu College of Commerce, University of Saskatchewan 33

Sinochem Feasibility Study
The current phosphate and compound fertilizer supply cannot meet the requirement from China’s agricultural sector.
China needs at least 6.18 Mt P2O5 of high-analysis phosphate and compound fertilizers in
2005. The current phosphate and compound fertilizer production capacity can only meet 47% of
that total requirement. There is still a large room for the development of high-analysis phosphate
and compound fertilizer industry. China will raise not only the capacity but also the production
of high-analysis phosphate and compound fertilizers. China still needs to import high-analysis
phosphate and compound fertilizers for a long period of time.
The main destination for home-made phosphate and compound fertilizers is the domestic
market although there exist opportunities for Chinese product export. Therefore, the
development of China’s phosphate and compound fertilizer industry will still focus on domestic
market and the competitiveness of the products.
NPK has promising prospects in China
At this stage, the compound fertilizer consumption rate and science fertilization level of
chemical fertilizer use in China is also lower. The compound fertilizer consumption rate is about
24%; it has a big gap between the world average level (about 30%) and a developed country’s
level (about 50%). As to the high concentration compound fertilizer in particular, China needs to
import large quantities of DAP and NPK from the international fertilizer market to meet the
needs of agriculture production.
From now on, the direction of China chemical fertilizer development is to further adjust the
nitrogen fertilizer/phosphate fertilizer proportion maladjustment, to boost the high concentration
compound fertilizer proportion, to heighten the compound fertilizer rate in phosphate fertilizer
production and consumption and enhance the service of fertilizer use in agriculture.
NPK consumption is a development trend in China. The fertilizer market has shown that the
urea, ammonium bicarbonate and SSP markets are worse than those for DAP and high
concentrated NPK. NPK production and consumption go up fast. However, because the demand
increases too fast, imports remain at the high level. The current NPK complex fertilizer imports
have reached 3 million tons per year. NPK has great potential market prospects and phosphate
fertilizer development is confronted with a severe challenge.
Changfeng Liu College of Commerce, University of Saskatchewan 34

Sinochem Feasibility Study
It is forecasted that by 2005 phosphate fertilizer output will reach 8,000 to 9,000 kt 10 (100%
P2O5), whereas NPK compound fertilizer output 10,500 kt (nutrient N+ P2O5+K2O) and NPK
complex fertilizer output 4,000 kt (nutrient N+ P2O5+K2O). With the current agriculture
development rates, the demand for fertilizer will reach 46,500 kt (nutrient) by 2005. Along with
further NPK recognition by farmers and development of economic crops, the ratio of NPK to the
total will be 30% by 2005. That is to say, the demand for NPK compound fertilizer will be
13,950 kt (nutrient N+ P2O5+K2O) and NPK complex fertilizer 6,000 kt (nutrient N+
P2O5+K2O). Therefore, high concentrated NPK fertilizer needs further development.
4.1.2 Compound Fertilizer Market in Fujian Province
4.1.2.1 General Background
Fujian Province is located in China’s southeast coastal region between north latitudes 23°33′
to 28°19′, and east longitudes 115°50′ to 120°40′, bordering Zhejiang Province on the north,
Jiangxi Province on the west and Guangdong Province on the south, respectively; on the east, the
Province faces the Taiwan Straits which separate it from Taiwan Province.
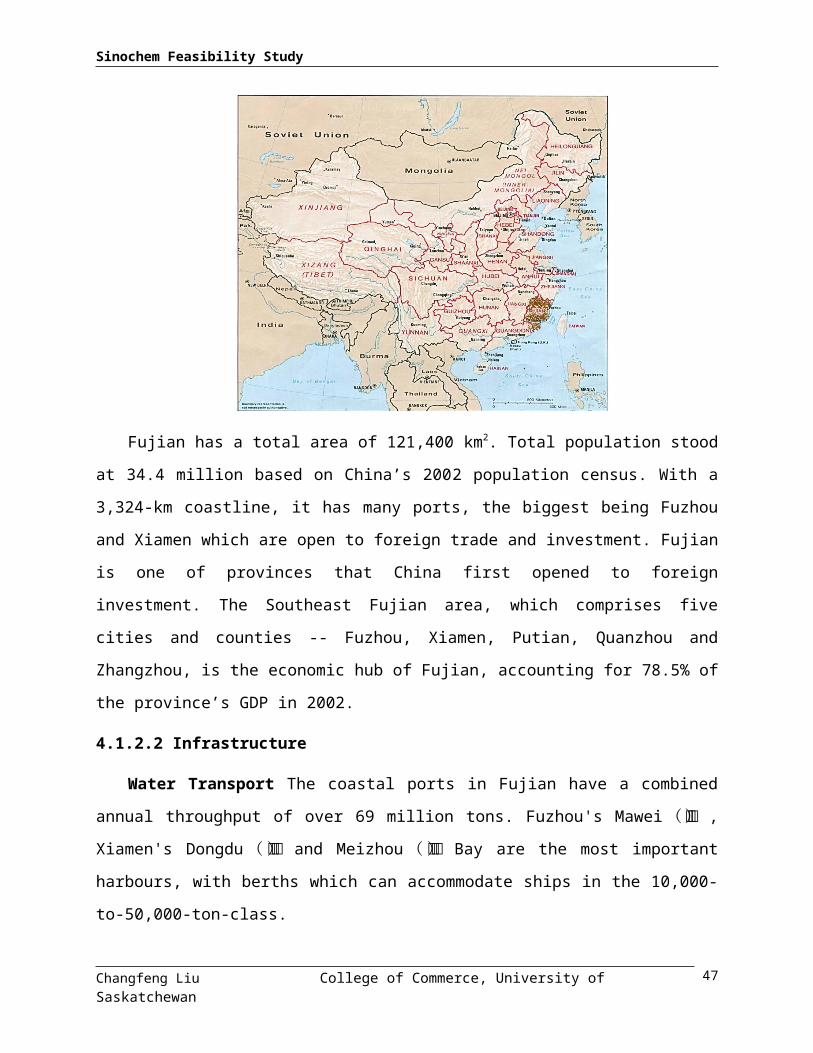
Figure 4.8 Fujian Province Geographical Location
10 Kt means 1000 Mt.
Changfeng Liu College of Commerce, University of Saskatchewan 35

Sinochem Feasibility Study
Fujian has a total area of 121,400 km2. Total population stood at 34.4 million based on
China’s 2002 population census. With a 3,324-km coastline, it has many ports, the biggest being
Fuzhou and Xiamen which are open to foreign trade and investment. Fujian is one of provinces
that China first opened to foreign investment. The Southeast Fujian area, which comprises five
cities and counties -- Fuzhou, Xiamen, Putian, Quanzhou and Zhangzhou, is the economic hub of
Fujian, accounting for 78.5% of the province’s GDP in 2002.
4.1.2.2 Infrastructure
Water Transport The coastal ports in Fujian have a combined annual throughput of over
69 million tons. Fuzhou's Mawei(馬尾) , Xiamen's Dongdu(東渡) and Meizhou(湄州)Bay are the most important harbours, with berths which can accommodate ships in the
10,000-to-50,000-ton-class.
Railways Fujian is well connected to northern and central China by railways. The province
is connected to the Beijing-Kowloon railway via the 500-km Yingtan-Xiamen railway. In the
near future, two new railways will be built -- the Wenfu Railway(溫福鐵路)and Ganglong
Railway(贛龍鐵路)- connecting with Zhejiang Province and Jiangxi Province.
Roadways Major arterial highways include those linking Fuzhou-Kunming (福州-昆明) , Beijing-Fuzhou, Xiamen-Chengdu(廈門-成都) , and Fuzhou-Lanzhou(福州-蘭州) . The first class roadway within the province is Fuzhou-Quangzhou-Xiamen-Zhangzhou
(福州-泉州-廈門-漳州) . Three new roadways are under construction; they are the
Wenzhou-Fuzhou highway, Zhangzhou-Longyan highway as well as the state highway that links
Beijing and Fuzhou.
Air Transport The Changle International Airport (長樂國際機場) in Fuzhou, the
Xiamen International Airport and the airport in Wuyishan(武夷山) operate more than 90
domestic and international routes, linking the province with more than 40 domestic cities, as well
as Hong Kong, Japan and the Philippines.
Electricity Fujian has abundant hydroelectric resources, with total electricity capacity
estimated at over 4.04 million kWh a year. The major power stations are located at Shuikou(水Changfeng Liu College of Commerce, University of Saskatchewan 36

Sinochem Feasibility Study
口), Shaxikou(沙溪口), Fuzhou, Zhangping(漳平)and Yong'an(永安). In Xiamen, a
power plant is being built at Songyu(嵩嶼).
4.1.2.3 Agriculture Industry
In 2002 the proportion of the three major industrial sectors (agriculture, industrial and
service) in the Fujian province has been readjusted to 14.2:46.1:39.7. In Agriculture, Fujian is in
transition from individual to industrial scale. During this 10th Five-Year Plan period, priority
will be given to the growth of three major industries in the province.
Fujian's food grain includes mainly rice, sweet potatoes and wheat, and cash crops mainly
sugar-cane, peanuts, rapeseed and tobacco. Fujian is one of China's major sugar-cane and tea
growers. The Wuyi Mountain Area is famous for its tea. Tangerines, Longans, lichees, bananas,
loquats and pineapples are the major fruit of Fujian.
The province has ample supplies of subtropical products such as sugar cane, peanuts and
oranges, but also has remarkably varied output. Other products include: rice, wheat, sweet
potatoes, rape seed, soybeans, sesame, tea, lychees, pineapples, pomelos, loquats, bananas, lotus
seeds, bamboo shoots, mushrooms, silver fungus, jute, tobacco, rosin, medicinal herbs, tea oil,
tung oil and Chinese tallow tree.
The principal types of land cover are rice, vegetables, and commercialized trees (orchards
and bananas), bare soil, urban areas. The known average crop cycle turnover is 2.3 per year.
4.1.2.4 Local Fertilizer Demand and Supply
Almost all the plants and fruits need fertilizer. But not all the farmer use fertilizer to
improve the growth. With the increasing of farmer’s income, more and more farmers began to
use NPK to help them to raise the yield of plant and fruit.
From the statistic data (See table 4.7), the local supply capacity only meet half of market
demand. Most of fertilizer, especially potash and NPK are highly relied on the products from
import and other provinces. Fujian Province is a big agriculture region; the annual fertilizer
demand is huge and steady. In recent years, the farmers began to realize the advantages of NPK.
Therefore, the demand for NPK is increasing quickly. But there isn’t any NPK plant in province
until ABC Company set up a NPK line in 2002. Still, the supply capacity couldn’t meet the
demand level.
Changfeng Liu College of Commerce, University of Saskatchewan 37

Sinochem Feasibility Study
Table 4.7 Annual Fertilizer Demand and Supply in Fujian Province from 1998—2002
Unit:Nutrition 1000 Mt
Year Total N P K NPK1999 Demand 1180.8 554.2 165.7 225.9 235
Supply 614.3 544.2 70.1 -- --2000 Demand 1243.3 567.3 172.4 240.7 262.9
Supply 604 520.6 83.4 -- --2001 Demand 1233.3 556.6 168.3 237.7 270.7
Supply 609.2 510.2 99 -- --2002 Demand 1244.9 562.3 153.2 239.1 290.3
Supply 636 530.7 85.3 -- 20
4.1.2.5 Local Fertilizer Market Situation and Main Competitors
Imported fertilizer owns over 50% of local market shares (See table 4.8). According to
Chinese WTO regulation, foreign fertilizer producers are not allowed to enter domestic
distribution chain in China until 2006. Now, most of foreign producers ask Sinochem as their
agent to sell their fertilizer to Chinese consumer. Because there is no local NPK manufacture in
Fujian province, all the NPK products are supplied by imported producers or neighborhood
provinces.
Considering setting up its own brand before the fertilizer market is totally opened to foreign
competitors in 2006, Sinochem need to establish a local plant to cultivate and extend its own
brand instead of foreign brands. Therefore, Sinochem could change the foreign brands’ sale
direction to other provinces so as to help its own brand could seize market share quickly.
Changfeng Liu College of Commerce, University of Saskatchewan 38

Sinochem Feasibility Study
Table 4.8The Main NPK Brands and Sales in Fujian Province in 2002
From Brand Sales (000 Mt) Price (per Mt)Russia
(Sinochem as agent)
AcronK2SO4 – based NPK (15-15-15) 170 1600
Norway(Sinochem as
agent)
HYDROK2SO4 – based NPK (15-15-15) 50 1750
Hebei ProvinceSacf
KCI – based NPK (15-15-15) 20 1300
Finland(Sinochem as
agent)
KEMIRAK2SO4 – based NPK (15-15-15) 15 1800
Shandong Province
YanyangtianKCI – based NPK (15-15-15) 14 1320
4.1.3 JV Sales Forecast
Sinochem want its target market share achieve 40% of Fujian Province NPK market in three
years. The total demand of this market is around 500,000 Mt. Therefore, the annual capacity of
JV should no less than 200,000 Mt.
4.2 JV Marketing Plan
4.2.1 Poisoning
Sinochem orientates its brand as a quality leader. If Sinochem sets up the plant in Fujian
Province to meet the local demand, the JV will benefit from lower freight cost compared with the
competitors outside from Fujian Province, especially imported products. Meanwhile, Sinochem
and ABC Company could provide competitive potash and nitrogen material to JV. JV’ products
cost must be lower than other competitors. Therefore, JV positions its products as high quality,
famous brand but low price. The poisoning strategy could help JV to seize market share
promptly.
Changfeng Liu College of Commerce, University of Saskatchewan 39

Sinochem Feasibility Study
The relationship between quality and price could be described as followed:
Figure 4.9 JV Positioning
As shown in the chart, JV will offer the best ratio of Quality/Price for customers.
4.2.2 4-P
4.2.2.1 Products
Because 〔CL〕- could lead bad effect to fruits’ growth, JV will design tow kinds of NPK to
serve all the plants. One product uses KCI as its potash material which serves for grain, the other
uses K2SO4 as the source of potash which applies for fruits. According to the nature of N, P and
K, P is the hardest element to be absorbed by plant. Therefore, after many years fertilization, the
soil will contain higher P than N and K. Meanwhile, grain could absorb N quickly and take effect
soon. Hence, to save cost for farmers, JV will design higher N and lower P products for grain,
and design K2SO4 – based NPK for the demand of fruits.
The grades are as followed:
KCI – based NPK (18-10-12) K2SO4 – based NPK (15-15-15)
Changfeng Liu College of Commerce, University of Saskatchewan
P 价格
Product Quality and Brand
Low
● JV Products
● other provinces’ competitors
Price
● imported productsHigh
High
40
Sinochem Feasibility Study
Each product’s capacity will be 100,000 Mt.
4.2.2.2`Price
According to poisoning strategy, JV offers high quality but low price product, the price will
at the same range of domestic products.
KCI – based NPK (18-10-12) 1250/Mt (Price after tax but not includes freight)
K2SO4 – based NPK (15-15-15) 1450/Mt (Price after tax but not includes freight)
(Because the price of K2SO4 is higher than KCI, usually the price of S-based NPK is higher
than CI-based NPK too)
4.2.2.3 Promotion
JV will offer the same value added service for farmers as Sinochem does, including inviting
agricultural experts teach local farmers how to use fertilizer scientifically, how specific plant
needs certain content nutrition.
4.2.2.4 Place (Target Market)
Sinochem will set up its own distribution channel to cover the whole Fujian market. Each
village will have a direct sale store. This is the best way to control prices and channels.
According to the geographical distribution of plants, JV’s Target market could be mainly
defined as three market area: tea area, grain area and fruit area (See table 4.9 and figure 4.10).
Table 4.9 JV Target Plant and its UsageUnit:000 Mt Nutrition
Segment Market NPK Theoretical Need
Actual Usage Tactic
Grain CI- based 340 1301、 High quality, low
price
2、 Good branding image with own distribution channels
Fast-grow Forest CI- based 280 20Bamboo CI- based 270 20Fruits S-based 350 170Vegetable S-based 250 150Tea S-based 50 30Flower and grass S-based 10 3
Changfeng Liu College of Commerce, University of Saskatchewan 41
Sinochem Feasibility Study
Figure 4.10 JV Target Market
4.2.3 Freight Analysis
The three main materials for fertilizer are N, P and K. ABC Company will transfer urea to
JV by pipe directly. Sinochem will provide imported potash from Xiamen port which the freight
to JV is only 18/Mt, this freight is the lowest price compared with other domestic producers
because most of their location are far from port.
For final product, the freight in Fujian Province is much lower than outside competitors.
Consequently, the location of JV is one of main advantage to lower down selling price.
Changfeng Liu College of Commerce, University of Saskatchewan 42
Tea area
Grain area
Fruit and flower area

Sinochem Feasibility Study
Figure 4.11 JV Freight Map
4.2.4 Projections of Revenues and Marketing Expenses
Table 4.10 JV Projection of RevenuesSale Price (After value added tax) Revenues
NPK (K2SO4) RMB/Mt ¥1,450 ¥145,000,000 NPK (KCI) RMB/Mt ¥1,250 ¥125,000,000
Total ¥270,000,000
Setting up its own distribution channel is a key strategy for Sinochem. Therefore, Sinochem
will plan its marketing expense as they did in other province. The marketing expense includes
direct sale store constructions expenses, advertising, brochures, experts’ wages, web page, travel
Changfeng Liu College of Commerce, University of Saskatchewan 43
JJVV
¥4545//MtMt
¥1818//MtMt
¥2323//MtMt
¥105105//MtMt
¥4646//MtMt
¥4141//MtMt
¥5252//MtMt

Sinochem Feasibility Study
expenses and trade show. JV will take 5% of sales as marketing expenses to Sinochem.
Sinochem will undertake total selling job. Therefore, JV won’t have the burden of sale.
Changfeng Liu College of Commerce, University of Saskatchewan 44

Sinochem Feasibility Study
Chapter 5: Financial Plan5.1 Capital Costs
Before the JV set up, the total assets of NPK line is ¥ 53,170,000. ABC Company has
inputted ¥ 11,600,000 and loaned ¥ 41,570,000 from China Construction Bank. After the
investment, the two shareholders will contribute the new increasing equity cash ¥35,400,000 for
the JV. And the JV plan to undertake the debt and borrow a new short term bank loan
¥20,000,000.
At the time JV set up, the total assets will achieve from ¥53,170,000 to ¥108,570,000.
This value covers all operating costs for the first year and all capital expenditures.
Table 5.1 Opening Balance Sheet
Before Investment After InvestmentABC NPK line JV
ABC Company Equity 11,600,000 JV Equity 47,000,000 Sinochem (cash) 25,000,000 ABC Company 22,000,000 ABC capital 11,600,000 ABC (cash) 10,400,000 Liability 41,570,000 Liability 61,570,000 long term bank loan 41,570,000 long term bank loan 41,570,000 short term bank loan (new) 20,000,000 Total equity and liability ¥53,170,000 Total equity and liability ¥108,570,000 Current Assets Current Assets 46,795,300 Cash Cash Accounts Receivables Accounts Receivables Inventories Inventories Account Payables Account Payables Long term assets 53,170,000 Long term assets 61,774,700 Property, plant and equipment 53,170,000 Property, plant and equipment 61,774,700 Land usage fee 4,945,300 * Building 15,804,400 Building 23,340,300 Equipment 32,420,300 Equipment 38,434,400 Other Assets Other Assets Total Asset ¥53,170,000 Total Asset ¥108,570,000
After JV sets up, Sinochem will become the largest shareholder which holds 53% equity of the JV.
Table 5.2 JV Equity Structure
Changfeng Liu College of Commerce, University of Saskatchewan 45
Sinochem Feasibility Study
Sinochem 53%ABC Company 47%
In the first year, the total capital costs will be ¥61,774,700.
Table 5.3 Total Capital CostsLand (rental) 0Building ¥23,340,300Equipment ¥38,434,400
Total Capital Costs ¥61,774,700
5.2 Loan Amortization
JV will undertake former long term debt and borrow new short term debt from China
Construction Bank. The long term debt and short term debt are ¥41,570,000 and ¥21,000,000,
respectively. The total loan of ¥61,570,000 will be amortized over twelve years.
The bank would like to lend money to the company who has good credit history. Therefore,
to earn interest, the bank does not want the JV to pay off in a short time. Consequently, JV could
judge when and how much to pay the principle is the best situation according to the cash flow
requirement and the reasonable debt ratio. From the income projections this payment plan can
be covered each year by cash flow. See more detail in Appendix 4, Financial Model.
Changfeng Liu College of Commerce, University of Saskatchewan 46
Sinochem Feasibility Study
Table 5.4 Amortization Schedule
Y1 Y2 Y3 Y4 Y5 Y6
Long term debt41,570,00
041,570,00
041,570,00
041,570,00
041,570,00
041,570,00
0principal payment (input) 0 0 0 0 0 0interest payment 2,319,606 2,319,606 2,319,606 2,319,606 2,319,606 2,319,606
Balance41,570,00
041,570,00
041,570,00
041,570,00
041,570,00
041,570,00
0payment 2,319,606 2,319,606 2,319,606 2,319,606 2,319,606 2,319,606 Short term debt
20,000,000
20,000,000
20,000,000
20,000,000
20,000,000
20,000,000
principal payment (input) 0 0 0 0 0 0interest payment 1,098,000 1,098,000 1,098,000 1,098,000 1,098,000 1,098,000
Balance20,000,00
020,000,00
020,000,00
020,000,00
020,000,00
020,000,00
0payment 1,098,000 1,098,000 1,098,000 1,098,000 1,098,000 1,098,000Debt Ratio 57% 54% 50% 48% 47% 43%
Total Liability Balance61,570,00
061,570,00
061,570,00
061,570,00
061,570,00
061,570,00
0Interest 3,417,606 3,417,606 3,417,606 3,417,606 3,417,606 3,417,606Total Principal and Interest paid 3,417,606 3,417,606 3,417,606 3,417,606 3,417,606 3,417,606 Y7 Y8 Y9 Y10 Y11 Y12
Long term debt41,570,00
041,570,00
041,570,00
034,000,00
034,000,00
034,000,00
0principal payment (input) 0 0 7,570,000 0 0 0interest payment 2,319,606 2,319,606 2,319,606 1,897,200 1,897,200 1,897,200
Balance41,570,00
041,570,00
034,000,00
034,000,00
034,000,00
034,000,00
0payment 2,319,606 2,319,606 9,889,606 1,897,200 1,897,200 1,897,200 Short term debt
20,000,000
20,000,000
20,000,000
15,000,000
15,000,000
15,000,000
principal payment (input) 0 0 5,000,000 0 0 0interest payment 1,098,000 1,098,000 1,098,000 823,500 823,500 823,500
Balance20,000,00
020,000,00
015,000,00
015,000,00
015,000,00
015,000,00
0payment 1,098,000 1,098,000 6,098,000 823,500 823,500 823,500Debt Ratio 43% 43% 43% 37% 38% 38%
Total Liability Balance61,570,00
061,570,00
061,570,00
049,000,00
049,000,00
049,000,00
0Interest 3,417,606 3,417,606 3,417,606 2,720,700 2,720,700 2,720,700
Total Principal and Interest paid 3,417,606 3,417,60615,987,60
6 2,720,700 2,720,700 2,720,700Long term interest Rate 5.58%Short term interest Rate 5.49%
Changfeng Liu College of Commerce, University of Saskatchewan 47

Sinochem Feasibility Study
5.3 Dividend Policy
The dividends policy that JV implemented is based on cash flow condition. Sinochem
believes it’s a safe range that the debt ratio is kept around 40-50%. To keep this ratio, excess
cash flow will be applied to pay off the debt. Meanwhile, Sinochem also emphasizes on the
regular and steady dividend from the investment. Hence, JV will carry out the dividend policy
which gives attention to both healthy cash flow and ROE. According to the financial model, the
JV has structured a dividend and financing policy to match and balance from shareholder and
management’s requirements.
Table 5.5 Dividends Paid
Dividend Paid
Y1 Y2 Y3 Y4 Y5 Y6¥0 ¥0 ¥0 ¥6,000,000 ¥6,000,000 ¥0
Y7 Y8 Y9 Y10 Y11 Y12¥10,000,00
0¥12,000,00
0¥13,000,00
0¥14,000,00
0¥14,000,00
0¥15,000,00
0
Using the current dividend policy, JV could achieve an ERR on equity investment to
13.91%.
5.4 Cost Analysis
Raw Material is the main components of total cost. Therefore, how to decrease the purchase
price is a key factor to build JV’s cost advantage. In fact, Sinochem could supply the most
competitive potash to JV as well as ABC Company could provide nitrogen. These two materials
will account for 54% of total cost.
Table 5.6 Unit Cost
Unit Cost N P K AccessoryManufacturing
OverheadNPK (K2SO4) 252 406 438 136 65 NPK (KCI) 319 271 220 131 65
Figure 5.1 Unit Cost
Changfeng Liu College of Commerce, University of Saskatchewan 48
Sinochem Feasibility Study
5.5 Ratio Analysis
The projected performance ratios for JV show a successful business over the twelve year
business model. These results are depicted in Table 5.7. The fertilizer production is a business
with high capital start up costs and few variable manufacturing costs. Therefore profits will be
sensitive to business cycles in the early years because of high depreciation and high debt
servicing costs, and very little variable costs that can follow output.
Table 5.7 Ratio Analysis Y1 Y2 Y3 Y4 Y5 Y6 Y7 Y8Cash Conversion Cycle 65 65 65 65 65 65 65 65 Liquidity Ratios Current Ratio 2.53 3.03 3.65 4.05 4.44 5.07 5.36 5.58 Activity and Operating Ratios Total Asset Turnover 1.22 1.72 2.10 2.04 2.07 2.00 2.06 2.14 Inventory Turnover 3.30 4.11 4.88 5.00 4.96 4.97 4.98 4.98 Average Days Inventory 111 89 75 73 74 73 73 73 Leverage Ratios Debt Ratio 57% 54% 50% 48% 47% 43% 43% 43%Debt to Equity 1.32 1.16 0.99 0.93 0.87 0.76 0.74 0.74 Profitability Ratios Gross Profit Margin
14.03%
14.03%
14.03%
14.03%
14.03%
14.03%
14.03%
14.03%
Net Profit Margin 0.39% 3.42% 3.71% 3.71% 3.75% 3.79% 3.83% 3.86%Return on Total Assets 0.47% 5.88% 7.81% 7.57% 7.76% 7.58% 7.89% 8.27%
Return on Equity 1.10%12.72
%15.54
%14.63
%14.55
%13.34
%13.77
%14.40
%
Changfeng Liu College of Commerce, University of Saskatchewan 49

Sinochem Feasibility Study
The current ratio gives information on the liquidity of the company by showing its ability to
meet expenses out of cash flow. The current ratio defined as current assets (cash, inventory,
accounts receivable) over current liabilities (wages payable, current portion of long term debt).
This shows the ability of the company to make payments out of cash. Judging by the current
ratios this business could generate adequate cash flows to meet expenses. With the capacity
increase continuously, the total value of inventory goes up quickly. Hence, the current ratio is
higher than average industry level in future years.
The debt ratio shows the total liabilities over total assets. This shows how highly the
company is leveraged against its total assets. JV has a low debt ratio which means that JV has
adequate equity cash flow. This indicates JV does leave much room for restructuring debt and
leveraging total assets. The debt to equity ratio shows the amount of debt compared to the
amount of investor equity in the business. In this project, the debt ratio would be controlled at a
low risk level.
The return on assets (ROA) ratio is the total return of the business. In summary, ROA is the
return that both the lender and the business are generating from the assets. The ROA has to be
positive and higher than the cost of debt. Return on Equity is the net income over the total
shareholder’s equity. This ratio shows the returns that the business is generating on the money
that shareholders have invested. The gross margin is the net income over the cost of goods sold
before taxes. Gross margin shows the profits over the total costs. A large margin would indicate
that the company has room to cushion downturns in the business cycle before losses would
occur. From the profitability ratios, the ROE is good compared with nowadays Chinese similar
fertilizer producers.
5.6 Financial Results
Table 5.8 shows the summary of financial activities for JV for the consecutive twelve years.
Because there is not a construction period, JV could have slight profit even during the first year.
The first years net income is not high due to the high depreciation and the high interest payments
on the operation. But the cash at the end of years is positive for all the years included. Cash flow
is sometime negative in the certain year because substantial dividends and cash are paid to
shareholders and bank.
Changfeng Liu College of Commerce, University of Saskatchewan 50

Sinochem Feasibility Study
Table 5.8 Summary of Financial Results
Net Present Value of Equity Investment¥26,825,83
9 Internal Rate of Return on Equity Investment 23.70%External Rate of Return on Equity Investment 13.91% Y1 Y2 Y3 Y4 Y5 Y6
Sales Revenue 135,000,000 202,500,000 270,000,00
0 270,000,00
0 283,500,00
0 297,000,00
0
Cost of Goods Sales 116,061,264 174,091,896 232,122,52
8 232,122,52
8 243,728,65
4 255,334,78
1 Gross Margin 18,938,736 28,408,104 37,877,472 37,877,472 39,771,346 41,665,219 Total Expenses 16,037,582 14,884,606 18,673,606 18,673,606 19,431,406 20,189,206 Income Before Tax 777,749 10,338,391 14,957,057 14,957,057 15,880,790 16,804,523 Net income (loss) 521,092 6,926,722 10,021,228 10,021,228 10,640,129 11,259,030 Increase(decrease) in Cash 22,986,031 (4,653,326) (615,892) 8,020,276 6,068,831 11,388,147
Y7 Y8 Y9 Y10 Y11 Y12
Sales Revenue 310,500,000 324,000,000 337,500,00
0 337,500,00
0 337,500,00
0 337,500,00
0
Cost of Goods Sales 266,940,907 278,547,034 290,153,16
0 290,153,16
0 290,153,16
0 290,153,16
0 Gross Margin 43,559,093 45,452,966 47,346,840 47,346,840 47,346,840 47,346,840 Total Expenses 20,947,006 21,704,806 22,462,606 21,765,700 21,765,700 21,765,700 Income Before Tax 17,728,256 18,651,989 19,575,722 20,272,628 20,272,628 20,272,628 Net income (loss) 11,877,932 12,496,833 13,115,734 13,582,661 13,582,661 13,582,661 Increase(decrease) in Cash 3,907,048 2,525,950 1,742,811 (8,180,029) 4,410,557 3,408,517
5.7 Break Even Analysis
The breakeven analysis shows the breakeven prices that the company needs. The Cash flow
breakeven was calculated by changing the fertilizer price to make net cash flows equal to zero.
Capacity breakeven was calculated by finding the number of tones of fertilizer that were needed
to make cash flows equal to zero. Again, the material price break-even is also calculated.
Changfeng Liu College of Commerce, University of Saskatchewan 51

Sinochem Feasibility Study
Table 5.9 JV Cash Flow Break-even Varying Quantity and Price
Y3 Y6 Y9Cash Flows - - -
1.Quantity NPK (K2SO4) 100,000 110,000 125,000 Break-Even NPK (K2SO4) (MT) 100,643 89,222 98,543 Difference -0.64% 18.89% 21.17%NPK (KCI) 100,000 110,000 125,000 Break-Even NPK (KCI) (MT) 100,741 87,586 98,320 Difference -0.74% 20.38% 21.34%
2.Selling Price: NPK (K2SO4) 1,450 1,450 1,450 Break-Even NPK (K2SO4) 1,461 1,270 1,124 Difference -0.76% 12.41% 22.48%NPK (KCI) 1,250 1,250 1,250 Break-Even NPK (KCI) 1,261 1,065 929 Difference -0.88% 14.80% 25.68%
3.Direct Material Price: Unit manufacturing cost/ton NPK (K2SO4) 1,223 1,223 1,223Break-Even 1,215 1,138 1,045Difference 0.69% 6.99% 14.59%NPK (KCI) 952 Break-Even 943 Difference 0.91%
The selling quantity, selling price and material price are three most sensitive factors to
influence the whole JV’s performance. According to the analysis above, the purchased price of
material and the selling quantity are two critical variables, followed by the selling price.
Because this market is steady, the selling price won’t be fluctuated from a large range.
Therefore, the critical successful factors for JV is to increase market share and negotiate with
other material suppliers to lower down the purchased price.
5.8 Sensitivity Analysis of IRR
The table 5.10 shows the result of sensitivity analysis. The long term debt rate and short
term debt rate won’t effect too much to IRR because JV’s debt ratio is low. The same results
happened on average days receivables, average days product inventory and average days
payables. The same conclusion as break-even analysis, the selling price and quantity could
influence the IRR greatly, which the IRR varies from 9.12% to 33.85%. Hence, it is very
Changfeng Liu College of Commerce, University of Saskatchewan 52

Sinochem Feasibility Study
important that the JV has a clear forecasting marketing plan which includes excellent brand
orientation policy and pricing strategy.
Table 5.10 Sensitivity AnalysisWorst Base Best
Long Term Debt Rate 6.58% 5.58% 4.58%Short Term Debt Rate 6.49% 5.49% 4.49%IRR 22.77% 23.70% 24.62%
Growth in Selling Prices -3.00% -1.50% 0.00% 1.50% 3.00%IRR 11.85% 18.43% 23.70% 28.31% 32.53%
Growth in Selling Quantity -3.00% -1.50% 0.00% 1.50% 3.00%IRR 9.12% 17.46% 23.70% 29.03% 33.85%
Average Days Receivables 45 30 15 IRR 20.58% 23.70% 27.31%Average Days Product Inventory 60 45 30 IRR 20.65% 23.70% 27.24%Average Days Payables 15 30 45 IRR 23.30% 23.70% 24.12%IRR 17.58% 23.70% 31.92%
5.9 Scenario Analysis
One of the distinct natures of agriculture business is seasonable. The price of material and
final products always change with plant period. To keep farmers’ benefit, Chinese government
does not allow fertilizer producers earn too much profit from relatively poor consumers.
Consequently, the final selling price doesn’t fluctuate greatly. Therefore, in this scenario
analysis, the range of selling price is changed from 90% to 110%. Meanwhile, the governmental
control of material price isn’t as strict as final fertilizer products. The range of fluctuation is
slightly shaky than fertilizer. The range is set between 120% and 90%. On the contrary, the
selling quantity may decrease a lot in light of the business cycle, not suitable brand strategy or
inefficient distribution channels. Hence, the range of quantity is from 70% to 105%.
In this analysis, for the best case, making these changes resulted in an increase of the IRR to
72.1%. For the worst case, making these changes resulted in negative IRR, so on the graph it was
just shown as below zero.
Changfeng Liu College of Commerce, University of Saskatchewan 53

Sinochem Feasibility Study
Table 5.11 Scenario Analysis
Variable Worst Case Base Case Best CaseSelling price 90% 100% 110%
Quantity of Selling (MT) 70% 100% 105%Material price 120% 100% 90%
IRRVariable Worst Case Base Case Best Case
Selling price 3.1% 23.7% 49.8%Quantity of Selling (MT) -26.2% 23.7% 39.8%
Material price -19.8% 23.7% 51.3%IRR -38.2% 23.7% 72.1%
Figure 5.2 Scenarios to IRR
From the scenario result, the same conclusion is the management should put more strength
to negotiate with their suppliers to decrease the price of material, meanwhile, try best to raise the
price and quantity of final products.
5.10 Conclusion
JV is a capital-intensive project, requiring total investment of ¥108,570,000, which will be
financed by 56.7% long-term debt and 43.3% equity. Sinochem will hold 53% equity share of
the JV. With an internal rate of return of 23.7% the project is generating higher returns on
investment than the required rate of return of 15%. The internal rate of return is sensitive to the
price of fertilizer and material. Based on Sinochem’s investment criteria JV is an economically
Changfeng Liu College of Commerce, University of Saskatchewan 54
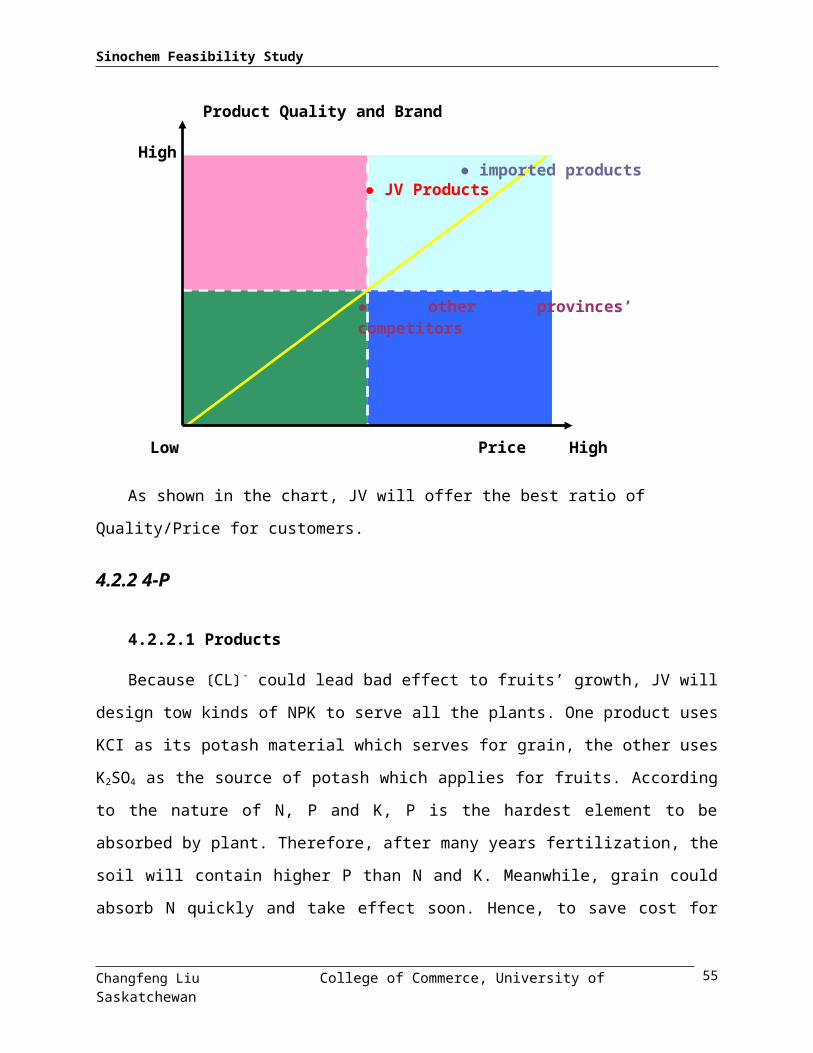
Sinochem Feasibility Study
viable investment and should be considered by Sinochem Investment Committee to make their
operation steadily, socially and economically sustainable in the long run.
Changfeng Liu College of Commerce, University of Saskatchewan 55

Sinochem Feasibility Study
Chapter 6: Conclusion
6.1 Porter’s Competitive Forces Analysis
In order to better understand primary pressures facing the JV, a Porter’s Analysis was
completed. The Analysis is divided into five components: threat of new entrants, the power of
buyers, the potential impacts of substitutes, the power of suppliers, and finally, impacts of
competitive rivalries.
According to the introduction of market situation in Chapter 3, the local entrant barrier is
not difficult. But because the nature of fertilizer industry is highly capital-intensive, also the
profitability is relatively low compared with other industries, seldom large scale companies out
of this field would like to invest in fertilizer sector. However, some of international fertilizer
producers such as Cargill and Acron have been showing the interest to China market, but they
only have the entrant right after 2006 as said by the WTO regulation.
Although the farmers are poor in China, they still kept buying fertilizer to make their land
fertile enough to raise their plants, because the land has becoming arid after thousands years’
planting. For now, the farmers’ average income level is increasing year by year. Consequently,
farmers would be glad to use more money to buy fertilizer. Fertilizer is an essential product for
Chinese farmers. Therefore, the buyer’s power is weak.
On the contrary, the power of supplier is rather strong. Fertilizer industry is a resource-
based industry, especially for potash and phosphate. The producers who own the mine will have
the privileges to determine the price of the material. As a result, the price of material is a vital
factor to NPK producers in term of the material cost constitutes 90% of total cost.
The competition is drastic. But like many Chinese traditional companies, fertilizer players
are not quite good at management skills. Most of them neglected brand loyalty construction and
after sale services. The most common tool for competition is price war.
Plants need nutrient for growth. Hence, they always need fertilizer. There has no any
potential substitutes could replace the function of fertilizer. Although fertilizer industry has
Changfeng Liu College of Commerce, University of Saskatchewan 56

Sinochem Feasibility Study
developed over a hundred years, and it is a mature and sun setting industry, the fertilizer still will
play its role for a very long time in future.
Thus, from the analysis above, it could be concluded that:
Fertilizer can not be replaced in a short time. Consequently, the market demand is steady.
Before 2006, it’s a very precious time period for domestic fertilizer companies to increase
local market share.
Cost, brand, service and sale distribution channel are four key successful factors to fertilizer
producers.
This project almost meets all the opportunities.
6.2 SWOT Analysis
A SWOT analysis provides information about JV’s strengths, their weaknesses, potential
opportunities, and also potential existing and future threats to the company. Understanding these
primary issues provides direction in regards to strategic recommendations for JV. The SWOT
analysis helped identified key issues and focused solutions. The detailed SWOT analysis is
outlined as followed.
6.2.1 Internal: Strengths and Weaknesses
Strategic Fit
Agriculture sector is one of the main industries that Fujian Province encourages to develop
in their five-year’s plan. Meanwhile, the project fits Sinochem’s distribution strategy quite well.
Low Risk
There are few local competitors; the production line has been completely constructed for 2
years. Therefore, no construction period needed, this will shorten the payback period. Another
character is that the production technique is mature. In a word, most non-systematic risk is
controllable.
Changfeng Liu College of Commerce, University of Saskatchewan 57

Sinochem Feasibility Study
Cost Strength
Sinochem and ABC Company will supply most of the favorable material to JV. At the same
time, JV’s geographical location is near the market. Hence the transportation fee is relatively
low. These two factors-low material cost and convenient transportation-determine the cost of JV
could be the lowest in local area. This leads JV to a very competitive position.
Fine financial outcome
The IRR is 23.7%. This means that JV will make a good return for their shareholders.
Two shareholders’ complementary strengths
The restructured financial condition will help JV start at a good situation. Sinochem could
offer abundant experts to de-bottlenecking. Meanwhile, Sinochem has famous brand property
and powerful sales network. ABC Company is quite familiar with local market and consumer
behavior. The two shareholders could help the JV by leveraging both strengths.
Acquisition Risk
It’s not easy to establish a successful joint venture. The integration in the first several
months is vital. Therefore, the management team should pay more attention to training and
appointing. Because Sinochem has set up several successful JV, they could share the existing
experience as reference to avoid integration failure.
6.2.2 External: Opportunities and Threats
External issues that need to be addressed are changes in the business environment that can
influence the success and profitability of JV. These factors are extremely important ad need to be
recognized in evaluating the long-term success.
Steady and increasing market demand
Most of farmer are wealthy than average level in China. Meanwhile, more and more farmers
are interested in fruits rather than grains. Because selling fruits is more profitable than grain,
farmers could have more input for fertilizer.
Foreign fertilizer companies’ challenge
Foreign fertilizer companies have advantage of brands, capital, management skills and
international network. But they will not be allowed to enter Chinese distribution area until 2006.
Changfeng Liu College of Commerce, University of Saskatchewan 58

Sinochem Feasibility Study
After that, they are the biggest threads to local fertilizer producers. That means there are only 2-3
years left for domestic companies to build their core competency. If these small scale companies
could unite and use uniform brand and specification, their future could be promising. Sinochem
is trying to finish this process by merger and acquisition.
6.3 Conclusion
From Sinochem’s strategic investment perspective, this project meets most of the
characters. This project is strategy fit; the market demand is steady; the cost is competitive; the
risk is controllable; this time period is very precious for Sinochem to build its own brand strategy
and distribution network, especially in south east market; the project could leverage both
shareholders’ advantages; no construction period; last but not least, the financial outcome is
attractive.
As a result, it’s strongly recommended that Sinochem Investment Committee could approve
this feasibility study.
Changfeng Liu College of Commerce, University of Saskatchewan 59

Sinochem Feasibility Study
Changfeng Liu College of Commerce, University of Saskatchewan 60