chapter 1 phases and crystal structures
TRANSCRIPT

Elsevier UK Code: PTA Ch01-I042145 5-6-2007 9:27a.m. Page:1 Trim:165mm×240mm Integra, India
Font:Times F.Size:11/13pt Margins: Top:19mm Gutter:19mm Width:128mm Depth:40 Lines 1 Color Recto
Chapter 1
Phases and Crystal Structures
1.1 Introduction 41.2 Polymorphism 41.3 Phase Diagrams of Elemental Titanium and Zirconium 7
1.3.1 Introductory remarks 71.3.2 Titanium 91.3.3 Zirconium 101.3.4 Epilogue 111.3.5 Phase stability and electronic structure 131.3.6 Some features of transition metals 18
1.4 Effect of Alloying 211.4.1 Introductory remarks 211.4.2 Alloy classification 211.4.3 Titanium alloys 211.4.4 Zirconium alloys 231.4.5 Stability of titanium and zirconium alloys 24
1.5 Binary Phase Diagrams 261.5.1 Introductory remarks 261.5.2 Ti–X systems 271.5.3 Zr–X systems 291.5.4 Representative examples of Ti–X and Zr–X phase diagrams 29
1.6 Non-Equilibrium Phases 431.6.1 Introductory remarks 431.6.2 Martensite phase 441.6.3 Omega phase 491.6.4 Phase separation in �-phase 52
1.7 Intermetallic Phases 531.7.1 Introductory remarks 531.7.2 Intermetallic phase structures: atomic layer stacking 551.7.3 Derivation of intermetallic phase structures from
simple structures 611.7.4 Intermetallic phases with TCP structures in Ti–X
and Zr–X systems 621.7.5 Phase stability in zirconia-based systems 62
References 67Appendix 73

Elsevier UK Code: PTA Ch01-I042145 5-6-2007 9:27a.m. Page:2 Trim:165mm×240mm Integra, India
Font:Times F.Size:11/13pt Margins: Top:19mm Gutter:19mm Width:128mm Depth:40 Lines 1 Color Recto

Elsevier UK Code: PTA Ch01-I042145 5-6-2007 9:27a.m. Page:3 Trim:165mm×240mm Integra, India
Font:Times F.Size:11/13pt Margins: Top:19mm Gutter:19mm Width:128mm Depth:40 Lines 1 Color Recto
Chapter 1
Phases and Crystal Structures
Symbols and AbbreviationsA � Elastic anisotropy ratio (A = C44/C
′)Cij � Elastic stiffness modulus (elastic constant)C ′ � Elastic shear stiffness modulus; shear constant;
(C ′ = �C11 −C12�/2)Cp � Specific heat at constant pressure
e/a � Electron to atom ratioG: Gibbs free energy (G = H −TS)H � EnthalpyP � PressureS � EntropyT � TemperatureV � VolumeVa � Atomic volume�p � Piston velocity�s � Shock velocity�ij � Thermodynamic interaction parameter between elements i and jbcc: Body centred cubicfcc: Face centred cubichcp: Hexagonal close packed
�-phase: hcp phase in Ti- and Zr-based alloys�-phase: bcc phase in Ti- and Zr-based alloys
�′ � hcp martensite�′′ � Orthorhombic martensite�m � Generic martensite (�′ or �′′)Ms � Temperature at which martensite starts forming during quenchingMf � Temperature at which martensite formation is completed during
quenching�s � Temperature at which the �m → � reversion starts on
up-quenchings � Temperature at which athermal phase starts forming during
quenchingTo � Temperature at which the free energies of the parent (�) and
product (�m) phases are equal.AIP: Ab initio pseudopotential
3

Elsevier UK Code: PTA Ch01-I042145 5-6-2007 9:27a.m. Page:4 Trim:165mm×240mm Integra, India
Font:Times F.Size:11/13pt Margins: Top:19mm Gutter:19mm Width:128mm Depth:40 Lines 1 Color Recto
4 Phase Transformations: Titanium and Zirconium Alloys
ASA: Atomic sphere approximationASW: Augmented spherical wave
FPLAPW: Full potential linear augmented plane waveLAPW: Linear augmented plane wave
LCGTO: Linear combination of gaussian type orbitalsLDA: Local density approximation
LMTO: Linear muffin tin orbitalMC: Monte carloMD: Molecular dynamicsMT: Muffin tin
NFE: Nearly free electronQMC: Quantum monte carloQSD: Quantum structural diagram
TB: Tight binding
1.1 INTRODUCTION
Titanium (Ti), zirconium (Zr) and hafnium (Hf) are transition metals belongingto Group 4 (nomenclature as per the recommendations of IUPAC 1988) of theperiodic table of elements. The interest in the metals Ti and Zr and in alloys basedon them has gained momentum from the late 1940s in view of their suitabilityfor being used as structural materials in certain rapidly developing industries; par-ticularly, the aerospace and chemical industries in the case of Ti alloys and thenuclear power industry in the case of Zr alloys. Some important characteristics ofthese metals are listed in Table 1.1. It can be seen from this table that the elec-tronic ground state configurations of these metals are Ar�3d24s2 and Kr�4d25s2,respectively. The similarity in the dispositions of the outer electrons, i.e. the fourelectrons (two s electrons and two d electrons) outside the inert gas shells (Mshell for Ti and N shell for Zr) is, to a large extent, responsible for the similaritiesin some of the chemical and physical properties of these two metals and as acorollary, in many aspects of their chemical and physical metallurgy, includingalloying behaviour.
1.2 POLYMORPHISM
Apart from existing in solid, liquid and gaseous states, many elements exhibita special feature: they adopt different crystal structures in the solid state underdifferent conditions of temperature or pressure or external field. The transition from

Elsevier UK Code: PTA Ch01-I042145 5-6-2007 9:27a.m. Page:5 Trim:165mm×240mm Integra, India
Font:Times F.Size:11/13pt Margins: Top:19mm Gutter:19mm Width:128mm Depth:40 Lines 1 Color Recto
Phases and Crystal Structures 5
Table 1.1. Some characteristics of elemental Ti and Zr.
Property Element
Ti Zr
Atomic number (Z) 22 40Number of naturally occurring isotopes 5 5Atomic weight 47.90 91.22Electronic ground state configuration Ar�3d24s2 Kr�4d25s2
Density at 298 K �kg/m3� 4510 6510Melting temperature (K) 1941 2128Boiling temperature (K) 3533 4650Enthalpy of fusion (�Hf ) kJ/mol 16.7 18.8Electronegativity 1.5 1.4Metal radius (nm) 0.147 0.160
References: Froes et al. 1996, Kubaschewski et al. 1993, McAuliffe and Bricklebank 1994, Soloveichik 1994.
one modification (allotrope) to another is termed a polymorphous transformationor a phase transformation (transition).
A phase transition is associated with changes in structural parameters and/orin the ordering of electron spins (Steurer 1996). It will be discussed in a laterchapter that two basically different types of phase transitions may be encountered:first-order transitions and second-order (or higher order) transitions. A transitionof the former type is associated with discontinuous changes in the first derivativesof the Gibbs free energy, G = H − TS, while a transition of the latter type ischaracterized by discontinuous changes in the second (or higher order) derivativesof the Gibbs free energy and there are no jumpwise changes in the first deriva-tives. In either type of transition, the crystal structure undergoes a discontinuouschange at the transition point (e.g. transition temperature or transition pressure).It is not necessary to have a symmetry relationship between the parent and theproduct phases in a first-order transition. However, in a second-order transitiona group/subgroup relationship can always be found in relation to the symmetrygroups associated with the crystal structures of the two phases.
Elemental Ti and Zr (and Hf) exhibit temperature induced as well as pressureinduced polymorphism. The pertinent phases, transition temperatures and transitionpressures are listed in Table 1.2 and Table 1.3. It can be seen from Table 1.2 that forboth Ti and Zr, the high temperature phase, termed the �-phase, has the relatively“open” bcc structure while the low temperature phase, termed the �-phase, hasthe close packed hcp structure. The hcp structure of the �-phase is, however,slightly compressed in the sense that the value of the axial ratio is smaller thanthe ideal value of 1.63. It has been pointed out (McQuillan 1963, Collings 1984)that the more open bcc structure has a higher vibrational entropy as compared to

Elsevier UK Code: PTA Ch01-I042145 5-6-2007 9:27a.m. Page:6 Trim:165mm×240mm Integra, India
Font:Times F.Size:11/13pt Margins: Top:19mm Gutter:19mm Width:128mm Depth:40 Lines 1 Color Recto
6 Phase Transformations: Titanium and Zirconium Alloys
Table 1.2. Allotropic forms of elemental Ti and Zr at atmospheric pressure (Massalski et al. 1992)(Variable: temperature).
Element Phase Temperatureregime (K)
Enthalpy oftransformation(kJ/mol)
Crystal structure
Ti Alpha(�) Up to 1155 4 17�4 2� hexagonal close packedBeta(�) 1155–1943 body centred cubic
Zr Alpha(�) Up to 1139 (1136) 4 103�3 9� hexagonal close packedBeta(�) 1139–2128 body centred cubic
Note: The figures in parentheses are from Kubaschewski et al. 1993.
Table 1.3. Allotropic forms of elemental Ti and Zr at room temperature (Steurer 1996) (Variable:pressure)
Element Phase Pressure regime (GPa) Crystal structure
Ti Alpha(�) Up to 2 hexagonal close packedOmega() > 2 hexagonal
Zr Alpha(�) Up to 2 hexagonal close packedOmega() 2–30 hexagonalOmega prime (′) > 30 body centred cubic
the close packed hcp structure and as a consequence of this, the free energy of acompeting bcc lattice will decrease more rapidly than that of the hcp lattice withincreasing temperature; a temperature will ultimately be reached at which the freeenergy of the former will be less than that of the latter so that the bcc form will bemore stable. The -phase can be obtained from the �-phase by the application ofsufficient pressure in elemental Ti and Zr. Some crystallographic data pertainingto all these phases are presented in Table 1.4. The structure of the -phase hasbeen determined to be either hexagonal, belonging to the space group P6/mmm(Silcock 1958), or trigonal, belonging to the space group P3̄m1 (Bagariatskii et al.1959), depending on the solute concentration. The equivalent positions in the unitcell of the structure are 000; 2/3 1/3 (1/2−z); 1/3 2/3 (1/2+z). For the ideal structure with hexagonal (P6/mmm) symmetry, z = 0 while 0 < z < 1/6 definesa non-ideal structure with trigonal (P3̄m1) symmetry. There are three atoms inthe unit cell. The axial ratio is close to �3/8�1/2. The symmetry of the structureis high and as in the case of the simple hexagonal lattice, there are 24 point groupoperations (Ho et al. 1982). The packing density (� 0 57) associated with thehexagonal (hP3) structure of the -phase is lower than that for the bcc (� 0 68)and the hcp (� 0 74) structures. The occurrence of such an open structure in metals

Elsevier UK Code: PTA Ch01-I042145 5-6-2007 9:27a.m. Page:7 Trim:165mm×240mm Integra, India
Font:Times F.Size:11/13pt Margins: Top:19mm Gutter:19mm Width:128mm Depth:40 Lines 1 Color Recto
Phases and Crystal Structures 7
Table 1.4. Crystal structures and lattice parameters of allotropic forms of elemental Ti and Zr(Massalski et al. 1992, Steurer 1996).
Element Ph Crystal structure Lattice paramaters(nm)
Axialratio
P SN PS SG
Ti �-Ti Mg A3 hP2 P63/mmc a = 0 29506 1 5873Va�nm�3 = c = 0 4683517 65×10−3 �-Ti W A2 cI2 Im3̄m a = 0 33065 1 0
-Ti -Ti − hP3 P6/mmm a = 0 4625 0 6082c = 0 2813
Zr �-Zr Mg A3 hP2 P63/mmc a = 0 32316 1 5929Va�nm�3 = c = 0 5147523 28×10−3 �-Zr W A2 cI2 Im3̄m a = 0 36090 1 0
-Zr -Ti − hP3 P6/mmm a = 0 5036 0 617c = 0 3109
′ W A2 cI2 Im3̄m − −Ph – Phase; P – Prototype structure; SN – Strukturbericht notation; PS – Pearson symbol; SG – Space group.Notes:1. The lattice parameter values of �- and - phase correspond to a temperature of 298 K.2. The quantity Va refers to the atomic volume under ambient conditions.
with metallic d-bonding is somewhat unusual. Normally, the transition metals haveclose packed (fcc, hcp) or fairly close packed (bcc) structures. Open structuresare common among the p-electron systems or the actinide elements (Duthie andPettifor 1977, Skriver 1985). The stability of this phase has been attributed tothe covalent bonding contribution from s-d electron transfer (Steurer 1996). Inthe case of Zr (and Hf), it has been found that on the application of substantiallyhigher pressures (Table 1.3) the -phase transforms to the ′-phase, which hasthe bcc structure. Although a similar transformation has not been observed in thecase of Ti, even at a pressure as high as 87 GPa, theoretical considerations indicatethat this metal too would undergo such a transformation at still higher pressures(Ahuja et al. 1993, Steurer 1996). This issue is addressed in greater detail in alater chapter of this volume.
1.3 PHASE DIAGRAMS OF ELEMENTAL TITANIUMAND ZIRCONIUM
1.3.1 Introductory remarksFrom the point of view of the phase rule, a pure element represents a singlecomponent system which may exhibit different phases. The phase rule imposes
Elsevier UK Code: PTA Ch01-I042145 5-6-2007 9:27a.m. Page:8 Trim:165mm×240mm Integra, India
Font:Times F.Size:11/13pt Margins: Top:19mm Gutter:19mm Width:128mm Depth:40 Lines 1 Color Recto
8 Phase Transformations: Titanium and Zirconium Alloys
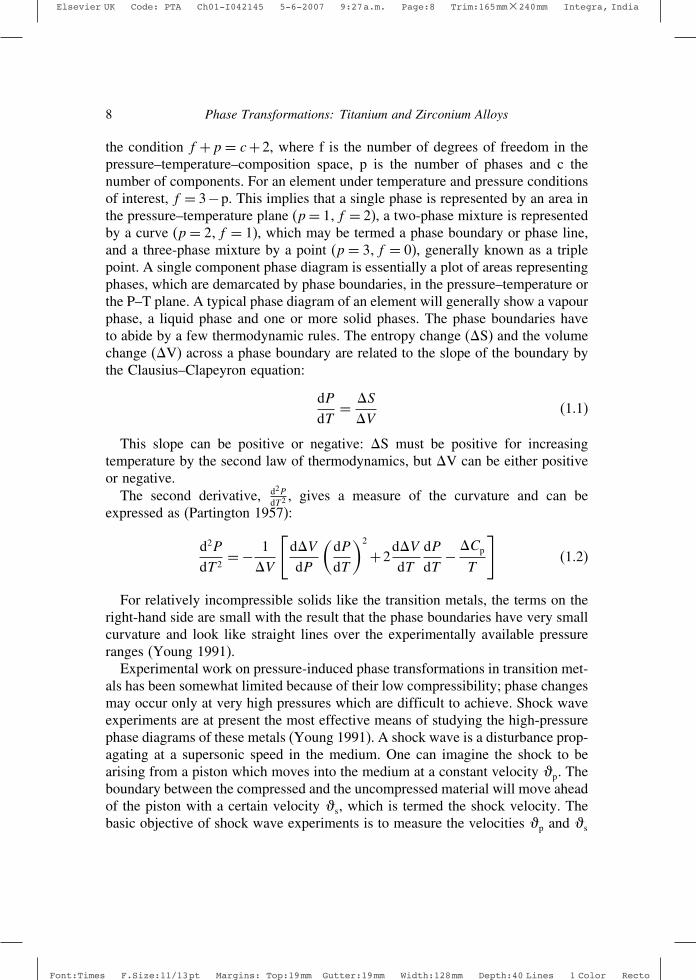
the condition f +p = c+ 2, where f is the number of degrees of freedom in thepressure–temperature–composition space, p is the number of phases and c thenumber of components. For an element under temperature and pressure conditionsof interest, f = 3−p. This implies that a single phase is represented by an area inthe pressure–temperature plane (p = 1� f = 2), a two-phase mixture is representedby a curve (p = 2� f = 1), which may be termed a phase boundary or phase line,and a three-phase mixture by a point (p = 3� f = 0), generally known as a triplepoint. A single component phase diagram is essentially a plot of areas representingphases, which are demarcated by phase boundaries, in the pressure–temperature orthe P–T plane. A typical phase diagram of an element will generally show a vapourphase, a liquid phase and one or more solid phases. The phase boundaries haveto abide by a few thermodynamic rules. The entropy change (�S) and the volumechange (�V) across a phase boundary are related to the slope of the boundary bythe Clausius–Clapeyron equation:
dPdT
= �S
�V(1.1)
This slope can be positive or negative: �S must be positive for increasingtemperature by the second law of thermodynamics, but �V can be either positiveor negative.
The second derivative, d2PdT2 , gives a measure of the curvature and can be
expressed as (Partington 1957):
d2P
dT 2= − 1
�V
[d�V
dP
(dPdT
)2
+2d�V
dTdPdT
− �Cp
T
](1.2)
For relatively incompressible solids like the transition metals, the terms on theright-hand side are small with the result that the phase boundaries have very smallcurvature and look like straight lines over the experimentally available pressureranges (Young 1991).
Experimental work on pressure-induced phase transformations in transition met-als has been somewhat limited because of their low compressibility; phase changesmay occur only at very high pressures which are difficult to achieve. Shock waveexperiments are at present the most effective means of studying the high-pressurephase diagrams of these metals (Young 1991). A shock wave is a disturbance prop-agating at a supersonic speed in the medium. One can imagine the shock to bearising from a piston which moves into the medium at a constant velocity �p. Theboundary between the compressed and the uncompressed material will move aheadof the piston with a certain velocity �s, which is termed the shock velocity. Thebasic objective of shock wave experiments is to measure the velocities �p and �s

Elsevier UK Code: PTA Ch01-I042145 5-6-2007 9:27a.m. Page:9 Trim:165mm×240mm Integra, India
Font:Times F.Size:11/13pt Margins: Top:19mm Gutter:19mm Width:128mm Depth:40 Lines 1 Color Recto
Phases and Crystal Structures 9
and to determine from them the thermodynamic state of the host material. For mostmaterials, �p and �s bear a linear relationship. But at a phase boundary this relation-ship may break down and the �s versus �p plot may show a discontinuity (McQueenet al. 1970). The reason for this is that a steady shock wave needs a sound speedthat increases with compression and that this requirement is violated by a first-order phase transition, with the result that the shock wave breaks up into a low-pressure wave (representing the untransformed material) and a high-pressure wave(representing the transformed material). The detectors register the arrival of onlythe first (i.e. low-pressure wave) and the two-wave region appears as a flat segmentof constant �s on the �s versus �p plot; a third segment appears on the plot whenthe shock velocity in the transformed material exceeds that corresponding to theuntransformedmaterial (Young1991).Theappearanceofdiscontinuities in the�s–�p
plane is thus a good indication of the occurrence of a first-order phase transition.
1.3.2 TitaniumAs stated earlier in this chapter, elemental Ti exists as the hcp �-phase at roomtemperature under atmospheric pressure. On raising the pressure, while keepingthe temperature constant, Ti transforms to the hexagonal -phase at around 2 GPapressure. The �– phase boundary has been reported to have a negative slope(Zilbershteyn et al. 1975, Vohra et al. 1982). This transition is associated with alarge hysteresis and the equilibrium phase boundary has not been determined accu-rately (Young 1991). Further compression at room temperature to pressures upto87 GPa has not shown any phase other than the -phase until recently (Xia et al.1990a,b). As indicated earlier, this point will be covered in a subsequent chapter.
Under atmospheric pressure, the �-phase transforms to the denser �-phase (bcc)at 1155 K. The �–� phase boundary has been determined by high temperature,static pressure measurements (Bundy 1963, Jayaraman et al. 1963). The triplepoint at which the �-, �- and -phases meet occurs at about 9.0 GPa and 940 K(Young 1991). The �– phase boundary has been experimentally determined uptoa pressure of 15 GPa (Bundy 1963). No phase other than the �-, �- and –phaseshas been found in Ti. Shock wave experiments conducted on elemental Ti haveshown a discontinuity in the �s–�p curve; it has been suggested that this maycorrespond to the �– or –� transition (McQueen et al. 1970, Kutsar et al. 1982,Kiselev and Falkov 1982). The experimentally determined pressure–temperaturephase diagram of Ti is shown in Figure 1.1 (Young 1991).
Linear muffin tin orbital (LMTO) calculations which take into considerationthe hcp, bcc, and fcc structures have predicted the stability of the -phase forpressures up to 30 GPa (Gyanchandani et al. 1990). The disposition of the �–boundary (Figure 1.1) is not inconsistent with the theoretical prediction that at 0 Kthe -phase is the equilibrium phase in the case of Ti.

Elsevier UK Code: PTA Ch01-I042145 5-6-2007 9:27a.m. Page:10 Trim:165mm×240mm Integra, India
Font:Times F.Size:11/13pt Margins: Top:19mm Gutter:19mm Width:128mm Depth:40 Lines 1 Color Recto
10 Phase Transformations: Titanium and Zirconium Alloys
Ti2.5
2.0
1.5
1.0
0.5
00 6 12 18
P (GPa)
bcc(β)
hcp(α)
hex(ω)
Liquid
T (
× 1
03 K
)
Figure 1.1. Experimentally determined temperature–pressure phase diagram for Ti.
1.3.3 ZirconiumAs in the case of Ti, elemental Zr exists as the hcp �-phase at room temperatureand pressure, while on pressurization at this temperature it gets converted to thehexagonal -phase at a pressure of about 2 GPa. In this case also, the �– phaseline exhibits a negative slope (Jayaraman et al. 1963, Zilbershteyn et al. 1975,Guillermet 1987). A precise determination of the equilibrium transition pressurehas, however, not been possible due to the occurrence of hysteresis (Young 1991).Static pressure experiments at room temperature have established that the -phasetransforms to a bcc phase (′) at a pressure of 30 GPa (Xia et al. 1990a,b). Thisbcc phase has been found to be the same as the �-phase.
It has been mentioned earlier that under atmospheric pressure, �–Zr transformsto �–Zr at 1139 K. The �–� phase boundary for elemental Zr has been studied byhigh-temperature, static pressure experiments (Jayaraman et al. 1963, Zilbershteynet al. 1973). The –� boundary has been determined upto a pressure of 7.5 GPa(Jayaraman et al. 1963). The �–�– triple point has been found to occur at975 K and 6.7 GPa. As mentioned earlier, the �-phase appears to be identicalto the ′-phase that occurs at room temperature under high pressures and thisimplies that the –� phase boundary has to turn backward towards the T = 0 Kaxis at high pressures (Young 1991). Shock wave experiments conducted on Zrare reported to show a discontinuity in the �s versus �p curve as in the caseof Ti and this has been interpreted as being suggestive of the occurrence of a

Elsevier UK Code: PTA Ch01-I042145 5-6-2007 9:27a.m. Page:11 Trim:165mm×240mm Integra, India
Font:Times F.Size:11/13pt Margins: Top:19mm Gutter:19mm Width:128mm Depth:40 Lines 1 Color Recto
Phases and Crystal Structures 11
0 2 4 6 8 100
1
2
3Zr
P (GPa)
T (
× 1
03 K
)
bcc(β)
hcp(α) hex
(ω)
Liquid
Figure 1.2. Experimentally determined temperature–pressure phase diagram for Zr.
phase transition (McQueen et al. 1970, Kutsar et al. 1984). The experimentallydetermined pressure–temperature phase diagram of Zr is shown in Figure 1.2.
In the case of Zr, LMTO calculations predict that the �– and –′ transi-tions should occur at pressures of 5 GPa and 11 GPa, respectively (Gyanchandaniet al. 1990).
1.3.4 EpilogueThe occurrence of the -phase at high pressures in elemental Ti and Zr and atroom pressures in alloy systems such as Ti–V and Zr–Nb and the similarity ofthe � and the structures have been interpreted as being indicative of the factthat the phase diagrams of Ti and Zr exhibit the phenomenon of s-d electrontransfer (Sikka et al. 1982). Effecting an increase in the number of d-electrons,either by the application of pressure or by alloying with elements relatively richerin d-electrons, drives the structure towards the bcc structure characteristic of thenext group of elements to the right (i.e. V or Nb). The specific form of the structure, which may be regarded as a hexagonal distortion of the bcc structure,may be related to the details of the Fermi surfaces (Myron et al. 1975, Simmonsand Varma 1980).
The crystal structures of Ti, Zr and Hf under pressure have recently been studiedby Ahuja et al. (1993) by means of first principles, total energy calculations basedthe local density approximation. These calculations correspond to zero temperature
Elsevier UK Code: PTA Ch01-I042145 5-6-2007 9:27a.m. Page:12 Trim:165mm×240mm Integra, India
Font:Times F.Size:11/13pt Margins: Top:19mm Gutter:19mm Width:128mm Depth:40 Lines 1 Color Recto
12 Phase Transformations: Titanium and Zirconium Alloys
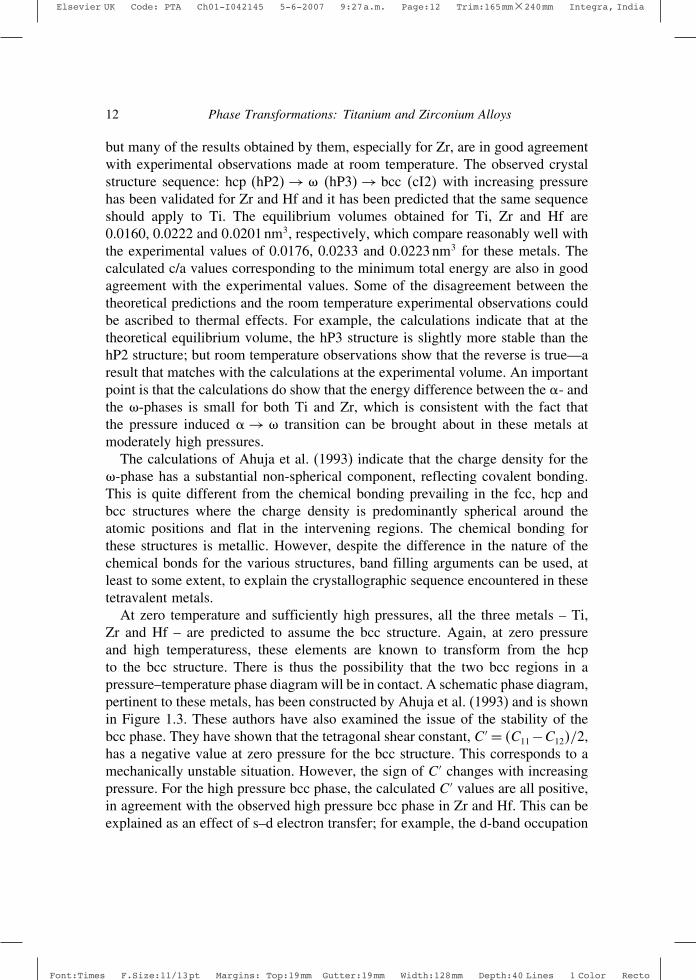
but many of the results obtained by them, especially for Zr, are in good agreementwith experimental observations made at room temperature. The observed crystalstructure sequence: hcp �hP2� → �hP3� → bcc �cI2� with increasing pressurehas been validated for Zr and Hf and it has been predicted that the same sequenceshould apply to Ti. The equilibrium volumes obtained for Ti, Zr and Hf are0.0160, 0.0222 and 0 0201 nm3, respectively, which compare reasonably well withthe experimental values of 0.0176, 0.0233 and 0 0223 nm3 for these metals. Thecalculated c/a values corresponding to the minimum total energy are also in goodagreement with the experimental values. Some of the disagreement between thetheoretical predictions and the room temperature experimental observations couldbe ascribed to thermal effects. For example, the calculations indicate that at thetheoretical equilibrium volume, the hP3 structure is slightly more stable than thehP2 structure; but room temperature observations show that the reverse is true—aresult that matches with the calculations at the experimental volume. An importantpoint is that the calculations do show that the energy difference between the �- andthe -phases is small for both Ti and Zr, which is consistent with the fact thatthe pressure induced � → transition can be brought about in these metals atmoderately high pressures.
The calculations of Ahuja et al. (1993) indicate that the charge density for the-phase has a substantial non-spherical component, reflecting covalent bonding.This is quite different from the chemical bonding prevailing in the fcc, hcp andbcc structures where the charge density is predominantly spherical around theatomic positions and flat in the intervening regions. The chemical bonding forthese structures is metallic. However, despite the difference in the nature of thechemical bonds for the various structures, band filling arguments can be used, atleast to some extent, to explain the crystallographic sequence encountered in thesetetravalent metals.
At zero temperature and sufficiently high pressures, all the three metals – Ti,Zr and Hf – are predicted to assume the bcc structure. Again, at zero pressureand high temperaturess, these elements are known to transform from the hcpto the bcc structure. There is thus the possibility that the two bcc regions in apressure–temperature phase diagram will be in contact. A schematic phase diagram,pertinent to these metals, has been constructed by Ahuja et al. (1993) and is shownin Figure 1.3. These authors have also examined the issue of the stability of thebcc phase. They have shown that the tetragonal shear constant, C ′ = �C11 −C12�/2,has a negative value at zero pressure for the bcc structure. This corresponds to amechanically unstable situation. However, the sign of C ′ changes with increasingpressure. For the high pressure bcc phase, the calculated C ′ values are all positive,in agreement with the observed high pressure bcc phase in Zr and Hf. This can beexplained as an effect of s–d electron transfer; for example, the d-band occupation

Elsevier UK Code: PTA Ch01-I042145 5-6-2007 9:27a.m. Page:13 Trim:165mm×240mm Integra, India
Font:Times F.Size:11/13pt Margins: Top:19mm Gutter:19mm Width:128mm Depth:40 Lines 1 Color Recto
Phases and Crystal Structures 13
Pressure
Tem
pera
ture
hcpbcc
bcc I II
L
ω
Figure 1.3. Schematic temperature–pressure phase diagram for the metals Ti, Zr and Hf.The bcc phase is mechanically unstable in the region I and mechanically stable in the region II at lowtemperatures.
of Zr increases under pressure, making it behave more like the element to its right,i.e. Nb, which has a bcc crystal structure.
Even though the bcc structure, according to calculations, is mechanically unsta-ble at zero pressure, the high temperature �-phase of all the three metals is knownto posses this structure. This can be explained in terms of the high entropy associ-ated with the bcc structure. The �-phase of these elements shows some anomalousproperties including its well known anomalously fast diffusion behaviour. Thisbehaviour might be related to the intrinsic mechanical instability associated withthe value of the C ′ parameter. Another possible explanation suggested for theanomalous diffusion behaviour invokes -embryos acting as activated complexconfigurations in the atom–vacancy exchange process (Sanchez and de Fotnaine1975). The fact that the -phase is calculated to have a lower total energy than the�-phase at the equilibrium volume for all the three metals lends support to suchan interpretation.
The mechanical instability of the bcc phase becomes less severe with increasingpressure in the sense that the value of C ′ becomes less negative with decreasingvolume. Therefore, as the pressure increases, a progressively lower temperature isneeded to restore the stability of the bcc structure (Ahuja et al. 1993).
1.3.5 Phase stability and electronic structureThe stability of phases, the dependence of this stability on parameters like tem-perature and pressure and the selection of phases that are actually observed andrecorded in phase diagrams are determined by the result of the competition amongseveral possible phases (and, therefore, structures) that could be stable in a given

Elsevier UK Code: PTA Ch01-I042145 5-6-2007 9:27a.m. Page:14 Trim:165mm×240mm Integra, India
Font:Times F.Size:11/13pt Margins: Top:19mm Gutter:19mm Width:128mm Depth:40 Lines 1 Color Recto
14 Phase Transformations: Titanium and Zirconium Alloys
system. This competition is based on the respective values of the Gibbs free energycorresponding to the various pertinent phases and their variation with temperature,pressure, composition and parameters such as magnetic, electric or stress fields,dose rates of particle and photon irradiation, etc. A number of factors contribute tothe enthalpy, H , and the entropy, S. A very important contribution to the entropyarises from the statistical mixing of atoms. There may be additional contributionsfrom vibrational effects, clustering of atoms, distribution of magnetic moments,long range configurational effects, etc. The statistical mixing of atoms contributesto the enthalpy as well. These contributions are related to the interaction energies:those corresponding to nearest neighbour atoms, next nearest neighbour atoms andfurther distant atoms in a given structure. These interaction energies may arisefrom various origins – electronic, magnetic, elastic and vibrational. A formidableproblem in the context of the assessment of phase stability is that the relativestability among the competing crystal structures is usually dictated by very smallenergy differences between large values of the cohesive energy. Apart from this, acorrect prediction implies the prediction of the lowest free energy structure amongthe chosen structural alternatives. This, in turn, stipulates a prior algorithm togenerate all probable structures. Even when all these difficulties are overcome, itis needed to incorporate the roles of variables like temperature and pressure inrealistic terms. These are, indeed, difficult tasks.
The success of a theory of phase stability is largely determined by its abilityto make predictions that are consistent with experimental observations. Thereis a need to be able to calculate phase stability from “first principles” if thebasic microscopic parameters that dictate the free energy of a phase are to beproperly understood. It should also be possible to make use of such calculationsfor predicting phase diagrams in systems where the experimental determination ofsuch diagrams is difficult. The understanding and prediction of phase stability inrespect of disordered and ordered alloys in terms of electronic structure calculationsconstitute an area of considerable importance in materials science and significantprogress has been made with regard to the “first principles” approach to the bandtheory of such materials (Massalski 1996).
The computation of an alloy phase diagram from first principles implies itsdelineation from a knowledge of the electronic structure of the alloy. In a truly abinitio calculation, one begins with a periodic array of nuclei of charge Ze togetherwith Z electrons per nucleus, and then solves the Schrodinger equation for thetotal energy of the system. When Z is small (e.g. for H, He and Li), it is possibleto handle this problem by Quantum Monte Carlo (QMC) methods (Ceperley andAlder 1986) which are exact in principle. However, the QMC method is not yetpractical for heavier atoms, and the development of the density functional theoryand its computational version, the local density approximation (LDA), has been of
Elsevier UK Code: PTA Ch01-I042145 5-6-2007 9:27a.m. Page:15 Trim:165mm×240mm Integra, India
Font:Times F.Size:11/13pt Margins: Top:19mm Gutter:19mm Width:128mm Depth:40 Lines 1 Color Recto
Phases and Crystal Structures 15
great value. Here the full many-body wave function is approximated as a productof one-electron functions, and the exchange–correlation energy is expressed as afunction of the local electron density, n�r�, given by n�r� = ��k�r��
2��k�r� beingthe one-electron wave function for the occupied state k (Young 1991).
In the density functional theory, the total energy of a system of nuclei andelectrons is considered to be a unique functional of n�r� and is a minimum at thetrue ground state. The total energy, Et , is expressed as Et = E1 +E2 +E3 +E4 +E5
where the terms on the right-hand side represent the kinetic (E1), electron–nucleus(E2), electron–electron (E3), exchange–correlation (E4) and nucleus–nucleus (E5)energies.
The different approaches used to solve the one-electron Schrodinger equation,with the imposition of the lattice periodicity (Bloch condition) as a boundarycondition, have engendered a variety of band-structure methods; some of these are(Young 1991): ab initio pseudopotential (AIP); linear muffin tin orbital (LMTO);augmented spherical wave (ASW); linearized augmented plane wave (LAPW);full-potential LAPW (FPLAPW) and linear combination of Gaussian-type orbitals(LCGTO).
The LMTO method, which has been extensively used, is based on some addi-tional approximations. While the muffin tin (MT) potential implies that the atomicpotential V�r� is spherically symmetric within a sphere inscribed in the primitiveunit cell and is constant in the interstitial region, the LMTO method brings in afurther simplification by way of the atomic-sphere approximation (ASA), wherebythe spherical potential is extended to the full atomic volumes, reducing the netinterstitial volume to zero. The Bloch condition is implemented by effecting thecancellation of all neighbour wave functions within the atomic sphere (Skriver1984). The ‘L’ in LMTO implies the approximation that the basis functions aremade energy-independent; this permits the eigenfunctions to be obtained in a sin-gle diagonalization operation, speeding up the calculation enormously and thuscontributing to the efficacy of the method, a major limitation of which is therestriction to high-symmetry crystal structures imposed by the ASA (Young 1991).The LMTO method has been used to predict the stability of different phases withregard to the pressure–temperature phase diagrams of many transition metals,including Ti and Zr.
Total energy calculations based on the LDA, which use only atomic numbers asinputs, have been very successful in the estimation of 0 K ground state propertiesof the elements and of ordered compounds. In fact, the implementation of theLDA by many an investigator, combined with the development of efficient linearmethods for studying the electronic structure of solids, has led to fully ab initiocalculations of the total energy at 0 K of pure solids, relatively simple compoundsand disordered alloys (Sanchez 1992). By making it possible to assess a wide range

Elsevier UK Code: PTA Ch01-I042145 5-6-2007 9:27a.m. Page:16 Trim:165mm×240mm Integra, India
Font:Times F.Size:11/13pt Margins: Top:19mm Gutter:19mm Width:128mm Depth:40 Lines 1 Color Recto
16 Phase Transformations: Titanium and Zirconium Alloys
of physical properties quite close to the corresponding experimentally obtainedvalues, these quantum mechanical total energy computations have provided veryfavourable evidence in support of the LDA method, which can be applied, togetherwith appropriate statistical models, to address the difficult problem of alloy stabilityat non-zero temperatures.
Even though the LDA method has been quite successful, it has some non-triviallimitations including the underestimation of band gap energies and the inabilityto predict narrow band Mott-transition phenomena (Young 1991). A more generalmethod for calculating the equilibrium state of matter at finite temperatures is thequantum molecular dynamics method (Car and Parrinello 1989). In this approach,the LDA wave function is solved for a small number of nuclei in an arbitraryconfiguration and the Hellman–Feynman theorem is used for finding the netforce on each nucleus; the nuclei are then moved in accordance with classical(Newtonian) dynamics and the LDA calculation is undertaken again for the newconfiguration of the nuclei. This approach has been found to be useful for arrivingat band structures and bonding details in respect of solids and liquids at finitetemperatures (Young 1991).
In the context of statistical models, it is appropriate to make a mention hereof the Monte Carlo (MC) (Binder 1986) and molecular dynamics (MD) (Hoover1986) methods. Like QMC, these methods are exact in principle. Although it ispossible to undertake direct calculation of free energy by MC, the technique is notyet very suitable for the determination of phase stability and accurate delineation ofphase boundaries. As of now, the MD method also suffers from similar limitations.It is true that isobaric–isothermal ensemble versions of MC and MD have beensuccessfully employed to predict the most stable crystal structures of certain solids(Parrinello and Rahman 1981), but these methods have found their most importantuse in providing a standard for comparing and refining approximate statisticalmechanics models (Young 1991).
Some of the aspects briefly outlined in the preceding paragraphs have beencovered in greater detail in a subsequent chapter.
It is to be noted that a major shortcoming of many of the ab initio phasediagram calculations concerns the inadequate treatment of local volume and elasticrelaxations and the neglect of vibrational modes. Even in crystalline solids, atomsare in perpetual motion; they move from one lattice site to another by diffusionat non-zero temperatures and also vibrate about their equilibrium positions. In amulticomponent system like an alloy, a given lattice site is occupied by atomsof different species at different times. If a large atom replaces a small one, theenvironment of the lattice site responds by expanding. Likewise, when a smallatom replaces a large atom, the neighbouring atoms relax towards the lattice sitein question. It should be possible to address the accompanying strain fluctuations

Elsevier UK Code: PTA Ch01-I042145 5-6-2007 9:27a.m. Page:17 Trim:165mm×240mm Integra, India
Font:Times F.Size:11/13pt Margins: Top:19mm Gutter:19mm Width:128mm Depth:40 Lines 1 Color Recto
Phases and Crystal Structures 17
within the same type of first principles framework that is pertinent to fluctuationsin concentration. However, the treatment of local relaxations of this kind presents avery difficult problem and not many attempts appear to have been made to includethis effect in first principles calculations of phase stability and phase diagrams(Sanchez 1992, Gyorffy et al. 1992).
Apart from the direct quantum mechanical route, many semi-empirical schemespertaining to phase stability have also been pursued, often with a good deal of suc-cess. Many of these schemes involve the construction of certain phenomenologicalscales on which various aspects of bonding and structural characteristics are mea-sured (Raju et al. 1995). These scales include parameters like the electronegativityfactor, the size factor, the coordination factor, the electron concentration (e/a)factor, the promotion energy factor, etc. that are used to systematize a variety ofstructural features. The resulting structure maps are essentially graphical represen-tations of the relative structural stability of alloy phases. They are two-dimensionaldiagrams, constructed by using suitable alloy theory coordinates for sorting outdifferent crystal structures that are compatible with a chosen alloy stoichiometry.The efficacy of these structure maps depends crucially on the appropriate choiceof coordinates. What are needed are those “bond indicators” which are transparentin their physical content, are transferable in their applicability and have a bear-ing on the alloy formation situation in terms of a validated model (Raju et al.1995). In the classical approach, the emphasis has been on the construction ofphysically simple and transferable coordinates that may systematize the observedtrends in relation to the occurrence of alloy phases. The major limitations of theclassical formalism lie in the linear dependencies among many of the differentphenomenological scales and the absence of a microscopic model that connectsone or more of these directly to a real space alloy physics (Raju et al. 1995).Quantum mechanical considerations have been invoked in order to tide over thesedeficiencies with the result that the classical coordinates have been replaced bywhat are known as quantum structural parameters and classical structure diagramsby quantum structural diagrams (QSD). There have been numerous applicationsof QSD to various classes of solids including intermetallics, quasicrystals, high Tc
superconductors and permanent magnetic materials (Phillips 1991). Even thoughnot all of these have served to elucidate the issue of structural stability of con-densed phases, these have been very useful in ordering the vast available data baseinto certain systematics. There are, indeed, quite a few examples of QSD whichhave really enhanced the understanding of the physicochemical factors governingphase stability.
Most of the existing models pertaining to phase stability, ranging from thoseoffering detailed density maps and electronic parameters of alloys to the semi-empirical ones, suffer from a major difficulty in the context of the construction

Elsevier UK Code: PTA Ch01-I042145 5-6-2007 9:27a.m. Page:18 Trim:165mm×240mm Integra, India
Font:Times F.Size:11/13pt Margins: Top:19mm Gutter:19mm Width:128mm Depth:40 Lines 1 Color Recto
18 Phase Transformations: Titanium and Zirconium Alloys
of phase diagrams in that a theoretical treatment of the temperature dependenceof energy is not straightforward and tractable (Massalski 1996). The calculationsused for predicting enthalpy at 0 K (first principles calculations) or at some unde-fined temperature (semi-empirical models) are seldom able to furnish adequateinformation regarding the thermal behaviour of such enthalpies or the thermalentropy contributions to the free energy. The prediction of entropies, particu-larly for relevant metastable phases in phase diagrams, has to be realized forthe utilization of the full potential of the theoretical methods of phase stabilitycalculations.
1.3.6 Some features of transition metalsElements belonging to the family of transition metals, of which Ti and Zr aremembers, are generally characterized by certain interesting features. Some of thesewill be briefly covered in this section.
Elements of Groups 3–10 in the periodic table constitute the transition metalswhich have in common that their d-orbitals (3d, 4d and 5d) are partially occupied.These orbitals are only slightly screened by the outer s-electrons, resulting insignificantly different chemical properties of these elements going from left to rightin the periodic table; the atomic volumes rapidly decrease with increasing numberof electrons in the bonding d-orbitals, because of cohesion, and then increase asthe anti-bonding d-orbitals get filled (Steurer 1996).
Transition metals are characterized by a fairly tightly bound (and partially filled)d-band that overlaps and hybridizes with a broader nearly-free-electron (NFE)sp-band. The d-band (with a large density of states near the Fermi level) is welldescribed within the tight-binding (TB) approximation by a linear combinationof atomic d-orbitals and the difference in behaviour between the valence sp andd electrons arises from the d-shell lying inside the outer valence s-shell, therebyresulting in a small overlap between the d-orbitals in the bulk (Pettifor 1996).
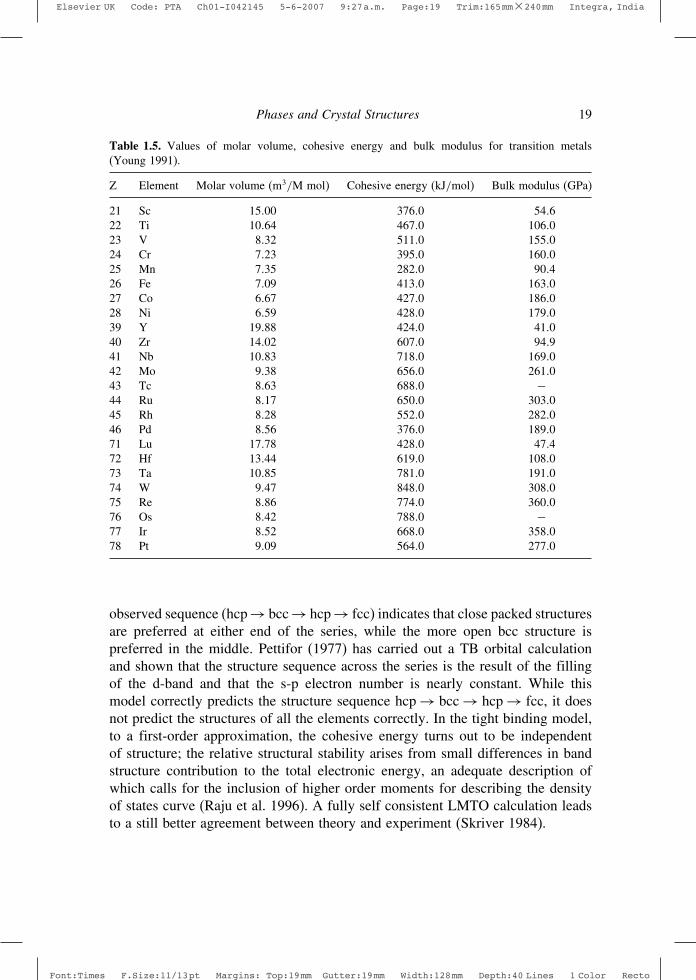
In general, the transition metals exhibit high densities, cohesive energiesand bulk moduli, with some exceptions. These characteristics arise from strongd- electron bonding. Plots of molar volume, cohesive energy and bulk modulusagainst the number of d-electrons yield roughly symmetrical curves with extremevalues approximately at the middle of the series (Young 1991). An exception tothis trend occurs with the 3d magnetic elements. The values of these parametersfor the transition elements are shown in Table 1.5. The general behaviour alludedto the above can be rationalized in terms of the Friedel model of transition metald-bands (Harrison 1980). Cohesive energy versus group number plots for 3d, 4dand 5d transition metals are shown in Figure 1.4.
The sequence of the observed room temperature (and pressure) crystal structuresin the case of 3d, 4d and 5d transition metals is presented in Table 1.6. This
Elsevier UK Code: PTA Ch01-I042145 5-6-2007 9:27a.m. Page:19 Trim:165mm×240mm Integra, India
Font:Times F.Size:11/13pt Margins: Top:19mm Gutter:19mm Width:128mm Depth:40 Lines 1 Color Recto
Phases and Crystal Structures 19
Table 1.5. Values of molar volume, cohesive energy and bulk modulus for transition metals(Young 1991).
Z Element Molar volume (m3/M mol) Cohesive energy (kJ/mol) Bulk modulus (GPa)
21 Sc 15 00 376 0 54 622 Ti 10 64 467 0 106 023 V 8 32 511 0 155 024 Cr 7 23 395 0 160 025 Mn 7 35 282 0 90 426 Fe 7 09 413 0 163 027 Co 6 67 427 0 186 028 Ni 6 59 428 0 179 039 Y 19 88 424 0 41 040 Zr 14 02 607 0 94 941 Nb 10 83 718 0 169 042 Mo 9 38 656 0 261 043 Tc 8 63 688 0 −44 Ru 8 17 650 0 303 045 Rh 8 28 552 0 282 046 Pd 8 56 376 0 189 071 Lu 17 78 428 0 47 472 Hf 13 44 619 0 108 073 Ta 10 85 781 0 191 074 W 9 47 848 0 308 075 Re 8 86 774 0 360 076 Os 8 42 788 0 −77 Ir 8 52 668 0 358 078 Pt 9 09 564 0 277 0
observed sequence (hcp → bcc → hcp → fcc) indicates that close packed structuresare preferred at either end of the series, while the more open bcc structure ispreferred in the middle. Pettifor (1977) has carried out a TB orbital calculationand shown that the structure sequence across the series is the result of the fillingof the d-band and that the s-p electron number is nearly constant. While thismodel correctly predicts the structure sequence hcp → bcc → hcp → fcc, it doesnot predict the structures of all the elements correctly. In the tight binding model,to a first-order approximation, the cohesive energy turns out to be independentof structure; the relative structural stability arises from small differences in bandstructure contribution to the total electronic energy, an adequate description ofwhich calls for the inclusion of higher order moments for describing the densityof states curve (Raju et al. 1996). A fully self consistent LMTO calculation leadsto a still better agreement between theory and experiment (Skriver 1984).

Elsevier UK Code: PTA Ch01-I042145 5-6-2007 9:27a.m. Page:20 Trim:165mm×240mm Integra, India
Font:Times F.Size:11/13pt Margins: Top:19mm Gutter:19mm Width:128mm Depth:40 Lines 1 Color Recto
20 Phase Transformations: Titanium and Zirconium Alloys
43 5 6 7 8 9 10
3d
4d
5d
250
350
450
550
650
750
850
950
Group number
Coh
esiv
e en
ergy
(kJ
/mol
)
Figure 1.4. Cohesive energy versus group number plots for 3d, 4d and 5d transition metals.
Table 1.6. Crystal structures of d-transition metals at room temperature and pressure.
HCP BCC HCP FCC
3d series Sc Ti V Cr Fe Mn Co Ni4d series Y Zr Nb Mo Tc Ru Rh Pd5d series Lu Hf Ta W Re Os Ir Pt
Note: The actual structure of Mn is complex though it is listed under bcc in this table.
A systematic theoretical study with regard to the phase transitions that can beexpected to occur in unalloyed transition metals at ultra-high pressures has not yetbeen attempted. However, it is, in general, expected that the early transition metalswill assume the structures of their right-hand side neighbours as the s–d electrontransfer will lead to the filling of the d-band under pressure; for the later membersof the series, pressure is expected to have the effect of emptying the d-band, thusreversing the earlier trend (Young 1991).
Obviously, transition metal phase transitions can also be driven by alloying,whereby the number of electrons populating the d-band can be altered. Fairlygeneral theoretical arguments suggest that alloys of transition metals with roughlyhalf-filled d-bands exhibit ordering tendencies, while those with nearly empty ornearly full d-bands show clustering tendencies in the disordered state and thus tendto phase separate at low temperatures; this prediction appears to be borne out bya considerable body of experimental data, even though there are many exceptionsto this rule (Gyorffy et al. 1992).

Elsevier UK Code: PTA Ch01-I042145 5-6-2007 9:27a.m. Page:21 Trim:165mm×240mm Integra, India
Font:Times F.Size:11/13pt Margins: Top:19mm Gutter:19mm Width:128mm Depth:40 Lines 1 Color Recto
Phases and Crystal Structures 21
1.4 EFFECT OF ALLOYING
1.4.1 Introductory remarksIn alloys based on Ti or Zr, a very important effect of an alloying element pertainsto the manner in which its addition affects the allotropic �-phase to �-phasetransformation temperature. Some elements stabilize the �-phase by raising thistemperature while some others lower it, thereby stabilizing the �-phase. Elementswhich, on being dissolved in Ti or Zr, cause the transformation temperatureto increase or bring about little change in it are known as �-stabilizers. Theseelements are generally non-transition metals or interstitial elements (like C, N andO). Elements which, on alloying with Ti or Zr, bring down the transformationtemperature are termed �-stabilizers. These elements are generally the transitionmetals and the noble metals with unfilled or just filled d-electron bands. Amongthe interstitial elements, H is a �-stabilizer. Unlike in pure Ti or Zr, in alloysthe single phase � and the single phase � regions are separated by a two-phase�+� region in the temperature versus composition phase diagram. The width ofthis region increases with increasing solute content. The single equilibrium �- to�-phase transformation temperature associated with elemental Ti or Zr is replacedby two equilibrium temperatures in the case of an alloy: the �-transus temperature,below which the alloy contains only the �-phase, and the �-transus temperature,above which the alloy contains only the �-phase. At temperatures between thesetwo temperatures, both the �- and the �-phases are present.
1.4.2 Alloy classificationThe allotropic transformation exhibited by Ti and Zr forms the basis of the classi-fication of commercial alloys based on these metals. Such classification is effectedon the basis of the phases present in these alloys at ambient temperature (andpressure). The relative proportions of the constituent phases are determined by thenature (�-stabilizing or �-stabilizing) and the amounts of the alloying elements.In the case of alloys, the �- and �-phases contain various amounts of the differentalloying species in solid solution.
1.4.3 Titanium alloysTechnical alloys of Ti, which are generally multicomponent alloys containing�-stabilizing as well as �-stabilizing elements, are broadly classified as � alloys,�+� alloys and � alloys. Within the second category, there are the subclasses“near �” and “near �” alloys, referring to alloys whose compositions place themnear the �/��+�� or the ��+��/� phase boundaries, respectively.

Elsevier UK Code: PTA Ch01-I042145 5-6-2007 9:27a.m. Page:22 Trim:165mm×240mm Integra, India
Font:Times F.Size:11/13pt Margins: Top:19mm Gutter:19mm Width:128mm Depth:40 Lines 1 Color Recto
22 Phase Transformations: Titanium and Zirconium Alloys
Unalloyed Ti and its alloys with one or more �-stabilizing elements consist fullyor predominantly of the �-phase at room temperature and are known as � alloys.The �-phase continues to be the primary phase constituent of most of these alloys attemperatures well beyond about 1040 K (Froes et al. 1996). These alloys generallyexhibit good strength, toughness, creep resistance and weldability, together withthe absence of a ductile-to-brittle transition (Collings 1984). However, they arenot amenable to strengthening by heat treatment.
The compositions of �+� alloys are such that at room temperature they containa mixture of the �- and �-phases. These alloys have one or more of �- as wellas �-stabilizing elements as alloying additions. In general, �+� alloys possessgood fabricability. They are very strong at room temperature and moderately soat high temperatures (Collings 1984). The relative volume fractions of the �- and�-phases in these alloys can be varied by heat treatment, which provides a handlefor adjusting their properties.
In �-alloys, the �-phase is stabilized by the addition of adequate amounts of�-stabilizing elements and can be retained at room temperature. These alloysgenerally contain significant amounts of one or more of the transition metals V,Nb, Ta (Group 5) and Mo (Group 6). These “�-isomorphous” alloying elements donot form intermetallic compounds through eutectoid decomposition of the �-phaseand are generally preferred to eutectoid forming �-stabilizing elements such asCr, Cu, Ni; however, elements of the latter category are sometimes added to �(and �+�) alloys for improving their hardenability and response to heat treatment(Froes et al. 1996). The strength of � alloys is generally greater than that of�+� and �-alloys. Moreover, they exhibit excellent formability (Wood 1972).But they have relatively high densities, are prone to ductile–brittle transition atlow temperatures and generally possess inferior creep resistance as compared to� and �+� alloys (Collings 1984, Froes et al. 1996).
The archetypical �-stabilizing and �-stabilizing alloying additions to Ti areAl and Mo, respectively. It is useful to be able to describe a multicomponentTi-based alloy in terms of its “equivalent” Al and Mo contents. The two pertinentexpressions often quoted in this context (Collings 1994) are:
Al�eq = Al�+ Zr�/3+ Sn�/3+10 O�
Mo�eq = Mo�+ Ta�/5+ Nb�/3 6+ W�/2 5++ V�/1 25+1 25 Cr�
+1 25 Ni�+1 7 Mn�+1 7 Co�+2 5 Fe�
where [X] indicates the concentration of the element X in weight per cent in thealloy. It can be seen that while Al and O are strong �-stabilizers, Sn and Zr arerelatively weak ones. It can also be seen that the efficacy of the transition elements

Elsevier UK Code: PTA Ch01-I042145 5-6-2007 9:27a.m. Page:23 Trim:165mm×240mm Integra, India
Font:Times F.Size:11/13pt Margins: Top:19mm Gutter:19mm Width:128mm Depth:40 Lines 1 Color Recto
Phases and Crystal Structures 23
with regard to the stabilization of the �-phase progressively increases in the order:Ta, Nb, W, V, Mo, Cr and Ni, Mn and Co, and Fe, the last being the strongest�-stabilizer.
It may be mentioned here that Ti can form extensive substitutional solid solutionswith most of the elements with atomic size factor within about 20% and this facthas opened up many alloying possibilities for exploitation.
Some examples of important commercial Ti base alloys are: Ti-5Al-2.5Sn(� alloys); Ti-8Al-1Mo-1V, Ti-6Al-2Sn-4Zr-2Mo (near � alloys); Ti-6Al-4V,Ti-6Al-2Sn-6V, Ti-3Al-2.5V (�+ � alloys); Ti-6Al-2Sn-4Zr-6Mo, Ti-5Al-2Sn-2Zr-4Cr-4Mo, Ti-3Al-10V-2Fe (near � alloys); Ti-13V-11Cr-3Al, Ti-15V-3Cr-3Al-3Sn, Ti-4Mo-8V-6Cr-4Zr-3Al, Ti-11.5Mo-6Zr-4.5Sn (� alloys).
1.4.4 Zirconium alloysUnlike Ti, Zr is not quite amenable to alloying. One of the reasons for this couldbe the relatively large size of the Zr atom. Most of the elements have very limitedsolubilities in �-Zr, with a few exceptions such as Ti, Hf, Sc and O. By comparison�-Zr is a much better solvent, but it is generally quite difficult to retain the �-phaseat room temperature in a metastable state by quenching (Froes et al. 1996). Theoccurrence of non-equilibrium phases in �-quenched Ti- and Zr-based alloys hasbeen dealt with in a later section.
According to the exhaustive compilation made by Douglass (1971), the retentionof the �-phase during quenching has been found to be feasible in the binary Zr–Mo,Zr–Cr, Zr–Nb, Zr–U, Zr–V and Zr–Re systems. The minimum concentrations ofalloying additions for complete retention of the �-phase in the first four systemsare 5 wt%, 7.2 wt%, 15 wt% and 20 wt% respectively. Retention of cent per cent�-phase is not possible in the systems Zr–V and Zr–Re; alloys containing themaximum amounts of V or Re in solution at quenching temperatures as highas 1573 K have been found to contain the -phase in addition to the �-phase(Petrova 1962). The retention of quite large volume fractions of a metastable,Zr-rich �1-phase has been observed in relatively solute-lean alloys (Zr-2.5 wt%Nb and Zr-5 wt% Ta) belonging to the monotectoid Zr–Nb (Banerjee et al. 1976,Menon et al. 1978) and Zr–Ta (Mukhopadhyay et al. 1978, Menon et al. 1979)systems.
The most common Zr alloys of commercial importance are the zircaloys, namelyzircaloy 2: Zr-1.5Sn-0.1Cr-0.1Fe-0.1Ni, Cr + Fe + Ni not to exceed 0.38 wt%;zircaloy 4: Zr-1.5Sn-0.15Cr- 0.15Fe, Cr + Fe not to exceed 0.3 wt% and theZr-2.5% Nb, Zr-1% Nb and Zr-2.5Nb-0.5Cu alloys. These alloys contain onlysmall amounts of �-stabilizing elements and are all basically �-alloys, with the�-phase as the predominant constituent phase.

Elsevier UK Code: PTA Ch01-I042145 5-6-2007 9:27a.m. Page:24 Trim:165mm×240mm Integra, India
Font:Times F.Size:11/13pt Margins: Top:19mm Gutter:19mm Width:128mm Depth:40 Lines 1 Color Recto
24 Phase Transformations: Titanium and Zirconium Alloys
1.4.5 Stability of titanium and zirconium alloysThe aspect of lattice stability or, in other words, of structural phase stability isan important issue with regard to pure metals like Ti and Zr and alloys based onthese. It has been stated in an earlier section that the crystal structures of the threelong periods of transition metals follow the sequence hcp → bcc → hcp → fcc asthe group number increases from 3 to 10 (3d: Sc to Ni; 4d: Y to Pd; 5d: Lu to Pt).It appears that there is a correlation between the crystal structure and the groupnumber in the case of the elemental transition metals and between the crystalstructure and the average group number or the electron to atom (e/a) ratio in thecase of alloys. The occurrence of correlations like this testifies to the fact that theelectronic structure is a key factor in determining phase stability. The e/a ratiois a parameter which relates to many properties of binary transition metal alloys,particularly Ti–X alloys, where X represents a transition metal (Collings 1984).A qualitatively similar situation is obtained with Zr–X alloys also. However, ageneral and comprehensive theoretical explanation rationalizing the correlationbetween phase stability and electron concentration (which is the same as or isclosely related to the e/a ratio) in the case of transition metal systems is still toevolve (Faulkner 1982).
The issue of the stability of equilibrium phases in Ti (and Zr) alloys can alsobe addressed by adopting a thermodynamic approach (Kaufman and Bernstein1970, Kaufman and Nesor 1973). In this approach, the energywise competitionbetween the relevant phases is duly considered while assessing phase stability inunalloyed metals as well as in alloys. This quantitative thermodynamic approachhas been used for the computation of phase diagrams pertaining to binary as wellas multicomponent systems.
It has been mentioned earlier in the context of Ti–X and Zr–X alloys that�-phase stabilizers are generally non-transition or simple metals, while �-phasestabilizers are generally transition metals and noble metals. Collings (1984) hasput forward a qualitative explanation, based on electron screening considerations,with regard to the phase stabilizing action of �-stabilizer and �-stabilizer solutes.This is outlined in the following paragraphs.
When a simple metal X is dissolved in Ti (or Zr), most of the electrons belongingto X atoms occupy states in the lower part of the band and only very few appear atthe Fermi level. The d-electrons belonging to the host (solvent) tend to avoid thesolute atoms and this leads to a dilution of the Ti (or Zr) sublattice. A consequenceof this is to emphasise any pre-existing Ti–Ti (or Zr–Zr) bond directionality andthereby to preserve the hcp structure characteristic of Ti (or Zr). As more and moreX atoms are added, the field of Ti- (or Zr)-like �-stability is ultimately terminated,generally by the appearance of an intermetallic phase of the stoichiometry Ti3X(or Zr3X), which is also based on or is closely related to the hcp structure.

Elsevier UK Code: PTA Ch01-I042145 5-6-2007 9:27a.m. Page:25 Trim:165mm×240mm Integra, India
Font:Times F.Size:11/13pt Margins: Top:19mm Gutter:19mm Width:128mm Depth:40 Lines 1 Color Recto
Phases and Crystal Structures 25
Coming next to the case of �-phase stabilization, one may first recall thatthe crystal structures of transition metals change from hcp to bcc as the e/aratio increases from 4 to 6. Collings (1984) has pointed out that it is possibleto rationalize this stabilization of the bcc structure within the framework of anelectron screening model which stipulates that a high concentration of conductionelectrons, by enhancing the screening of ion cores, may cause a symmetrical(i.e. cubic) crystal structure to be favoured. Thus an increase in the electrondensity (as in elements belonging to Groups 5 and 6) will tend to symmetrize thescreening, thereby enhancing the stability of the bcc structure. The fact that the sixd-transition metals belonging to Groups 3 and 4 undergo the hcp → bcc structuraltransformation at high temperatures indicates that symmetrization can also beaccomplished through lattice vibrations (Collings 1984). Given this background,one can see that the addition of transition metals belonging to Groups 5–10 to Tior Zr increases the electron density and as a consequence, stabilizes the bcc or�-phase. Thus, such elements are �-stabilizers. Ageev and Petrova (1970) havepointed out in the context of Ti alloys that the �-stabilization brought about bytransition metal solutes is more effective the farther they are from Ti in the periodictable and that for the retention of the �-phase during quenching from the �-phasefield, the nature and the concentration of the �-stabilizer has to be such that thevalue of the e/a ratio is at least 4.2.
In the context of the stability of bcc transition metals, it has been shown (Fisherand Dever 1970, Fisher 1975) that the magnitude of the elastic shear modulus C ′,defined as �C11 −C12�/2, can be used for comparing the stabilities of these metalsand their alloys. A cubic monocrystal is characterized by three fundamental stiff-ness moduli, C11�C44 and C12. The shear stiffness modulus, C ′, though made upof two fundamental moduli, is obtainable directly by experiment. The ultrasonicwaves needed for the measurement of these moduli are (Collings 1984): a longitu-dinal wave in a <100> direction for C11; a transverse wave in a <100> direction,polarized along <100> or a transverse wave in a <100> direction, polarizedalong <100> for C44; and the other transverse wave in a <100> direction,polarized along < 1̄10> for C′. Since C44 is governed by the transverse <100>wave, <100> polarized, and C ′ by the same wave, <1̄10> polarised, C ′ = C44 inan isotropic cubic material. Collings and Gegel (1973) have studied the variationof the parameter C ′ with the e/a ratio and have demonstrated that alloying Group4 elements with elements occurring to the right of them in the periodic tableenhances the stability of the bcc structure and that this effect is maximized at aboute/a= 6 (for the elements Cr, Mo and W). They have also found that C ′ almost van-ishes at e/a = 4 1 and that this value corresponds to the compositional thresholdfor martensitic transformation. In an anisotropic cubic material, the extent of thedeparture from isotropy is indicated by the value of the so called Zener anisotropy

Elsevier UK Code: PTA Ch01-I042145 5-6-2007 9:27a.m. Page:26 Trim:165mm×240mm Integra, India
Font:Times F.Size:11/13pt Margins: Top:19mm Gutter:19mm Width:128mm Depth:40 Lines 1 Color Recto
26 Phase Transformations: Titanium and Zirconium Alloys
ratio, A = C44/C′. While in simple bcc metals like Na, the values of A are quite
large, these can be quite low for bcc transition metals; for example, for the Group 6metals Cr, Mo and W, the values of A are 0.71, 0.72 and 1.01, respectively (Fisher1975). Fisher (1975) has also pointed out that while the C44 shears are resistedprimarily by nearest neighbour repulsion, the C ′ shear depends mainly on the nextnearest neighbour forces. The large values of C ′ for bcc transition elements arethought to be a consequence of the cohesive contributions of the d-electrons. Theparameter C ′ appears to be interpretable as a bcc stability parameter. Thus, forthe highly stable bcc transition metals of Group 6, C ′ is about 1 5 × 10¹¹ N/m2
but its values decrease rapidly with decreasing e/a ratio, approaching zero at roomtemperature for alloys which exhibit -phase instabilities or under a martensitictransformation at ordinary temperatures (Collings and Gegel 1973).
When Ti (or Zr) is alloyed with transition metals of higher group numbers, theincreasing stability of the �-phase is reflected in a continuous lowering of the�/��+�� transus temperature. It is mentioned later in this chapter that in the caseof �-stabilized binary Ti alloys, two types of phase diagrams are encountered:�-isomorphous and �-eutectoid. Collings (1984) has pointed out that a generaltrend is that as the group number of the solute increases, there is a tendency forthe phase diagram to change from the former to the latter type.
1.5 BINARY PHASE DIAGRAMS
1.5.1 Introductory remarksBinary Ti–X and Zr–X (X being any element other than Ti and Zr, respectively)phase diagrams exhibit multifarious forms and reflect various kinds of phasereactions. The equilibrium phases are the �- and �-phases and numerous inter-metallic phases. These are the phases that are shown in the equilibrium phasediagrams. However, many non-equilibrium phases such as the martensite phase(hcp and orthorhombic), the -phase and a large number of metastable intermetal-lic phases also occur in binary Ti and Zr base alloys. Some of these will be coveredin detail in the succeeding chapters.
There have been many attempts to categorize Ti and Zr alloy phase diagrams,taking cognizance of the fact that basically there are two types of systems, namely�-stabilized and �-stabilized systems. As mentioned earlier, in the former caseX is usually a non-transition or simple metal, while in the latter X is usually atransition or a noble metal. It has been suggested in the context of Ti–X systemsthat the regular solution thermodynamic interaction parameter, �ij , is positive for�-stabilized alloys, indicating a clustering tendency, and negative for �-stabilizedalloys, indicating an ordering tendency (Collings and Gegel 1975).

Elsevier UK Code: PTA Ch01-I042145 5-6-2007 9:27a.m. Page:27 Trim:165mm×240mm Integra, India
Font:Times F.Size:11/13pt Margins: Top:19mm Gutter:19mm Width:128mm Depth:40 Lines 1 Color Recto
Phases and Crystal Structures 27
For a given element X, the differences in the nature of the binary Ti–X andZr–X equilibrium phase diagrams generally arise from the relative inefficiency of�-Zr and �-Zr with regard to taking X in solid solution as compared to �-Ti and�-Ti, particularly when X is a substitutional element.
1.5.2 Ti–X systemsMargolin and Nielsen (1960) have suggested that �-stabilized Ti–X systems canbe basically subdivided into three classes: (a) �–�-isomorphous systems whereX is completely soluble in the �- as well as �-phases (e.g. Ti–Zr, Ti–Hf);(b) �-isomorphous systems where X is completely soluble in the �-phase andhas limited solubility in the �-phase (e.g. Ti–V, Ti–Mo) and (c) �-eutectoidsystems where X has a limited solubility in the �-phase which decomposes eutec-toidally into the �-phase and an appropriate intermetallic phase, TimXn, on cool-ing. Depending on the kinetics of �-phase decomposition, this class is furthersubdivisible into “active” (rapid, e.g. Ti–Cu, Ti–Ni) and “sluggish” (e.g. Ti–Cr,Ti–Mn) eutectoid systems. They have also suggested that �-stabilized Ti–X sys-tems can be subdivided into two categories, depending on the degree of �-phasestabilization: (a) systems exhibiting a “limited” degree of �-stability, where the�-phase is related to the �- and an appropriate intermetallic phase by a peritec-toid reaction (e.g. Ti–B, Ti–Al); and (b) systems characterized by a “complete�-phase stability” where the �-phase can coexist with the liquid phase (e.g. Ti–N,Ti–O).
An exhaustive classification scheme for binary Ti–X phase diagrams has sub-sequently been suggested by Molchanova (1965) who has classified the availableequilibrium phase diagrams into three broad groups, each of which contains a fewsubgroups. This classification, as reported by Collings (1984), is shown below:
Group I: Systems where X shows continuous solid solubility in the �-phaseSubgroup I (a): Complete solubility in the �-phase (X: Zr, Hf)Subgroup I (b): Partial solubility in the �-phase (X: V, Nb, Ta, Mo)Subgroup I (c): Partial solubility in the �-phase and eutectoid decomposition
of the �-phase (X: Cr, U)Group II: Eutectic systemsSubgroup II (a): Partial solid solubility in the �- and �-phases; eutectoid decom-
position of the �-phase (X: H, Cu, Ag, Au, Be, Si, Sn, Bi, Mn, Fe, Co, Ni,Pd, Pt)
Subgroup II (b): Partial solid solubility in the �- and �-phases; peritectoid �–�transformation (X: B, Sc, Ga, La, Ce, Nd, Gd, Ge)
Subgroup II (c): Extremely limited solid solubility in the �- and �-phases(X: Y, Th)

Elsevier UK Code: PTA Ch01-I042145 5-6-2007 9:27a.m. Page:28 Trim:165mm×240mm Integra, India
Font:Times F.Size:11/13pt Margins: Top:19mm Gutter:19mm Width:128mm Depth:40 Lines 1 Color Recto
28 Phase Transformations: Titanium and Zirconium Alloys
Group III: Peritectic systemsSubgroup III (a): Simple peritectic (X: N, O)Subgroup III (b): Partial solid solubility in the �- and �-phases (X: Re)Subgroup III (c): Partial solid solubility in the �- and �-phases; eutectoid
decomposition of the �-phase (X: Pb, W)Subgroup III (d): Partial solid solubility in the �- and �-phases; peritectoid �–�
transformation (X: Al, C).
In a simpler classification, Molchanova (1965) has suggested that binary Ti–Xequilibrium phase diagrams can be divided into four categories: �-isomorphous(including �–� isomorphous), comprising subgroups I (a), I (b) and III (b);�-eutectoid, comprising subgroups I (c), II (a) and III (c); simple peritectic, com-prising subgroup III (a); and �-peritectoid, comprising subgroups II (b) and III (d).This classification scheme is shown in Figure 1.5 in which the legends �, � and �stand for the�-phase, the�-phase and the pertinent intermetallic phase, respectively.
LL + β L + α
L + β
L + γL + β
L + γ
β + γ
α + γα + γ α + γ
β + γ
L +
β
Ti
Tem
pera
ture
Binary Ti alloys
β-stabilized
β-eutectoid β-peritectoidβ-isomorphous
α-stabilized
Simpleperitectic
SolutesN,O
SolutesB,Sc,Ga,La
Ca,Gd,Nd,GeAl,C
SolutesV,Zr,Nb,Mo,
Hf,Ta,Re
SolutesCr,Mn,Fe,Co,Ni,Cu
Pd,Ag,W,Pt,AuH,Be,Si,Sn,Pb,Bi,U
L LL
Ti Ti Ti
Solute content
ββ β β
α +
β
α +
β
β + α
β + αα
α
α
α
Figure 1.5. A classification scheme for binary Ti–X equilibrium phase diagrams. The legends ���and � stand, respectively, for the �-phase, the �-phase and the pertinent intermetallic phase.

Elsevier UK Code: PTA Ch01-I042145 5-6-2007 9:27a.m. Page:29 Trim:165mm×240mm Integra, India
Font:Times F.Size:11/13pt Margins: Top:19mm Gutter:19mm Width:128mm Depth:40 Lines 1 Color Recto
Phases and Crystal Structures 29
It is to be noted that quite a few Ti–X systems, designated earlier as�-isomorphous systems, are not so in reality (Massalski et al. 1992). Below atransus delineating the upper boundary of a region referred to as a “miscibilitygap”, a homogeneous, single-phase �-solid solution decomposes into a thermo-dynamically stable aggregate of two bcc phases, one Ti-rich (�1) and the othersolute-rich ��2� � � → �1 +�2. The former participates in a monotectoid reaction:�1 → �+�2, the monotectoid temperature and composition varying from systemto system. Examples of Ti–X systems where such a monotectoid reaction occursinclude Ti–V, Ti–Mo, Ti–Nb and Ti–W.
1.5.3 Zr–X systemsIt has been pointed out earlier that inspite of the similarity in the electronic andcrystal structures of Ti and Zr (both of these transition metals belong to Group 4of the periodic table of elements), the alloying behaviour of these elements exhibitnoteworthy differences, largely due to the size factor. While one encounters the�–� isomorphous, �-eutectoid and �-stabilized types of equilibrium diagrams inZr–X systems, �-isomorphous type phase diagrams do not occur in these alloys.Alloying elements, X, which give rise to �-isomorphous equilibrium phase dia-grams with Ti, yield either �-eutectoid (e.g. X: V, Mo, Re) or �-monotectoid (e.g.X: Nb, Ta) types of equilibrium diagrams with Zr.
For a Pauling valence of 4, the second Brillouin zone is the one most nearlyfilled for both the �- and �-phases in the case of Zr. This zone for �-Zr is boundedby the
{101̄2
}and
{112̄0
}planes and has a volume of 3.6 electrons per atom;
the excess electrons, 0.4 per atom, overlap into the third zone on the{101̄2
}side
of the second zone (Luke et al. 1965). The second Brillouin zone for the �-phaseis bounded by �200� and �211� planes and has a volume of eight electrons peratom. The inscribed Fermi sphere accommodates 4.19 electrons per atom and doesnot touch the zone boundaries. The larger volume of the �-phase second zone incomparison with the �-phase zone implies that the �-structure can accommodatemore electrons and thus the solubility of some transition elements is greater in the�- phase than in the �-phase.
1.5.4 Representative examples of Ti–X and Zr–X phase diagramsIn this section representative examples of a few types of Ti–X and Zr–X binaryequilibrium phase diagrams will be introduced: Ti–Zr, Ti–Mo, Ti–V, Ti–Cr, Ti–Al,Zr–Nb, Zr–Fe, Zr–Sn, Zr–Al, Ti–N,Zr–H and Zr–O. The phase diagrams presentedhere are based on those appearing in Massalski et al. (1992). Subsequent updateshave been published in respect of some of these binary systems. These updateshave been referred to at appropriate places.

Elsevier UK Code: PTA Ch01-I042145 5-6-2007 9:27a.m. Page:30 Trim:165mm×240mm Integra, India
Font:Times F.Size:11/13pt Margins: Top:19mm Gutter:19mm Width:128mm Depth:40 Lines 1 Color Recto
30 Phase Transformations: Titanium and Zirconium Alloys
The Ti–Zr system is an example of an �–� isomorphous system, while Ti–Moand Ti–V constitute important examples of so called �-isomorphous systems andform the basis of several commercial � and �+� alloys. The Ti–Cr system is a typ-ical �-eutectoid system, while the �-stabilizer related Ti–Al system is pertinent toseveral technical � and �+� alloys. The Zr–Nb system, which relates to the impor-tant family of commercial Zr–Nb alloys, is a �-monotectoid system. The Zr–Fephase diagram exemplifies a �-eutectoid system. The Zr–Sn and Zr–Al systemsexhibit �-phase stabilization. The former is very relevant with regard to importanttechnical Zr alloys such as zircaloys, while the latter is germane to the Zr3Al inter-metallic phase which has been considered as a potential nuclear reactor structuralmaterial. In all these cases, X is a substitutional solute. In the Ti–N, Zr–H and Zr–Osystems, all of which are of technological importance, X is an interstitial solute.
The Ti–Zr system (Figure 1.6) appears to be a truly isomorphous system, thoughperhaps not as close to an “ideal solution” situation as the Zr–Hf system. Theequilibrium phases occurring in the Ti–Zr system are the liquid (L), ��Ti�Zr�,��Ti�Zr�, �-Ti, �-Ti, �-Zr and �-Zr. Apart from these, the metastable �′ (marten-site) and -phases are also encountered. The special points of the Ti–Zr systemare listed in Table 1.7 (Murray 1987, Massalski et al. 1992.)
2128 K
L
1813 K
1943 K
1155 K
~878 K
1136 K
100 20 30 40 50 60 70 80 90 100
Weight per cent Zr
2270
2070
1870
1670
1470
1270
1070
870
670
Tem
pera
ture
(K
)
0 10 20 30 40 50 60 70 80 90 100
Ti Atom per cent Zr Zr
(β-Ti, β-Zr)
(α-Ti, α-Zr)
Figure 1.6. Equilibrium phase diagram for the Ti–Zr system.

Elsevier UK Code: PTA Ch01-I042145 5-6-2007 9:27a.m. Page:31 Trim:165mm×240mm Integra, India
Font:Times F.Size:11/13pt Margins: Top:19mm Gutter:19mm Width:128mm Depth:40 Lines 1 Color Recto
Phases and Crystal Structures 31
Table 1.7. Special points of the Ti–Zr system.
Phase reaction Type of reaction Temperature (K) Composition (at.% Zr)
L� ��Ti� �Zr� Congruent 1813±15 38±2L� �Ti Melting 1943 0L� �Zr Melting 2128 100��Ti� �Zr�� ��Ti��Zr� Congruent 878±10 52±2�Ti� �Ti Allotropic 1155 0�Zr� �Zr Allotropic 1136 100
~1123 K
~968 K
1155 K
~12
1943 K
L
2896 K
100 20 30 40 50 60 70 80 90 100
Weight per cent Mo
2870
2670
2470
2270
2070
1870
1670
1470
1270
1070
870
670
Tem
pera
ture
(K
)
0 10 20 30 40 50 60 70 80 90 100
Ti Atom per cent Mo Mo
(β-Ti, Mo)
(α-Ti)
Figure 1.7. Equilibrium phase diagram for the Ti–Mo system.
In the Ti–Mo system (Figure 1.7), the equilibrium solid phases that are encoun-tered are: the bcc (�-Ti, Mo) solid solution, in which Ti and Mo are com-pletely miscible above the allotropic transformation temperature of Ti (1155 K),the hcp �-Ti (Mo) solid solution in which the solubility of Mo is restricted(maximum of about 0.4 at.%), �-Ti, �-Ti and Mo. This system exhibits a mis-cibility gap in (�-Ti, Mo) and a monotectoid reaction: ��-Ti) � (�-Ti) + (Mo)(Terauchi et al. 1978), the monotectoid temperature being about 968 K. Themetastable martensite (hcp �′ and orthorhombic �′′) and -phases also occur in
Elsevier UK Code: PTA Ch01-I042145 5-6-2007 9:27a.m. Page:32 Trim:165mm×240mm Integra, India
Font:Times F.Size:11/13pt Margins: Top:19mm Gutter:19mm Width:128mm Depth:40 Lines 1 Color Recto
32 Phase Transformations: Titanium and Zirconium Alloys
Table 1.8. Special points of the Ti–Mo system.
Phase reaction Type of reaction Temperature (K) Composition (at.% Mo)
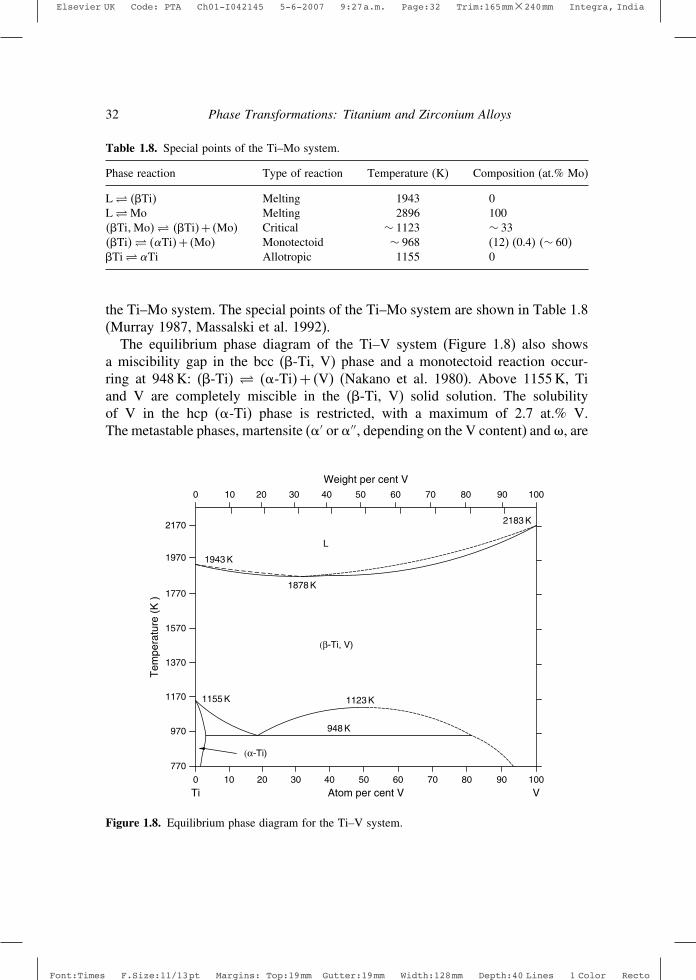
L� ��Ti� Melting 1943 0L�Mo Melting 2896 100��Ti�Mo�� ��Ti�+ �Mo� Critical ∼ 1123 ∼ 33��Ti�� ��Ti�+ �Mo� Monotectoid ∼ 968 (12) (0.4) �∼ 60��Ti� �Ti Allotropic 1155 0
the Ti–Mo system. The special points of the Ti–Mo system are shown in Table 1.8(Murray 1987, Massalski et al. 1992).
The equilibrium phase diagram of the Ti–V system (Figure 1.8) also showsa miscibility gap in the bcc (�-Ti, V) phase and a monotectoid reaction occur-ring at 948 K: (�-Ti) � (�-Ti) + (V) (Nakano et al. 1980). Above 1155 K, Tiand V are completely miscible in the (�-Ti, V) solid solution. The solubilityof V in the hcp (�-Ti) phase is restricted, with a maximum of 2.7 at.% V.The metastable phases, martensite (�′ or �′′, depending on the V content) and , are
1155 K
948 K
1123 K
1943 K
1878 K
2183 K
L
100 20 30 40 50 60 70 80 90 100
Weight per cent V
2170
1970
1770
1570
1370
1170
970
770
Tem
pera
ture
(K
)
0 10 20 30 40 50 60 70 80 90 100
Ti Atom per cent V V
(β-Ti, V)
(α-Ti)
Figure 1.8. Equilibrium phase diagram for the Ti–V system.

Elsevier UK Code: PTA Ch01-I042145 5-6-2007 9:27a.m. Page:33 Trim:165mm×240mm Integra, India
Font:Times F.Size:11/13pt Margins: Top:19mm Gutter:19mm Width:128mm Depth:40 Lines 1 Color Recto
Phases and Crystal Structures 33
Table 1.9. Special points of the Ti–V system.
Phase reaction Type of reaction Temperature (K) Composition (at.% V)
L� ��Ti�V� Congruent 1878 32L� �Ti Melting 1943 0L� V Melting 2183 100��Ti�V�� ��Ti�+ �V� Critical 1123 ∼ 50��Ti�� ��Ti�+ �V� Monotectoid 948 (18) (2.7) (∼ 80)�Ti� �Ti Allotropic 1155 0
also encountered in this system. The special points pertinent to the Ti–V system arelisted in Table 1.9 (Murray 1987, Massalski et al. 1992). Subsequently, an updatehas been published by Okamoto (1993a) with regard to the Ti–V phase diagram.
Figure 1.9 shows the Ti–Cr equilibrium phase diagram. The equilibrium con-densed phases encountered are the liquid (L), the bcc (�-Ti, Cr) solid solution,the hcp (�-Ti) solid solution, the topologically close packed intermetallic phases�-TiCr2, �-TiCr2 and �-TiCr2, and, of course, �-Ti, �-Ti and Cr. In a narrow tem-perature range below the congruent melting temperature, Ti and Cr are completely
100 20 30 40 50 60 70 80 90 100
Weight per cent Cr
2270
2070
1870
1670
1470
1270
1070
870
Tem
pera
ture
(K
)
0 10 20 30 40 50 60 70 80 90 100
Ti Atom per cent Cr Cr
L
1683 K
1943 K
1155 K
940 K
1643 K
~1543 K
~1493 K
~1073 K
(β -Ti, Cr)
(α -Ti)
γ-TiCr2
β -TiCr2
α -TiCr2
2136 K
Figure 1.9. Equilibrium phase diagram for the Ti–Cr system.

Elsevier UK Code: PTA Ch01-I042145 5-6-2007 9:27a.m. Page:34 Trim:165mm×240mm Integra, India
Font:Times F.Size:11/13pt Margins: Top:19mm Gutter:19mm Width:128mm Depth:40 Lines 1 Color Recto
34 Phase Transformations: Titanium and Zirconium Alloys
Table 1.10. Special points of the Ti–Cr system.
Phase reaction Type of reaction Temperature (K) Composition (at.% Cr)
L� ��Ti�Cr� Congruent 1683±5 44L� �Ti Melting 1943 0L� Cr Melting 2136±20 100��Ti�� �TiCr2 Congruent 1643±10 ∼ 66��Ti�� ��Ti�+�TiCr2 Eutectoid 940±10 (12 5±0 5) (0.6) (∼ 63)��Ti�+�TiCr2 � �TiCr2 Peritectoid ∼ 1493 (39) (∼ 63)(∼ 65)�TiCr2 � �TiCr2 Unknown ∼ 1543 ∼ 65 to 66�TiCr2 � �TiCr2 +Cr Eutectoid ∼ 1073 (∼ 65) (∼ 66) (96)�Ti� �Ti Allotropic 1155 0
miscible in the (�-Ti, Cr) phase. The maximum solubility of Cr in the (�-Ti) phaseis 0.6 at.%. The martensitic �′ and the -phase also form in this system. Thespecial points germane to the Ti-Cr system are presented in Table 1.10 (Murray1987, Massalski et al. 1992).
In the Ti–Al equilibrium phase diagram, (Figure 1.10), the solid phases thatappear are: the bcc (�-Ti) and the hcp (�-Ti) solid solutions, the ordered inter-metallic phases, Ti3Al (also referred to as �2), TiAl (also referred to as �), TiAl,
1970
1770
1570
1370
1170
970
770
Tem
pera
ture
(K
)
1943 K
1155 K
~1558 K
~1398 K
Ti3Al
TiAl
(Al)
938 K933 K
TiAl3
TiAl2
α-TiAl3
L
δ
100 20 30 40 50 60 70 80 90 100
Weight per cent Al
0 10 20 30 40 50 60 70 80 90 100
Ti Atom per cent Al Al
(β-Ti)
(α-Ti)
Figure 1.10. Equilibrium phase diagram for the Ti–Al system.
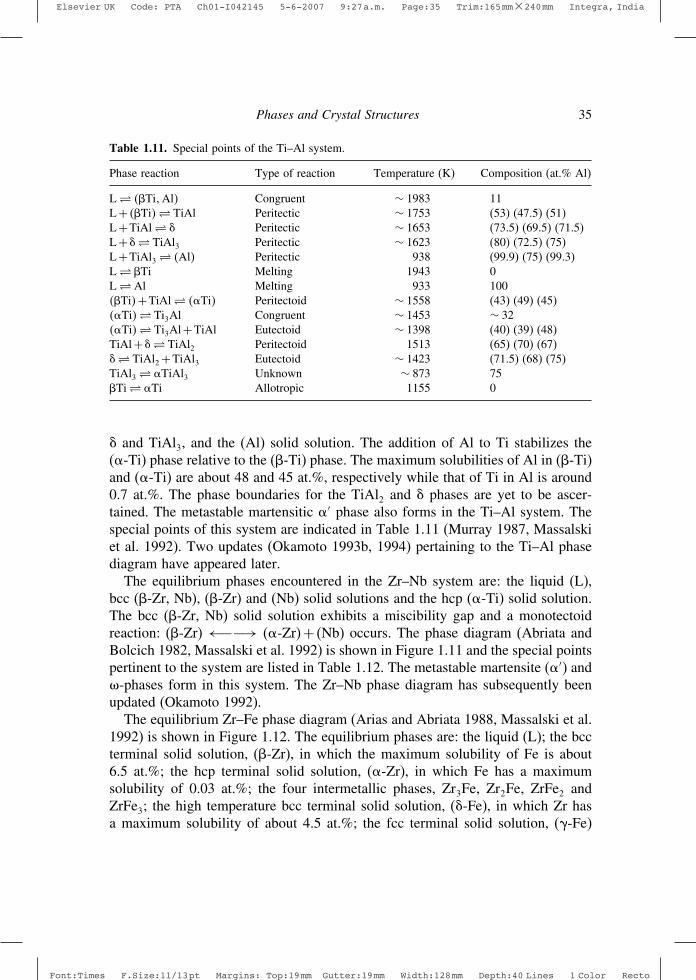
Elsevier UK Code: PTA Ch01-I042145 5-6-2007 9:27a.m. Page:35 Trim:165mm×240mm Integra, India
Font:Times F.Size:11/13pt Margins: Top:19mm Gutter:19mm Width:128mm Depth:40 Lines 1 Color Recto
Phases and Crystal Structures 35
Table 1.11. Special points of the Ti–Al system.
Phase reaction Type of reaction Temperature (K) Composition (at.% Al)
L� ��Ti�Al� Congruent ∼ 1983 11L + ��Ti�� TiAl Peritectic ∼ 1753 (53) (47.5) (51)L +TiAl� � Peritectic ∼ 1653 (73.5) (69.5) (71.5)L +�� TiAl3 Peritectic ∼ 1623 (80) (72.5) (75)L +TiAl3 � �Al� Peritectic 938 (99.9) (75) (99.3)L� �Ti Melting 1943 0L� Al Melting 933 100��Ti�+TiAl� ��Ti� Peritectoid ∼ 1558 (43) (49) (45)��Ti�� Ti3Al Congruent ∼ 1453 ∼ 32��Ti�� Ti3Al +TiAl Eutectoid ∼ 1398 (40) (39) (48)TiAl +�� TiAl2 Peritectoid 1513 (65) (70) (67)�� TiAl2 +TiAl3 Eutectoid ∼ 1423 (71.5) (68) (75)TiAl3 � �TiAl3 Unknown ∼ 873 75�Ti� �Ti Allotropic 1155 0
� and TiAl3, and the (Al) solid solution. The addition of Al to Ti stabilizes the(�-Ti) phase relative to the (�-Ti) phase. The maximum solubilities of Al in (�-Ti)and (�-Ti) are about 48 and 45 at.%, respectively while that of Ti in Al is around0.7 at.%. The phase boundaries for the TiAl2 and � phases are yet to be ascer-tained. The metastable martensitic �′ phase also forms in the Ti–Al system. Thespecial points of this system are indicated in Table 1.11 (Murray 1987, Massalskiet al. 1992). Two updates (Okamoto 1993b, 1994) pertaining to the Ti–Al phasediagram have appeared later.
The equilibrium phases encountered in the Zr–Nb system are: the liquid (L),bcc (�-Zr, Nb), (�-Zr) and (Nb) solid solutions and the hcp (�-Ti) solid solution.The bcc (�-Zr, Nb) solid solution exhibits a miscibility gap and a monotectoidreaction: (�-Zr) ←−−→ (�-Zr) + (Nb) occurs. The phase diagram (Abriata andBolcich 1982, Massalski et al. 1992) is shown in Figure 1.11 and the special pointspertinent to the system are listed in Table 1.12. The metastable martensite (�′) and-phases form in this system. The Zr–Nb phase diagram has subsequently beenupdated (Okamoto 1992).
The equilibrium Zr–Fe phase diagram (Arias and Abriata 1988, Massalski et al.1992) is shown in Figure 1.12. The equilibrium phases are: the liquid (L); the bccterminal solid solution, (�-Zr), in which the maximum solubility of Fe is about6.5 at.%; the hcp terminal solid solution, (�-Zr), in which Fe has a maximumsolubility of 0.03 at.%; the four intermetallic phases, Zr3Fe, Zr2Fe, ZrFe2 andZrFe3; the high temperature bcc terminal solid solution, (�-Fe), in which Zr hasa maximum solubility of about 4.5 at.%; the fcc terminal solid solution, (�-Fe)
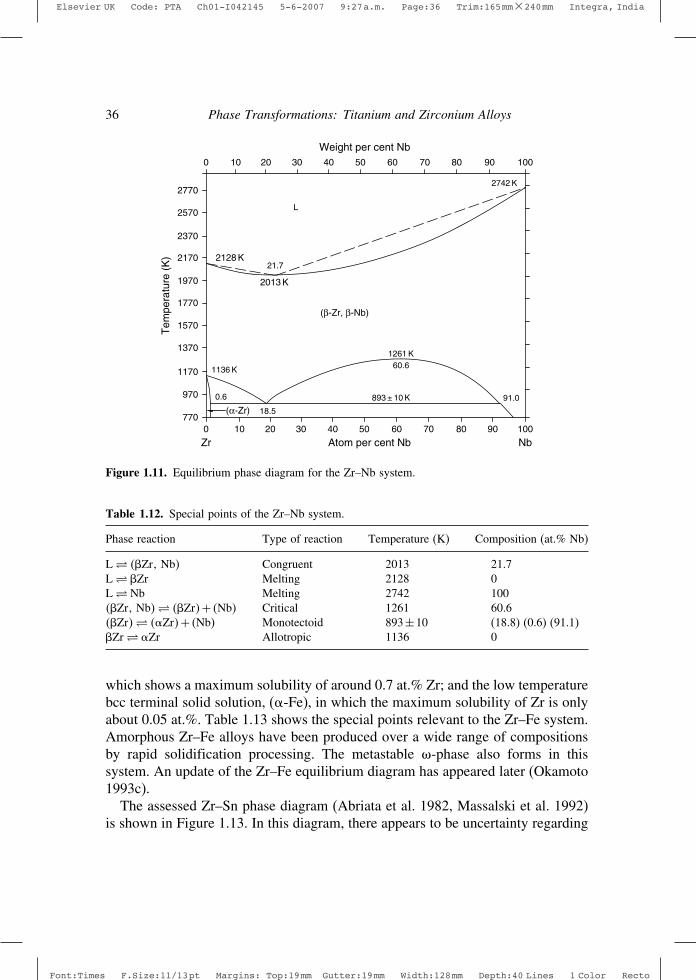
Elsevier UK Code: PTA Ch01-I042145 5-6-2007 9:27a.m. Page:36 Trim:165mm×240mm Integra, India
Font:Times F.Size:11/13pt Margins: Top:19mm Gutter:19mm Width:128mm Depth:40 Lines 1 Color Recto
36 Phase Transformations: Titanium and Zirconium Alloys
91.0
2128 K
1136 K
0.6
18.5
893 ± 10 K
60.61261 K
21.7
2013 K
2742 K
L
100 20 30 40 50 60 70 80 90 100
Weight per cent Nb
2770
2570
2370
2170
1970
1770
1570
1370
1170
970
770
Tem
pera
ture
(K
)
0 10 20 30 40 50 60 70 80 90 100
Zr Atom per cent Nb Nb
(β-Zr, β-Nb)
(α-Zr)
Figure 1.11. Equilibrium phase diagram for the Zr–Nb system.
Table 1.12. Special points of the Zr–Nb system.
Phase reaction Type of reaction Temperature (K) Composition (at.% Nb)
L� ��Zr� Nb� Congruent 2013 21.7L� �Zr Melting 2128 0L� Nb Melting 2742 100��Zr� Nb�� ��Zr�+ �Nb� Critical 1261 60.6��Zr�� ��Zr�+ �Nb) Monotectoid 893±10 (18.8) (0.6) (91.1)�Zr� �Zr Allotropic 1136 0
which shows a maximum solubility of around 0.7 at.% Zr; and the low temperaturebcc terminal solid solution, (�-Fe), in which the maximum solubility of Zr is onlyabout 0.05 at.%. Table 1.13 shows the special points relevant to the Zr–Fe system.Amorphous Zr–Fe alloys have been produced over a wide range of compositionsby rapid solidification processing. The metastable -phase also forms in thissystem. An update of the Zr–Fe equilibrium diagram has appeared later (Okamoto1993c).
The assessed Zr–Sn phase diagram (Abriata et al. 1982, Massalski et al. 1992)is shown in Figure 1.13. In this diagram, there appears to be uncertainty regarding

Elsevier UK Code: PTA Ch01-I042145 5-6-2007 9:27a.m. Page:37 Trim:165mm×240mm Integra, India
Font:Times F.Size:11/13pt Margins: Top:19mm Gutter:19mm Width:128mm Depth:40 Lines 1 Color Recto
Phases and Crystal Structures 37
1009080706050403020100
Weight per cent Fe
100 20 30 40 50 60 70 80 90 100
Zr Atom per cent Fe Fe
270
470
670
870
1070
1270
1470
1670
1870
2070
2270
Tem
pera
ture
(K
)
(α-Zr)
4.00.03
~573 K
1003 K
~6.51201 K
1158 K~24.0
1048 K
1946 K66.7
1755 K
1610 K
1811 K
1667 K90.2 ~99.3
1630 K(γ-Fe)
1198 K 1185 K~99.91043 K
Magnetic trans
ZrFe3
(α-Fe)
Magnetic trans~548 K
1247 K
Lδ Fe
ZrFe2
(β-Zr)
Zr3Fe
Zr2Fe
2128 K
~95.5
Magn
trans
Figure 1.12. Equilibrium phase diagram for the Zr–Fe system.
Table 1.13. Special points of the Zr–Fe system.
Phase reaction Type of reaction Temperature (K) Composition (at.% Fe)
L� �Zr Melting 2128 0L� ��Zr�+Zr2Fe Eutectic 1201 �∼ 24� �∼ 6 5� �31�L� ZrFe2 Congruent 1946 66.7L� ZrFe3 + ��Fe� Eutectic 1610 (90.2) (75) (∼ 99 3)L� �Fe Melting 1811 100L +ZrFe2 � Zr2Fe Peritectic 1247 (∼ 25) (66) (33.3)L +ZrFe2 � ZrFe3 Peritectic 1755 (86.7) (∼ 72 5) (75)��Fe�� L + ��Fe� Catatectic 1630 (∼ 95 5) (90.8) (∼ 99 3)�Zr� �Zr Allotropic 1136 0��Zr�� ��Zr�+Zr3Fe Eutectoid 1003 (4) (0.03) (24)��Zr�+Zr2Fe� Zr3Fe Peritectoid 1158 (∼ 6) (31) (∼ 25)Zr2Fe� Zr3Fe +ZrFe2 Eutectoid 1048 (33.3) (26.8) (66)ZrFe3 + ��Fe�� ��Fe� Peritectoid 1198 (75) (?) (∼ 99 95)�Fe� �Fe Allotropic 1667 100�Fe� �Fe Allotropic 1185 100
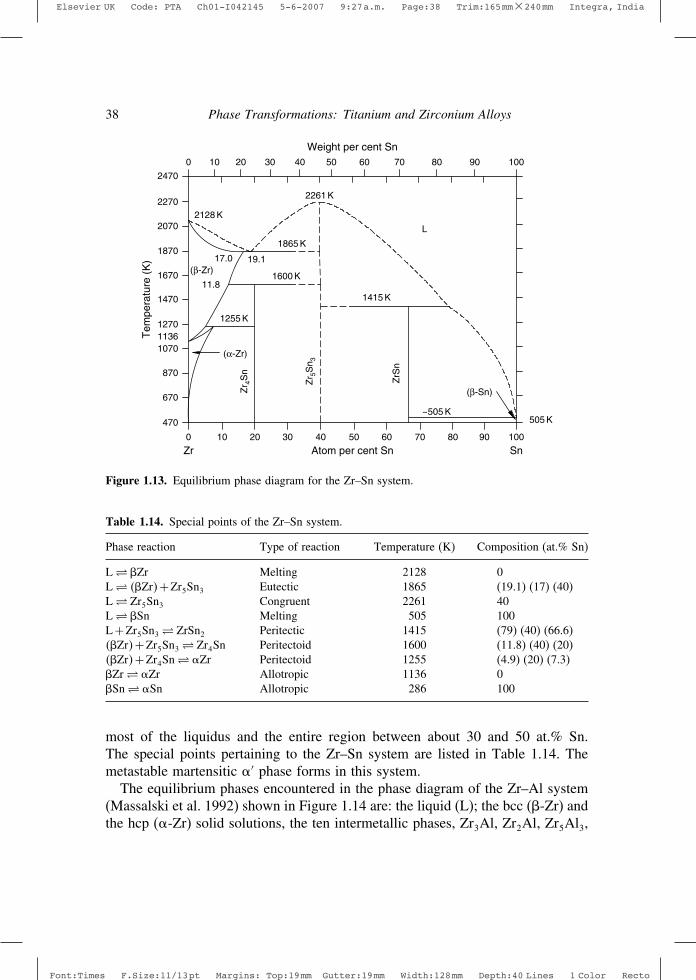
Elsevier UK Code: PTA Ch01-I042145 5-6-2007 9:27a.m. Page:38 Trim:165mm×240mm Integra, India
Font:Times F.Size:11/13pt Margins: Top:19mm Gutter:19mm Width:128mm Depth:40 Lines 1 Color Recto
38 Phase Transformations: Titanium and Zirconium Alloys
2128 K
2261 K
1865 K
1600 K
1415 K
1255 K
11.8
17.0 19.1
~505 K505 K
Zr 4
Sn
Zr 5
Sn 3
ZrS
n
L
100 20 30 40 50 60 70 80 90 100
Weight per cent Sn
2470
2270
2070
1870
1670
1470
11361270
1070
870
670
470
Tem
pera
ture
(K
)
0 10 20 30 40 50 60 70 80 90 100
Zr Atom per cent Sn Sn
(β-Zr)
(β-Sn)
(α-Zr)
Figure 1.13. Equilibrium phase diagram for the Zr–Sn system.
Table 1.14. Special points of the Zr–Sn system.
Phase reaction Type of reaction Temperature (K) Composition (at.% Sn)
L� �Zr Melting 2128 0L� ��Zr�+Zr5Sn3 Eutectic 1865 (19.1) (17) (40)L� Zr5Sn3 Congruent 2261 40L� �Sn Melting 505 100L +Zr5Sn3 � ZrSn2 Peritectic 1415 (79) (40) (66.6)��Zr�+Zr5Sn3 � Zr4Sn Peritectoid 1600 (11.8) (40) (20)��Zr�+Zr4Sn� �Zr Peritectoid 1255 (4.9) (20) (7.3)�Zr� �Zr Allotropic 1136 0�Sn� �Sn Allotropic 286 100
most of the liquidus and the entire region between about 30 and 50 at.% Sn.The special points pertaining to the Zr–Sn system are listed in Table 1.14. Themetastable martensitic �′ phase forms in this system.
The equilibrium phases encountered in the phase diagram of the Zr–Al system(Massalski et al. 1992) shown in Figure 1.14 are: the liquid (L); the bcc (�-Zr) andthe hcp (�-Zr) solid solutions, the ten intermetallic phases, Zr3Al, Zr2Al, Zr5Al3,

Elsevier UK Code: PTA Ch01-I042145 5-6-2007 9:27a.m. Page:39 Trim:165mm×240mm Integra, India
Font:Times F.Size:11/13pt Margins: Top:19mm Gutter:19mm Width:128mm Depth:40 Lines 1 Color Recto
Phases and Crystal Structures 39
26
22.5
10080706050403020100
0 10 20 30 40 50 60 70 80 90 100
Zr Atom per cent Al Al
934 K(Al)
870
1070
1270
1470
1670
1870
2070
2270Te
mpe
ratu
re (
K)
Weight per cent Al
L
1853 K1918 K
1863
K
1463
K
1758 K
1803 K1668 K
29.5
37
3949
1753 K
1548 K1623 K
1523 K
1261 K12.5
11.5
1213 K1136
(α-Zr)
(β-Zr)
2128
ZrA
l 3
Zr 3
Al
Zr 2
Al
Zr 3
Al 2
Zr 4
Al 3
Zr 2
Al 3Z
rAl
ZrA
l 2
59
73.5
Zr 5
Al 3
Zr 5
Al 4
Figure 1.14. Equilibrium phase diagram for the Zr–Al system.
Zr3Al2, Zr4Al3, Zr5Al4, ZrAl, Zr2Al3, ZrAl2 and ZrAl3, and the fcc (Al) solidsolution in which the maximum solubility of Zr is about 0.07 at.%. The addition ofAl stabilizes (�-Zr) relative to (�-Zr) and the maximum solubilities of Al in thesetwo phases are about 11.5 and 26 at.%, respectively. The special points of the Zr–Al system are shown in Table 1.15. Subsequently, three updates in respect of theZr–Al phase diagram have appeared (Murray et al. 1992, Okamoto 1993d, 2002).
The equilibrium condensed phases that occur in the binary Ti–N system are: theliquid (L), the terminal bcc solid solution (�-Ti), the terminal hcp solid solution(�-Ti), and the three stable nitride phases, Ti2N, TiN and �′. Both the terminal solidsolutions have wide ranges of composition. The dissolved N (�-stabilizer) extendsthe stability regime of the �-Ti phase to a temperature (2623 K) much abovethe melting point of elemental �-Ti. Two of the nitride phases, Ti2N and �′, arestable over narrow composition ranges while the third, TiN, exhibits stability overan extensive composition range. Figure 1.15 shows the Ti–N equilibrium phasediagram; the special points of this system are listed in Table 1.16 (Massalski et al.1992). An update pertaining to the Ti–N phase diagram has appeared subsequently(Okamoto 1993e).
Figure 1.16 (Zuzek et al. 1990, Massalski et al. 1992) shows the solid phasesencountered in the Zr–H phase diagram. These are the bcc terminal solid solution

Elsevier UK Code: PTA Ch01-I042145 5-6-2007 9:27a.m. Page:40 Trim:165mm×240mm Integra, India
Font:Times F.Size:11/13pt Margins: Top:19mm Gutter:19mm Width:128mm Depth:40 Lines 1 Color Recto
40 Phase Transformations: Titanium and Zirconium Alloys
Table 1.15. Special points of the Zr–Al system.
Phase reaction Type of reaction Temperature (K) Composition (at.% Al)
L� �Zr Melting 2128 0L� ��Zr�+Zr5Al3 Eutectic 1623 (29.5) (26) (37.5)L +Zr3Al2 � Zr5Al3 Peritectic 1668 (∼ 37) (40) (37.5)L +Zr5Al4 � Zr3Al2 Peritectic 1753 (∼ 39) (44.4) (40)L� Zr5Al4 Congruent 1803 44.4L� Zr5Al4 +Zr2Al3 Eutectic 1758 (49) (44.4) (60)L +ZrAl2 � Zr2Al3 Peritectic 1868 (∼ 59) (66.7) (60)L� ZrAl2 Congruent 1918 66.7L� ZrAl2 +ZrAl3 Eutectic 1763 (73.5) (66.7) (75)L� ZrAl3 Congruent 1853 75L +ZrAl3 � �Al� Peritectic 934 (99.97) (75) (99.93)L� Al Melting 933 100�Zr� �Zr Allotropic 1136 0��Zr�+Zr5Al3 � Zr2Al Peritectoid 1523 (22.5) (37.5) (33.3)��Zr�+Zr2Al� Zr3Al Peritectoid 1261 (12.5) (33.3) (25)��Zr�+Zr3Al� �Zr Peritectoid 1213 (9.2) (25) (11.5)Zr5Al3 � Zr2Al +Zr3Al2 Eutectoid ∼ 1273 (37.5) (33.3) (40)Zr3Al2 +Zr5Al4 � Zr4Al3 Peritectoid ∼ 1303 (40) (44.4) (42.9)Zr5Al4 � Zr4Al3 +ZrAl Eutectoid ∼ 1273 (44.4) (42.9) (50)Zr5Al4 +Zr2Al3 � ZrAl Peritectoid 1548 (44.4) (60) (50)
770
1270
1770
2270
2770
3270
37700 2 4 6 8 10 15 20 25
Weight per cent N
Tem
pera
ture
(K
)
0 5 10 15 20 25 30 35 40 45 50 55
Ti Atom per cent N
1943 K (β-Ti)
(α-Ti )
1155 K
1323 K 33.3 1373 K
30 3323
341073 K
3937.5 δ′Ti2N
2623 K
3563 K47.4
2293 K
15.2
12.56.24.0
L
20.528
TiN
Figure 1.15. Equilibrium phase diagram for the Ti–N system.

Elsevier UK Code: PTA Ch01-I042145 5-6-2007 9:27a.m. Page:41 Trim:165mm×240mm Integra, India
Font:Times F.Size:11/13pt Margins: Top:19mm Gutter:19mm Width:128mm Depth:40 Lines 1 Color Recto
Phases and Crystal Structures 41
Table 1.16. Special points of the Ti–N system.
Phase reaction Type of reaction Temperature (K) Composition (at.% N)
L ←→ �Ti Melting 1943 0L ←→ TiNa Congruent ∼ 3563 47.4L + ��Ti� ←→ ��Ti� Peritectic 2293±25 (4.0) (12.5) (6.2)L +TiN ←→ ��Ti� Peritectic 2623±25 (15.2) (2.8) (20.5)��Ti�+TiN +Ti2N Eutectoid 1323±60 (23) (30) (33)
or PeritectoidTiN ←→ Ti2Nb Congruent ∼ 1373 33.3Ti2N +�′ +TiN Peritectoid 1073±100 (34) (37.5) (39)
(Probably)�Ti ←→ �Ti Allotropic 1155 0
a Observed under pressure >∼1 MPa.b Occurrence if �� Ti�+TiN +Ti2N equilibrium is eutectoid.
0 10 20 30 40 50 60 70 80
Zr Atom per cent H
270
470
670
870
1070
1270
Tem
pera
ture
(K
)
Weight per cent H
(β-Zr)
823 K
5.93 ~37.5 56.7
(α-Zr)
1136 K
δ
ε
Figure 1.16. Equilibrium phase diagram for the Zr–H system.
(�-Zr), which decomposes eutectoidally at 823 K at a H concentration of 37.5 at.%,the hcp terminal solid solution (�-Zr) which exhibits a maximum H solubility of5.9 at.% at 823 K and the hydride phases � (fcc) and � (fct).
The Zr–O phase diagram (Abriata et al. 1986, Massalski et al. 1992) is shown inFigure 1.17. The equilibrium condensed phases are the liquid (L), the bcc terminalsolid solution (�-Zr), the hcp terminal solid solution (�-Zr) and the oxide phases,�-ZrO2−x (cubic, cF12), �-ZrO2−x (tetragonal, tP6) and �-ZrO2−x (monoclinic,mP12). The special points of the Zr–O system are shown in Table 1.17.

Elsevier UK Code: PTA Ch01-I042145 5-6-2007 9:27a.m. Page:42 Trim:165mm×240mm Integra, India
Font:Times F.Size:11/13pt Margins: Top:19mm Gutter:19mm Width:128mm Depth:40 Lines 1 Color Recto
42 Phase Transformations: Titanium and Zirconium Alloys
0 10 20 30Weight per cent O
0 10 20 30 40 50 60 70
Zr Atom per cent O
470
870
1270
1670
2070
2470
2870
3270T
empe
ratu
re (
K)
(β-Zr)
1136 K
(α-Zr)
(α′-Zr)
(α1″-Zr)(α2″-Zr)
(α3″-Zr)
(α4″-Zr)
P = 1 atmL
10
2128 K
10.5 19.525
2403 K 2338 K35 40 62
2983 K L + G
~2650 K
γ-Z
rO2-
x
β-Z
rO2-
xα-
ZrO
2-x
28.6
29.1
29.8
31.2
66.7
66.7
66.563.6~1798 K
~1478 K
~1243 K
~773 K
2243 K
Figure 1.17. Equilibrium phase diagram for the Zr–O system.
Table 1.17. Special points of the Zr–O system.
Phase reaction Type of reaction Temperature (K) Composition (at.% O)
L ←→ �Zr Melting 2128 0
L ←→ ��Zr� Congruent 2403±10 25±1
L ←→ �ZrO2−x Congruent 2983±15 66.6
L ←→��Zr�+�ZrO2−x
Eutectic 2338±5 �40±2��35±1��62±1�
L + ��Zr� ←→ ��Zr� Peritectic 2243±10 �10±0 5��19 5±2��10 5±0 5�
L +�ZrO2−x +G 2983 �∼ 66 6� �∼ 66 6� �∼ 100�
�ZrO2−x ←→ ��Zr�+�ZrO2−x
Eutectoid ∼ 1798 �63 6±0 4� �31 2±0 5��66 5±0 1�
�ZrO2−x ←→ ��Zr�+�ZrO2−x
∼ 1478 �∼ 66 5� �29 8±0 5� �∼ 66 5�
�ZrO2−x +�ZrO2−x +G ∼ 2650 �∼ 66 6� �∼ 66 6� �∼ 100�
�ZrO2−x +�ZrO2−x +G ∼ 1478 �∼ 66 6� �∼ 66 6� �∼ 100�
�ZrO2−x ←→ �ZrO2−x Congruent ∼ 2650 66.6
�ZrO2−x ←→ �ZrO2−x Congruent ∼ 1478 66.6
�Zr ←→ �Zr Allotropic 1136 0

Elsevier UK Code: PTA Ch01-I042145 5-6-2007 9:27a.m. Page:43 Trim:165mm×240mm Integra, India
Font:Times F.Size:11/13pt Margins: Top:19mm Gutter:19mm Width:128mm Depth:40 Lines 1 Color Recto
Phases and Crystal Structures 43
1.6 NON-EQUILIBRIUM PHASES
1.6.1 Introductory remarksPhases such as the �-, �- and intermetallic phases mentioned earlier are equilibriumphases and the corresponding phase fields are delineated in equilibrium phasediagrams of the type described in the previous section. However, non-equilibriumor metastable phases, as distinct from equilibrium phases, are quite important inrespect of many alloy systems, including those based on Ti and Zr. Equilibriumphase diagrams are usually developed by deducing the initial states of alloyswhich have been quenched from different temperatures to room temperature. Butthe quenching process may lead to the formation of non-equilibrium phases. Twoimportant examples of such non-equilibrium phases in Ti–X and Zr–X systems arethe martensite and the athermal -phases. Both these phases are formed throughathermal displacive transformations.
It will be seen in a later chapter that one way of classifying phase changes is todivide them into two broad classes: reconstructive and displacive (Roy 1973,Christian 1979, Banerjee 1994). Transformations of the former kind involve break-ing of the bonds of atoms with their neighbours and re-establishment of bonds toform a new configuration in place of the pre-existing one. Such a process requiresatomic diffusion comprising random atomic jumps and disturbs atomic coordina-tion. Atomic movements in displacive transformations, on the other hand, can bebrought about by a homogeneous distortion, by shuffling of lattice planes, by staticdisplacement waves or by a combination of these. Cooperative movements of alarge number of atoms in a diffusionless process accomplish the structural changein displacive transformations. Unlike the diffusional atomic jumps which are ther-mally activated, the displacive movements do not require thermal activation andcannot, therefore, be suppressed by quenching. A structural transition involving peri-odic displacements of atoms from their original positions can be described in termsof a displacement wave and the introduction of a displacement wave in the par-ent lattice requires coordinated atom movements in an athermal process; the ather-mal martensitic and -transformations can, respectively, be described in terms oflong wavelength and short wavelength displacement waves (Banerjee et al. 1997).
In the present chapter brief accounts of the martensite and the -phases and ofphase separation in the �-phase will be provided with reference to Ti–X and Zr–Xalloys. A detailed coverage in respect of the same will be found in three of thesubsequent chapters.
The martensitic transformation, which is diffusionless and involves coopera-tive atom movements, proceeds by the propagation of a shear front at a speedthat approaches the speed of sound in the material, leading to the formationof the metastable martensite phase. This transformation occurs in many alloy
Elsevier UK Code: PTA Ch01-I042145 5-6-2007 9:27a.m. Page:44 Trim:165mm×240mm Integra, India
Font:Times F.Size:11/13pt Margins: Top:19mm Gutter:19mm Width:128mm Depth:40 Lines 1 Color Recto
44 Phase Transformations: Titanium and Zirconium Alloys
systems, including Ti–X and Zr–X systems, in which the major component exhibitsallotropy. The -phase, which is an equilibrium phase in Group 4 metals (Ti, Zr,Hf) at high pressures, forms in several alloys based on these metals and also inmany other bcc alloys at ambient pressure as a metastable phase.
On rapidly quenching Ti–X and Zr–X alloys, X being an �-stabilizing element,from the �-phase field, the martensite phase, �m, which has the hcp structure, isobtained. The situation is somewhat different when X is a �-stabilizing element,such as a transition metal. During the process of rapid cooling from the �-phasefield, when a composition-dependent temperature (known as the martensitie start orMs temperature) is crossed, the bcc �-phase commences to transform spontaneouslyby the martensitic mode to the martensite phase �m whose structure may be hcp(�′) or orthorhombic (�′′), depending on the alloy composition. However, in thecase of these alloys, another athermal process, namely, that associated with theformation of the athermal -phase, competes with the martensitic process. At anytemperature compatible with the formation of both �m and -phases, there is anarrow range of composition (or electron to atom ratio), just beyond the martensiteformation regime, over which the athermal -phase forms from the parent �-phase.If a s temperature, akin to the Ms temperature, is conceived as being associatedwith the start of athermal -phase formation, then one may visualize that thes locus lies above the Ms locus in the narrow composition range referred toabove, if temperature is plotted against composition. In the composition regimeof martensite formation, which lies to the left of this narrow range, the Ms locuslies above the s locus. Even though the -phase appears athermally on rapidquenching from the �-phase field only over a narrow range of electron to atomratio, this phase occurs over a broader composition range as a precipitation productof �-phase decomposition. The typical structures exhibited by rapidly �-quenchedbinary Ti–X or Zr–X alloys, X being a �-stabilizing element, are indicated in theschematic shown in Figure 1.18. Beyond the �+ region (where these two phasescoexist), the �-phase is retained in a metastable (susceptible to decomposition onageing) or stable manner on quenching.
It may be noted that similar values of the electron to atom ratio (∼ 4 15)characterize the limit of the stability of the bcc �-phase with respect to either ofthe two athermal transformations (Collings 1984).
1.6.2 Martensite phase1.6.2.1 CrystallographyThe phenomenological crystallographic theories of the martensitic transformationare based on the concept that the interface between the martensite and the parentphases is macroscopically invariant. The central theme of these theories is that thetotal macroscopic shear consists of three components: (a) the lattice shear or the

Elsevier UK Code: PTA Ch01-I042145 5-6-2007 9:27a.m. Page:45 Trim:165mm×240mm Integra, India
Font:Times F.Size:11/13pt Margins: Top:19mm Gutter:19mm Width:128mm Depth:40 Lines 1 Color Recto
Phases and Crystal Structures 45
M s
ωs
Tem
pera
ture
Concentration of X
I III IVII
Figure 1.18. Schematic showing the Ms and s loci for a binary Ti–X or Zr–X system, X being a�-stabilizing element, on rapid cooling from the �-phase field. Region I corresponds to martensite(�m) formation; in regions II and III, the �-phase co-exists with the athermal - and the aged-phases, respectively; in region IV only the �-phase occurs in a metastable or stable state.
Bain strain which brings about the necessary change in the lattice (e.g. bcc to hcp);(b) a lattice invariant inhomogeneous shear which provides an undistorted plane;and (c) a rigid body rotation to ensure that the undistorted habit plane is unrotatedas well. The inhomogeneous shear accompanying the martensitic transformation isinstrumental in generating the martensite substructure which, in most cases, is toofine to be resolved under the light microscope. Transmission electron microscopy(TEM) techniques have been extensively used for resolving this substructure andfor obtaining information regarding the orientation relationship, the habit planeand the nature of the inhomogeneous strain for individual martensite crystals.
A unique feature of the � → �′ martensitic transformation in Ti and Zris that the necessary lattice strains approximately satisfy the invariant planestrain condition. Because of this, the magnitude of the lattice invariant shear iscomparatively small and it is relatively simple to characterize the substructure ofthe martensite in Ti–X and Zr–X alloys.
There are a number of choices for relating the lattices of the parent (�) andproduct (�′) phases. The correct choice of lattice correspondence is generallymade by selecting the one which involves the minimum distortion and rotation ofthe lattice vectors. In the case of the transformation in Zr, it has been suggested(Burgers 1934) that the �011�� plane forms the basal plane �0001��′ , while theclose packed 11̄1�� and 111̄�� directions lying on that plane correspond to theclose packed �112̄0��′ directions. This accounts for four of the six �112̄0��′directions; the remaining two are derived from the 100�� and 1̄00�� directions.

Elsevier UK Code: PTA Ch01-I042145 5-6-2007 9:27a.m. Page:46 Trim:165mm×240mm Integra, India
Font:Times F.Size:11/13pt Margins: Top:19mm Gutter:19mm Width:128mm Depth:40 Lines 1 Color Recto
46 Phase Transformations: Titanium and Zirconium Alloys
Having chosen this lattice correspondence, the next step would be to determine themagnitudes of the strains which would deform the distorted hexagonal structureinto a regular one, having lattice parameters consistent with those of �-Zr.
If ao� a and c refer to the lattice parameters of the �- and �-phases, respectively,the magnitudes of two of the principal lattice distortions, �1 (along 100��) and �2
(along 011̄��) are given by �1 = a/ao and �2 = �3/2�12 a/ao. The distortion �3 along
011�� is �1/2�1/2��a/ao� where � = c/a. On substituting the values for the latticeparameters at the transformation temperature, the magnitudes of the principal strainsfor pure Zr are seen to be as follows: 2% expansion along 011��, 10% expansionalong 011̄�� and 10% contraction along 100��. The situation is analogous in the caseof Ti and the corresponding principal strains are 1% expansion, 11% expansion and11% contraction, respectively, along the aforementioned directions.
A pair of planes remains undistorted under the action of a homogeneous latticestrain if and only if one of the principal strains is zero and the other two are ofopposite signs (Wayman 1964). A special feature of the martensitic bcc to hcptransformation in Ti and Zr is that the principal strain along the 011�� directionis very small and the other two principal strains are of opposite signs. If theprincipal strain along the 011�� direction, �3, were zero, the lattice shear wouldhave left a plane undistorted. Since �3 is very small in the case of Ti and Zr, itis not unreasonable to treat the transformation with the approximation that �3 iszero (Kelly and Groves 1970).
It has been reported (Bagaryatskii et al. 1959, Flower et al. 1982) that the nor-mally observed hcp (�′) structure of the martensite is distorted to an orthorhombicstructure (�′′) in many Ti–X systems, X being a transition metal, when the marten-site is supersaturated beyond a certain limit. The orthorhombic distortion increaseswith increasing solute content. It has been noticed that the deformation inducedmartensite, mentioned later in this section, almost invariably has an orthorhom-bic structure (Williams 1973). This is not surprising when one considers the factthat this type of martensite can occur only in alloys which are so enriched in�-stabilizing solutes that they are not transformed on �-quenching.
It has been demonstrated (Otte 1970) that the � → �′ transformationinvolves the activation of the shear systems �112̄��111�� ≡ �2̄112��′21̄1̄3��′ and�1̄01��111�� ≡ �1̄011��′ [21̄1̄3��′ . The habit plane associated with this transfor-mation has been found to be very close to �334�� (Williams 1973, Shibata andOno 1977), although in some �-stabilizing solute enriched Ti–X alloys �344��habit has also been reported (Liu 1956, Gaunt and Christian 1959, Hammond andKelly 1970). The orientation relationship between the �- and �′-phases has beenobserved to be: �011�� �0002��′ ; < 111̄ >�< 112̄0 >�′ (approximately), whichis consistent with the approximate orientation relation deduced by Burgers withregard to the bcc → hcp transformation in elemental Zr (Burgers 1934).

Elsevier UK Code: PTA Ch01-I042145 5-6-2007 9:27a.m. Page:47 Trim:165mm×240mm Integra, India
Font:Times F.Size:11/13pt Margins: Top:19mm Gutter:19mm Width:128mm Depth:40 Lines 1 Color Recto
Phases and Crystal Structures 47
In the case of the orthorhombic �′′ martensite, the orientation relationship hasbeen reported to be: 100�′′� and 010��′′ inclined by about 2o from �001�� and< 110 >�, respectively; 001�′′� < 11̄0 >� (Hatt and Rivlin 1968).
1.6.2.2 Transformation temperaturesThe martensitic transformation is characterized phenomenologically by the assign-ment of several temperatures. The most common among these are: Ms, the temper-ature at which martensite starts forming during quenching; Mf , the temperature atwhich the transformation is completed; �s, the temperature at which the �m → �reverse transformation starts during up-quenching (in Ti and Zr alloys); and To,the temperature at which the free energies of the parent and martensite (� and �m)phases are equal. If Ms and �s are very close to each other, it is indicated that thedriving force for the transformation is small and also that To can be taken to bethe mean of these two temperatures (Collings 1984).
A thermodynamic analysis (Kaufman 1959) of the �→� transformation in sev-eral Ti and Zr base alloys has shown that the To temperatures are about 50 K higherthan the experimentally observed Ms temperatures. This implies that the supercool-ing (To–Ms), necessary to initiate the martensitic transformation in these systemsis relatively low. The change in free energy accompanying the transformation atthe Ms temperature is significantly lower as compared to that in ferrous systems.
At the Ms temperature, the chemical driving force necessary to start a martensiticreaction depends on the shear modulus of the alloy at the transformation tempera-ture, the magnitude of the homogeneous shear associated with the transformationand the magnitude of the inhomogeneous shear. The strain energy associated withmartensite formation is determined by the homogeneous lattice strains and theshear modulus while the surface energy corresponds to the energy of the interfacebetween the parent and the product lattices.
If the austenite–martensite reaction in ferrous systems is compared with the� → �′ transformation in Ti and Zr base alloys, it is found that although there isnot much difference in the homogeneous strain values in the two cases, the shearmodulus of ferrous alloys at the transformation temperature is much higher. Again,the energy associated with the parent–martensite interface can also be expectedto be much smaller in the case of Ti- and Zr-based alloys because only a smallamount of inhomogeneous shear is necessary to make the total strain an invariantplane strain in the case of the �→�′ transformation. These considerations indicatethat the “back stress”, which arises from the strain and surface energies opposingmartensite formation, is much smaller in Ti- and Zr-based alloys as compared toferrous alloys. This explains why a small driving force is adequate for initiatingmartensite formation in the former. The chemical driving force which balances

Elsevier UK Code: PTA Ch01-I042145 5-6-2007 9:27a.m. Page:48 Trim:165mm×240mm Integra, India
Font:Times F.Size:11/13pt Margins: Top:19mm Gutter:19mm Width:128mm Depth:40 Lines 1 Color Recto
48 Phase Transformations: Titanium and Zirconium Alloys
the “back stress” at the Ms temperature can be assisted by external stress, leadingto stress-assisted or stress-induced or deformation-induced martensite formation.
The Ms temperature is composition dependent. Again, the measured Ms tem-perature for a given alloy composition may exhibit a dependence on the rate ofcooling (Jepson et al. 1970). In �-stabilized Ti–X and Zr–X alloys, Ms increaseswith increasing solute content and may lie a little below the ��+��/� transus; in�-stabilized alloys, Ms decreases with increasing concentration of X and alwayslies in the (�+�) field (Collings 1984). In dilute alloys of the latter type, the Ms
temperature is relatively high and water quenching may not be sufficiently rapidfor completely suppressing thermally activated atom movements, leading to somesegregation of the solute atoms prior to the transformation and consequently tothe retention of some �-phase. If the solute content in the alloy increases, theMs temperature decreases and the diffusional contribution is inhibited, with theresult that a full transformation to the martensite phase comes about. It may bementioned here that the quench rates necessary to achieve the structural trans-formation while preserving compositional homogeneity depend strongly on thenature of the alloying element, X, or more specifically, on its diffusion kinetics inthe �-phase. A quench rate that is adequate when X is an early transition metalsuch as V, Nb or Mo, may not be so when X is a late transition metal like Fe,Co or Ni. This is so because metals belonging to the latter category diffuse muchfaster in the �-phase; for instance, in the context of diffusion in �-Ti at 1273 K,it may be noted that the diffusion coefficients of Co and Mo are in the ratio200:1 (Collings 1984). As the solute concentration increases further, a stage isreached where the Mf temperature drops below the temperature of the quenchingbath; in this situation, the retention of some untransformed �-phase again becomesfeasible.
1.6.2.3 Morphology and substructureIf dilute Ti–X and Zr–X alloys are quenched from the �-phase field, maintainingan adequately fast cooling rate, one generally obtains a hcp martensite phase(�′) which is known as lath or packet or massive martensite and consists ofrelatively large, irregular packets or “colonies” which are populated by near-parallel arrays of much finer platelets or laths. No retention of the �-phase occursin a lath martensite. As the solute content increases, the average packet size andthe average lath size decrease. Beyond a certain level of solute concentration,which depends on the nature of the solute, a transition occurs in the martensitemorphology, resulting in the formation of plate or acicular martensite. In contrast tothe arrangement of near-parallel units in the lath morphology, the martensite unitsform in various intersecting directions in the plate or acicular structure. Anotherimportant difference between the lath and the plate morphologies is that the sizedistribution in the latter case is much broader than in the former. This is essentially

Elsevier UK Code: PTA Ch01-I042145 5-6-2007 9:27a.m. Page:49 Trim:165mm×240mm Integra, India
Font:Times F.Size:11/13pt Margins: Top:19mm Gutter:19mm Width:128mm Depth:40 Lines 1 Color Recto
Phases and Crystal Structures 49
due to the fact that in the plate morphology the martensite units continuouslypartition the parent �-grain and as a result of this the space available for the growthof the plates belonging to the subsequent generations gets more and more limited.The transition from lath to plate morphology is not abrupt and the two may coexistover some range of composition. When the solute concentration is sufficientlyhigh, the martensitic transformation may be incomplete and some �-phase, whichis usually trapped between the platelets of the acicular martensite, may be retained.Not far removed from the “� plus acicular martensite” quenched structure is theWidmanstatten arrangement consisting of groups of �-phase needles lying withtheir long axes parallel to the �110� planes of the retained �-phase.
The term “substructure” of a martensite generally refers to the structure withinthe martensite unit as revealed under the transmission electron microscope (TEM).This substructure arises from (a) the lattice invariant component of the transfor-mation strain which may be slip, twin or a combination of both; and (b) thepost-transformation strain resulting from the accommodation effect. There hasbeen considerable interest in characterizing the internal structure of martensiteplates for determining the nature of the inhomogeneous shear participating inthe transformation process, as envisaged in the phenomenological theory of themartensitic transformation. For this it is necessary to be able to identify and sepa-rate the inhomogeneities introduced by matrix constraints from those produced bythe lattice invariant component of the transformation strain. Such a separation isnot straightforward. In a twinned martensite plate, a set of transformation twins isexpected to appear periodically at almost equal intervals within the plate; the ratioof the thicknesses of the twinned and the matrix portions should be consistent withthe value predicted by the theory and the specific variant of the twin plane shouldbe consistent with the observed habit plane. When a set of twins in a martensiteplate satisfies all these conditions, the twins are taken to be transformation twins.In a dislocated martensite crystal, it is more difficult to separate the transformationinduced dislocations from those introduced by post-transformation stresses. A ruleof the thumb appears to be that only those dislocations which are arranged in regu-lar arrays and are observed very frequently may be taken to have been produced bythe inhomogeneous shear. Generally, a transition from the dislocated to the twinnedsubstructure is found to occur with increasing concentration of alloying elements.
1.6.3 Omega phase1.6.3.1 Athermal and isothermal �It has been mentioned earlier that under ambient pressure, the -phase can occur ina metastable manner in alloys in which the �-phase is stabilized with respect to themartensitic � → �m transformation. The composition range over which this phasemay be encountered is a characteristic of the alloy system under consideration. Ithas also been indicated that this phase can be obtained either by rapidly quenching

Elsevier UK Code: PTA Ch01-I042145 5-6-2007 9:27a.m. Page:50 Trim:165mm×240mm Integra, India
Font:Times F.Size:11/13pt Margins: Top:19mm Gutter:19mm Width:128mm Depth:40 Lines 1 Color Recto
50 Phase Transformations: Titanium and Zirconium Alloys
from the �-phase field (athermal ) or as a product of thermally activated �-phasedecomposition (isothermal or aged ).
The athermal � → transformation is displacive, diffusionless and of thefirst-order and the -phase so obtained has a composition very close to thatof the �-phase. The thermally activated transformation, on the other hand, isaccompanied by solute rejection by diffusional processes from the to the �-phaseand is thus partially replacive in nature. The athermal � → transformationcannot be suppressed even by extremely rapid quenching and is completely andcontinuously reversible with negligible hysteresis. The special characteristics ofthis transformation also include the appearance of an extensive diffuse intensitydistribution in diffraction patterns, with the maximum intensity located close tothe positions of ideal -reflections, as a precursor to the transformation event andthe stability of the dual phase �+ structure with extremely fine (∼1–4 nm) particles distributed in the �-matrix along �111�� directions (Banerjee et al. 1997).The number density of the particles is extremely large and this fact lends supportto the contention that the transformation does not involve long range diffusion.
The volume fraction of the isothermal -phase forming in the �-matrix is afunction of the reaction time. This dependence of the volume fraction on time arisesessentially due to the diffusion controlled partitioning of the solute between solutelean and solute rich � regions. The solute lean regions are eventually transformedto the -phase. The composition of the isothermal -phase corresponds to themaximum solubility of the solute in the -phase. Thus after prolonged ageingat temperatures lower than about 770 K, a metastable + � state is attained,characterized at a given temperature by a fixed volume fraction and compositionof each of the and � terminal points (Hickman 1969). After sufficiently longageing periods at 720–770 K, �-phase precipitation can be expected.
An early model of isothermal -phase development visualized an initial struc-tural transformation of the lattice into and � (as in the case of the athermal-phase in its pertinent composition regime), followed by an exchange of soluteand solvent atoms across the /� interface (Courtney and Wulff 1969). It hassubsequently been suggested that initially a composition fluctuation occurs andthis is followed by a structural � → transformation within a solute lean zone,triggered by a longitudinal phonon with a 2/3 �111� wave vector; it is the insta-bility of the bcc lattice with respect to this disturbance that is responsible for theathermal transition (de Fontaine et al. 1971).
1.6.3.2 CrystallographyThe crystal structure of the -phase has been described in an earlier section. Theorientation relationship between the � and -phases has been determined by a largenumber of investigators and has been unanimously accepted as: �111�� �0001�;

Elsevier UK Code: PTA Ch01-I042145 5-6-2007 9:27a.m. Page:51 Trim:165mm×240mm Integra, India
Font:Times F.Size:11/13pt Margins: Top:19mm Gutter:19mm Width:128mm Depth:40 Lines 1 Color Recto
Phases and Crystal Structures 51
�11̄0�� �12̄10�. It has been found that this orientation relationship is validboth for the athermal -phase and the isothermal -phase (Williams 1978). Thisrelationship implies that there are four possible crystallographic variants of the-structure, depending on which one of the �111�� planes is parallel to the (0001)plane. Again, for the same variant of the -structure, there are three �110� direc-tions so that in all 12 variants of the -structure are possible. But since the basalplane of this structure has six-fold symmetry, the three variants for a given �111��plane will appear identical and, therefore, the contribution from only four variantswill be seen in selected area diffraction (SAD) patterns. The lattice parameters, a
and c of the structure and a� of the � (bcc) structure, are related as follows:
a = √2a�� c = �
√3/2�a�
1.6.3.3 MorphologyPrecipitates of the athermal -phase that evolve during rapid �-quenching are veryfine (<5 nm) and it is difficult to assign any well-developed geometrical shape tothese particles which have a tendency to be aligned along �111�� directions. Theshapes of isothermal -phase precipitates are more readily discernible and gener-ally two types of morphologies, ellipsoidal and cubic, are encountered, dependingon the linear lattice misfit, �V −V��/3V�, where V represents the unit cell volumedivided by the number of atoms in the unit cell (Hickman 1969). If this misfitis small (<0 5%), as is often the case when the solute is a 4d-transition metalsuch as Nb or Mo, the precipitate morphology is dominated by surface energyconsiderations, leading to an ellipsoidal shape (Hickman 1969). If the misfit islarge (>1%), as is generally the case when the solute is a 3d-transition metal likeV, Cr, Mn or Fe, the minimization of elastic strains in the cubic matrix dictates acubic morphology (Hickman 1969, Blackburn 1970).
1.6.3.4 Diffraction effectsPronounced diffuse scattering has been observed in electron, X-ray and neutrondiffraction patterns prior to the formation of the -phase in all -forming systems.These diffuse intensity patterns are closely associated with the non-diffuse (sharp)reflections corresponding to the crystalline -phase. In view of this close associa-tion, the diffuse intensity distribution has been attributed to non-ideal -structures.It has been mentioned earlier that the ideal hexagonal -structure is obtained whenthe parameter z has the value zero and the non-ideal trigonal -structure resultsif 0 < z < 1/6. Selected area electron diffraction patterns obtained from the trulyathermal -phase are characterized by sharp spots and straight lines of intensitywhile broad reflections and either straight or curved diffuse lines of intensity

Elsevier UK Code: PTA Ch01-I042145 5-6-2007 9:27a.m. Page:52 Trim:165mm×240mm Integra, India
Font:Times F.Size:11/13pt Margins: Top:19mm Gutter:19mm Width:128mm Depth:40 Lines 1 Color Recto
52 Phase Transformations: Titanium and Zirconium Alloys
(diffuse streaking) originate from the “diffuse” -phase (Collings 1984). A modelproposed by Sass and co-workers (Dawson and Sass 1970, McCabe and Sass 1971,Balcerzak and Sass 1972) envisages an ensemble of -particles, 1–1.5 nm in diam-eter and 1.5–2.5 nm apart, arranged in rows along �111�� directions. According tothis model, clusters of such rows contribute to the sharp spots and straight linesof intensity, while the broad reflections and diffuse streaking arise from eitherindividual rows of particles or isolated particles.
It has been demonstrated that a transition from diffuse to sharp -reflectionsoccurs in �-quenched specimens in response to either decreasing solute content(Sass 1972) or decreasing temperature (de Fontaine et al. 1971). In both cases,curvilinear lines of diffuse intensity become straight and well defined. It has beenpointed out (Williams 1973) that since the diffuse streaking tends to coincide withthe positions of the -reflections when they are present, compositionwise there isno sharp line of demarcation separating the regions of athermal and diffuse .
A soft phonon mechanistic model of the -phase reaction (de Fontaine et al.1971) has been able to provide a rationalization, in terms of lattice dynamics,for the temperature and composition dependences of the athermal and diffuse-phases. After examining electron diffraction patterns belonging to several zonesand considering the symmetry of the reciprocal lattices, de Fontaine et al. (1971)have constructed a three-dimensional model of the diffuse intensity which isdistributed on quasi-spherical surfaces centred around the octahedral sites of thereciprocal of the bcc �-lattice. These spheres of intensity touch all the �111� facesof the octahedra surrounding them. When this intensity distribution in the recipro-cal space is sectioned to reveal the diffuse intensity pattern in a plane correspondingto any zone, the pertinent shifts of the diffuse intensity maxima from the positionsof ideal -reflections and asymmetry in intensity distribution are manifested.
The lattice dynamical model for phase stability, with special reference to thequenched -phase, has been further developed by Cook (1975). It does appear thatthe 2
3�111� soft mode, interacting with a lattice of composition and temperaturedependent relative stability, is responsible not only for athermal but also fordiffuse , which represents in varying degrees, dynamical fluctuations betweenthe �- and -phases (Collings 1984).
1.6.4 Phase separation in �-phaseBelow a transus representing the upper boundary of a region in the equilibriumphase diagram known as a miscibility gap, a previously homogeneous single phase� solid solution decomposes into a thermodynamically stable aggregate of twobcc phases, one solute lean and the other solute rich, designated respectively asthe �1- and �2-phases. Two ideal examples of systems where such a � → �1 +�2
decomposition occurs are the Zr–Nb and Zr–Ta systems, both of which exhibit

Elsevier UK Code: PTA Ch01-I042145 5-6-2007 9:27a.m. Page:53 Trim:165mm×240mm Integra, India
Font:Times F.Size:11/13pt Margins: Top:19mm Gutter:19mm Width:128mm Depth:40 Lines 1 Color Recto
Phases and Crystal Structures 53
the monotectoid reaction �1 → �+�2. The equilibrium phase diagrams for thesesystems have many points of similarity with those of Zr–X and Ti–X (X being atransition metal) eutectoid systems; in the case of the latter, Ti is replaced by Zr andthe intermetallic phase TimXn replaced by �2. A bimodal free energy (G) versussolute concentration (X) curve is associated with either of the Zr–Nb and Zr–Tasystems, representing the occurrence, in equilibrium, of two � solid solutions.This situation is somewhat different from that representing the coexistence of say,the �-and �-phases in equilibrium. While the latter situation is described in termsof two independent free energy parabolas, equilibrium phase separation, with theabsence of structural change, has to be described by a continuous curve with twominima, separated by an intervening maximum, for which the second derivativeof free energy with respect to solute concentration is negative.
Although above the monotectoid temperature, both �1 and �2 are equilibriumphases, the former ceases to be an equilibrium phase below this temperature. How-ever, the �1-phase has been found to occur in a metastable manner at temperaturesclose to but lower than the monotectoid temperature in the Zr–Nb (Banerjee et al.1976, Menon et al. 1978) as well as the Zr–Ta (Mukhopadhyay et al. 1978, Menonet al. 1979) systems.
Phase separation in the �-phase has also been reported in some Ti–X systems(X: Cr, V, Mo, Nb). In situations where the temperature (Williams et al. 1971) orthe solute concentration (Williams 1973) is too high to be conducive for -phaseprecipitation, a solute lean bcc phase, designated as �′ separates from the �-phase.The � → �′ +� phase separation reaction can be considered to be a clusteringreaction characteristic of alloy systems which exhibit positive heats of mixing(Chandrasekaran et al. 1972) or similar manifestations of a tendency for the alloy-ing constituents to unmix. It is interesting to note that �-stabilizing elements suchas Al, Sn and O, when added to Ti–V and Ti–Mo alloys in sufficient quantities,appear to increase the stability of the bcc lattice in that -phase formation issuppressed in favour of �-phase separation (Williams 1971). Thus these solutes,which are certainly not �-stabilizers in the conventional sense, can be regarded asstabilizers of the bcc lattice against the instability. Ageing in the �′ +� phasefield, which lies just outside the + � phase field, would eventually result in�′-nucleated �-phase precipitation.
1.7 INTERMETALLIC PHASES
1.7.1 Introductory remarksA large number of intermetallic phases are encountered in binary Ti–X and Zr–Xsystems and these exhibit a variety of crystal structures. Many of these structures

Elsevier UK Code: PTA Ch01-I042145 5-6-2007 9:27a.m. Page:54 Trim:165mm×240mm Integra, India
Font:Times F.Size:11/13pt Margins: Top:19mm Gutter:19mm Width:128mm Depth:40 Lines 1 Color Recto
54 Phase Transformations: Titanium and Zirconium Alloys
are derived from three simple crystal structures, namely, face centered cubic(fcc, Al), body centered cubic (bcc, A2) and hexagonal close packed (hcp, A3)structures, which are commonly associated with pure metals and disordered solidsolutions.
It may be noted that the formation of intermetallic phases does not appear tooccur in these binary systems when X is an alkali or alkaline earth metal (with theexception of Be) or a transition metal belonging to Group 3 or Group 4. Likewise,no intermetallic phases form when X is a rare earth (RE) element. Ti–RE andZr–RE phase diagrams are normally characterized by the absence of intermetallicphases, limited mutual solubilities in the solid state, and quite often, a miscibilitygap in the liquid state. In general, in the intermetallic phase ZrmXn, X is a transitionmetal from Group 5 (only V) to Group 10 or a simple (non-transition) metal fromGroup 11 to Group 16. In a similar manner in the intermetallic phase, TimXn, X isa transition metal from Group 6 (only Cr) to Group 10 or a non-transition metalfrom Group 11 to Group 16. In both TimXn and ZrmXn families, X is more often anon-transition metal than a transition metal. However, this does not imply that theincidence of X being a transition metal is infrequent: close to a hundred binaryintermetallic phases of this type have been reported.
Almost all the important binary intermetallic phases that have been observed inTi–X and Zr–X alloys, together with hydrides, borides, carbides, nitrides, oxides,phosphides and sulphides have been listed in Tables A1.1 and A1.2, respectively.The composition range, space group, Pearson symbol and strukturbericht designa-tion associated with each of these phases have been incorporated in these tables.The nomenclatures of crystal structures, in terms of their strukturbericht designa-tions and the corresponding Pearson symbols, are listed in Table A1.3 for readyreference.
A survey of Table A1.1 and Table A1.2 shows that more than 80% of TimXn
and ZrmXn type intermetallic phases are almost equally distributed among threecrystal classes: cubic, tetragonal and hexagonal. The orthorhombic system comesnext (∼15%) while less than 5% belong to the rhombohedral and monoclinicsystems. The unit cells of a majority (∼62%) of these phases are of the primitivetype, followed by body centred (∼21%), face centred (∼10%) and base centred(∼7%) cells. The occurrence of body centred unit cells is most common in tetrag-onal phases, of face centred cells in cubic phases and of base centred cells inorthorhombic phases. The more frequently encountered structures in binary Ti–Xintermetallics are the B2 (cP2, CsCl type), C11b (tI16, MoSi2 type), L12 (cP4,AuCu3 type), A15 (cP8, Cr3Si type), L1o (tP4, AuCu type) and D019 (hP8, Ni3Sntype) structures. In the case of Zr–X intermetallics, these are the B2, C11b, C15(cF24, Cu2Mg type), D88 (hP16, Mn5Si3 type), C16 (tI12, Al2Cu type), C14 (hP12,MgZn2 type) and Bf (oC8, CrB type) structures.

Elsevier UK Code: PTA Ch01-I042145 5-6-2007 9:27a.m. Page:55 Trim:165mm×240mm Integra, India
Font:Times F.Size:11/13pt Margins: Top:19mm Gutter:19mm Width:128mm Depth:40 Lines 1 Color Recto
Phases and Crystal Structures 55
Generally speaking, there are many intermetallics that can be put to a vari-ety of uses. For example, there has been a considerable interest in developingstrong alloys based on intermetallic phases for structural applications. However,such intermetallics are normally brittle and for this reason, their processing andapplication are difficult. But it has to be pointed out here that as a class of mate-rials intermetallics, in which atomic bonding is at least partly metallic, tend to beless brittle than ceramics, where atomic bonding is mainly covalent or ionic innature. Broadly speaking, alloys based on intermetallic phases are hard to deformplastically as compared to pure metals or disordered alloys because of their strongeratomic bonding and the resulting ordered distribution of atoms which gives riseto relatively complex crystal structures. The brittleness of intermetallics generallyappears to decrease with increasing crystal symmetry and decreasing unit cell size.In view of this, intermetallics with relatively high crystal symmetry (e.g. cubic,such as B2, D03, L12, or nearly cubic, such as L1o, D022, where a slight tetragonaldistortion is present) are thought to have good potential for structural applications(Sauthoff 1996). In the context of Ti–X and Zr–X systems, the intermetallics thathave been considered for structural applications include Ti3Al�D019�, TiAl�L1o�,TiAl3�D022� and Zr3Al�L12�. Another potential application area pertains to hydro-gen storage: certain Ti and Zr bearing Laves phase intermetallics show promisewith regard to applications as hydrogen storage materials (Sauthoff 1996).
1.7.2 Intermetallic phase structures: atomic layer stackingThe structures of many intermetallic phases can be considered to be formedby the sequential stacking of certain polygonal nets of atoms. These structuralcharacteristics can be readily described by using specific codes and symbols, whichcan be very useful for a compact presentation and comparison of the structuralfeatures of different materials. Various notations have been devised for describingthe stacking patterns (Pearson 1972, Ferro and Saccone 1996). Without goinginto details of these, only the Schlafli notation, PN , will be introduced here. Inthis notation, PN describes the characteristics of each node in the network in thefollowing manner: the superscript N is the number of P-gon polygons surroundingthe node. Thus P = 3 corresponds to a triangle, P = 4 to a rectangle or a square,P = 5 to a pentagon, P = 6 to a hexagon and so on. Some of the very commonlyoccurring nets are 36 (triangular, T net), 44 (square, S net), 63 (hexagonal, H net)and 3636 (kagome net or K net). These four types of nets are shown schematicallyin Figure 1.19(a). If a network has nodes which are not equivalent in terms ofthe polygons surrounding them, the net can be described by listing successivelythe different corners. For example, if a net is described as 32434+3342 (2:1), theimplication is that in this net there are two types of nodes, 32434 and 3342, and thatthey occur with a relative frequency of 2:1 (Figure 1.19(b)). A node of the first

Elsevier UK Code: PTA Ch01-I042145 5-6-2007 9:27a.m. Page:56 Trim:165mm×240mm Integra, India
Font:Times F.Size:11/13pt Margins: Top:19mm Gutter:19mm Width:128mm Depth:40 Lines 1 Color Recto
56 Phase Transformations: Titanium and Zirconium Alloys
T-net S-net
K-netN-net
(a)
32434 + 3342(2:1)
(b)
Figure 1.19. (a) Schematic representation of a 36 (triangular) T net, a 44 (square) S net, a 63
(hexagonal) H net and a 3636 (kagome) K net of points. (b) The net shown is more complex andcontains two types of nodes. This net can be described by the notation 32434 + 3342 (2:1). Theimplication is that these two types of nodes occur with a relative frequency of 2:1. A node of thefirst type (32434) is surrounded, in the given order, by two triangles, one square, one triangle andone square, while a node of the second type (3342) is surrounded by three triangles and two squares.
type is surrounded, in the given order, by two triangles, one square, one triangleand one square while a node of the second type is surrounded by three trianglesand two squares.
A close packed layer of atoms forms a 36 net composed of equilateral triangles.However, not all 36 nets of atoms correspond to close packed layers. To cite anexample, the triangles of 36 nets of bcc �110� layers are not equilateral but haveangles of 55o, 55o and 70o approximately. In the case of close packing (i.e. a 36
net comprising equilateral triangles), the nodes of one net lie over the centres of

Elsevier UK Code: PTA Ch01-I042145 5-6-2007 9:27a.m. Page:57 Trim:165mm×240mm Integra, India
Font:Times F.Size:11/13pt Margins: Top:19mm Gutter:19mm Width:128mm Depth:40 Lines 1 Color Recto
Phases and Crystal Structures 57
the triangles of the nets immediately above and below. Such a situation is notobtained in respect of the stacking of the triangles of the 36 nets of bcc �110�layers (Pearson 1972).
The morphologically triangular, 36 (close packed), hexagonal, 63, and kagome,3636, nets, together with those made up of squares, are of frequent structuraloccurrence. A 36 net can be subdivided into a 63 and a larger 36 net (the ratio ofnumber of sites being 2:1) or into a kagome net and a larger 36 net (the ratio ofnumber of sites being 3:1) (Pearson 1972). A primary classification of structuresin terms of the stacking of (nearly) planar layers of atoms is quite instructive. Forexample, numerous structures can be formed by the stacking of T, H or K (triangle–hexagon) layer nets of atoms one over the other sequentially. It is a characteristicof each such layer that it can be positioned about one of three equivalent sites, A,B and C, and this leads to the possibility of varying the stacking sequence and/orthe succession of the net types. Moreover, planes of atoms can be constituted ofa combination of different layer networks (e.g. hexagonal plus triangular), eachof which is occupied by a different chemical species. It is possible to derive avery large number of structure types by permuting the stacking and net sequences.Geometrically close packed (GCP) structures are obtained when the permutationinvolves only the stacking sequences of the equilateral triangular net. The numberof possible structure types may be further increased by chemically ordering thecomponent atoms on the triangular nets.
Other structures may be generated by stacking together layer networks ofatoms comprising only squares or squares along with triangles, pentagons and/orhexagons. The squares, pentagons or hexagons of one net may or may not becentred by atoms of nets above and below (Pearson 1972).
It is interesting to see how several frequently encountered structures in respectof Ti–X and Zr–X intermetallics can be described in terms of the stacking ofdifferent types of layer networks of atoms. Before that a brief introduction totopologically close packed (TCP) structures will be provided in view of the factthat quite a few of these intermetallic phases have such structures.
Octahedral and tetrahedral voids (Figure 1.20) are the two most common types ofinterstitial voids present in the simple spherically close packed (i.e. GCP) metallicstructures (fcc and hcp). The former are larger and are surrounded by six atomswhich form the corners of a triangular antiprism (octahedron). The latter, which aresmaller, are enclosed by four atoms which are tetrahedrally disposed. The primitiveunit cell of the hcp structure contains two atoms with coordinates (000) and ( 2
313
12 ).
There are thus two atoms associated with each lattice point. If the axial ratiohas the ideal value (c/a = �8/3�1/2), then the largest interstices (octahedral) havecoordinates ( 1
323
14 ) and ( 1
323
34 ). There are two such interstices per unit cell. The next
largest interstices (tetrahedral) occur at (00 38 ), (00 5
8 ), ( 23
13
18 ) and ( 2
313
78 ), there being

Elsevier UK Code: PTA Ch01-I042145 5-6-2007 9:27a.m. Page:58 Trim:165mm×240mm Integra, India
Font:Times F.Size:11/13pt Margins: Top:19mm Gutter:19mm Width:128mm Depth:40 Lines 1 Color Recto
58 Phase Transformations: Titanium and Zirconium Alloys
a 1
a 2
a 1
a 2
Atoms
Octahedral voids
Tetrahedral voids
120°
Figure 1.20. This figure shows the locations of octahedral and tetrahedral voids in the hcp structure.
four such interstices per unit cell. The region around a tetrahedral void representsthe densest packing of equal sized spheres; all topologically close packed structuresare characterized by exclusively tetrahedral voids which may be geometricallyimperfect because of the differences in the sizes of the component atoms (Sinha1972). The coordination polyhedron of an atom is defined by the lines joining thecentres of atoms in the shell of close neighbours around it. The coordination istwelve-fold in the cases of the fcc and hcp structures and the polyhedra formedby the twelve neighbours assume the shapes of a cubo-octahedron (fcc) and atwinned cubo-octahedron (hcp), respectively. In the case of the TCP structuresyet another type of twelve-fold coordination polyhedron, in which all the facesare triangular, becomes important. This polyhedron is the icosahedron which hastwenty faces in the shape of equilateral triangles and thirty edges which correspondto nearest neighbour distances. Each of the other two twelve-fold coordinationpolyhedra mentioned earlier has 24 edges. In the case of the icosahedron, thedistance between the central atom and any atom on the polyhedron surface isaround 10% smaller than that between the atoms on the surface. The atoms onthe icosahedron surface are more close packed than in the fcc or hcp structures;however, because of the five-fold symmetry axis associated with the icosahedron,it is not possible to have a lattice like arrangement made up solely of icosahedra(Sinha 1972).
The condition that only tetrahedral interstices may be present in a TCP structurebrings in the requirement that besides a number of atoms having an icosahedralenvironment, certain others with higher coordination polyhedra around them mustalso be present; thus TCP structures are characterized by some or all of CN 12,CN 14, CN 15 and CN 16 polyhedra (Kasper 1956). All these Kasper polyhedra

Elsevier UK Code: PTA Ch01-I042145 5-6-2007 9:27a.m. Page:59 Trim:165mm×240mm Integra, India
Font:Times F.Size:11/13pt Margins: Top:19mm Gutter:19mm Width:128mm Depth:40 Lines 1 Color Recto
Phases and Crystal Structures 59
have exclusively triangular faces and tetrahedral arrangement. The fractions ofsites with different coordination numbers change from structure to structure. Byway of illustration, let three TCP structures, be considered: A15 (cP8, Cr3Si type),C14 (hP12, MgZn2 type) and C15 (cF24, Cu2Mg type); in the first, 25% of thesites correspond to CN 12 and 75% to CN 14 while in either of the other (Lavesphase) structures, 67% of the sites correspond to CN 12 and 33% to CN 16(Sinha 1972). It has been pointed out (Frank and Kasper 1958, 1959) that thereis a significant consequence of there being, in a crystal structure, coordinationpolyhedra of CN 12, CN 14, CN 15 and CN 16 and exclusively tetrahedral voidsand this is that the resulting structure is generally a layered structure. In fact, mostof the TCP structures can be regarded as layered structures. The main atomiclayers, referred to as primary layers, are tesselated and contain arrays made up oftriangles, pentagons and hexagons. The triangular meshes in the primary layerscorrespond to the nearest neighbour atoms. Besides the primary layers, generallythere are secondary layers in which the coordination does not correspond to nearestneighbours (Sinha 1972). The layer stacking has, of course, to be effected in sucha manner that only tetrahedral interstices are present.
It has been mentioned in the previous section that certain structures are quitefrequently encountered in respect of Ti–X and Zr–X intermetallic phases. A briefaccount will now be presented to illustrate how these structures can be viewedin terms of the layer stacking sequence representation. The two atomic speciesconsidered will be designated as X and Z.
First, the case of superstructures based on close packed layers stacked in closepacking will be taken up. If X and Z are each on a 44 subnet in each closepacked layer, then a family of polytypic structures with XZ stoichiometry and arectangular arrangement of the components in close packed layers is obtained. Anexample of such a structure is the L1o (tP4, AuCu type) structure. This structurecan also be described in terms of stacking alternate 44 layers of X and Z atomsin succession in the [001] direction. One can next consider the case of XZ3
stoichiometry in each close packed layer, with X atoms on a 36 subnet and Z atomson a 3636 subnet. A family of polytypic structures with a triangular arrangementof X atoms is obtained. The L12 (cP4, AuCu3 type) and D019 (hP8, Ni3Sn type)structures belong to this family. In the former, the close packed layers, which lienormal to the [111] direction, are stacked in the sequence ABCABC� � � so that alllayers are surrounded cubically. In the latter, the close packed layers are arrangedin hexagonal ABAB� � � , stacking. The D019 structure is a hexagonally stackedprototype of the L12 structure. It is thus a superstructure of the hcp (hP2) structurein the same way as the L12 structure is of the fcc (cF4) structure (Pearson 1972).
Some superstructures based on bcc packing may now be considered. If oneconsiders the XZ stoichiometry, with X atoms on 44 nets and Z atoms also on 44

Elsevier UK Code: PTA Ch01-I042145 5-6-2007 9:27a.m. Page:60 Trim:165mm×240mm Integra, India
Font:Times F.Size:11/13pt Margins: Top:19mm Gutter:19mm Width:128mm Depth:40 Lines 1 Color Recto
60 Phase Transformations: Titanium and Zirconium Alloys
nets, one arrives at the B2 (cP2, CsCl type) structure. In this structure one speciesoccupies the cube corners and the other the body centre, so that alternate layers ofthe two species occur along <100> directions. The X and Z atoms together formtriangular nets parallel to �110� planes with X occupying one of the rectangular 44
subnets resulting from the geometry of the triangles of the 36 net, and Z occupyingthe other. Next, let the case of the XZ2 stoichiometry be taken up. If one considers36 close packed layers in bcc [110] stacking with Z atoms on a 63 subnet and Xatoms on a larger 36 subnet, one arrives at a family of polytypic structures XZ2
with close packed layers stacked in bcc sequence. The C11b (tI6, MoSi2 type)structure belongs to this family.
The C16 (tI12, CuAl2 type) structure can be visualized as being made up ofsquare-triangle, 32434 nets of Z atoms at z = 0 and z = 1
2 which are orientedantisymmetrically with respect to each other; the squares in these Z layers whichlie over the cell corners and basal face centre, are centred by a 1
2 44 net of X atoms
at z = 14 and z = 3
4 (Pearson 1972).Even though many structures contain atoms in triangular prismatic coordination,
there are some in which this is the main feature of the atomic arrangement. Inone class of such structures, 36 and 63 nets of atoms, occupying the same stackingsequence, are stacked alternately in the “paired-layer” sequence (e.g. AaAa). TheC32 (hP3, AlB2 type) structure can be regarded as the prototype of this family ofstructures and one of the simpler structures obtained from this structure is the Bf
(oC8, CrB type) structure, which is made up of independent layers of triangularprisms of X atoms parallel to the (010) plane with the prism axes oriented inthe [100] direction. The prisms are centred by atoms which form zigzag chainsrunning in the [001] direction (Pearson 1972).
An example of structures generated by the stacking of pentagon-triangle nets ofatoms is the D88 (hP16, Mn5Si3 type) structure.
In the tetrahedrally close packed A15 (cP8, Cr3Si type) structure of XZ3 stoi-chiometry, the X atoms form a bcc array and lines of Z atoms run throughout thestructure parallel to the edges of the body centred cell formed by the X atoms.This structure is of the Frank–Kasper type and can be visualized as being formedby the alternate stacking of primary triangle-hexagon 3262 +3636 (2:1) layers andsecondary 44 layers, with the result that each X atom is surrounded icosahedrallyby 12 Z atoms and each Z atom is surrounded by four X atoms and 10 Z atomsin a CN 14 polyhedron with triangular faces.
The Laves phase structures have XZ2 stoichiometry and belong to a familyof polytypic structures in which three closely spaced 36 nets of atoms are fol-lowed by a 3636 kagome net parallel to the (001) plane when the structures aredescribed in terms of a hexagonal cell. The former types of nets are stacked onthe same sites as the latter. Alternatively, the Laves phases can be visualised

Elsevier UK Code: PTA Ch01-I042145 5-6-2007 9:27a.m. Page:61 Trim:165mm×240mm Integra, India
Font:Times F.Size:11/13pt Margins: Top:19mm Gutter:19mm Width:128mm Depth:40 Lines 1 Color Recto
Phases and Crystal Structures 61
as having Frank–Kasper structures in which pentagon–triangle primary layers ofatoms are stacked alternately, parallel to the (110) planes of the hexagonal cell,with secondary 36 triangular layers whose atoms centre the pentagons of the mainlayers (Pearson 1972). Thus, the C14 (hP12, MgZn2 type) structure is generatedby stacking together pairs of primary pentagon–triangle 3535 + 353 (2:3) layersand secondary 36 layers parallel to the (110) plane. The cubic C15 (cF24, MgCu2
type) structure can also be regarded as being built up by stacking consecutivelythree triangular (36) layers and a kagome (3636) layer of atoms which lie in planesnormal to the [111] direction in respect of the cubic cell. Each X atom is sur-rounded by a CN 16 polyhedron of 12 Z and four X atoms while each Z atom isicosahedrally enclosed by six X and six Z atoms.
1.7.3 Derivation of intermetallic phase structures from simple structuresThe structures of many intermetallics can be regarded as being derived from threesimple structures, namely, fcc (A1), bcc (A2) and hcp (A3) structures, which arecommonly associated with pure metals and disordered metallic solid solutions.The most common structures exhibited by binary intermetallic phases are listed inTable A1.4 (Ferro and Saccone 1996).
Typical intermetallic phase structures derived from the fcc structure include L12
(cP4, AuCu3 type), C15b (cF24, AuBe5 type), L′12 (cP5, Fe3AlC type), D022 (tI8,TiAl3 type), L1o (tP4, AuCu type), D1a (tI10, Ni4Mo type), L11, (hR32, CuPt type)and Pt2Mo type (oI6) structures (Pitsch and Inden 1991, Sauthoff 1996). Generallythese structures are cubic, tetragonal (often with an axial ratio close to unity),rhombohedral or orthorhombic. Examples of intermetallic phases with some ofthese structures in Ti–X and Zr–X systems are: TiCo3, TiIr3, �′-TiNi3, �-TiPt3,TiRh3, TiZn3, Zr3Al, ZrHg3, Zr3In, ZrIr3, ZrPt3, ZrRh3�L12�; ZrNi5�C15b�; TiAl3,TiGa3, �-ZrIn3�D022�; TiAl, �′′-TiCu3, TiGa, TiHg, Ti3In2, �-TiRh, ZrHg (L1o);and TiAu4, �-TiCu4, TiPt8�D1a�.
Common intermetallic phase crystal structures derived from the bcc structureincldue B2 (cP2, CsCl type), B32 (cF16, NaTl type), D03 (cF16, BiF3 type), andL21 (cF16, Cu2AlMn type) structures. (Pitsch and Inden 1991, Sauthoff 1996).Generally these structure are cubic. Examples of intermetallic phases with theB2 structure in Ti–X and Zr–X systems are: �-TiAu, TiBe, TiCo, TiFe, �-TiIr,TiNi, TiOs, �-TiPd, �-TiPt, �-TiRh, TiRu, TiTc, TiZn, S-ZrCo, ZrCu, ZrIr, ZrOs,�-ZrPt, �-ZrRh, ZrRu and ZrZn. Intermetallics with other bcc-based structures arerare in these systems.
Prominent among the intermetallic phase crystal structures derived from thehcp structure are: Bh (hP2, WC type), D019 (hP8, Ni3Sn type), B19 (oP4, AuCdtype), C49 (oC12, ZrSi2 type) and D0a (oP8, �-Cu3Ti type) structures. Generally,these structures are hexagonal or orthorhombic. Examples of intermetallic phases

Elsevier UK Code: PTA Ch01-I042145 5-6-2007 9:27a.m. Page:62 Trim:165mm×240mm Integra, India
Font:Times F.Size:11/13pt Margins: Top:19mm Gutter:19mm Width:128mm Depth:40 Lines 1 Color Recto
62 Phase Transformations: Titanium and Zirconium Alloys
with these structures in Ti–X and Zr–X systems include Zr3Se2�Bh�; Ti3Al, Ti3Ga,Ti3In, Ti4Pd, Ti4Sb, Ti3Sn, Zr3Co, ZrNi3�D019�; �-TiAu, �-TiPd, �-TiPt (B19);ZrGe2, ZrSi2 (C49); and �-TiCu3, ZrAu3�D0a�.
1.7.4 Intermetallic phases with TCP structures in Ti–Xand Zr–X systems
It has been mentioned earlier that quite a few of the intermetallic phases occurringin Ti–X and Zr–X systems have topologically closed packed (TCP) structures.These phases are mostly A15 (cP8, Cr3Si type) phases or Laves phases (C14,C15 or C36 structures). Examples of such phases are: Ti3Au, Ti3Hg, Ti3Ir, Ti4Pd(stoichiometric), Ti3Pt, Ti3Sb, Zr3Au, Zr3Hg, Zr4Sn, Zr4Tl (A15); �-TiCr2, TiFe2,TiMn2, TiZn2ZrAl2, �-ZrCr2, ZrMn2, ZrRe2, ZrRu2, ZrTc2 (C14); TiBe2, TiCo2,�-TiCr2, �-ZrCr2, ZrFe2, ZrIr2, ZrMo2, ZrV2, ZrW2, ZrZn2 (C15); TiCo2, �-TiCr2
and �-ZrCr2 (C36, hP24, MgNi2 type). The phase Zr4Al3 (hP7) is also a TCPphase the structure of which can be described either in terms of pentagon–triangleprimary and 44 secondary nets parallel to the (110) plane, or with hexagon–triangleprimary and 36 secondary nets parallel to the (001) plane (Pearson 1972).
Some of the Laves phases mentioned above can absorb very significant quanti-ties of hydrogen and, for this reason, are considered for applications as hydrogenstorage materials. Reference must be made in this context to the phases ZrV2,ZrCr2, ZrMn2 and TiCr2 which exhibit high sorption capacities with hydrogen tometal ratio (H/M) values of 1.8, 1.3, 1.2 and 1.2, respectively (Sauthoff 1996).
1.7.5 Phase stability in zirconia-based systemsZirconia (ZrO2)-based systems are among the most extensively investigated ceram-ics in so far as phase transformation studies are concerned. Not only do theyexhibit interesting phase transformations, but also the properties of these ceram-ics can be engineered by suitably controlling the stability of different competingphases and by inducing phase transformations in a desired manner. In view of this,zirconia-based systems are pedagogically very appropriate systems for illustratinghow phase transformations can be effectively utilized for controlling microstruc-ture and, in turn, properties – mechanical, thermal, electrical and optical – ofceramics. Crystal structures and stability of different phases in zirconia ceramicsare briefly described in this section.
1.7.5.1 ZrO2 polymorphsPure ZrO2 exhibits three polymorphic forms under ambient pressure; these belong,respectively, to monoclinic, tetragonal and cubic crystal systems (Garvie 1970). Thecrystal structures and lattices parameters of these polymorphs are given in Table 1.18

Elsevier UK Code: PTA Ch01-I042145 5-6-2007 9:27a.m. Page:63 Trim:165mm×240mm Integra, India
Font:Times F.Size:11/13pt Margins: Top:19mm Gutter:19mm Width:128mm Depth:40 Lines 1 Color Recto
Phases and Crystal Structures 63
Table 1.18. Crystal structures and lattice parameters of zirconia polymorphs.
Phase Crystal structure Lattice parameters (nm)
Pearson symbol Space group
m-ZrO2 mP12 P21/c a = 0.5156b = 0.5191c = 0.5304� = 98 9o
t-ZrO2 tP6 P42/nmc a = 0.5094c = 0.5177
c/a = 1.016c-ZrO2 cF12 Fm3̄m a = 0.5124
(Stevens 1986, Massalski et al. 1992). The occurrence of an orthorhombic form ofZrO2 under high pressures has also been reported (Lenz and Heuer 1982).
The monoclinic phase (generally designated as m-ZrO2) is stable upto about1443 K where it transforms to the tetragonal phase (t-ZrO2) which is stable upto2643 K; at still higher temperatures, the cubic phase (c-ZrO2) is encountered whichis stable upto the melting temperature of 2953 K (Stevens 1986). Among thesethree phases, the monoclinic phase, has the lowest density.
In m-ZrO2, the Zr4+ ion has seven-fold coordination with O ions, with a rangeof Zr–O bond lengths and bond angles. The OII coordination is close to tetrahedralwith only one angle (134 3o) differing significantly from the angle of the tetrahe-dron (109 5o) while the OI coordination is triangular. The Zr ions are located inlayers parallel to (100) planes, separated by OI and OII ions on either side. Theaverage Zr–OI and Zr–OII distances are 0.207 and 0.221 nm, respectively (Stevens1986). Figure 1.21 shows a schematic of the idealized ZrO7 polyhedron.
Each Zr4+ ion in t-ZrO2 is surrounded by eight O ions. There is some distortion inthis eight-fold coordination due to the fact that while four of the O ions are at a dis-tance of 0.2065 nm, in the form of a flattened tetrahedron, the other four are at a dis-tance of 0.2455 nm in an elongated tetrahedron rotated through 90o (Stevens 1986).
The high temperature cubic phase, c-ZrO2, has the fcc fluorite (CaF2) typestructure, in which each Zr4+ ion is coordinated by eight equidistant O ions whichare arranged in two equal tetrahedra. A layer of ZrO8 groups in c-ZrO2 is shownin Figure 1.22.
1.7.5.2 Stabilization of high temperature polymorphsAn important concept which is often utilized in zirconia ceramics is to “alloy” pureZrO2 with another suitable oxide to fully or partially stabilize high temperaturepolymorphs of ZrO2 to lower temperatures.

Elsevier UK Code: PTA Ch01-I042145 5-6-2007 9:27a.m. Page:64 Trim:165mm×240mm Integra, India
Font:Times F.Size:11/13pt Margins: Top:19mm Gutter:19mm Width:128mm Depth:40 Lines 1 Color Recto
64 Phase Transformations: Titanium and Zirconium Alloys
a a
Zr
O
Figure 1.21. Schematic showing the idealised ZrO7 polyhedron pertinent to m-ZrO2.
Zr
O
II
II
I
II
IIII
Figure 1.22. This figure shows a layer of ZrO8 groups in c-ZrO2.
The tetragonal to monoclinic transformation, which is martensitic in nature, isaccompanied by a large (3–5%) volume expansion which is sufficient to exceedelastic and fracture limits even in relatively small grains of pure ZrO2 and can onlybe accommodated by cracking. A consequence of this is that the fabrication of largecomponents of pure ZrO2 is not possible due to spontaneous failure on cooling.

Elsevier UK Code: PTA Ch01-I042145 5-6-2007 9:27a.m. Page:65 Trim:165mm×240mm Integra, India
Font:Times F.Size:11/13pt Margins: Top:19mm Gutter:19mm Width:128mm Depth:40 Lines 1 Color Recto
Phases and Crystal Structures 65
The addition of cubic stabilizing oxides in appropriate amounts can permit thecubic polymorph to be stable over a wide range of temperatures: even from roomtemperature to its melting temperature. The oxides that are commonly used toform solid solutions with ZrO2 include MgO (magnesia), CaO (calcia) and REoxides such as Y2O3 (yttria) and CeO2 (ceria). These oxides exhibit extensive solidsolubility in ZrO2 and are able to form fluorite type phases which are stable overwide ranges of composition and temperature. If the amount of stabilizing oxideadded to ZrO2 is insufficient for complete stabilization of the cubic phase, then apartially stabilized zirconia (PSZ) is obtained rather than a fully stabilized form.The PSZ usually comprises a mixture of two or more phases. Both the cubic solidsolution and the tetragonal solid solution are present and the latter may transformto the monoclinic solid solution on cooling.
It may be mentioned here that the volume expansion associated with the tetrag-onal to monoclinic transformation may be used to advantage for improving tough-ness and strength. This aspect will be discussed in a later chapter. A relativelytough, partially stabilized zirconia ceramic, consisting of a dispersion of metastabletetragonal ZrO2 inclusions within large grains of stabilized cubic ZrO2, can bederived by inducing a stress induced tetragonal to monoclinic transformation.
An appraisal of the phase equilibria of zirconia with other oxide systems is veryimportant with regard to the application of zirconia as an engineering ceramic.However, many difficulties are encountered while determining the equilibriumphase diagrams of even the simplest binary zirconia systems. First, the reactionsin these systems at relatively low temperatures (<1680K) are somewhat sluggishowing to low diffusivity. Since diffusional reactions such as precipitation, eutectoiddecomposition and ordering proceed very slowly, equilibrium is often difficult toachieve. Secondly, coherency strain between different phases may influence theirrelative stabilities in two phase regions and may be responsible for the retentionof metastable phases. Finally, at high temperatures, the presence of impurities ornon-stoichiometry may influence the equilibria.
The salient features of binary phase diagrams of three important zirconia sys-tems, namely, ZrO2–MgO, ZrO2–CaO and ZrO2–Y2O3, are summarized in thefollowing sections.
1.7.5.3 ZrO2–MgO systemThe polymorphic transformations of pure ZrO2, the eutectoid decomposition ofthe fluorite type solid solution into a tetragonal solid solution and MgO (theeutectoid temperature and composition being ∼1673 K and and ∼13 mole % MgO,respectively), and a very limited (<1 mole %) solubility of MgO in tetragonalZrO2 at 1573K are some important data (Grain 1967) for the construction of thephase diagram which still remains somewhat tentative. The phase boundaries of

Elsevier UK Code: PTA Ch01-I042145 5-6-2007 9:27a.m. Page:66 Trim:165mm×240mm Integra, India
Font:Times F.Size:11/13pt Margins: Top:19mm Gutter:19mm Width:128mm Depth:40 Lines 1 Color Recto
66 Phase Transformations: Titanium and Zirconium Alloys
the fluorite type solid solution field at high temperatures, the solubility of MgO inmonoclinic ZrO2 and the occurrence of a eutectoid reaction in the tetragonal solidsolution field still appear to be uncertain (Stubican 1988).
In this system, the occurrence of a fluorite related ordered compound, Mg2Zr5O12
(28.57 mole % MgO) has been established but not the regime of its stability.The formation of another metastable ordered compound, MgZr6O13 (14.28 mole% MgO) has also been reported (Rossell and Hannink 1984).
1.7.5.4 ZrO2–CaO systemThe ZrO2-rich side of the ZrO2–CaO system in in some ways similar to that of theZrO2–MgO system in that the terminal cubic as well as tetragonal solid solutionphases decompose by eutectoid reactions. However, the solubility limits of CaOin both the tetragonal and monoclinic phases are considerably higher than thoseof MgO. Two ordered phases CaZrO9 (�1) and Ca6Zr19O44 (�2) have been foundto occur in this system and these are stable in the temperature ranges 1393 to1502 ± 15 K and 1398 to 1528 ± 15 K, respectively. The CaZrO3 phase exhibitsa polymorphic transformation at 2023 ± 30 K from a high temperature cubic toa lower temperature orthorhombic form. The presence of the two polymorphhsof the CaZrO3 phase and the ordered �1 and �2 phases introduces several phasereactions in the c-ZrO2 +CaZrO3 phase field. The ZrO2 rich side of the ZrO2–CaOphase diagram (Stubican 1988) is shown in Figure 1.23.
3270
2770
2270
1770
1270
7700 10 30 40 5020
Mol % CaO
Tem
pera
ture
(K
)
MT + M
TT + C
1413 K
M + φ(o)
φ2φ1φ2 + φ(o)1628 K
C + φ(o)
2023 K
C + φ(c)CC + L
L
L + φ
ZrO2 CaZrO3
Figure 1.23. The ZrO2-rich side of the ZrO2–CaO phase diagram. M, T and C stand, respectively,for the monoclinic, tetragonal and cubic (fluorite type) solid solutions and L for liquid; the symbols�, �(c), �(o), �1 and �2 represent the phases CaZrO3, CaZrO3 (cubic), CaZrO3 (orthorhombic),CaZrO9 and Ca6Zr19O44, respectively.

Elsevier UK Code: PTA Ch01-I042145 5-6-2007 9:27a.m. Page:67 Trim:165mm×240mm Integra, India
Font:Times F.Size:11/13pt Margins: Top:19mm Gutter:19mm Width:128mm Depth:40 Lines 1 Color Recto
Phases and Crystal Structures 67
0 2 4 6 8 10 12 14 16
Mol % Y2O3
2670
2070
1470
870
C + TC
T
M + T
M
M + C
M + ZYO
Tem
pera
ture
(K
)
Figure 1.24. This figure shows the solid state phase relations in the ZrO2 rich end of the ZrO2–Y2O3
phase diagram. M, T and C stand, in that order, for the monoclinic, tetragonal and cubic solidsolutions, while ZYO stands for the phase Zr3Y4O12.
1.7.5.5 ZrO2–Y2O3 systemThe low Y2O3 region of the ZrO2–Y2O3 system is very important for technologicalapplications. For this reason the subsolidus equilibria in this portion of the phasediagram have been examined extensively. Figure 1.24 depicts the phase relationsin the ZrO2-rich side of this system (Stubican 1988) subject to the possible limi-tations imposed by the fact that below ∼1500 K it is extremely difficult to attainequilibrium, even with reactive powders. The ordered compound, Zr3Y4O12, isstable up to 1655±5 K. At still higher temperatures, it disorders to a fluorite-typesolid solution.
REFERENCES
Abriata, J.P. and Bolcich, J.C. (1982) Bull. Alloy Phase Diagrams, 3 (1), 33.Abriata, J.P., Garces, J. and Versaci, R. (1986) Bull. Alloy Phase Diagrams, 7 (2), 116.Abriata, J.P., Bolcich, J.C. and Arias, D. (1988) Bull. Alloy Phase Diagrams, 4 (2), 147.Ageev, N.V. and Petrova, L.A. (1970) Science Technology and Application of Titanium
(eds R.I. Jaffee and N.E. Promisel) Pergamon Press, Oxford, p. 809.Ahuja, R., Wills, J.M., Johansson, B. and Eriksson, O. (1993) Phys. Revi. B, 48 (22),
16269.Arias, D. and Abriata, J.P. (1988) Bull. Alloy Phase Diagrams, 9 (5), 597.Bagariatskii, Y.A., Nosova, G.I. and Tagunova, T.V. (1959) Sov. Phys. Dokl., 3, 1014.Balcerzak, A.T. and Sass, S.L. (1972) Metall. Trans., 3, 1601.

Elsevier UK Code: PTA Ch01-I042145 5-6-2007 9:27a.m. Page:68 Trim:165mm×240mm Integra, India
Font:Times F.Size:11/13pt Margins: Top:19mm Gutter:19mm Width:128mm Depth:40 Lines 1 Color Recto
68 Phase Transformations: Titanium and Zirconium Alloys
Banerjee, S. (1994) Solid → Solid Phase Transformations in Inorganic Materials (edsW.C. Johnson, J.M. Howe, D. Laughlin and W.A. Soffa) TMS, Warrendale, PA, p. 861.
Banerjee, S., Vijayakar, S.J. and Krishnan, R. (1976) J. Nucl. Mater., 62, 229.Banerjee, S., Tewari, R. and Mukhopadhyay, P. (1997) Prog. Mater. Sci., 42 (1–4), 109.Binder, K. (1986) Monte Carlo Methods in Statistical Physics, Springer, Berlin.Blackburn, M.J. (1970) The Science Technology and Application of Titanium (eds
R.I. Jaffee and N.E. Promisel) Pergamon Press, Oxford, p. 633.Bundy, F.P. (1963) General Electric Report, 63-RL-3481C.Burgers, W.G. (1934) Physica, 1, 561.Car, R. and Parrinello, M. (1989) Simple Molecular Systems at Very High Density (eds
A. Polian P. Loubeyre and M. Boccara) Plenum Press, New York, p. 455.Ceperley, D. and Alder, B. (1986) Science, 231, 555.Chandrasekaran, V., Taggart, R. and Polonis, D.H. (1972) Metallography, 5, 393.Christian, J.W. (1979) Phase Transformations, Vol.1, Institute of Metallurgists,
London, p. 1.Collings, E.W. (1984) The Physical Metallurgy of Titanium Alloys, American Society for
Metals, Metals Park, OH.Collings, E.W. (1994) Materials Properties Handbook: Titanium Alloys (eds R. Boyer, G.
Welsch and E.W. Collings) ASM International, Materials Park, OH, p. 3.Collings, E.W. and Gegel, H.L. (1973) Scr. Metall., 7, 437.Collings, E.W. and Gegel, H.L. (1975) Physics of Solid Solution Strengthening (eds E.W.
Collings and H.L. Gegel) Plenum Press, New York, p. 147.Cook, H.E. (1975) Acta Metall., 23, 1027, 1041.Courtney, T.H. and Wulff, J. (1969) Mater. Sci. Eng., 4, 93.Dawson, C.W. and Sass, S.L. (1970) Metall. Trans., 1, 2225.Douglass, D.L. (1971) The Metallurgy of Zirconium, International Atomic Energy Agency,
Vienna.Duthie, J.C. and Pettifor, D.G. (1977) Phys. Rev. Lett., 38, 564.Faulkner, J.S. (1982), Prog. Mater. Sci., 27, 1.Fisher, E.S. (1975) Physics of Solid Solution Strengthening (eds E.W. Collings and
H.L. Gegel) Plenum Press, New York, p. 199.Fisher, E.S. and Dever, D. (1970) Acta Metall., 18, 265.Flower, H.M., Davis, R. and West, D.R.F. (1982) Titanium and Titanium Alloys, Scientific
and Technological Aspects (eds J.C. Williams and A.F. Belov) Plenum Press, New York,p. 1703.
Ferro, R. and Saccone, A. (1996) Physical Metallurgy, Vol. 1 (eds R.W. Cahn andP. Haasen) North-Holland, Amsterdam, p. 205.
de Fontaine, D., Paton, N.E. and Williams, J.C. (1971) Acta Metall., 19, 1153.Frank, F.C. and Kasper, J.S. (1958) Acta Crystallo., 11, 184.Frank F.C. and Kasper, J.S. (1959) Acta Crystallo., 12, 483.Froes, F.H., Yau, T.L. and Weidinger, H.G. (1996) Materials Science and Technology,
Vol. 8 (eds R.W. Cahn, P. Haasen and E.J. Kramer) VCH Publishers, New York, p. 399.

Elsevier UK Code: PTA Ch01-I042145 5-6-2007 9:27a.m. Page:69 Trim:165mm×240mm Integra, India
Font:Times F.Size:11/13pt Margins: Top:19mm Gutter:19mm Width:128mm Depth:40 Lines 1 Color Recto
Phases and Crystal Structures 69
Garvie, R.C. (1970) High Temperature Oxides Part II (ed. A.M. Alper) Academic Press,London, p. 117.
Gaunt, P. and Christian, J.W. (1959) Acta Metall., 7, 534.Grain, C.F. (1967) J. Am. Ceram. Soc., 50 (6), 288.Guillermet, F.A. (1987) High Tempe. High Press., 19, 119.Gyanchandani, J.S., Gupta, S.C., Sikka, S.K. and Chidambaram, R. (1990) J. Phys.: Conde.
Matt., 2, 301.Gyorffy, B.L., Pinski, F.J., Ginatempo, B., Johnson, D.D., Staunton, J.B., Shelton, W.A.,
Nicholson, D.M. and Stocks, G.M. (1992) Structural and Phase Stability of Alloys(eds J.L. Moran-Lopez, F. Meja-Lira and J.M. Sanchez) Plenum Press, New York,p. 167.
Hammond, C. and Kelly, P.M. (1970) The Science Technology and Application of Titanium(eds R.I. Jaffee and N.E. Promisel) Pergamon Press, Oxford, p. 659.
Harrison, W.A. (1980) Electronic Structure and the Properties of Solids, W.H. Freeman,San Francisco.
Hatt, B.A. and Rivlin, V.G. (1968) J. Phys. D: Appl. Phys., 1, 1145.Hickman, B.S. (1969) J. Mater. Sci., 4, 554.Ho, K.M., Fu, C.L., Harmon, B.N., Weber, W. and Hamann, D.R. (1982) Phys. Rev. Lett.,
49, 673.Hoover, W.G. (1986) Molecular Dynamics, Springer, Berlin.Jayaraman, A., Klement, W. and Kennedy, G.C. (1963) Phys. Rev., 131, 644.Jepson, K.S., Brown, A.R.G. and Gray, J.A. (1970) The Science Technology and Applica-
tion of Titanium (eds R.I. Jaffee and N.E. Promisel) Pergamon Press, Oxford, p. 677.Kasper, J.S. (1956) Theory of Alloy Phases, American Society of Metals, Metals Park,
OH, p. 264.Kaufman, L. (1959) Acta Metall., 7, 575.Kaufman, L. and Bernstein, H. (1970) Computer Calculations of Phase Diagrams, Aca-
demic Press, London.Kaufman, L. and Nesor, H. (1973) Titanium Science and Technology (eds R.I. Jaffee and
H.M. Burte) Plenum Press, New York, p. 773.Kelly, A. and Groves, G.W. (1970) Crystallography and Crystal Defects, Longman,
London.Kiselev, A.N. and Falkov, A.A. (1982) Combust. Explos. Shock Waves, 18, 94.Kubachewski, O., Alcock, C.B. and Spencer, P.J. (1993) Materials Thermochemistry,
Pergamon Press, Oxford.Kutsar, A.R., Pavlovskii, M.N. and Komissarov, V.V. (1982) JETP Lett., 35, 108.Kutsar, A.R., Pavlovskii, M.N. and Komissarov, V.V. (1984) JETP Lett., 39, 480.Lenz, L.K. and Heuer, A.H. (1982) J. Am. Ceram. Soc., 65 (11), 192.Liu, Y.C. (1956) Trans. AIME., 206, 136.Luke, C.A., Taggart, R. and Polonis, D.H. (1965) J. Nucl. Mater., 16, 7.Margolin, H. and Nielsen, J.P. (1960) Modern Materials, Advances in Development and
Application, Vol. 2 (ed. H.H. Hausner) Academic Press, New York, p. 225.

Elsevier UK Code: PTA Ch01-I042145 5-6-2007 9:27a.m. Page:70 Trim:165mm×240mm Integra, India
Font:Times F.Size:11/13pt Margins: Top:19mm Gutter:19mm Width:128mm Depth:40 Lines 1 Color Recto
70 Phase Transformations: Titanium and Zirconium Alloys
Massalski, T.B., Okamoto, H., Subramanian, P.R. and Kacprzak, L. (1992) Binary AlloyPhase Diagrams, ASM International, Materials Park, OH.
Massalski, T.B. (1996) Physical Metallurgy, Vol. 1 (ed. R.W. Cahn and P. Haasen) North-Holland, Amsterdam, p. 135.
McAuliffe, C.A. and Bricklebank, N. (1994) Encyclopedia of Inorganic Chemistry, Vol. 8(ed. R.B. King) John Wiley, Chichester, UK, p. 4197.
McCabe, K.K. and Sass, S.L. (1971) Philos. Mag., 23, 957.McQueen, R.G., Marsh, S.P., Taylor, J.W., Fritz, J.N. and Carter, W.J. (1970) High
Velocity Impact Phenomena (ed. R. Kinslow) Academic Press, New York, p. 344.McQuillan, M.K. (1963) Metall. Rev., 8, 41.Menon, E.S.K., Banerjee, S. and Krishnan, R. (1978) Metall. Trans., 9A, 1213.Menon, E.S.K., Mukhopadhyay, P., Banerjee, S. and Krishnan, R. (1979) Z. Metallkunde,
70, 168.Molchanova, E.K. (1965) Phase Diagrams of Titanium Alloys, (Israel Program for Scien-
tific Translations, Jerusalem.Mukhopadhyay, P., Menon, E.S.K., Banerjee, S. and Krishnan, R. (1978) Z. Metallkunde,
69, 725.Murray, J.L. (1987) Phase Diagrams of Binary Titanium Alloys, American Society of
Metals, Metals Park, OH, p. 12.Murray, Z., Peruzzi, A. and Abriata, J.P. (1992) J. Phase Equilib., 13 (3), 277.Myron, H.W., Freeman, A.J. and Moss, S.C. (1975) Solid State Commün., 17, 1467.Nakano, O., Sasano, H., Suzuki, T. and Kimura, H. (1980) Titanium ’80: Science and
Technology, Vol. 2, (eds H. Kimura and O. Izumi) The Metallurgical Society of AIME,Warrendale, p. 2889.
Okamoto, H. (1992) J. Phase Equilib., 13 (5), 578.Okamoto, H. (1993a) J. Phase Equilib., 14 (2), 266.Okamoto, H. (1993b) J. Phase Equilib., 14 (1), 120.Okamoto, H. (1993c) J. Phase Equilib., 14 (5), 652.Okamoto, H. (1993d) J. Phase Equilib., 14 (2), 259.Okamoto, H. (1993e) J. Phase Equilib., 14 (4), 536.Okamoto, H. (1994) J. Phase Equilib., 15 (6), 225.Okamoto, H. (2002) J. Phase Equilib., 23 (5) 455.Otte, H.M. (1970) The Science Technology and Application of Titanium (eds R.I. Jaffee
and N.E. Promisel) Pergamon Press, Oxford, p. 645.Parrinello, M. and Rahman, A. (1981) J. Appl. Phys., 52, 7182.Partington, J.R. (1957) An Advanced Treatise on Physical Chemistry, Vol. 3, Longmans,
London, p. 494.Pearson, W.B. (1972) The Crystal Chemistry and Physics of Metals and Alloys, Wiley-
Interscience, New York.Petrova, L.A. (1962) Izvestiya Akademii Nauk SSSR, 6, 159.Pettifor, D.G. (1977) CALPHAD, 1, 305.Pettifor, D.G. (1996) Physical Metallurgy, Vol. 1 (eds R.W. Cahn and P. Haasen) North-
Holland, Amsterdam, p. 47.

Elsevier UK Code: PTA Ch01-I042145 5-6-2007 9:27a.m. Page:71 Trim:165mm×240mm Integra, India
Font:Times F.Size:11/13pt Margins: Top:19mm Gutter:19mm Width:128mm Depth:40 Lines 1 Color Recto
Phases and Crystal Structures 71
Phillips, J.C. (1991) Electronic Materials: A New Era in Materials Science (eds J.R.Chelikowsky and A. Franciosi) Springer Verlag Series in Solid State Science, Vol. 95,Springer, Berlin, p. 287.
Pitsch, W. and Inden, G. (1991) Materials Science and Technology, Vol. 5 (eds R.W.Cahn, P. Haasen and E.J. Kramer) VCH Publishers, New York, p. 497.
Raju, S., Mohandas, E. and Raghunathan, V.S. (1995) Advances in Physical Metallurgy(eds S. Banerjee and R.V. Ramanujan) Gordon and Breach, Amsterdam, p. 392.
Raju, S., Mohandas, E. and Raghunathan, V.S. (1996) Materials Transactions, JIM,37 (3), 195.
Rossell, H.J. and Hannink, R.H.J. (1984) Advances in Ceramics, Vol. 12 (eds N. Claussen,M. Ruhle and A.H. Heuer) The American Ceramic Society, Columbus, OH, p. 139.
Roy, R. (1973) Phase Transitions (ed. L.E. Cross) Pergamon Press, Oxford, p. 13.Sanchez, J.M. (1992) Structural and Phase Stability of Alloys (eds J.L. Moran-Lopez,
F. Meja-Lira and J.M. Sanchez) Plenum Press, New York, p. 151.Sanchez, J.M. and de Fontaine, D. (1975) Phys. Rev. Lett., 35, 227.Sass, S.L. (1972) J. Less-Common Metals, 28, 157.Sauthoff, G. (1996) Materials Science and Technology, Vol. 8 (eds R.W. Cahn, P. Haasen
and E.J. Kramer) VCH Publishers, New York, p. 642.Shibata, M. and Ono, K. (1977) Acta Metall., 25, 35.Sikka, S.K, Vohra, Y.K. and Chidambaram, R. (1982) Prog. Mater. Sci., 27, 246.Silcock, J.M. (1958) Acta Metall., 6, 481.Simmons, A.L. and Varma, C.M. (1980) Solid State Commun., 35, 317.Sinha, A.K. (1972) Prog. Mater. Sci., 15 (2), 79.Skriver, H.L. (1984) The LMTO Method, Springer, Berlin.Skriver, H.L. (1985) Phys. Rev., B 31, 1909.Solveichik, G.L. (1994) Encyclopedia of Inorganic Chemistry, Vol. 8 (ed. R.B. King) John
Wiley, Chichester, UK, p. 4475.Steurer, W. (1996) Physical Metallurgy, Vol. 1 (eds R.W. Cahn and P. Haasen) North-
Holland, Amsterdam, p. 1.Stevens, R. (1986) Zirconia and Zirconia Ceramics, Magnesium Elektron Ltd., Manchester,
p. 12.Stubican, V.S. (1988) Advances in Ceramics, Vol. 24A (eds S. Somiya, N. Yamamoto and
H. Yanagida) The American Ceramic Society, Westerville, OH, p. 71.Terauchi, S., Matsumoto, H., Sugimoto, T. and Kamei, K. (1978) Technical Report, Kansai
University, 19, 61.Vohra, Y.K., Olijnyk, H., Grosshans, W. and Holzapfel, W.B. (1982) High Pressure in
Research and Industry (eds C.M. Backmann, T. Johannisson and L. Tegner) Arkitek-tkopia, Uppsala, p. 354.
Wayman, C.M. (1964) Introduction to the Crystallography of Martensitic Transformations,Macmillan, New York.
Williams, J.C. (1973) Titanium Science and Technology (eds K.C. Russell and H.I.Aaronson) The Metallurgical Society of AIME, Warrendale, PA, p. 191.
Williams, J.C., Hickman, B.S. and Leslie, D.H. (1971) Metall. Trans., 2, 477.

Elsevier UK Code: PTA Ch01-I042145 5-6-2007 9:27a.m. Page:72 Trim:165mm×240mm Integra, India
Font:Times F.Size:11/13pt Margins: Top:19mm Gutter:19mm Width:128mm Depth:40 Lines 1 Color Recto
72 Phase Transformations: Titanium and Zirconium Alloys
Wood, R.A. (1972) Titanium Alloys Handbook Metals and Ceramics Information Centre,Battelle, Columbus, OH, Publication No. MCIC-HB-02.
Xia, H., Parthasarathy, G., Luo, H., Vohra, Y.K. and Ruoff, A.L. (1990a) Phys. Rev.,842, 6736.
Xia, H., Duclos, S.J., Ruoff, A.L. and Vohra, Y.K. (1990b) Phys. Rev. Lett., 64, 204.Young, D.A. (1991) Phase Diagrams of the Elements, University of California Press,
Berkeley.Zilbershteyn, V.A., Nosova, G.I. and Estrin, E.I. (1973) Phys. Metals Metallogr., 35, 128.Zilbershteyn, V.A., Chistotina, N.P., Zharov, A.A., Grishina, N.S. and Estrin, E.I. (1975)
Physics of Metals and Metallography, 39, 208.Zuzek, E., Abriata, J.P., San-Martin, A. and Manchester, F.D. (1990) Bull. Alloy Phase
Diagrams, 11 (4), 385.
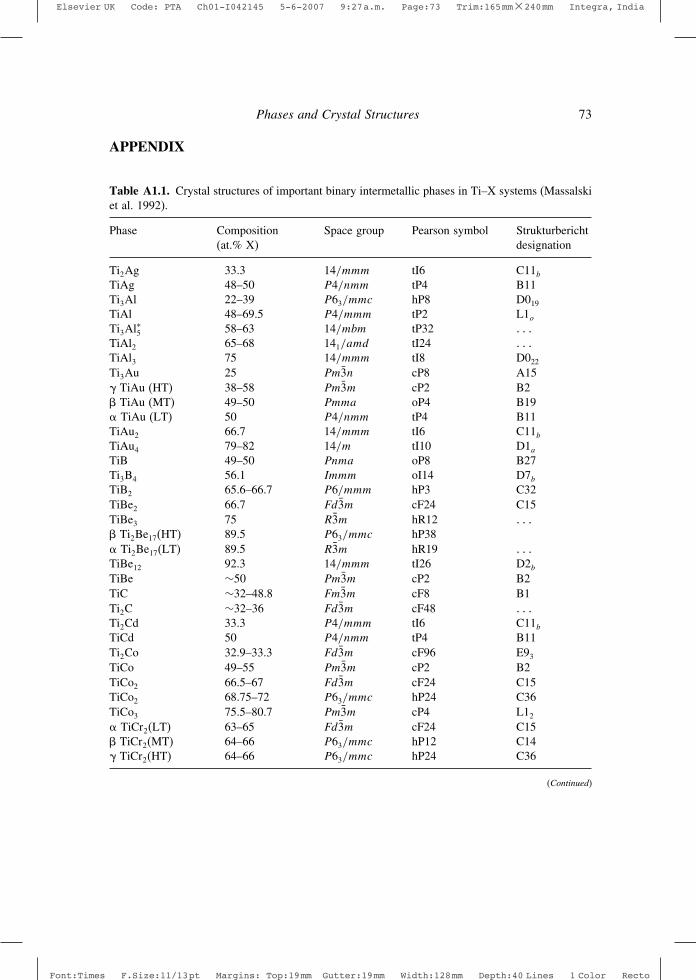
Elsevier UK Code: PTA Ch01-I042145 5-6-2007 9:27a.m. Page:73 Trim:165mm×240mm Integra, India
Font:Times F.Size:11/13pt Margins: Top:19mm Gutter:19mm Width:128mm Depth:40 Lines 1 Color Recto
Phases and Crystal Structures 73
APPENDIX
Table A1.1. Crystal structures of important binary intermetallic phases in Ti–X systems (Massalskiet al. 1992).
Phase Composition(at.% X)
Space group Pearson symbol Strukturberichtdesignation
Ti2Ag 33.3 14/mmm tI6 C11b
TiAg 48–50 P4/nmm tP4 B11Ti3Al 22–39 P63/mmc hP8 D019
TiAl 48–69.5 P4/mmm tP2 L1o
Ti3Al∗5 58–63 14/mbm tP32 � � �TiAl2 65–68 141/amd tI24 � � �TiAl3 75 14/mmm tI8 D022
Ti3Au 25 Pm3̄n cP8 A15� TiAu (HT) 38–58 Pm3̄m cP2 B2� TiAu (MT) 49–50 Pmma oP4 B19� TiAu (LT) 50 P4/nmm tP4 B11TiAu2 66.7 14/mmm tI6 C11b
TiAu4 79–82 14/m tI10 D1a
TiB 49–50 Pnma oP8 B27Ti3B4 56.1 Immm oI14 D7b
TiB2 65.6–66.7 P6/mmm hP3 C32TiBe2 66.7 Fd3̄m cF24 C15TiBe3 75 R3̄m hR12 � � �� Ti2Be17(HT) 89.5 P63/mmc hP38� Ti2Be17(LT) 89.5 R3̄m hR19 � � �TiBe12 92.3 14/mmm tI26 D2b
TiBe ∼50 Pm3̄m cP2 B2TiC ∼32–48.8 Fm3̄m cF8 B1Ti2C ∼32–36 Fd3̄m cF48 � � �Ti2Cd 33.3 P4/mmm tI6 C11b
TiCd 50 P4/nmm tP4 B11Ti2Co 32.9–33.3 Fd3̄m cF96 E93
TiCo 49–55 Pm3̄m cP2 B2TiCo2 66.5–67 Fd3̄m cF24 C15TiCo2 68.75–72 P63/mmc hP24 C36TiCo3 75.5–80.7 Pm3̄m cP4 L12
� TiCr2(LT) 63–65 Fd3̄m cF24 C15� TiCr2(MT) 64–66 P63/mmc hP12 C14� TiCr2(HT) 64–66 P63/mmc hP24 C36
(Continued)

Elsevier UK Code: PTA Ch01-I042145 5-6-2007 9:27a.m. Page:74 Trim:165mm×240mm Integra, India
Font:Times F.Size:11/13pt Margins: Top:19mm Gutter:19mm Width:128mm Depth:40 Lines 1 Color Recto
74 Phase Transformations: Titanium and Zirconium Alloys
Table A1.1. (Continued)
Phase Composition(at.% X)
Space group Pearson symbol Strukturberichtdesignation
Ti3Cu 25 P4/mmm tP4 L6o
Ti2Cu 33.3 I4/mmm tI6 C11b
TiCu 48–52 P4/nmm tP4 B11Ti3Cu4 57.1 I4/mmm tI14 � � �Ti2Cu3 60 P4/nmm tP10 � � �TiCu2 66.7 Amm2 oC12 � � �TiCu4 78–80.9 Pnma oP20� TiCu4 ∼78–∼80.9 I4/m tI10 D1aTiCu∗
3 � � � Pmmn oP8 D0a
Ti–Cu �′′ phase∗ � � � P4/mmm tP2 L1o
TiFe 48–50.2 Pm3̄m cP2 B2TiFe2 64.5–72.4 P63/mmc hP12 C14Ti3Ga 25 P63/mmc hP8 D019
Ti2Ga 33.3 P63/mmc hP6 B82
Ti5Ga∗3 37.5 14/mcm tI32 D8m
Ti5Ga∗4 44.4 P64/mcm hP18 � � �
TiGa∗ 50 P4/mmm tP2 L1o
Ti3Ga∗5 62.5 P4/mbm tP32 � � �
TiGa3 75 14/mmm tI8 D022
Ti5Ge3 37.5 P63/mcm hP16 D88
TiGe2 66.7 Fddd oF24 C54� hydride 1.05–2.0 Fm3̄m cF12 C1� hydride 1.72–2.0 I4/mmm tI2 L′2b
� hydride∗ 0.01–0.03 P42/n tP6 � � �
Ti3Hg 25 Pm3̄n cP8 A15TiHg 50 P4/mmm tP2 L1o
Ti3In >21 P63/mmc hP8 D019
Ti3In2 � � � P4/mmm tP2 L1o
Ti3Ir 25–27 Pm3̄n cP8 A15� TiIr 35–57.5 Pm3̄m cP2 B2TiIr3 73–77 Pm3̄m cP4 L12
TiMn2 60–70 P63/mmc hP12 C14TiMn4 81.5 R3̄m hR53 � � �Ti2N ∼33 P42/mnm tP6 C4TiN 28 to > 50 Fm3̄m cF8 B1�′ nitride ∼38 I41/amd tI12 Cc
Ti2Ni 33.3 Fd3̄m cF96 � � �
TiNi 49.5–57 Pm3̄m cP2 B2TiNi3 75 P63/mmc hP16 D024
�′ TiNi∗3 ∼83–88 Pm3̄m cP4 L12
Ti3O ∼20–∼30 P3̄1c hP ∼ 16 � � �
Ti2O ∼25–33.4 P3̄m1 hP3 � � �
� TiO 34.9–55.5 Fm3̄m cF8 B1

Elsevier UK Code: PTA Ch01-I042145 5-6-2007 9:27a.m. Page:75 Trim:165mm×240mm Integra, India
Font:Times F.Size:11/13pt Margins: Top:19mm Gutter:19mm Width:128mm Depth:40 Lines 1 Color Recto
Phases and Crystal Structures 75
Table A1.1. (Continued)
Phase Composition(at.% X)
Space group Pearson symbol Strukturberichtdesignation
Ti3O2 ∼40 P6/mmm hP ∼ 5 � � �
Ti2O3 59.8–60.2 R3̄c hR30 D51
Rutile ∼66.7 P42/mnm tP6 C4Anatase∗ � � � I41/amd tI12 C5Brookite∗ � � � Pbca oP24 C21TiOs 38–51 Pm3̄m cP2 B2Ti3P 25 P42/n tP32 � � �Ti5P3 ∼36–∼ 39 P63/mcm hP16 D88
TiP 48–50 P63/mmc hP8 Bi
TiP2 66.7 I4/mcm tI12 C16Ti4Pb ∼20 P63/mmc hP8 D019
Ti4Pd 20 Pm3̄n cP8 A15Ti2Pd 33.3 I4/mmm tI6 C11b
� TiPd (HT) 47–53 Pm3̄n cP2 B2� TiPd (LT) 47–53 Pmma oP4 B19Ti2Pd3 60 Cmcm oC20 � � �Ti3Pd5 62.5 P4/mmm tP8 ∼C11bTiPd2 65–67 I4/mmm tI6 C11b
TiPd3 75 P63/mmc hP16 D024
Ti–Pd � phase 75–84 P4/mmm cP4 L12
TiPo 50 P63/mmc hP4 B81
Ti3Pt 22–29 Pm3̄n cP8 A15� TiPt (HT) 46–54 Pm3̄m cP2 B2� TiPt (LT) 46–54 Pmma oP4 B19Ti3Pt5 62.5 Ibam 0I32 � � �TiPt3 <75 P63/mmc hP16 D024
Ti–Pt � phase 75–81 Pm3̄m cP4 L12
TiPt8 89–98 I4/m tI18 D1a
Ti5Re24 82.8 I 4̄3m cI58 A12Ti2Rh 33.3 I4/mmm tI6 C11b
� TiRh (HT) ∼38–58 Pm3̄m cP2 B2� TiRh (LT) ∼38–58 Pm3̄m tP2 L1o
Ti3Rh5 62.5 Pbam oP16 � � �
TiRh3 73–78 Pm3̄m cP4 L12
TiRu 45–52 Pm3̄m cP2 B2TiS ∼49.7 P63/mmc hP4 B81
TiS2 64.4–66.7 P3̄m1 hP3 C6TiS3 ∼75 P21/m mP8 � � �Ti4Sb >20.1–<25 P63/mmc hP8 D019
Ti3Sb 25 Pm3̄n cP8 A15TiSb 50 P63/mmc hP4 B81
(Continued)

Elsevier UK Code: PTA Ch01-I042145 5-6-2007 9:27a.m. Page:76 Trim:165mm×240mm Integra, India
Font:Times F.Size:11/13pt Margins: Top:19mm Gutter:19mm Width:128mm Depth:40 Lines 1 Color Recto
76 Phase Transformations: Titanium and Zirconium Alloys
Table A1.1. (Continued)
Phase Composition(at.% X)
Space group Pearson symbol Strukturberichtdesignation
TiSb2 66.2–67.1 I4/mcm tI12 C16Ti8Se9 ∼52.9 R3̄m hP12 � � �Ti3Se4 55–57.6 C2/m mC14 � � �Ti3Si 25 P42/n tP32 � � �Ti5Si3 35.5–39.5 P63/mcm hP16 D88
TiSi 50 Pmm2 oP8 � � �Pnma oP8 B27
TiSi2 66.7 Fddd oF24 C54Ti3Sn 23–25 P63/mmc hP8 D019
Ti2Sn 32.7–35.9 P63/mmc hP6 B82
Ti5Sn3 37.5 P63/mcm hP16 D88
� Ti6Sn5 (HT) 45.5 P63/mmc hP22 � � �� Ti6Sn5 (LT) 45.5 Immm oI44 � � �
TiTc ∼50 Pm3̄m cP2 B2Ti–Tc � phase ∼85 I 4̄3m cI58 A12Ti5Te4 44.4 I4/m tI18 � � �TiTe >40 ∼P63/mmc hP16 ∼B81
Ti3Te4 55–59.2 C2/m mC14 � � �
TiTe2 ∼60–66.7 P3̄m1 hP3 C6TiU2 66.7 P6/mmm hP3 C32TiZn15 93.7 Cmcm oC68 � � �
TiZn3 75 Pm3̄m cP4 L12
TiZn2 66.7 P63/mmc hP12 C14TiZn 50 Pm3̄m cP2 B2Ti2Zn 33.3 I4/mmm tI6 C11b
∗Metastable phase; HT: High temperature phase; MT: Medium temperature phase; LT: Low temperature phase.
Table A1.2. Crystal structures of important binary intermetallic phases in Zr–X systems (Massalskiet al. 1992).
Phase Composition(at.% X)
Space group Pearson symbol Strukturberichtdesignation
Zr2Ag 33.3 14/mmm tI6 C11b
ZrAg 50 P4/nmm tP4 B11Zr3Al 25 Pm3̄m cP4 L12
Zr2Al 33.3 P63/mmc hP6 B82
Zr5Al3 37.5 I4/mcm tI32 D8m
Zr3Al2 40 P42/mmm tP20 � � �

Elsevier UK Code: PTA Ch01-I042145 5-6-2007 9:27a.m. Page:77 Trim:165mm×240mm Integra, India
Font:Times F.Size:11/13pt Margins: Top:19mm Gutter:19mm Width:128mm Depth:40 Lines 1 Color Recto
Phases and Crystal Structures 77
Table A1.2. (Continued)
Phase Composition(at.% X)
Space group Pearson symbol Strukturberichtdesignation
Zr4Al3 42.9 P6̄ hP7 � � �Zr5Al4 44.4 P63/mcm hP18 � � �ZrAl 50 Cmcm oC8 Bf
Zr2Al3 60 Fdd2 oF40 � � �ZrAl2 66.7 P63/mmc hP12 C14ZrAl3 75 I4/mmm tI16 D023
Zr3Au 25 Pm3̄n cP8 A15Zr2Au 33.3 I4/mmm tI6 C11b
ZrAu2 66.7 I4/mmm tI6 C11b
ZrAu3 75 Pmmn oP8 D0a
ZrAu4 80 Pnma oP20 � � �ZrB2 66.7–68 P6/mmm hP3 C32ZrB12 92.4 Fm3̄m cF52 D2f
ZrBe∗ 50 Cmcm oC8 Bf
ZrBe2 66.7 P6/mmm hP3 C32ZrBe5 83.3 P6/mmm hP6 D2d
Zr2Be17 89.5 R3̄m hR19 � � �
ZrBe13 92.9 Fm3̄c cF112 D23
ZrC 33–50 Fm3̄m cF8 B1Zr2Cd 33.3 I4/mmm tI6 C11b
ZrCd3 75 P4/mmm tP4 L6o
Zr3Co 25 Cmcm oC16 E1a
P63/mmc hP8 D019
Zr–Co � phase 33.3 I4/mcm tI12 C16Zr–Co phase ∼50 Pm3̄m cP2 B2Zr–Co � phase >65 to ∼73 Fd3̄m cF24 C15Zr–Co � phase 79.3 Fm3̄m cF116 D8a
� ZrCr2(HT) 64–69 P63/mmc hP12 C14� ZrCr2(MT) 64–69 P63/mmc hP24 C36� ZrCr2(LT) 64–69 Fd3̄m cF24 C15Zr2Cu 33.3 I4/mmm tI6 C11b
ZrCu 50 Pm3̄m cP2 B2Zr3Fe 24–26.8 Cmcm oC16 E1a
Zr2Fe 31–33.3 I4/mcm tI12 C16ZrFe2 66–72.9 Fd3̄m cF24 C15ZrFe3 75 Fm3̄m cF116 D8a
Zr2Ga 33.3 I4/mcm tI12 C16Zr5Ga3 37.5 P63/mcm hP16 D88
Zr3Ga2 40 P4/mbm tP10 D5a
Zr5Ga4 44.4 P63/mcm hP18 � � �ZrGa 50 I41/amd tI16 Bg
(Continued)

Elsevier UK Code: PTA Ch01-I042145 5-6-2007 9:27a.m. Page:78 Trim:165mm×240mm Integra, India
Font:Times F.Size:11/13pt Margins: Top:19mm Gutter:19mm Width:128mm Depth:40 Lines 1 Color Recto
78 Phase Transformations: Titanium and Zirconium Alloys
Table A1.2. (Continued)
Phase Composition(at.% X)
Space group Pearson symbol Strukturberichtdesignation
Zr2Ga3 60 Fdd2 oF40 � � �Zr3Ga5 62.5 Cmcm oC32 � � �ZrGa2 66.7 Cmmm oC12 � � �ZrGa3 75 I4/mmm tI16 D023
Zr3Ge 25 P42/n tP32 � � �Zr5Ge3 37.5 P63/mcm hP16 D88
Zr5Ge4 44.4 P41212 tP36 � � �ZrGe 50 Pmma oP8 B27ZrGe2 66.7 Cmcm oC12 C49� hydride 56.7–66.4 Fm3̄m cF12 C1� hydride 63.6 I4/mmm tI6 L′2b
� hydride∗ ∼1.0 P42/n tP6 � � �
Zr3Hg 25 Pm3̄n cP8 A15ZrHg 50 P4/mmm tP2 L1o
ZrHg3 75 Pm3̄m cP4 L12
Zr3In 25 Pm3̄m cP4 L12
Zr2In 33.3 P4/mmm tP2 L1o
ZrIn 50 Fm3̄m cF4 A1ZrIn2 66.7 I41/amd t124 � � �� ZrIn3(HT) 75 I4/mmm tI8 D022
� ZrIn3 (LT) 75 I4/mmm tI16 D023
Zr3Ir 25 I 4̄2m tI32 � � �Zr2Ir 33.3 I4/mcm tI12 C16Zr5Ir3 37.5 P63/mcm hP16 D88
ZrIr 48–53 Pm3̄m cP2 B2ZrIr2 66.7 Fd3̄m cF24 C15ZrIr3 70–81 Pm3̄m cP4 L12
ZrMn2 60–79.2 P63/mmc hP12 C14ZrMo2 60–67 Fd3̄m cF24 C15ZrN >40 Fm3̄m cF8 B1Zr2Ni 33.3 I4/mcm tI12 C16ZrNi 50 Cmcm oC8 Bf
ZrNi3 74–75.5 P63/mmc hP8 D019
ZrNi5 81.6–85.2 F 4̄3m cF24 C15b
� ZrO2−x(HT) 61–66.7 Fm3̄m cF12 C1� ZrO2−x (MT) 66.5–66.7 P42/nmc tP6 � � �� ZrO2−x (LT) 66.7 P21/c mP12 C43ZrOs 50 Pm3̄m cP2 B2ZrOs2 >61–∼70 P63/mmc hP12 C14Zr3P 25 P42/n tP32 � � �

Elsevier UK Code: PTA Ch01-I042145 5-6-2007 9:27a.m. Page:79 Trim:165mm×240mm Integra, India
Font:Times F.Size:11/13pt Margins: Top:19mm Gutter:19mm Width:128mm Depth:40 Lines 1 Color Recto
Phases and Crystal Structures 79
Table A1.2. (Continued)
Phase Composition(at.% X)
Space group Pearson symbol Strukturberichtdesignation
� ZrP (HT) 50 Fm3̄m cF8 B1� ZrP (LT) 50 P63/mmc hP8 Bi
ZrP2 66.7 Pnma oP12 C23Zr5Pb3 37.5 P63/mcm hP16 D88
Zr2Pd 33.3 I4/mmm tI6 C11b
ZrPd 50 Fm3̄m cF4 A1ZrPd2 66.7 I4/mmm tI6 C11b
ZrPd3 75 P63/mmc hP16 D024
ZrPo 50 P63/mmc hP4 B81
Zr5Pt3 37.5 P63/mcm hP16 D88
� ZrPt (HT) 50 Pm3̄m cP2 B2� ZrPt (LT) 50 Cmcm oC8 Bf
ZrPt3 75 Pm3̄m cP4 L12
P63/mmc hP16 D024
Zr3Pu 26 P6/mmm hP3 C32ZrPu4 70–90 P4/ncc tP80 � � �ZrRe2 66.7 P63/mmc hP12 C14Zr5Re24 ∼82.8 I 4̄3m cI58 A12Zr2Rh 33.3 I4/mcm tI12 C16� ZrRh (HT) 50–62 Im3̄m cI2 A2� ZrRh (LT) > 50 Pm3̄m cP2 B2Zr3Rh5 62.5 Cmcm oC32 � � �
ZrRh3 72–82 Pm3̄m cP4 L12
ZrRu 48–52 Pm3̄m cP2 B2ZrRu2 66–68 P63/mmc hP12 C14Zr2S 33.3 Pnnm oP36 � � �
Zr3S2 40 P6̄m2 hP2 Bh
ZrS 50 Fm3̄m cF8 B1P4/nmm tP4 B11
ZrS2 66.7 P3̄m1 hP3 C6ZrS3 75 P21/m mP8 � � �
Zr3Sb 25 I 4̄ tI32 D0e
Zr5Sb3 36 P63/mcm hP16 D88
ZrSb2 66.7 Pnnm oP24 � � �Zr2Se 33.3 Pnnm oP36 � � �
Zr3Se2 40 P6̄m2 hP2 Bh
Zr2Se3 60 P63mc hP8 � � �
ZrSe2 64.9–66 P3̄m1 hP3 C6ZrSe3 75 P21/m mP8 � � �Zr3Si ∼25 P42/n tP32 � � �
I 4̄ tI38 D0e
(Continued)

Elsevier UK Code: PTA Ch01-I042145 5-6-2007 9:27a.m. Page:80 Trim:165mm×240mm Integra, India
Font:Times F.Size:11/13pt Margins: Top:19mm Gutter:19mm Width:128mm Depth:40 Lines 1 Color Recto
80 Phase Transformations: Titanium and Zirconium Alloys
Table A1.2. (Continued)
Phase Composition(at.% X)
Space group Pearson symbol Strukturberichtdesignation
Zr2Si 33.3 I4/mcm tI12 C16Zr5Si3 37.5 P63/mcm hP16 D88
Zr3Si2 40 P4/mbm tP10 D5a
� ZrSi (HT) 50 Cmcm oC8 Bf
� ZrSi (LT) 50 Pnma oP8 B27ZrSi2 66.7 Cmcm oC12 C49Zr4Sn ∼20 Pm3̄n cP8 A15Zr5Sn3 33–∼40 P63/mcm hP16 D88
ZrSn2 66.7 Fddd oF24 C54ZrTc2 66.7 P63/mmc hP12 C14ZrTc6 85.7 I 4̄3m cI58 A12Zr3Te 25 R3̄m hR12 � � �Zr5Te4 44.4 I4/m tI18 � � �ZrTe 50 P63/mmc hP4 B81
ZrTe2 55–66.7 P3̄m1 hP3 C6ZrTe3 75 P21/m mP8 � � �
Zr4Tl 20 Pm3̄n cP8 A15U–Zr � phase 22–37 P6/mmm hP3 C32ZrV2 ∼66.7 Fd3̄m cF24 C15ZrW2 ∼66.7 Fd3̄m cF24 C15Zr2Zn 33.3 I4/mmm tI16 D023
Zr3Zn2 39.5 P42nm tP20 � � �
ZrZn 50 Pm3̄m cP2 B2ZrZn2 66.7 Fd3̄m cF24 C15
∗Metastable phase; HT: High temperature phase; MT: Medium temperature phase; LT: Low temperature phase.
Table A1.3. Nomenclature of crystal structures: strukturbericht designations and correspondingPearson symbols (Massalski et al. 1992).
Strukturberichtdesignation
Prototype phase Space group Pearson symbol
Aa � Pa I4/mmm tI2Ab � U P42/mnm tP30Ac � Np Pnma oP8Ad � Np P4212 tP4Af HgSn6−10 P6/mmm hP1Ag � B P42/nnm tP50Ah � Po Pm3̄m cP1Ai � Po R3̄m hR1

Elsevier UK Code: PTA Ch01-I042145 5-6-2007 9:27a.m. Page:81 Trim:165mm×240mm Integra, India
Font:Times F.Size:11/13pt Margins: Top:19mm Gutter:19mm Width:128mm Depth:40 Lines 1 Color Recto
Phases and Crystal Structures 81
Table A1.3. (Continued)
Strukturberichtdesignation
Prototype phase Space group Pearson symbol
Ak � Se P21/c mP64Al � Se P21/c mP32A1 Cu Fm3̄m cF4A2 W Im3̄m cI2A3 Mg P63/mmc hP2A4 C (diamond) Fd3̄m cF8A5 � Sn I41/amd tI4A6 In I4/mmm tI2A7 � As R3̄m hR2A8 � Se P3121 hP3A9 C (graphite) P63/mmc hP4A10 � Hg R3̄m hR1A11 � Ga Cmca oC8A12 � Mn I 4̄3m cI58A13 � Mn P4132 cP20A14 I2 Cmca oC8A15 Cr3Si Pm3̄n cP8A16 � S Fddd oF128A17 P (black) Cmca oC8A20 � U Cmcm oC4Ba CoU 1213 cI16Bb AgZn P3̄ hP9Bc CaSi Cmmc oC8Bd � NiSi Pbnm oP8Be CdSb Pbca oP16Bf CrB Cmcm oC8Bg MoB I41/amd tI16Bh WC P6̄m2 hP2Bi TiAs P63/mmc hP8Bk BN P63/mmc hP4Bl AsS P21/c mP32Bm TiB Pnma oP8B1 NaCl Fm3̄m cF8B2 CsCl Pm3̄m cP2B3 ZnS (sphalerite) F 4̄3m cF8B4 ZnS (wurtzite) P63mc hP4B81 NiAs P63/mmc hP4B82 Ni2In P63/mmc hP6B9 HgS P3121 hP6B10 PbO P4/nmm tP4B11 � CuTi P4/nmm tP4
(Continued)
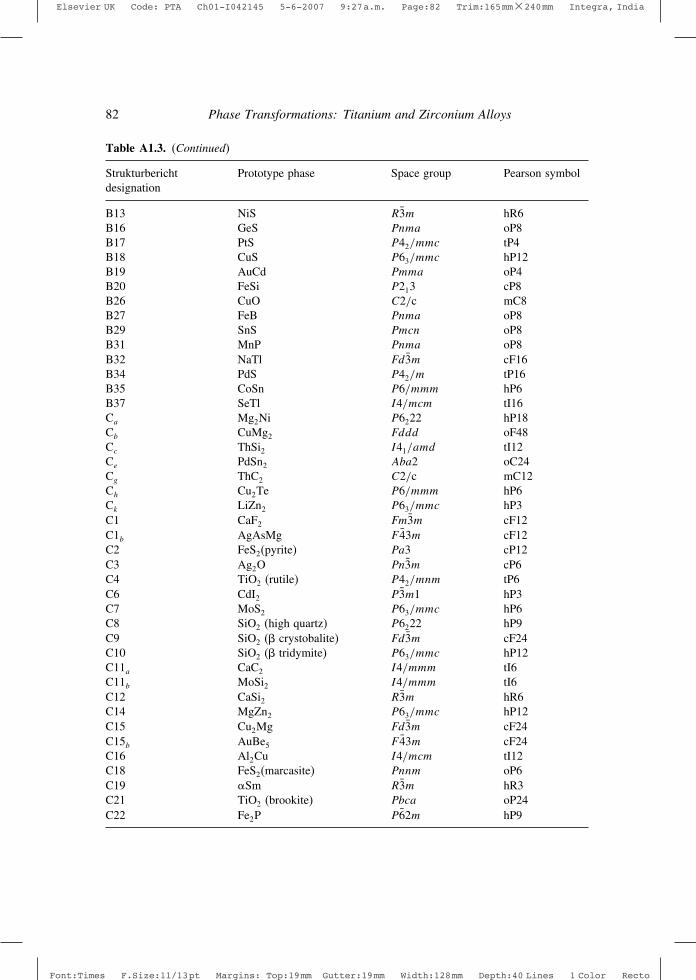
Elsevier UK Code: PTA Ch01-I042145 5-6-2007 9:27a.m. Page:82 Trim:165mm×240mm Integra, India
Font:Times F.Size:11/13pt Margins: Top:19mm Gutter:19mm Width:128mm Depth:40 Lines 1 Color Recto
82 Phase Transformations: Titanium and Zirconium Alloys
Table A1.3. (Continued)
Strukturberichtdesignation
Prototype phase Space group Pearson symbol
B13 NiS R3̄m hR6B16 GeS Pnma oP8B17 PtS P42/mmc tP4B18 CuS P63/mmc hP12B19 AuCd Pmma oP4B20 FeSi P213 cP8B26 CuO C2/c mC8B27 FeB Pnma oP8B29 SnS Pmcn oP8B31 MnP Pnma oP8B32 NaTl Fd3̄m cF16B34 PdS P42/m tP16B35 CoSn P6/mmm hP6B37 SeTl I4/mcm tI16Ca Mg2Ni P6222 hP18Cb CuMg2 Fddd oF48Cc ThSi2 I41/amd tI12Ce PdSn2 Aba2 oC24Cg ThC2 C2/c mC12Ch Cu2Te P6/mmm hP6Ck LiZn2 P63/mmc hP3C1 CaF2 Fm3̄m cF12C1b AgAsMg F 4̄3m cF12C2 FeS2(pyrite) Pa3 cP12C3 Ag2O Pn3̄m cP6C4 TiO2 (rutile) P42/mnm tP6C6 CdI2 P3̄m1 hP3C7 MoS2 P63/mmc hP6C8 SiO2 (high quartz) P6222 hP9C9 SiO2 (� crystobalite) Fd3̄m cF24C10 SiO2 (� tridymite) P63/mmc hP12C11a CaC2 I4/mmm tI6C11b MoSi2 I4/mmm tI6C12 CaSi2 R3̄m hR6C14 MgZn2 P63/mmc hP12C15 Cu2Mg Fd3̄m cF24C15b AuBe5 F 4̄3m cF24C16 Al2Cu I4/mcm tI12C18 FeS2(marcasite) Pnnm oP6C19 �Sm R3̄m hR3C21 TiO2 (brookite) Pbca oP24C22 Fe2P P6̄2m hP9

Elsevier UK Code: PTA Ch01-I042145 5-6-2007 9:27a.m. Page:83 Trim:165mm×240mm Integra, India
Font:Times F.Size:11/13pt Margins: Top:19mm Gutter:19mm Width:128mm Depth:40 Lines 1 Color Recto
Phases and Crystal Structures 83
Table A1.3. (Continued)
Strukturberichtdesignation
Prototype phase Space group Pearson symbol
C23 Co2Si Pnma oP12C28 HgCl2 Pmnb oP12C32 AlB2 P6/mmm hP3C33 Bi2Te3 R3̄m hR5C34 AuTe2 (calaverite) C2/m mC6C35 CaCl2 Pnnm oP6C36 MgNi2 P63/mmc hP24C37 Co2Si Pbnm oP12C38 Cu2Sb P4/nmm tP6C40 CrSi2 P6222 hP9C42 SiS2 Ibam oI12C43 ZrO2 P21/c mP12C44 GeS2 Fdd2 oF72C46 AuTe2 (krennerite) Pma2 oP24C49 ZrSi2 Cmcm oC12C54 TiSi2 Fddd oF24D0a � Cu3Ti Pmmn oP8D0c SiU3 I4/mcm tI16D0′
c Ir3Si I4/mcm tI16D0d AsMn3 Pmmn oP16D0e Ni3P I 4̄ tI32D02 CoAs3 Im3̄ cI32D03 BiF3 Fm3̄m cF16D09 ReO3 Pm3̄m cP4D011 Fe3C Pnma oP16D017 BaS3 P421m oP16D018 Na3As P63/mmc hP8D019 Ni3Sn P63/mmc hP8D020 Al3Ni Pnma oP16D021 Cu3P P63cm hP24D022 TiAl3 I4/mmm tI8D023 ZrAl3 I4/mmm tI16D024 TiNi3 P63/mmc hP16D1a MoNi4 I4/m tI10D1b Al4U Imma oI20D1c PdSn4 Aba2 oC20D1d Pb4Pt P4/nbm tP10D1e B4Th P4/mbm tP20D1f Mn4B Fddd oF40D1g B4C R3̄m hR15D13 Al4Ba I4/mmm tI10
(Continued)

Elsevier UK Code: PTA Ch01-I042145 5-6-2007 9:27a.m. Page:84 Trim:165mm×240mm Integra, India
Font:Times F.Size:11/13pt Margins: Top:19mm Gutter:19mm Width:128mm Depth:40 Lines 1 Color Recto
84 Phase Transformations: Titanium and Zirconium Alloys
Table A1.3. (Continued)
Strukturberichtdesignation
Prototype phase Space group Pearson symbol
D2b Mn12Th I4/mmm tI26D2c MnU6 I4/mcm tI28D2d CaCu5 P6/mmm hP6D2e BaHg11 Pm3̄m cP36D2f UB12 Fm3̄m cF52D2g Fe8N I4/mmm tI18D2h Al6Mn Cmcm oC28D21 CaB6 Pm3̄m cP7D23 NaZn13 Fm3̄c cF112D5a Si2U3 P4/mbm tP10D5b Pt2Sn3 P63/mmc hP10D5c Pu2C3 I 4̄3d cI40D5e Ni3S2 R32 hR5D5f As2S3 P21/c mP20D51 � Al2O3 R3̄c hR10D52 La2O3 P3̄m1 hP5D53 Mn2O3 Ia3̄ cI80D54 Sb2O3 (senarmonite) Fd3̄m cF80D58 Sb2S3 Pnma oP20D59 Pt2Zn3 P42/nmc tP40D510 Cr3C2 Pnma oP20D511 Sb2O3 (valentinite) Pccn oP20D513 Al3Ni2 P3̄m1 hP5D7a � Ni3Sn4 C2/m mC14D7b Ta3B4 Immm oI14D71 Al4C3 R3̄m hR7D72 Co3S4 Fd3̄m cF56D73 Th3P4 I 4̄3d cI28D8a Mn23Th6 Fm3̄m cF116D8b ! CrFe P42/mnm tP30D8c Mg2Zn11 Pm3̄ cP39D8d Al9Co2 P21/c mP22D8e Mg32�Al�Zn�49 Im3̄ cI162D8f Ge7Ir3 Im3̄m cI40D8g Ga2Mg5 Ibam oI28D8h W2B5 P63/mmc hP14D8i Mo2B5 R3̄m hR7D8k Th7S12 P63/m hP20D8l Cr5B3 I4/mcm tI32D8m W5Si3 I4/mcm tI32D81 Fe3Zn10 Im3̄m cI52D82 Cu5Zn8 I 4̄3m cI52

Elsevier UK Code: PTA Ch01-I042145 5-6-2007 9:27a.m. Page:85 Trim:165mm×240mm Integra, India
Font:Times F.Size:11/13pt Margins: Top:19mm Gutter:19mm Width:128mm Depth:40 Lines 1 Color Recto
Phases and Crystal Structures 85
Table A1.3. (Continued)
Strukturberichtdesignation
Prototype phase Space group Pearson symbol
D83 Al4Cu9 P4̄3m cP52D84 Cr23C6 Fm3̄m cF116D85 Fe7W6 R3̄m hR13D86 Cu15Si4 I 4̄3d cI76D88 Mn5Si3 P63/mcm hP16D89 Co9S8 Fm3̄m cF68D810 Al8Cr5 R3̄m hR26D811 Al5Co2 P63/mmc hP28D101 Cr7C3 Pnma oP40D102 Fe3Th7 P63mc hP20E01 PbFCl P4/nmm tP6E07 FeAsS P21/c mP24E1a Al2CuMg Cmcm oC16E1b AgAuTe4 P2/c mP12E11 CuFeS2 I 4̄2d tI16E21 CaTiO3 Pm3̄m cP5E3 Al2CdS4 I 4̄ tI14E9a Al7Cu2Fe P4/mnc tP40E9b Al8FeMg3Si6 P6̄2m hP18E9c Al9Mn3Si P63/mmc hP26E9d AlLi3N2 Ia3̄ cI96E9e CuFe2S3 Pnma oP24E9e Fe3W3C Fd3̄m cF112E94 Al4SiC4 P63mc hP18F5a FeKS2 C2/c mC16F01 NiSbS P213 cP12F51 CrNaS2 R3̄m hR4F56 CuSbS2 Pnma oP16H11 Al2MgO4 Fd3̄m cF56H24 Cu3VS4 P4̄3m cP8H26 Cu2FeSnS4 I 4̄2m tI6L′11 Fe4N P4̄3m cP5L′12 AlFe3C Pm3̄m cP5L′2b ThH2 I4/mmm tI6L′3 Fe2N P63/mmc hP3L1a CuPt3 Fm3̄c cF32L1o AuCu P4/mmm tP2L11 CuPt R3̄m hR32L12 AuCu3 Pm3̄m cP4L2a � CuTi P4/mmm tP2L21 AlCu2Mn Fm3̄m cF16L22 Sb2Tl7 Im3̄m cI54L6o CuTi3 P4/mmm tP4

Elsevier UK Code: PTA Ch01-I042145 5-6-2007 9:27a.m. Page:86 Trim:165mm×240mm Integra, India
Font:Times F.Size:11/13pt Margins: Top:19mm Gutter:19mm Width:128mm Depth:40 Lines 1 Color Recto
86 Phase Transformations: Titanium and Zirconium Alloys
Table A1.4. Binary intermetallic phases: most commonly exhibited structures.
Structure type Number of binary phasesexhibiting the structure
Rank Strukturberichtdesignation
Pearsonsymbol
Prototypephase
1 A1 cF4 Cu 5202 A3 hP2 Mg 3623 B1 cF8 NaCl 3184 A2 cI2 W 3095 B2 cP2 CsCl 3076 L12 cP4 AuCu3 2667 C15 cF24 MgCu2 2438 D88 hP16 Mn5Si3 1779 C14 hP12 MgZn2 148
10 C32 hP3 AlB2 12211 Bf oC8 CrB 12012 D73 cI28 Th3P4 11713 D2d hP6 CaCu5 10614 D011 oP16 Fe3C 10115 B81 hP4 NiAs 10116 C23 oP12 Co2Si 9517 C1 cF12 CaF2 8718 L1o tP2 AuCu 8219 A15 cP8 Cr3Si 8220 C38 tP6 Cu2Sb 7421 B27 oP8 FeB 7322 � � � hP38 Ni17Th2 6223 C42 oI12 CeCu2 6124 B82 hP6 Ni2In 5425 C2 cP12 FeS2 5026 D8a cF116 Mn23Th6 4927 � � � hR36 Be3Nb 49