chapter-1 public sector in india (overview &...
TRANSCRIPT

- 1 -
Chapter-1
PUBLIC SECTOR
IN INDIA
(Overview & Profile)

- 2 -
PUBLIC SECTOR IN INDIA 1.1 EVOLUTION
1.1.1 Prior to Independence, there were few ‘Public Sector’ Enterprises in the country.
These included the Railways, the Posts and Telegraphs, the Port Trusts, the
Ordinance Factories, All India Radio, few enterprises like the Government Salt
Factories, Quinine Factories, etc. which were departmentally managed.
1.1.2 Independent India adopted planned economic development policies in a
democratic, federal polity. The country was facing problems like inequalities in
income and low levels of employment, regional imbalances in economic
development and lack of trained manpower. India at that time was predominantly
an agrarian economy with a weak industrial base, low level of savings, inadequate
investments and infrastructure facilities. In view of this type of socio-economic
set up, our visionary leaders drew up a roadmap for the development of Public
Sector as an instrument for self-reliant economic growth. This guiding factor led
to the passage of Industrial Policy Resolution of 1948 and followed by Industrial
Policy Resolution of 1956. The 1948 Resolution envisaged development of core
sectors through the public enterprises. Public Sector would correct the regional
imbalances and create employment. Industrial Policy Resolution of 1948 laid
emphasis on the expansion of production, both agricultural and industrial; and in
particular on the production of capital equipment and goods satisfying the basic
needs of the people, and of commodities the export of which would increase
earnings of foreign exchange.
1.1.3 In early years of independence, capital was scarce and the base of entrepreneurship
was also not strong enough. Hence, the 1956 Industrial Policy Resolution gave
primacy to the role of the State which was directly responsible for industrial
development. Consequently the planning process (5 year Plans) was initiated
taking into account the needs of the country. The new strategies for the public
sector were later outlined in the policy statements in the years 1973, 1977, 1980
and 1991. The year 1991 can be termed as the watershed year, heralding
liberalisation of the Indian economy.

- 3 -
1.1.4 The public sector provided the required thrust to the economy and developed and
nurtured the human resources, the vital ingredient for success of any enterprise;
public or private.
1.2 GLOBAL TREND
1.2.1 The Public Sector emerged as the driver of economic growth consequent to the
industrial revolution in Europe. With the advent of globalization, the public sector
faced new challenges in the developed economies. No longer the public sector had
the privilege of operating in a sellers market and had to face competition both from
domestic and international competitors. Further, in the second half of the 20th
century in the developed economies, the political opinion started swinging towards
the views that the intervention as well as investment by Government in
commercial activities should be reduced to the extent possible.
1.2.2 Many eminent economists argued that Government must not venture into those
areas, where the private sector could undertake job efficiently. Lot of emphasis
was laid on market driven economies, rather than State controlled and
administered economies. The collapse of socialist economy of the Soviet block
convinced the policy planners, around the world, that role of the State should be
that of a facilitator and regulator rather than the producer and manager. It may be
worth mentioning that, in various countries, the turn towards liberalism including
deregulation and decontrol also led to discontent amongst some sections of
population as its benefit did not flow down to the weaker and disadvantaged
sections of society.
1.2.3 Today, both Public Sector & Private Sector have become an integral part of the
economy. There may not be much difference in working of these sectors in
advanced countries, but in developing countries, the performance of Public Sector
has considerable scope for improvement. It is also observed that Pay packages are
almost similar in both sectors in developed countries, but large differences exist in
remuneration in the two sectors in developing countries, like ours.

- 4 -
1.3 Economic Scenario and Role of Public Sector in India – General
perspective
1.3.1 Government of India, as part of its national agenda to promote growth, increase in
efficiency and international competitiveness, has been continuously framing
policies for industrial growth, fiscal, trade and foreign investment to achieve
overall socio-economic development of the country. As a result of exceptionally
severe balance of payments and fiscal crisis in the year 1991, the government
decided to shift to a liberalized economy with greater reliance upon market forces,
a larger role for the private sector including foreign direct investment.
1.3.2 The Government realized that a strong and growth oriented nation could be built if
India grows as part of the world economy and not in isolation. Thus, liberalising
and deregulatory steps were initiated from the year 1991 onwards, which aimed at
supporting growth and integration with the global economy. Since then, the thrust
of New Economic Policy has been on progressive reforms such as reduction in the
scope of industrial licensing, reforms in the Monopolies and Restrictive Trade
Practices (MRTP) Act, reduction of areas reserved exclusively for public sector,
disinvestment of equity of selected public sector enterprises (PSEs), enhancing
limits of foreign equity participation in domestic industrial undertakings,
liberalization of trade and exchange rate policies, rationalization and reduction of
customs and excise duties and personal and corporate income taxes, promoting
FDI, investments from NRIs (Non-Resident Indians), extension of the scope of
CENVAT, implementing the VAT regime in States, taking steps to switch over to
goods & services tax system w.e.f. 01.04.2010, e-governance and simplification
of various procedures, rules and regulations etc.
1.3.3 Since the setting up of World Trade Organization (WTO) in the year 1995, as an
apex body at the international level, to which India is a signatory, the world trade
has definitely grown thereby giving indications that international trade reforms do
play an important role in boosting economic development of various countries.
1.3.4 Industrial policy has seen a sea change with most Central Government industrial
controls being liquidated. The Central Public Sector Enterprises (CPSEs) were
classified into ‘strategic’ and ‘non-strategic’. Strategic CPSEs were identified in

- 5 -
the areas of (a) Arms & Ammunition and the allied items of defence equipments,
Defence air-crafts and warships; (b) Atomic Energy (except in the areas related to
the operation of nuclear power and applications of radiation and radio-isotopes to
agriculture, medicine and non-strategic industries); and (c) Railway transport. All
other CPSEs were considered as non-strategic. Further, Industrial licensing by the
Central Government has been almost abolished except for a few hazardous and
environmentally sensitive industries.
1.3.5 The main elements of the present Government policy towards Public Sector
enterprises as contained in the National Common Minimum Programme (NCMP)
are reproduced below:
i) To devolve full managerial and commercial autonomy to successful,
profit making companies operating in a competitive environment
ii) Generally , profit-making companies will not be privatized
iii) Every effort will be made to modernize and restructure sick public
sector companies and revive sick industry
iv) Chronically loss making companies will either be sold off, or closed,
after all workers have got their legitimate dues and compensation
v) Private industry will be inducted to turn-around companies that have
potential for revival
vi) Privatization revenues will be used for designated social sector
schemes
vii) Public sector companies and nationalized banks will be encouraged to
enter the capital market to raise resources and offer new investment
avenues to retail investors.
1.3.6 The Government has made a clear commitment to empowering the CPSEs and
their managements. It was recognised that public enterprises could not compete
effectively with private entrepreneurs without freedom to function and operate

- 6 -
commercially. Thus, the concept of Navratna and Mini-Ratna was introduced with
greater delegated authority, both financial and managerial. Government has
realized that ‘Navratnas’, ‘Mini-ratnas’ and other CPSEs are required to grow and
deliver on the promises they have made to their stakeholders. Other reforms have
also been announced, such as professionalisation of the Boards of Directors of
public sector enterprises and evaluation of performance of CPSEs through
Memorandum of Understanding (MOU).
1.4 Performance Status
1.4.1 Performance Status: Over the years, operations of CPSEs have extended to a
wide range of activities in the manufacturing, engineering, steel, heavy machinery,
machine tools, fertilizers, drugs, textiles, pharmaceuticals, petro-chemicals,
extraction and refining of crude oil and services such as telecommunication,
trading, tourism, warehousing, etc. and a range of consultancy services.
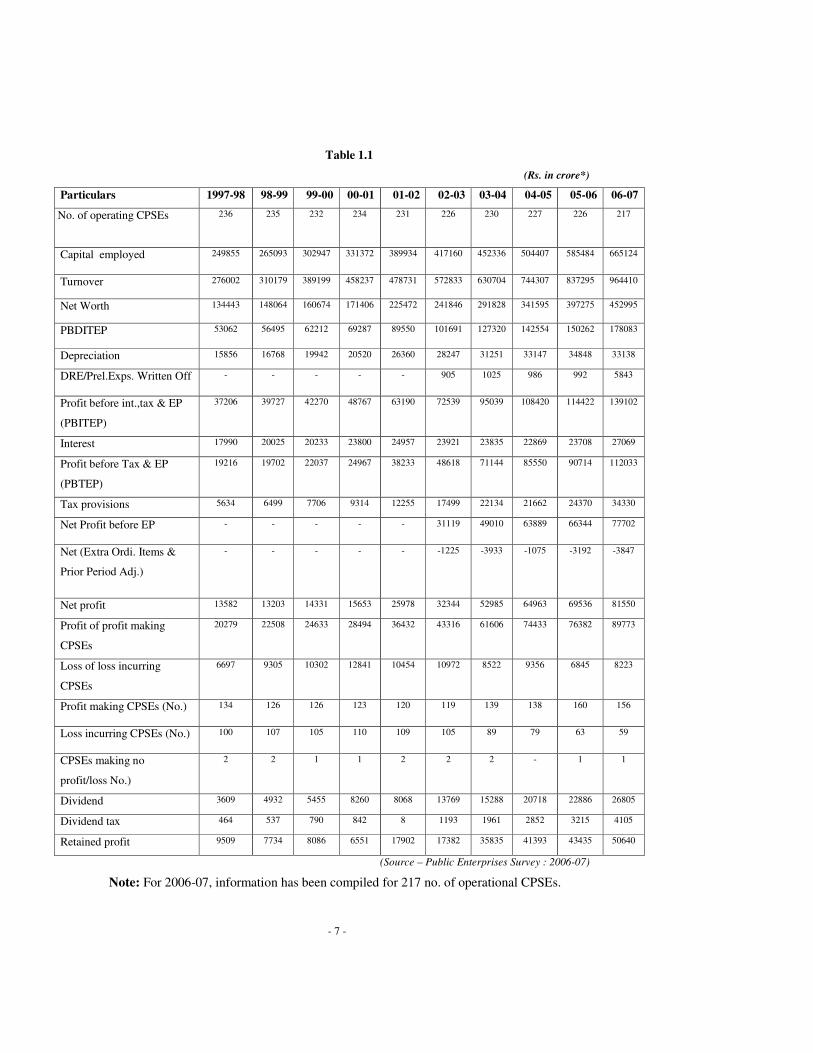
In 2006-07, there were 247 Central Public Sector Enterprises in India, as
compared to 236 in 1997-98. The macro view of overall performance of these
number of CPSEs in the last 10 years is given in Table 1.1.
The following observations are made regarding the performance of CPSEs during
the last 10 years:-
a. The capital employed has increased from Rs. 2,49,855 Crores in 1997-98 to
Rs.6,65,124 Crores in 2006-07 recording a growth of 266%.
b. Number of loss incurring CPSEs, it has come down from 100 in 1997-98 to
59 in 2006-07.
c. Turnover increased to Rs.9,64,410 Crores in 2006-07, from Rs. 2,76,002
Crores in 1997-98 recording a net worth growth of 349% increased from Rs.
1,34,443 Crores to Rs.4,52,995 Crores in 2006-07 recording a growth of
337%.
d. The turnover is equal to Rs.9,64,410 Crores in 2006-07, which is an increase
of 349% in comparison to 1997-98 (Rs. 2,76,002 Crores ). As regards Net
worth, it has increased by 337% in 2006-07 in comparison to 1997-98 (Rs.
1,34,443 Crores), and is presently at Rs.4,52,995 Crores.
e. Net profit has increased by 599% in 2006-07 in comparison to 1997-98 (Rs.
13582 Crores), and is currently to the tune of Rs. 81550 Crores.
����������������������� ����
- 7 -
Table 1.1
(Rs. in crore*)
Particulars 1997-98 98-99 99-00 00-01 01-02 02-03 03-04 04-05 05-06 06-07
No. of operating CPSEs 236 235 232 234 231 226 230 227 226 217
Capital employed 249855 265093 302947 331372 389934 417160 452336 504407 585484 665124
Turnover 276002 310179 389199 458237 478731 572833 630704 744307 837295 964410
Net Worth 134443 148064 160674 171406 225472 241846 291828 341595 397275 452995
PBDITEP 53062 56495 62212 69287 89550 101691 127320 142554 150262 178083
Depreciation 15856 16768 19942 20520 26360 28247 31251 33147 34848 33138
DRE/Prel.Exps. Written Off - - - - - 905 1025 986 992 5843
Profit before int.,tax & EP
(PBITEP)
37206 39727 42270 48767 63190 72539 95039 108420 114422 139102
Interest 17990 20025 20233 23800 24957 23921 23835 22869 23708 27069
Profit before Tax & EP
(PBTEP)
19216 19702 22037 24967 38233 48618 71144 85550 90714 112033
Tax provisions 5634 6499 7706 9314 12255 17499 22134 21662 24370 34330
Net Profit before EP - - - - - 31119 49010 63889 66344 77702
Net (Extra Ordi. Items &
Prior Period Adj.)
- - - - - -1225 -3933 -1075 -3192 -3847
Net profit 13582 13203 14331 15653 25978 32344 52985 64963 69536 81550
Profit of profit making
CPSEs
20279 22508 24633 28494 36432 43316 61606 74433 76382 89773
Loss of loss incurring
CPSEs
6697 9305 10302 12841 10454 10972 8522 9356 6845 8223
Profit making CPSEs (No.) 134 126 126 123 120 119 139 138 160 156
Loss incurring CPSEs (No.) 100 107 105 110 109 105 89 79 63 59
CPSEs making no
profit/loss No.)
2 2 1 1 2 2 2 - 1 1
Dividend 3609 4932 5455 8260 8068 13769 15288 20718 22886 26805
Dividend tax 464 537 790 842 8 1193 1961 2852 3215 4105
Retained profit 9509 7734 8086 6551 17902 17382 35835 41393 43435 50640
(Source – Public Enterprises Survey : 2006-07)
Note: For 2006-07, information has been compiled for 217 no. of operational CPSEs.

- 8 -
f. The combined Dividend and Dividend Tax has increased by 772% in 2006-07
in comparison to 1997-98 (Rs. 4063 Crore), and is equal to Rs. 30910 Crores.
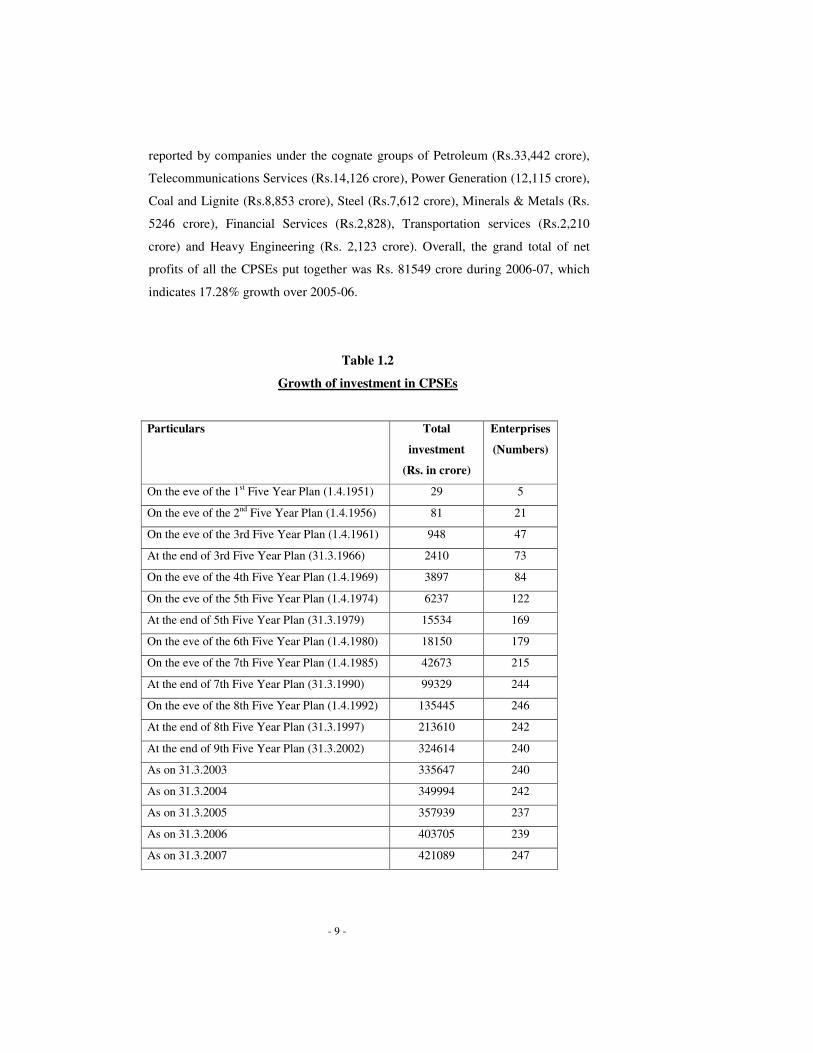
1.4.2 Investment pattern: “Investment” defined as aggregate of paid-up share
capital, share application money pending allotment and long term loans in CPSEs
has grown from Rs.29 crore in 5 enterprises as on 1.4.1951 to Rs.4,21,089 crore as
on 31.3.2007. The growth of investment in CPSEs, including enterprises under
construction, over the years is given in Table 1.2. In addition, the CPSEs have
accumulated a large amount of Reserves and Surplus which stood at Rs. 416494
crores as on 31.3.2007.
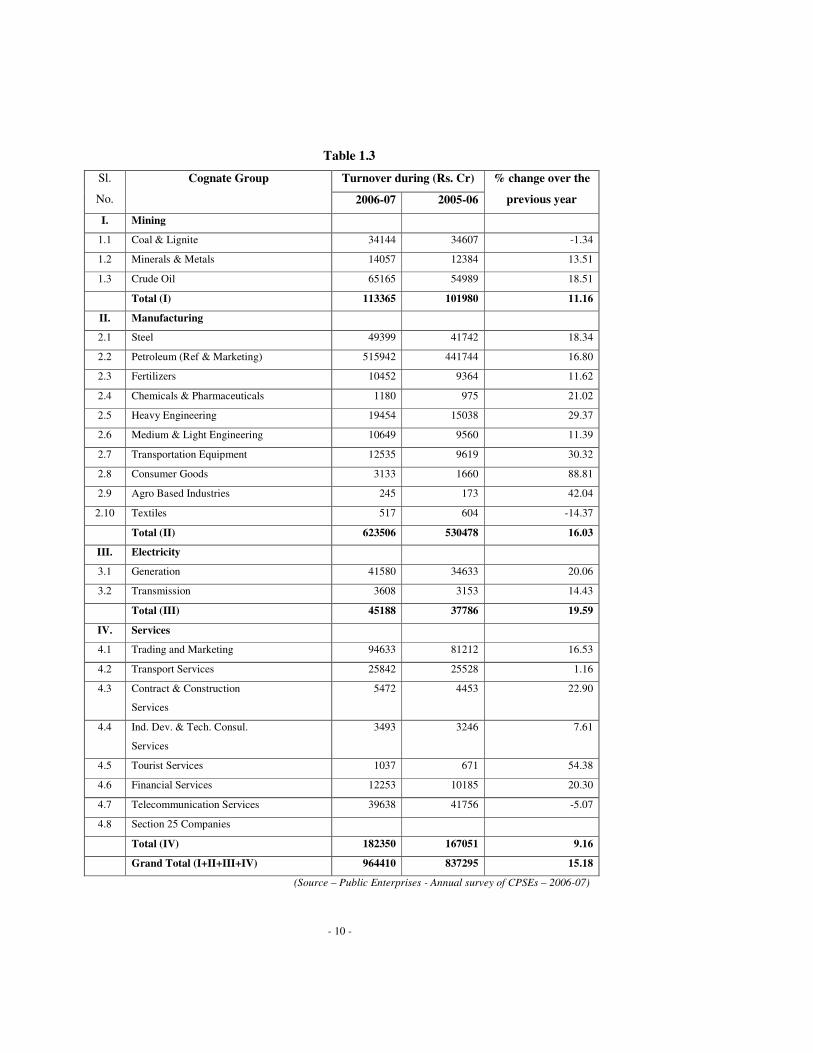
1.4.3 Turnover and Sales: Cognate group wise turnover of CPSEs for financial
years 2006-07 and 2005-06 showing annual growth is at Table 1.3. A perusal of
the Table shows robust growth in the sales/ turnover of CPSEs during 2006-07.
The Electricity Sector had the highest, 19.59 per cent growth, followed by the
manufacturing companies with a 16.03 per cent growth and the service companies
with a growth of 9.16 percent in 2006-07 (over 2005-06). Amongst the various
cognate groups, the growth in turnover of Consumer Goods (88.81%), Tourist
Services (54%), Agro Based Industries (42%), Transportation Equipment (30%),
Heavy Engineering (29%), Contract and Construction Services (23%), Chemicals
& Pharmaceuticals (21%), Financial Services (20%), Power Generation (20%),
Steel (18%) and Petroleum (17%) have been significant.
However, the CPSEs under the cognate groups of textiles (-14.37%), Telecom
services (-5.07%) and Coal & Lignite (-1.34%) have witnessed a negative growth
in turnover during 2006-07 over 2005-06. Overall, there was a 15.18 per cent
growth in the turnover of CPSEs during 2006-07 over 2005-06.
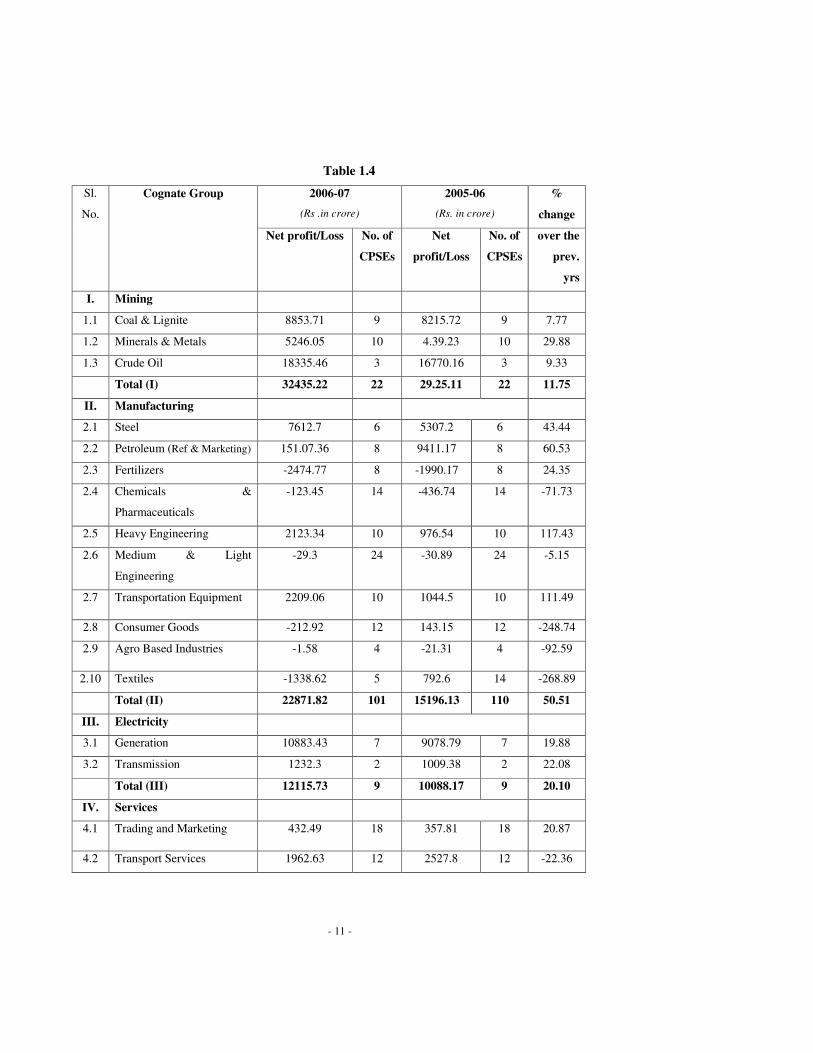
1.4.4 Profit and Loss: The Net profit / Loss of CPSEs in the financial year 2006-07
and the year 2005-06 is presented in Table 1.4. The Group-wise analysis of
aggregate profit and loss shows that except for the cognate groups of 'Fertilizers',
'Chemicals & Pharmaceuticals', 'Medium and Light engineering', 'Agro-based
Industries' , 'Textiles', 'Consumer Goods' and 'Contract and Construction services'
all the others showed profits during the year 2006-07. Companies under the
cognate groups of 'Heavy Engineering' and 'Transport Equipment ' performed
better than the rest, with a 117 per cent growth and 111 per cent growth in profit in
2006-07 over 2005-06 respectively in terms of absolute values. High profits were
����������������������� ����
- 9 -
reported by companies under the cognate groups of Petroleum (Rs.33,442 crore),
Telecommunications Services (Rs.14,126 crore), Power Generation (12,115 crore),
Coal and Lignite (Rs.8,853 crore), Steel (Rs.7,612 crore), Minerals & Metals (Rs.
5246 crore), Financial Services (Rs.2,828), Transportation services (Rs.2,210
crore) and Heavy Engineering (Rs. 2,123 crore). Overall, the grand total of net
profits of all the CPSEs put together was Rs. 81549 crore during 2006-07, which
indicates 17.28% growth over 2005-06.
Table 1.2
Growth of investment in CPSEs
Particulars
Total
investment
(Rs. in crore)
Enterprises
(Numbers)
On the eve of the 1st Five Year Plan (1.4.1951) 29 5
On the eve of the 2nd Five Year Plan (1.4.1956) 81 21
On the eve of the 3rd Five Year Plan (1.4.1961) 948 47
At the end of 3rd Five Year Plan (31.3.1966) 2410 73
On the eve of the 4th Five Year Plan (1.4.1969) 3897 84
On the eve of the 5th Five Year Plan (1.4.1974) 6237 122
At the end of 5th Five Year Plan (31.3.1979) 15534 169
On the eve of the 6th Five Year Plan (1.4.1980) 18150 179
On the eve of the 7th Five Year Plan (1.4.1985) 42673 215
At the end of 7th Five Year Plan (31.3.1990) 99329 244
On the eve of the 8th Five Year Plan (1.4.1992) 135445 246
At the end of 8th Five Year Plan (31.3.1997) 213610 242
At the end of 9th Five Year Plan (31.3.2002) 324614 240
As on 31.3.2003 335647 240
As on 31.3.2004 349994 242
As on 31.3.2005 357939 237
As on 31.3.2006 403705 239
As on 31.3.2007 421089 247
- 10 -
Table 1.3
Turnover during (Rs. Cr) Sl.
No.
Cognate Group
2006-07 2005-06
% change over the
previous year
I. Mining
1.1 Coal & Lignite 34144 34607 -1.34
1.2 Minerals & Metals 14057 12384 13.51
1.3 Crude Oil 65165 54989 18.51
Total (I) 113365 101980 11.16
II. Manufacturing
2.1 Steel 49399 41742 18.34
2.2 Petroleum (Ref & Marketing) 515942 441744 16.80
2.3 Fertilizers 10452 9364 11.62
2.4 Chemicals & Pharmaceuticals 1180 975 21.02
2.5 Heavy Engineering 19454 15038 29.37
2.6 Medium & Light Engineering 10649 9560 11.39
2.7 Transportation Equipment 12535 9619 30.32
2.8 Consumer Goods 3133 1660 88.81
2.9 Agro Based Industries 245 173 42.04
2.10 Textiles 517 604 -14.37
Total (II) 623506 530478 16.03
III. Electricity
3.1 Generation 41580 34633 20.06
3.2 Transmission 3608 3153 14.43
Total (III) 45188 37786 19.59
IV. Services
4.1 Trading and Marketing 94633 81212 16.53
4.2 Transport Services 25842 25528 1.16
4.3 Contract & Construction
Services
5472 4453 22.90
4.4 Ind. Dev. & Tech. Consul.
Services
3493 3246 7.61
4.5 Tourist Services 1037 671 54.38
4.6 Financial Services 12253 10185 20.30
4.7 Telecommunication Services 39638 41756 -5.07
4.8 Section 25 Companies
Total (IV) 182350 167051 9.16
Grand Total (I+II+III+IV) 964410 837295 15.18
(Source – Public Enterprises - Annual survey of CPSEs – 2006-07)
- 11 -
Table 1.4
2006-07 (Rs .in crore)
2005-06 (Rs. in crore)
%
change
Sl.
No.
Cognate Group
Net profit/Loss No. of
CPSEs
Net
profit/Loss
No. of
CPSEs
over the
prev.
yrs
I. Mining
1.1 Coal & Lignite 8853.71 9 8215.72 9 7.77
1.2 Minerals & Metals 5246.05 10 4.39.23 10 29.88
1.3 Crude Oil 18335.46 3 16770.16 3 9.33
Total (I) 32435.22 22 29.25.11 22 11.75
II. Manufacturing
2.1 Steel 7612.7 6 5307.2 6 43.44
2.2 Petroleum (Ref & Marketing) 151.07.36 8 9411.17 8 60.53
2.3 Fertilizers -2474.77 8 -1990.17 8 24.35
2.4 Chemicals &
Pharmaceuticals
-123.45 14 -436.74 14 -71.73
2.5 Heavy Engineering 2123.34 10 976.54 10 117.43
2.6 Medium & Light
Engineering
-29.3 24 -30.89 24 -5.15
2.7 Transportation Equipment 2209.06 10 1044.5 10 111.49
2.8 Consumer Goods -212.92 12 143.15 12 -248.74
2.9 Agro Based Industries -1.58 4 -21.31 4 -92.59
2.10 Textiles -1338.62 5 792.6 14 -268.89
Total (II) 22871.82 101 15196.13 110 50.51
III. Electricity
3.1 Generation 10883.43 7 9078.79 7 19.88
3.2 Transmission 1232.3 2 1009.38 2 22.08
Total (III) 12115.73 9 10088.17 9 20.10
IV. Services
4.1 Trading and Marketing 432.49 18 357.81 18 20.87
4.2 Transport Services 1962.63 12 2527.8 12 -22.36

- 12 -
4.3 Contract & Construction
Services
-80.47 11 190.36 11 -57.73
4.4 Ind. Dev. & Tech. Consul.
Services
373.44 15 355.65 15 5.00
4.5 Tourist Services 82.64 9 61.84 9 33.64
4.6 Financial Services 2827.62 16 2604.2 16 8.58
4.7 Telecommunication
Services
14126.84 4 15226.71 4 -7.22
4.8 Section 25 Companies
Total (IV) 19725.19 85 20943.65 85 -19.22
Grand Total
(I+II+III+IV)
81549.61 217 69536.12 226 17.28
(Source – Public Enterprises- Annual survey of CPSEs – 2006-07)
Note: In 2006-07, 9 operating units of National Textiles Corp. have stopped operations. Hence, total
no. of Operational CPSEs has reduced to 217 from 226 in 2005-06.
1.4.5 Financial ratios: The performance of CPSEs in terms of financial ratios in the
last 10 financial years from 1997-98 to 2006-07 is shown in the Table 1.5:
C.E. : Capital Employed N.W.: Net Worth
PBDITEP: Profit before Depreciation, Interest, Tax, Extra-ordinary item and
Prior Period adjustment.
PBITEP : Profit before interest, Taxes, Extra-ordinary items and Prior Period
Adjustment.
PBTEP : Profit before Taxes, Extra – ordinary items and Prior Period Adjustment.
1.4.6 Contribution of CPSEs to the Economy and Central Exchequer: The share of output of CPSEs in GDP at market price stood at 8.23 per cent in
2006-07 and 8.21 per cent in 2005-06. The CPSEs made substantial contribution to
the Central Exchequer through payment of dividends, interest on government loans
and taxes & duties; the figures are shown in Table 1.6.
����������������������� ����

- 13 -
Table 1.5
Financial ratios of CPSEs
(Rs. in crore)
Particulars 1997-98 98-99 99-00 00-01 01-02 02-03 03-04 04-05 05-06 06-07
Sales to C.E. 110.47 117.01 128.47 138.28 122.77 137.32 139.43 147.56 143.24 145.0
PBDITEP to C.E. 21.24 21.31 20.54 20.91 22.97 24.38 28.15 28.26 24.42 26.77
PBTEP to NW 14.29 13.31 13.72 14.57 16.96 20.10 24.38 25.08 20.41 24.73
PBDITEP to T.O. 19.23 18.21 15.98 15.12 18.71 17.75 20.19 19.15 17.05 18.47
PBITEP to C.E. 14.89 14.99 13.95 14.72 16.21 17.39 21.01 21.50 18. 33 20.91
PBITEP to T.O. 13.48 12.81 10.86 10.64 13.20 12.66 15.07 14.57 12.80 14.42
PBTEP to T.O. 6.96 6.35 5.66 5.45 7.99 8.49 11.28 11.51 10.12 11.62
Net Profit to T.O. 4.92 4.26 3.68 3.42 5.43 5.65 8.40 8.74 8.44 8.46
Net Profit to C.E. 5.44 4.98 4.73 4.72 6.66 7.75 11.71 12.90 12.09 12.26
Net Profit to
N.W.
10.10 8.92 8.92 9.13 11.52 13.37 18.16 19.05 17.03 18.00
Dividend Payout 26.57 37.35 38.07 52.77 31.06 42.57 28.85 31.84 32.56 32.87
(Source – Public Enterprises survey – 2006-07)
Table 1.6
Contribution of CPSEs to the economy
(Rs. In Crores)
Sl. No. Particulars 2006-07 2005-06 2004-05 2003-04
I. On Investment by CPSEs
1. Dividend 18825.68 15200.85 15200.85 9596.45
2. Interest 1975.08 138.22 731.67 794.32
Total (I) 20800.76 15339.07 15932.52 10390.77
II. Taxes and Duties
1. Excise Duty 64026.92 53278.48 44262.34 42963.75
2. Customs Duty 11048.26 8601.18 10431.95 8408.67
3. Corporate Tax 31997.93 26046.69 23613.61 17936.29
4. Dividend Tax 383.12 3242.94 2742.48 1613.00
5. Sales Tax 2817.25 5026.70 4487.80 3821.62
6. Other Duties & Taxes 16654.04 13920.87 9132.97 3901.23
Total (II) 126927.54 110116.86 94671.15 78644.56
Grand Total (I+II) 147728.30 125455.93 110603.67 89035.33

- 14 -
The major share of contribution to Central Exchequer by the CPSEs was by way of
payment of taxes & duties growth of 85.91% followed by dividend (11.74%) and
interest (1.33%).
1.4.7 Revival of Sick CPSEs: The National Common Minimum Programme
(NCMP) stipulates a “strong and effective Public Sector, whose social objectives
are met by its commercial functioning. Endeavour is to modernize and restructure
sick CPSEs and revive sick industry. The chronically loss making CPSEs may be
closed down or sold off, after all the employees are paid their legitimate dues. The
problem of sickness in CPSEs is addressed by the administrative Ministries/
Departments in the Government by evolving appropriate need based strategy
concerning a particular CPSE. Some of the strategies for restructuring / revival of
CPSEs including sick units on long-term basis include:-
• Revival through the process of BIFR;
• Financial restructuring;
• Formation of joint venture by induction of partners capable of providing
technical, financial and marketing inputs; and
• Organizational restructuring and manpower rationalization through approved
Voluntary Retirement Scheme (VRS).
1.4.8 In order to combat industrial sickness particularly with regard to the crucial
sectors, where public money is locked up and for timely detection of sick and
potentially sick industrial companies, Sick Industrial Companies Act (SICA) was
extended to public enterprises in 1993; enabling sick public sector enterprises to be
referred to a quasi judicial body - Board for Industrial & Financial Reconstruction
(BIFR), to take appropriate measures for revival and rehabilitation of potentially
sick industrial undertakings and for liquidation of non-viable companies.
1.4.9 Under the Sick Industrial Companies Act (SICA), 1985, a company is termed sick
if at the end of any financial year, it has accumulated losses equal to or exceeding
its entire net worth. Such industrial company is required to be referred to BIFR for
formulation of rehabilitation/ revival plan. Government set up a Board for
Reconstruction of Public Sector Enterprises (BRPSE) in December, 2004 to advise
the Government inter-alia on the measures to be taken to restructure/revive CPSEs,

- 15 -
including cases where disinvestments or closure or sale are justified. The
concerned administrative Ministries are required to refer the proposals of their
CPSEs identified as 'sick' for consideration of the BRPSE.
1.4.10 Human Resource Management and Personnel Policy: Effective
utilization of Human Resources is one of the most important factors for the
efficient and profitable functioning of an organization. It has special significance
in the management of public sector enterprises. CPSEs employ a large workforce
in different disciplines and the successful operation of these enterprises very much
depend on the skills and capabilities of the workforce. Out of around 16 lakhs
manpower (as on 31.03.07) deployed presently in CPSEs, about 3.65 lakh are in
the supervisory and managerial cadres which represent about 22.12% of total
manpower. In 2005-06, the aggregate amount paid towards salaries & wages and
other benefits including Bonus was to the tune of Rs.45,625 crores; and the cost of
production was Rs.7,35,964 crores. Accordingly, the average of Payment to
employees as percentage of Cost of production is around 6.2%; out of which the
lowest percentage is of Petroleum group i.e. 1.28% and the highest percentage is
of Coal and Lignite group i.e. 39.91. The Table 1.7 shows the number of
employees employed by the CPSEs, their total emoluments as well as per capita
emolument during the last 10 years. As can be seen from Table 1.8, the number of
employees during the period has reduced from 19.59 lakhs in 1997-98 to 16.14
lakhs in 2006-07, which is a reduction of 17.61%. On the other hand, the total
emoluments have increased from Rs.25,385 crores in 1997-98 to Rs.52,574 crores
in 2006-07, which is an increase of 107%. Similarly, the per capita emoluments
have increased from Rs.1,29,582 in 1997-98 to Rs.3,25,738 in 2006-07, which is
an increase of 151%. The Emoluments as percentage of Turnover has decreased
from 9.19% in 1997-98 to 5.45% in 2006-07.
1.4.11 Categorization: The public enterprises are categorized into four Schedules
namely ‘A’, ‘B’, ‘C’ and ‘D’, based on various quantitative, qualitative and other
factors. The quantitative factors are: investment, capital employed, net sales, profit
before tax, number of employees, number of units and value added per employee.
Qualitative factors are: national importance, complexities of problems, level of
technology, prospects for expansion and diversification of activities and
competition from other sectors, etc. while the other factor relates to the strategic

- 16 -
importance of the corporation. The pay scales of Chief Executives and full time
Functional Directors in CPSEs are determined as per the schedule of the concerned
enterprise.
As on 31.3.2007, there were 247 CPSEs. Out of 247 there are 54 Schedule ‘A’, 77
Schedule ‘B’, 48 Schedule ‘C’ and 06 are Schedule ‘D’ enterprises. The rest have
not been categorized. The details of the Board level posts (whole time) as in the
year 2006-07 are given in Table 1.8.
Table 1.7
Number of employees employed by the CPSEs
Year
Employ. (in lakhs)
(excl. Casual &
daily rated
workers)
Emoluments
(Rs. in crore)
Emoluments
(As % of
Turnover)
Per Capita
Emoluments
(Rupees)
1997-98 19.59 25385 9.19 129582
1998-99 19.00 26254 8.46 138179
1999-00 18.06 30402 7.81 168339
2000-01 17.40 38223 8.34 219672
2001-02 19.92* 38556 8.05 193554
2002-03 18.66 42169 7.36 225986
2003-04 17.62 43919 6.96 248481
2004-05 17.00 48629 6.53 286053
2005-06 16.49 46851 5.59 284123
2006-07 16.14 52574 5.45 325738
(*2001-02 the number of employees have increased due to corporatisation of DOT)
Table 1.8
Schedule Chief
Executives
Whole-time
Directors*
Schedule A 54 201
Schedule B 77 181
Schedule C 48 67
Schedule D 06 -
Total 185 449

- 17 -
*(Directors draw salary one scale below the Schedule of the company)
CPSEs have been classified based upon the power vested in the Board of Directors
of the company as Navratna, Miniratna (Category I & II) & others including profit
making, loss making etc. On 31.3.2007, number of CPSEs in this classification has
been given in Table 1.9.
Table 1.9
Category No. of CPSEs
As on 30.5.2008
Navratna 16
Miniratna, Category I 41
Miniratna, Category II 13
Profit making 156
Loss making 59
Listed Companies 45
Non-listed Companies 202
Section 25 & Under Construction 32
1.4.12 Composition of the Board of Directors: The guidelines on
professionalisation of Boards of Directors issued in 1992 provide that outside
professionals should be inducted on the Boards of CPSEs in the form of part-time
non-official Directors and that the number of such Directors should be at least
1/3rd of the actual strength of the Board. In the case of listed CPSEs headed by
Executive Chairman, the number of non-official Directors (independent Directors)
should be at least half the strength of the Board. The guidelines also provide that
the number of Government Directors on the Boards should not be more than one-
sixth of the actual strength of the Board subject to a maximum of two. Apart from
this, there should be some functional Directors on each Board, whose number
should not exceed 50% of the actual strength. For 2006-07, the data for all CPSEs
related to number of CMDs, Chairman, Directors (Functional & Independent) &
Nominee Directors etc have been given in Table 1.10.

- 18 -
Table 1.10
Designation No.
CMDs 122
Chairman-Full Time 4
Chairman-Part Time 42
Managing Directors 33
Functional Directors 371
Independent Directors 306
Government Nominee
Directors
474
1.5 DEVELOPMENTS IN RECENT YEARS – A CRITICAL
OVERVIEW
1.5.1 Social & Economic Development: Independent India has exhibited more
impressive price stability than most developing economies. The inflation rate was,
on an average, in the single digit for almost all the years since Independence. On
the growth rate, the annual GDP growth in the decade of 1950s was 3.6 percent, in
the 1960s it was 4.0 percent, in 1980s it was 5.6 percent and in the 1990’s
(excluding the Gulf war crisis year 1991-92) it was 6.3 percent. In the new
millennium, the growth rate accelerated to 6.9 percent; and during the period from
2003-04 to 2006-07 it has averaged 8.6 percent.
The changes in the social and economic developments that have taken place in the
country since India became independent are quite substantial. The total outlay of
the 1st five year plan (from 1951-56) was Rs.2069 crores, which has increased to
Rs. 66632 crores for the 10th five year plan (2002-07). The population of India in
the year 1951 was around 36 crores and has increased to 103 crores as per the 2001
census. The head count ratio of persons below poverty line has declined from the
level of 54.9% in the year 1973-74 to 36% in 1993-94 (the latest year for which the
NSS data was available). The decline in the urban poverty level from 48% to 36%
is significant as it coincides with the period of rapid urbanization.
1.5.2 During the period since 1997, successive governments have carried forward the
country's economic reforms in Industrial , Trade and Financial sectors. The
����������������������� ����

- 19 -
approach of the Government has been to gradually move towards comprehensive
re-structuring of the economy to reap the benefits of the fast changing global
business environment. Some of the major changes during the past decade from
1.1.97 to 31.12.06 that have significantly contributed to economic reform in the
country are:
a. The Foreign Exchange Management Act (FEMA), 1999 replaced the Foreign
Exchange Regulations Act (FERA), 1973 with the objective of ‘facilitating
external trade and payments’ and ‘promoting the orderly development and
maintenance of foreign exchange market in India’ including introduction of
convertibility of rupees on current account.
b. Further, the enactment of Fiscal Responsibility and Budget Management
(FRBM) Act in 2003 marked a significant reform initiative taken both by
Central Government and some States in the context of fiscal responsibility.
c. The Insurance Regulatory and Development Authority Act, 1999 is a major
milestone in liberalisation as it opens the way to private entry into the insurance
business, which has been a Government monopoly.
d. New Telecom Policy was implemented in 1999 to facilitate India's vision of
becoming an IT superpower and develop a world class telecom infrastructure in
the country.
e. Replacement of MRTP Act, 1969 by Competition Act of 2002, in view of the
policy shift from curbing monopolies to promoting competition. The
Competition Act was enacted that marks a conscious departure from the
previous Monopolies and Restrictive Trade Practices Act (MRTP). The
Competition Law aims at doing away with the rigidly structured MRTP Act
and is more flexible. Also, the regulatory authority under the Act i.e.
C̀ompetition Commission of India’ is being set-up with the aim of centralizing
under one umbrella all controls to eliminate the negative aspects of
competition.
f. Electricity Act, 2003 was enacted to create competitive environment which will
result in enhancing quality and reliability of service to consumer.
g. The Foreign Trade Policy was notified for the year 2004-2009 incorporating the
Export and Import Policy for the year 2002-2007; several other initiatives
have been taken for Export Promotion.
����������������������� ����
- 20 -
h. The Foreign Direct Investment policy has been reviewed and liberalised to
promote FDI in various sectors.
i. Tax reforms have taken place in a major way including rationalization of both
direct and indirect tax laws. Customs tariffs have been lowered and Service tax
net is being widened. The input tax credit for both excise duty and service has
been streamlined. One of the important tax reforms has been introduction of
State-level Value Added Tax to replace the Sales Tax. Introduction of Goods
& Services Tax regime to be effective from 01.04.2010 is underway.
j. A number of Rules and Regulations have been issued by the Securities and
Exchange Board of India (SEBI), to develop the capital market on healthy lines
and protect the investors’ interests in securities.
k. Special Economic Zones (SEZs) are being set up to enable hassle free
manufacturing and trading for export and to free the industry from the plethora
of rules and regulations governing imports and exports.
1.5.3 If one looks at the changes that have taken place in the country during post-
liberalization period when the New Economic Policy (NEP) of 1991 was
announced, and more particularly from 1997 onwards, it becomes clear that India
has opted for an open economy with greater reliance upon market forces. In a
nutshell, global competition has ended Indian industry’s monopoly, in local market
and broken the shackles of ‘License Permit Raj’.
1.6 NEW OPPORTUNITIES
1.6.1 In the competitive industrial scenario, one of the key components to increase the
bottom line in the globalized economy is to find out how an enterprise leverages
capability at a global level for procurement, sourcing and delivering all its
products and services across markets far more rapidly and takes advantage by
cross leveraging between various markets. In this context, Mergers & Acquisitions
(M&A) have gained importance during the past few years and a storm of mergers
of huge values have been notched-up. In response to the growing business and to
release productive energies and to promote creativity of Indian businesses, the
regulators have also issued guidelines to facilitate smooth transactions as well as
making business restructuring tax neutral. Business consolidation of market share,
synergies of operations, reduction of time and money in entering the domestic &
����������������������� ����
����������������������� ����

- 21 -
foreign market, reducing uncertainty of market share, to meet end-to-end solution
needs, buying out competition, realization of stock market valuations, create value
for shareholders, etc. are some of the reasons leading to spur in M&A activities
within India as well as promote overseas acquisitions by Indian companies.
1.6.2 Integration of Indian economy with global markets has thrown up new
opportunities and challenges. Some of the public sector enterprises with strategic
vision are actively exploring new avenues and have increased their activities to go
in for mergers, acquisitions, amalgamations, takeovers and for creating new joint
ventures. The Navratna CPSEs, which enjoy greater autonomy to incur capital
expenditure and enter into joint ventures in India and abroad should avail of these
opportunities for rapid growth overseas. Acquisitions, JVs and green field projects
in Petroleum Sector have already taken place and are under active consideration in
Power, Coal and Mining Sectors.
1.6.3 Another important initiative towards re-structuring of pubic sector enterprises is
‘Disinvestment’ in select CPSEs. The Statement of Industrial Policy of 1991
stated that in the case of selected enterprises, part of Government holdings in the
equity share capital of these enterprises will be disinvested in order to provide
further market discipline to the performance of public enterprises.
1.6.4 Some CPSEs have been such as Videsh Sanchar Nigam Ltd. (VSNL), Indian
Petrochemicals Corporation Ltd. (IPCL), Maruti Udyog Limited (MUL), CMC
Ltd., etc. have been privatized. In addition, there are CPSEs which have been
acquired by other CPSEs by way of disinvestment and open bidding such as
acquisition of IBP by Indian Oil Corporation Limited. There are also instances of
acquisition of private firms by CPSEs as in the case of MRPL, which was a joint
sector company and became a CPSE subsequent to acquisition of its majority
shares by ONGC. There are also cases of domestic offerings, GDR listing,
offloading of some equity shares in the market or to another organization, and
forming joint-ventures, by CPSEs.
1.7 LABOUR REFORMS
1.7.1 The first National Labour Commission, which had submitted its report in 1969,
had promised a lot in the direction of social security, social welfare, wages, social
insurance, industrial relations, industrial adjudication, collective bargaining, etc. In
����������������������� ����

- 22 -
sequel to the recommendations made in the report of the first National Commission
on Labour, a series of enactments were passed. After a gap of around 30 years, the
Second National Labour Commission (NLC) was constituted to suggest
rationalization of existing laws relating to labour in the organized sector, and to
suggest an umbrella legislation for ensuring minimum level of protection to the
workers in the unorganized sector. The report was submitted in the year 2002 to
the Government. The need for setting up of Second NLC was felt due to vast
changes occurring in the economy during the last three decades particularly in the
post-liberalization period.
1.7.2 The National Common Minimum Programme (NCMP) of the present Government
also states that labour laws other than Industrial Disputes Act, 1947 that create
Inspector Raj will be re-examined and procedures harmonized and streamlined.
More emphasis is being laid down to build effective labour laws, which reflect the
need for a change in the mindset and the need for major reforms to address the
issue of globalization.
1.8 HR PERSPECTIVE
1.8.1 Human Resources (HR) is one of the most complex and challenging fields of
management, as it deals with the people dimension in business management. The
biggest challenge now being faced by CEOs is HR as it plays a strategic role in the
growth of an organization and thereby maximizing returns on investment. The HR
management’s role is required to be perceived as business strategic partner in the
organization and it has to identify its key role with clarity in the context of
organizational working as well as contributor to organization’s strategy. Strategic
HR practices help the organization in achieving long-term and short-term goals
through optimum utilization of human resources. This involves the development of
human resources objectives, which are in alignment with the enterprise objectives.
Thus, there is a new agenda in the role of HR and it has to come out from its
traditional role of managing HR alone.
1.8.2 Pay-for-Performance philosophy has become an emerging HR trend, which
increases organizational effectiveness by aligning employee effort to the
organizational mission. The rating of accomplishment of individual, team or
����������������������� ����

- 23 -
business groups and having distinct differences in performance incentives between
good performers and non-performers send clear messages to the workforce that
deliverance of results affects everyone in the organization.
1.8.3 The changes in industrial scenario have sent clear signals to the public sector to re-
visit their Human Resources (HR) Management practices and formulate HR
strategies with focus on profitability on long-term basis. To achieve this, the thrust
has to be on competitive HR policies & practices. HRM should now focus to build
enterprises that change, learn, move and act faster than those of its competitors;
and it is time to build competitive and not merely comfortable public sector
enterprises. HRM of public sector enterprises is also required to keep pace with the
changing legal and governmental regulations.
1.8.4 Human resources play an important role in development of businesses and is the
main differentiator of excelling companies from other companies. In view of the
growth in business, expanding market, high demand by consumers and change in
technology, the biggest challenge being faced during the last decade by companies
has been the need to meet their requirement for talented people. The rush for hiring
of people is being seen in all the sectors such as IT & IT enabled services,
infrastructure, engineering, banking, airline, hospitality, biotech, medical, retail,
etc. The demand-supply equation for talented professionals is heavily skewed in
favour of the former; and as a result both attraction and retention have emerged as
major challenges for HR professionals. The problem is not only limited within the
country but it has become a global phenomenon, and even the MNCs and global
recruitment firms are hiring people from India to meet their demands. However, in
recent times, one can also see that the trend is gradually reversing and now
expatriates are being assigned to or hired for Indian operations, and even a lot of
expatriate Indians working abroad are coming back because India has now a lot to
offer. The future outlook confirms that global nomad employees, who move from
country to country on varying assignments will become a common feature.
1.8.5 In public sector, HR practices and its management have a long way to go in order
to achieve a professional and competitive HR standards. There is lot to be done by
HR in terms of identifying & nurturing talent; creating a performance-driven
culture; and bringing about changes in the mindsets of employees at all levels so
����������������������� ����
����������������������� ����
����������������������� ����
- 24 -
that all of them aim at providing value to customers. Multiple roles are, thus,
required to be played by HR professionals such as business strategic partners, the
change agents, the consultants, the service-providers, etc.
1.8.6 The public sector enterprises have always been considered as ‘model employers’.
They used to recruit the brightest people in a very fair selection process and
generally through open competition. The jobs in public sector always used to be
the most preferred, by educated middle-class, and the talent was generally given its
due respect in the public sector. However, the situation has changed in the last 10
years. Earlier there was little opportunity available for professionals to migrate
from one organization to another, but during the last decade ample opportunities
have been opened up for them to leave the organization. To add to this, the demand
for talent is not confined to any particular sector of industry but the professionals
are moving across sectors. As a result, public sector is under huge pressure in
terms of attracting and retaining talent.
1.9 PAY REVISION IN CPSEs
1.9.1 The right approach requires that employees or the work force be treated as resource
and thus, the relationship between the management and employees should be
valued in high esteem in an organization. It is high time that CPSEs should re-
orient themselves in the matter of human capital and they must ascertain
motivational methods for both tangible and intangible employees. It is in this
context that periodic revision of remuneration in the CPSEs is necessary. The
Salary revision for the Executives & Non-Unionised Supervisors is done by the
Government of India through the Department of Public Enterprises (DPE), the
nodal Department for CPSEs.
1.9.2 For the revision of salary of workmen, DPE issues broad guidelines to be followed
by the CPSEs. The final settlement is arrived at by negotiation with the unions of
workmen of the CPSEs. The Board of Directors of every CPSE is empowered to
negotiate with the unions. The last wage negotiation between the managements and
the workers’ unions was from 1.1.1997, for 10 year periodicity. The guidelines for
the 7th round of negotiations had been issued vide DPE OM dated 09.11.2006.

- 25 -
1.9.3 Pay revision of employees under CDA Pattern in CPSEs CDA pattern pay scales are applicable to some of the clerical staff, unionized
cadres and executives of 69 CPSEs, who were on the rolls of these companies upto
31.12.1988 and were in receipt of CDA pattern pay scales during that time. A
High Power Pay Committee (HPPC) was appointed by the Government in
pursuance of the Supreme Court order dated 12.3.1986. The HPPC submitted its
Report to the Government on 24.11.1988. Its recommendations have been
implemented in these CPSEs. In pursuance of the Supreme Court order dated
3.5.1990 read with the subsequent order dated 28.8.1991, IDA pattern and related
scales of pay have been introduced in these CPSEs with effect from 1.1.1989. Out
of 69 CPSEs (covered under HPPC), at present there are 58 CPSEs, which are
following both CDA and IDA pattern scales of pay. As per the recommendations
of the High Power Pay Committee and Supreme Court orders thereon, the
employees following CDA pattern of scales of the Central Public Sector
Enterprises would get pay revision only as and when similar changes are effected
for the Central Government employees. Accordingly, the recommendation of 5th
Central Pay Commission w.e.f. 1.1.1996 had also been extended to the employees
of CPSEs following CDA pattern of scales. In addition, the employees of CPSEs
following CDA pattern have also been allowed the benefit of merger of 50% of
DA with basic pay w.e.f 1.4.2004. This benefit has been allowed to the employees
of CPSEs that are not loss making and are in a position to absorb the additional
expenditure on account of merger of DA with basic pay from their own resources
without any budgetary support from the Government.
1.9.4 Pay Revision Committees
The First Pay Revision Committee was appointed vide Resolution dated 10th
December 1996, under the Chairmanship of Mr. Justice S. Mohan (Retd Judge,
Supreme Court) with three Members and a Member Secretary, to examine the
structure of pay, allowances, perquisites and benefits for the Board level, Below
Board Level Executives & Non-Unionized Supervisors, taking into account the
total package of benefits available including non-monetary ones and suggest
changes therein which may be desirable and feasible. The Committee was
requested to make its recommendations initially within a period of six months

- 26 -
which was further extended upto 31.10.1998 after taking into account the Report
of the Vth Central Pay Commission.
1.9.5 The 2nd Pay Revision Committee has been constituted by the Department of Public
Enterprises (DPE) vide Resolution dated 30th November 2006, under the
Chairmanship of Mr. Justice M. Jagannadha Rao, with 4 Members and a Member
Secretary (Annex – 1.1 ). The Committee has been requested to submit its
recommendations to the Government within a period of 18 months. While
finalizing its report, the Committee will also take into account the report of 6th
Central Pay Commission. Dr. Ramesh Chandra Panda, the then Secretary,
Department of Public Enterprises was Ex-officio member till his superannuation
on 29.2.2008. Thereafter, Shri R. Bandyopadhyay, assumed the charge of
Secretary, Deptt. of Public Enterprises on 03.03.2008 and became the Ex-officio
member of the Committee. 1.9.6 In view of the present scenario and the challenges ahead for the public sector and
in particular the competition from the Private Sector and MNCs, the Second Pay
Revision Committee is conscious of its role to recommend a comprehensive pay
package to the CPSEs so as to improve efficiency, productivity & economy
through rationalization of organizational structures, systems and processes. The
Committee also emphasise the need for functional and operational autonomy for
the CPSEs along with the need to improve transparency, discipline, accountability,
assimilation of technology and research and development. The committee has
taken into account current categorization of CPSEs such as Schedule ‘A’, ‘B’, ‘C’
and ‘D’ and their status as Navratna, Miniratna, loss / profit making CPSEs, and
also CPSEs referred to BIFR or BRPSE as well as CPSEs under Industrial DA /
Central DA pattern.
1.9.7 The Committee also views that its recommendations should harmonize the
functioning of the CPSEs with the demands of the emerging national and global
economic scenario. The Committee has kept in mind the other relevant factors like
totality of benefits available to the employees, need of rationalization and
simplification thereof, prevailing pay structure and retirement benefits available, as
well as economic conditions in the country, need to observe financial prudence in
the management of CPSEs, resources of the CPSEs and the demands thereon, on

- 27 -
account of economic and social development and the global economic scenario
and competitive environment.
1.9.8 While making recommendations, the Committee has kept in mind the general
principles, financial parameters and conditions, which should govern the
desirability, feasibility and continuation/modification of the Productivity Linked
Incentives Schemes and Performance Related Payments.
1.9.9 The 2nd Pay Revision Committee has interacted with many CPSEs, Officers
Associations of various CPSEs and other agencies and consultants including IPE,
Department of Atomic Energy, Department of Defence Production, PESB, BIFR
and some private enterprises during its sittings at different locations.
*****