chapter 1: taiwan steel industries briefing - platts taiwan steel industries profile-1 1.small up...
TRANSCRIPT

0
Taiwan Steel Market outline
first map of Taiwan in1625
Chapter 1: Taiwan Steel Industries Briefing
Chapter 2: Taiwan Steel Trade & Consumption
Chapter 3: CSC’s Presence & Efforts
Chapter 4: Steel Trade Issues
Chapter 5: Conclusion

1
Taiwan Crude Steel Apparent Use
Two Demand Peak:1997 and 2004。 Demand declines after 2004, and further down to half of 2009 right after
financial crisis. Demand resumed in 2010,2011, but still below 10 year average(22019). Apparent use
recovers 80% of peak value. Crude steel down 9% during 2003~2011(23.82萬mmt→21.72mmt),same period, China
grew two times (230mmt→680mmt).
0
5000
10000
15000
20000
25000
30000
72年 74年 76年 78年 80年 82年 84年 86年 88年 90年 92年 94年 96年 98年 100年
26513 26462
13535 21719
單位:千噸
1983 1985 1987 1989 1991 1997 2005 2009 2011
2
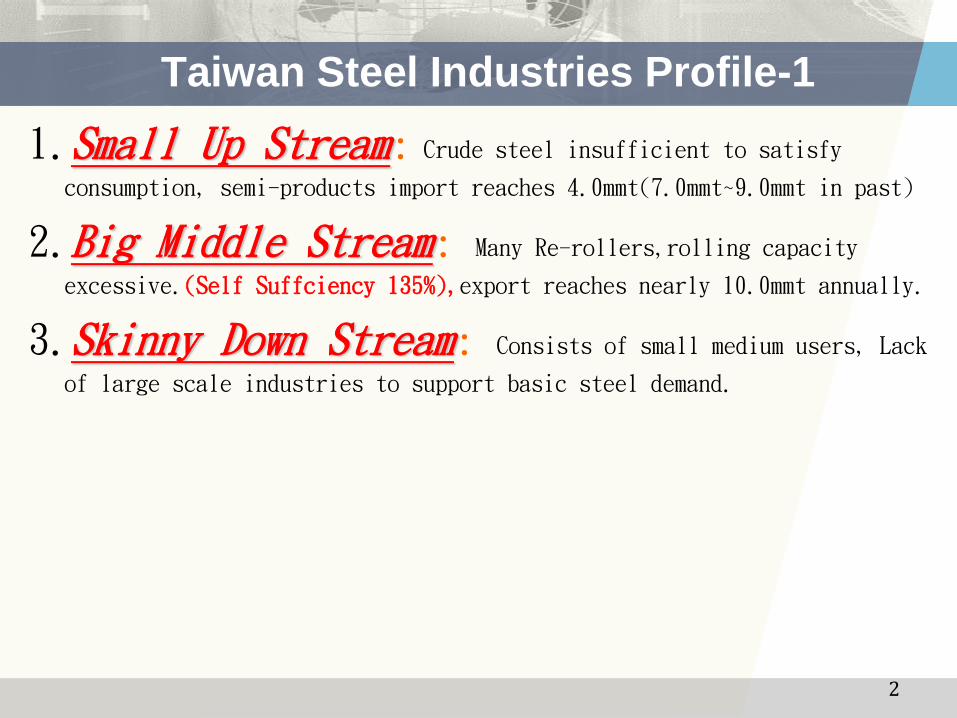
Taiwan Steel Industries Profile-1
1.Small Up Stream: Crude steel insufficient to satisfy
consumption, semi-products import reaches 4.0mmt(7.0mmt~9.0mmt in past)
2.Big Middle Stream: Many Re-rollers,rolling capacity
excessive.(Self Suffciency 135%),export reaches nearly 10.0mmt annually.
3.Skinny Down Stream: Consists of small medium users, Lack
of large scale industries to support basic steel demand.

3
Taiwan Steel Industries Profile-2
4.Steel Industries entering maturity stage,plus down stream industries going out, domestic steel demand hard to
grow.
5.Operation rate and Self Sufficiency:
Capacity, production exceeding domestic demand.。
6.Export oriented tendency: Export reliance getting
higher(40%),became an export oriented industry.
In 2011, production 24.25mmt, export 9.75mmt.

4
Taiwan Steel Industries Profile-3
7.Many Re-Rollers Single Rolling (coating) plants small
investment, operation flexible but with HR price volatile, products
simple without segmentation fierce competition, making money
shorter, making loss longer, financial unstable.
8. Taiwan market small scale: shallow
saucer-type market import tariff zero, easily affected
by prices movements of international markets and nabouring markets.
9.Export reliance too high, easily
entangled in AD cases.
Indonesia: HR sunset review/CR; Australia HR/GI/GL;
Thailand: CR; Malaysia:HR/ Wire Rod…

5
Domestic industries generally oversupply, export ratio high
category Self
Suffiency
Domestic supply Export reliance
Sale Orientation
short over domestic export
plate 93% V 12% V
Bar rod 97% V 14% V
HR 141% V 39% V
CR 244% V 57% V
EG 180% V 68% V
CG 176% V 58% V
ES 293% V 68% V
Color 206% V 47% V
Re-bar 102% V 3% V
H section 124% V 20% V
Pipe & tube 100% V 20% V
Stainless HR 64% V 18% V
Stainless CR 214% V 77% V
note:Self Suffiency=production (self use excl.)/demand、export reliance=export/production(self use excl.)
Stainless HR and CR including self use; carbon steel excluding self use. Stainless HR mainly for domestic market with little export.
6
Taiwan Steel Market outline
first map of Taiwan in1625
Chapter 1: Taiwan Steel Industries Briefing
Chapter 2: Taiwan Steel Trade & Consumption
Chapter 3: CSC’s Presence & Efforts
Chapter 4: Steel Trade Issues
Chapter 5: Conclusion

7
Taiwan Steel import & export(unit:000 mt)
0
2000
4000
6000
8000
10000
12000
14000
16000
90 91 92 93 94 95 96 97 98 99 100
0
2000
4000
6000
8000
10000
12000
進口含半成品 進口不含半成品 出口含半成品 出口不含半成品
CY 2001 2002 2003 2004 2005 2006 2007 2008 2009 2010 2011
Import (incl. semi) 8187 10970 11000 13605 10481 10050 9135 9115 6433 8330 7399
Import (excl. semi) 2709 3653 3963 4822 3902 3750 4041 3917 2179 3737 3421
Semi Import 5478 7317 7037 8783 6579 6300 5094 5198 4254 4593 3978
Exp (incl. semi) 7800 8947 9524 9194 9014 10306 10799 9546 9657 9640 10114
Exp (excl. semi) 7734 8883 9323 8095 8780 10177 10430 8993 8893 9177 9747
Exp Reliance 34% 35% 37% 31% 35% 39% 43% 41% 49% 40% 40%
Import incl. semi Import excl. semi Export incl. semi Export excl. semi
2001 2002 2003 2004 2005 2006 2007 2008 2009 2010 2011
8
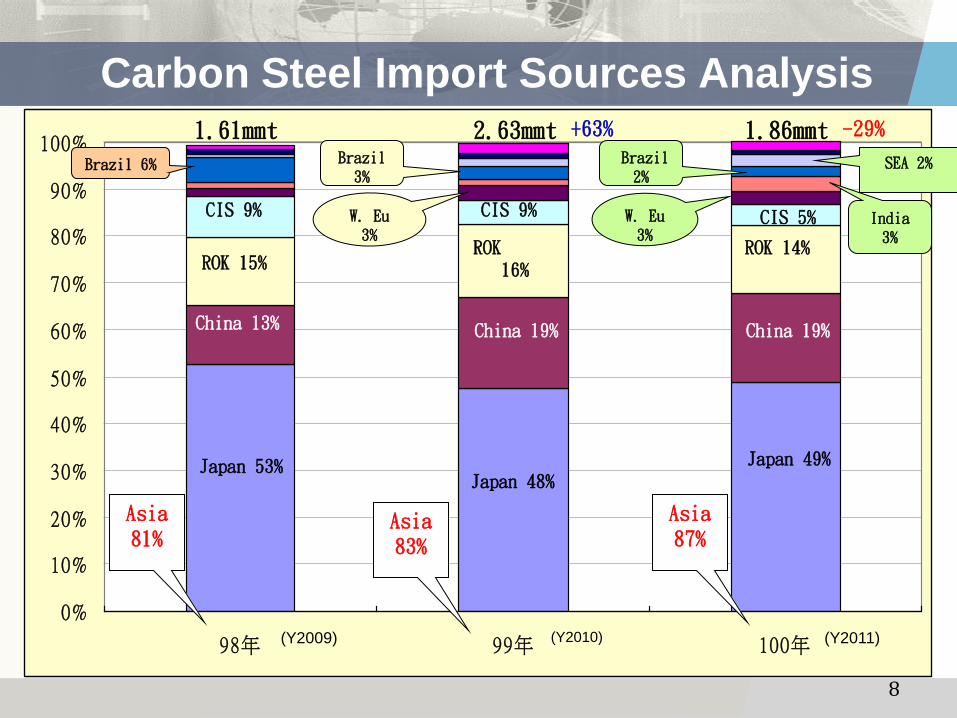
Carbon Steel Import Sources Analysis
0%
10%
20%
30%
40%
50%
60%
70%
80%
90%
100%
98年 99年 100年
1.61mmt 2.63mmt 1.86mmt
Brazil 6% Brazil 3%
Japan 53%
China 13%
ROK 15%
CIS 9%
Japan 48%
China 19%
ROK 16%
CIS 9%
Japan 49%
China 19%
ROK 14%
CIS 5%
India 3%
SEA 2% Brazil 2%
W. Eu 3%
W. Eu 3%
Asia 81%
Asia 83%
Asia 87%
+63% -29%
(Y2009) (Y2010) (Y2011)

Taiwan’s Import of Steel Products (unit: mt)
9
Rank Country
Total 6,634,304 100% 4,966,353 100% 2,985,353 100% 4,240,814 100% 3,905,220 100% 2,393,818 100%1 Japan 2,299,575 34.7% 1,620,239 32.6% 1,350,785 45.2% 1,580,182 37.3% 1,321,125 33.8% 782,839 32.7%2 China 1,461,518 22.0% 1,511,011 30.4% 379,568 12.7% 856,141 20.2% 1,084,057 27.8% 643,948 26.9%3 ROK 665,205 10.0% 574,003 11.6% 409,406 13.7% 700,576 16.5% 515,301 13.2% 404,721 16.9%4 Russia 369,323 5.6% 429,607 8.7% 74,903 2.5% 114,776 2.7% 267,183 6.8% 96,997 4.1%5 Thailand 31,393 0.5% 23,798 0.5% 30,826 1.0% 75,995 1.8% 62,300 1.6% 43,237 1.8%6 India 29,119 0.4% 13,796 0.3% 26,509 0.9% 41,319 1.0% 66,416 1.7% 31,289 1.3%7 Vietnam 30,631 0.5% 16,380 0.3% 17,489 0.6% 49,525 1.2% 30,246 0.8% 18,636 0.8%8 Australia 15,286 0.2% 16,810 0.3% 20,188 0.7% 40,454 1.0% 22,090 0.6% 16,055 0.7%9 Malaysia 78,987 1.2% 11,906 0.2% 6,157 0.2% 13,416 0.3% 17,211 0.4% 6,864 0.3%
10 Hong Kong 2,494 0.0% 2,506 0.1% 2,340 0.1% 3,667 0.1% 5,446 0.1% 5,011 0.2%11 Indonesia 6,757 0.1% 9,145 0.2% 3,390 0.1% 12,204 0.3% 12,828 0.3% 4,485 0.2%12 Philipine 3,227 0.0% 2,633 0.1% 2,028 0.1% 3,033 0.1% 3,632 0.1% 2,974 0.1%13 New Zealand 239 0.0% 131 0.0% 443 0.0% 252 0.0% 1,425 0.0% 1,846 0.1%14 Singapore 1,487 0.0% 2,174 0.0% 1,167 0.0% 3,648 0.1% 2,845 0.1% 1,734 0.1%15 Sri Lanka 1 0.0% 1 0.0% 0 0.0% 0 0.0% 0 0.0% 87 0.0%16 Pakistan 122 0.0% 19 0.0% 94 0.0% 0 0.0% 48 0.0% 47 0.0%17 Brunei 5 0.0% 1 0.0% 0 0.0% 1 0.0% 44 0.0% 14 0.0%18 Bangladesh 18 0.0% 10 0.0% 344 0.0% 32 0.0% 0 0.0% 0 0.0%19 Myanmar 0 0.0% 0 0.0% 0 0.0% 0 0.0% 0 0.0% 0 0.0%20 Cambodia 0 0.0% 0 0.0% 0 0.0% 0 0.0% 3 0.0% 0 0.0%
Sub total 4,995,387 75.3% 4,234,170 85.3% 2,325,637 77.9% 3,495,221 82.4% 3,412,200 87.4% 2,060,784 86.1%
2007 2008 2009 2010 2011 2012(1~8)
1. Due to weak demand, total import estimates 10% down in 2012.
2. Japan remains No. 1 import source be it weak or strong years.
3. ROK market share increases gradually recently.

10
Carbon Steel Export Destination Analysis
0%
10%
20%
30%
40%
50%
60%
70%
80%
90%
100%
98年 99年 100年
China 31% China 27% China 24%
7.66mmt 7.71mmt 8.23mmt
N. East Asia 17% N. East
Asia 15% N. East Asia 17%
SEA 35%
SEA 34% SEA 34%
N.America 3%
Oceania 3%
M.East 2% S.Asia
2%
N. America 7%
Others 5% Others 6%
Oceania 5% M. East
1%
S.Asia 3%
Others 6%
Oceania 4%
N.America 8%
S.Asia 3%
Asia 86%
Asia 79%
Asia 78%

Taiwan’s Export of Steel Products (unit: mt)
11
1. After financial crisis, we are recovering but not completely.
2. Accompanying China’s oversupply, our export to China decrease gradually.
Rank Country
Total 10,438,071 100% 9,011,870 100% 8,816,238 100% 9,172,188 100% 9,686,969 100% 6,571,978 100%1 China 2,472,796 23.7% 1,716,063 19.0% 2,077,892 23.6% 1,776,642 19.4% 1,609,892 16.6% 1,014,509 15.4%2 Japan 920,011 8.8% 761,690 8.5% 622,487 7.1% 776,061 8.5% 909,175 9.4% 605,013 9.2%3 Malaysia 774,007 7.4% 630,914 7.0% 609,861 6.9% 791,463 8.6% 725,654 7.5% 504,114 7.7%4 Vietnam 730,582 7.0% 729,724 8.1% 928,972 10.5% 690,658 7.5% 780,154 8.1% 487,603 7.4%5 Indonesia 348,515 3.3% 377,929 4.2% 353,158 4.0% 445,199 4.9% 563,177 5.8% 443,172 6.7%6 Thailand 301,776 2.9% 338,915 3.8% 365,357 4.1% 440,725 4.8% 507,724 5.2% 412,380 6.3%7 ROK 415,447 4.0% 488,276 5.4% 837,080 9.5% 613,854 6.7% 761,553 7.9% 405,763 6.2%8 Hong Kong 949,681 9.1% 716,251 7.9% 613,676 7.0% 556,145 6.1% 501,335 5.2% 243,676 3.7%9 Australia 271,152 2.6% 277,029 3.1% 213,510 2.4% 344,355 3.8% 286,113 3.0% 229,312 3.5%
10 Philipine 403,940 3.9% 323,034 3.6% 368,990 4.2% 319,282 3.5% 333,578 3.4% 213,174 3.2%11 Singapore 217,917 2.1% 242,440 2.7% 254,078 2.9% 245,670 2.7% 227,378 2.3% 179,066 2.7%12 India 112,008 1.1% 95,175 1.1% 154,653 1.8% 174,885 1.9% 149,528 1.5% 133,159 2.0%13 Bangladesh 57,293 0.5% 70,931 0.8% 56,378 0.6% 55,669 0.6% 62,133 0.6% 50,148 0.8%14 Russia 48,167 0.5% 20,261 0.2% 16,059 0.2% 38,353 0.4% 32,395 0.3% 21,108 0.3%15 New Zealand 33,648 0.3% 31,296 0.3% 24,213 0.3% 25,911 0.3% 29,645 0.3% 20,208 0.3%16 Pakistan 35,791 0.3% 24,515 0.3% 40,217 0.5% 27,977 0.3% 38,735 0.4% 18,297 0.3%17 Sri Lanka 11,621 0.1% 8,328 0.1% 6,673 0.1% 12,012 0.1% 16,228 0.2% 11,997 0.2%18 Myanmar 7,403 0.1% 9,921 0.1% 19,703 0.2% 19,519 0.2% 18,891 0.2% 11,473 0.2%19 Cambodia 4,881 0.0% 7,690 0.1% 7,555 0.1% 12,914 0.1% 16,678 0.2% 9,718 0.1%20 Brunei 919 0.0% 1,457 0.0% 3,192 0.0% 13,657 0.1% 14,888 0.2% 7,639 0.1%
Sub Total 8,117,555 77.8% 6,871,839 76.3% 7,573,704 85.9% 7,380,951 80.5% 7,584,854 78.3% 5,021,529 76.4%
2007 2008 2009 2010 2011 2012(1~8)
Apparent Use by Products in 2011 (unit: 000mt)
12
Production Import Export Apparent Use
Crude Steel 20,175 21,719
Steel Products 24,425 3,421 9,747 18,099
Plate(incl. HR plt) 1,336 372 157 1,551
Bar 1,428 331 305 1,454
Wire Rod 1,959 307 205 2,061
HR 7,304 486 2,829 4,961
CR(incl. BP) 2,644 163 1,548 1,259
EG 269 69 166 172
ES 624 56 391 289
GI 2,645 286 1,539 1,392
Color Steel 810 6 390 426
Re-bar 5,843 3 185 5,661
H Section 1,014 35 176 873
pipe 919 172 164 927
Stainless HR 832 690 194 1,328
Stainless CR 1,120 176 857 439
Stainless Bar Rod 308 44 114 238
Stainless pipe 295 15 156 154
Slab 8,312 3,010 1 11,321
Billet 10,538 902 312 11,128
1. Taiwn became a
net export country
since 2002 with
surplus around
5~6mmt per year.
2. Taiwan still imports
semi-product about
4~5 mmt per year.
1. Steel products exclude self use for down stream
processes; slab, billet incude self use.
2. Crude steel apparent use= steel products apparent
use*1.2
3. Apparent use= production excluding self use
+import-export
Note:

13
Taiwan Steel Market outline
first map of Taiwan in1625
Chapter 1: Taiwan Steel Industries Briefing
Chapter 2: Taiwan Steel Trade & Consumption
Chapter 3: CSC’s Presence & Efforts
Chapter 4: Steel Trade Issues
Chapter 5: Conclusion
14
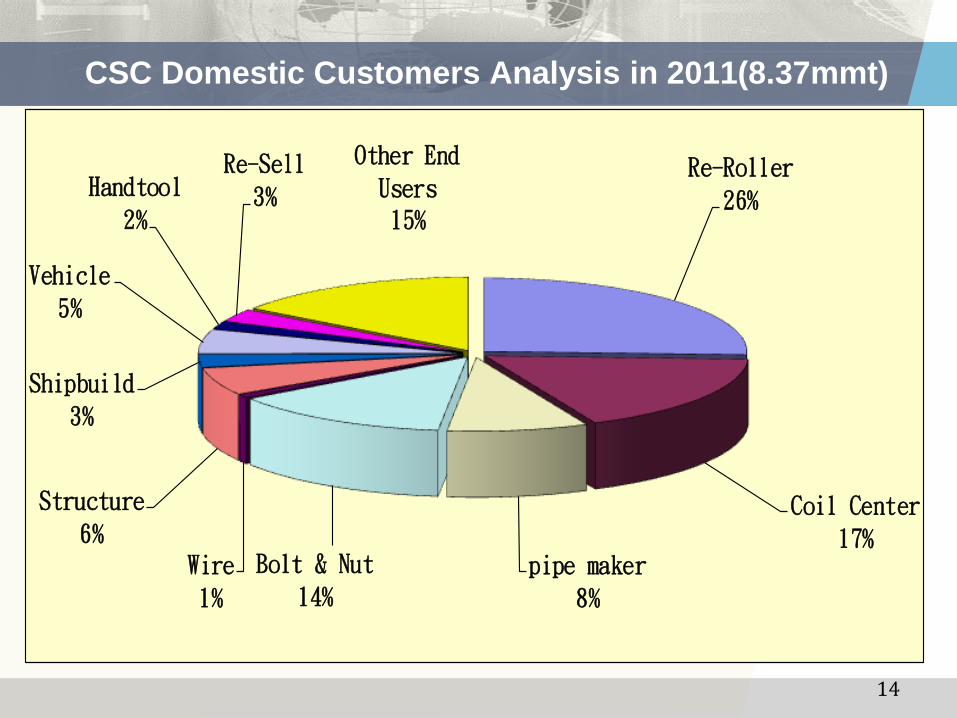
CSC Domestic Customers Analysis in 2011(8.37mmt)
Re-Roller
26%
Coil Center
17%pipe maker
8%
Bolt & Nut
14%Wire
1%
Structure
6%
Shipbuild
3%
Vehicle
5%
Handtool
2%
Re-Sell
3%
Other End
Users15%

15
CSC Domestic Share in 2011
CSC
27%
others
53%
imp
20%
CSC
80%
imp
20%
CSC
49%
others
16%
imp
35%
CSC
67%
other
22%
imp
11%
CR 1.45mmt
JPN 5% ROK 3% China3%
GI
1.42mmt China10% JPN 9%
EG
0.20mmt JPN 34%
ES
0.29mmt
JPN 15% USA 2% UK 1%
Germany 1%
CSC68%
others9%
import23%
China12% Japan 4% Brazil 3% ROK 1%
Plate 1.61mmt
CSC
59%
others
22%
import
19%
Japan 6% China 4% ROK 2%
others 6%
Wire Rod
3.40mmt CSC
29%
others
62%
Import
9%
Japan 7% ROK 2%
Russia 1%
HR 5.38mmt

ISO 9001
TS16949
JIS Mark
TAF (Lab)
ELV
16

a) Hot Rolled Steel (Pickled & Oiled)
Designation Steel Grade
JFS A1001 JSH270C, 270D, 270E, 370W,400W, 440W, 440R,
540R, 590R, 780R, 590Y
JIS G3113 SAPH310, 370, 400, 440
JIS G3134 SPFH490, 540, 590
SAE J1392 GR.050, 060, 070, 080YLO
ASTM A1011 CS, DS, HSLA-F GR.50, GR.60, GR.70, GR.80
EN DD11, DD12, DD13, DD14; S315MC, S355MC,
S420MC, S460MC, S500MC, S550MC…
Automaker
Standard Toyota, Honda, Nissan, VW, GM, Chrysler …
17
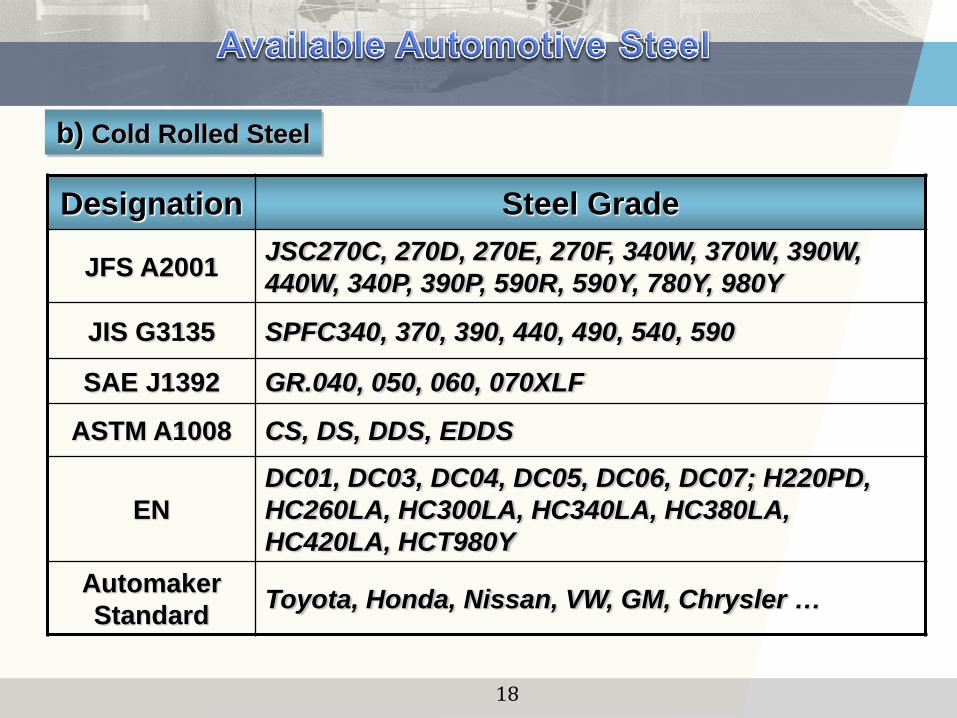
b) Cold Rolled Steel
Designation Steel Grade
JFS A2001 JSC270C, 270D, 270E, 270F, 340W, 370W, 390W,
440W, 340P, 390P, 590R, 590Y, 780Y, 980Y
JIS G3135 SPFC340, 370, 390, 440, 490, 540, 590
SAE J1392 GR.040, 050, 060, 070XLF
ASTM A1008 CS, DS, DDS, EDDS
EN
DC01, DC03, DC04, DC05, DC06, DC07; H220PD,
HC260LA, HC300LA, HC340LA, HC380LA,
HC420LA, HCT980Y
Automaker
Standard Toyota, Honda, Nissan, VW, GM, Chrysler …
18

c) Hot Dip Galvanized Steel(GA,GI)
Designation Steel Grade
JFS A3011 JAC270C, 270D, 270E, 270F, 270H, 340H, 340P, 390P,
440R, 590R, 390W, 440W, 590Y, 780Y, 980Y
EN 10346
DX51D, DX52D, DX53D, DX54D, DX56D
HX260LAD, HX300LAD, HX340LAD, HX380LAD,
HX420LAD, H220PD, H260PD, H300PD, HX180YD,
HX220BD, HX220YD, HX260YD, HX300YD,
HCT600X, HCT780X, HCT980X……
Automaker
Standard Toyota, Honda, Nissan, VW, GM, Chrysler …
19
CSC Development Roadmap of CR Auto Steels
20
Tensile
Str
ength
(M
Pa)
200
300
400
500
600
700
800
900
1000
1100
1200
1300 Mass Production
Under Development
02’ 06’ 03’ 05’ Year 10’ 04’ 11’
980Y
370
P
780Y
590Y
HS-IF steels
and
BH steels
Dual
Phase
steels
340
H
390
P 340P 270
H
HSLA
1180Y
07’ 08’ 09’
590R 500LA
∣
260LA
01’ 00’ 99’ 98’
270C~F
IF steels
The HS-IF steels, BH steels, HSLA steels and DP steels has been
developed for automobile use.

21
CSC DOMESTIC STRATEGIES TO DEVELOP ADVANCED TECHNOLOGY
AND GREEN PROCESSES TO REDUCE CO2 EMISSION AND TO INCREASE HIGH GRADE PRODUCTS:
1.TO EXPAND HIGH GRADE PRODUCTION LINES:
DRAGONSTEEL PHASE 2 EXPANSION, #3 CR,HIGH GRADE NGO ES, CSPM.
2.TO DEVELOP HIGH GRADE STEELS:
SPECIAL STAINLESS,MOLD STEEL,TOOL STEEL,NUCLEAR STEEL,HIGH END ES,HS AUTO STEEL,ULTRA HS SHIP PLATE, Cr FREE COATING STEELS ETC GREEN PRODUCTS.
3.TO PROMOTE STRATEGIC PRODUCTS:
HIGH PERFORMANCE BRIDGE STEEL, GAS LINE PIPE STEEL, BEARING STEEL AND SUPER HS ROPE WIRE ROD ETC.
4.TO INCREASE CUSTOMER SPEC PRODUCTS.
5.TO CREATE ENVIRONMENT PROTECTION MANAGEMENT SYSTEM, AND TO STUDY INTRODUCTION OF GREEN LOW CARBON EMISSION PROCESSES.
6.TO CONTINUE STREAMLINING TOTAL PRODUCTION AND MARKETING SYSTEM.
TO CONTINUE PUSHING FORWARD R&D ALLIANCE, MOVING DOWN STREAM INDUSTRIES UP-GRADE AND INCREASING VALUE ADDED PRODUCTS AND INTERNATIONAL COMPETITIVENESS:
1.PHASE 1(Y2006~Y2008):
INVESTED 770 mil NT$ AND COMBINED 7 ACADEMIC /RESEARCH ORGANIZATIONS AND 47 CUSTOMERS TO CREATE 9 R&D ALLIANCES INCLUDING INTEGRATION KNOW-HOW OF HIGH EFFICIENCY MOTERS, CORE TECHNOLOGY OF AUTO FASTNERS, HIGH VALUE SOCKET/PLIERS, ELECTRO-GALVANIZING KNOW-HOW AND TUBE HYDRAULIC FORMING. THE ECONOMIC EFFECT WILL REACH 30 BIL NT$.
2.PHASE 2 (2009~): HAS INVESTED 593 milNT$ TO ESTABLISH 5 R&D ALLIANCES, COMBINING 3 ACADEMIC/RESEARCH ORGANIZATIONS AND 30 CUSTOMERS, IE, CORE TECHNOLOGY OF HIGH VALUED FASTNERS,MOTOR INDUSTRIES CHAINS HIGH VALUE TECHNOLOGY,ETC.
TO MOVE FROM R&D ALLIANCE TO STRATEGIC ALLIANCE CREATING MULTI-WIN PURPOSE TOGETHER.

22
Taiwan Steel Market outline
first map of Taiwan in1625
Chapter 1: Taiwan Steel Industries Briefing
Chapter 2: Taiwan Steel Trade & Consumption
Chapter 3: CSC’s Presence & Efforts
Chapter 4: Steel Trade Issues
Chapter 5: Conclusion

23
Steel Trade in 2011 (000mt)
Steel Product Net Export 7.803mmt, of which carbon steel weighs 82%.
Net export to China :0.953mmt, of which carbon steel is 1.632mmt(carbon steel net export, special steel net import).
355 1504
1349 2417
1987 6239
2302 9267
0% 20% 40% 60% 80% 100%
碳鋼進口
鋼材進口
碳鋼出口
鋼材出口
China Other
Area 20%
24%
36%
19%
Total
11569
8226
3766
1859
Total Steel Exp
Carbon Steel Exp
Total Steel Imp
Carbon Steel Imp

24
Taiwan Import of GI (000mt)
126
286
332
188
1. 13% export refund makes China import price 8% lower than import average.
2. China GI increases sharply:Y2009 0.057mmt, Y2010 0.140mmt(+146%),Y2011
0.145mmt(+3%), Y2012 8 months 0.158mmt(yoy +42%)。
3. Low price makes China imports increase market share sharply: Y2009: 30%; Y2010: 42%;
Y2011: 51%; Y2012: 58%.
0% 20% 40% 60% 80% 100%
2009
2010
2011
2012.1~8
30%
42%
51%
58%
70%
58%
49%
42%
大陸 其他
0.286
0.332
0.188
Total (mmt)
0.275

25
Taiwan Import of Alloy Steel plate (000mt)
1.Taiwan plate market suffers from imports of China alloy plate, secondary plates from Japan and India. 2.China Alloy plate enjoy 13% export refund, making price competition more fiercely. 3.In July 2010, China called off 9% export refund of carbon steel plate, but with alloy plate 13% refund unchanged. This makes the carbon steel plate export to Taiwan decrease, while the alloy plate increasing drastically: (1) Alloy Steel plate:Y2009 0.002mmt,Y2010 0.038mmt(15 times), Y2011 0.166mmt(+337%),Y2012 8 Months 0.112mmt(+7%) after good communication. (2) Carbon Steel plate:Y2009 0.033mmt,Y2010 0.090mmt, Y2011 0.023mmt,Y2012 8 months 0.0076mmt(-67%) 4.Low price makes China’s market share rise greatly.
180
375
410
238 1%
99%
9% 91%
44% 56%
46% 54%
0% 20% 40% 60% 80% 100%
2009
2010
2011
2012.1~8
大陸 其他
Total (mmt)
0.245
0.375
0.41
0.238 Taiwan Market outline

Executive Regulations
1. Industry Standards
SNI/TIS/SIRIM/BIS etc.
2. Tariff Adjustment
Brazil: HR 12% to 25%;
India: CR/Coated: 5.0% to 7.5%
3. AD accusations
Indonesia: HR/CR; Australia: HR/CG;
Canada: carbon steel pipe; Malaysia: HR/W.R.
4. AP reinforcement
Malaysia ES
26

27
Taiwan Steel Market outline
first map of Taiwan in1625
Chapter 1: Taiwan Steel Industries Briefing
Chapter 2: Taiwan Steel Trade & Consumption
Chapter 3: CSC’s Presence & Efforts
Chapter 4: Steel Trade Issues
Chapter 5: conclusion

Status Quo & Outlook of Taiwan Steel market
1. With increasing risk of Greek’s dropout from EU, US economy improving slowly, Chinese
economy soft landing, Middle East political unrest pushing up oil price, outlook of global economic
growth is not optimistic. With export and private consumption getting weaker, Taiwan
government revised economic growth rate down to 1.66% for 2012.
2. With declining export, weak domestic demand and cheap imports, steel demand
in Taiwan is slow, and its prices hard to rebound
3. EU steel mills announcing price rise: Users began re-stocking after summer vacation, and
steel mills announced 3Q price increase.
4. China Steel Production relatively low level: Due to some mills maintenance/production cut, crude steel production of August totaled only 58.7mmt, first time
breaking 60mmt line in recent half year. In September, production may decrease due to weak demand.
However, Chinese government’s 1 trillion stimulus package are expected to absorb some excessive capacity. In
addition, most steel mills is suffering losses, and the raw material has reached two year bottom, so we expect
room to further cut prices is limited.
5. Market sentiment has been encouraged by the combination of QE3 and China’s
RMB 1 trillion of infrastructure projects, so prices should not get some support/boost in near future. But for how
long and how strong, we have to see.
6. Re-construction demand of Japan North East earthquake will finally start from 2013,
after spending so much time on settling down nuclear melt down problems and clearing the quake debris.
28

Conclusions
1. Taiwan Steel market perspective: 4Q is traditional demand season. There will be re-stocking demand after European
summer vacation, automotive new model effect, Easter and Christmas special demand on
home appliances and consumer goods, so if China continues to contain production, there
will be opportunity for prices to rebound substantially. After the international prices
bottoms out and go steady, it will help domestic users to enhance their willingness to buy.
2. Trade Issues need more communications beforehand instead of suing
each other. Governments need to talk to lower the barrier to free trade, instead of lifting up tariff
or introduce national standards.
3. To develop more value added products and service is CSC’s short
and medium term object, including high tensile steel and service centers to serve automobile and
home appliance customers.
(1) High Value steels: IF steel IF steel HS/BH steels Dual Phase steels/HSLA
(2) Service center: 2012: 5 locations(China 2, Thailand 2, Indonesia 1); 2013: 5 locations(China 2;
Malaysia 1; India 2)
4. CSC CONITNUES TO ESTABLISH R&D AND STRATEGIC
ALLIANCE WITH TAIWAN STEEL USING INDUSTRIES, INCLUDING MOTORS,
FASTNERS, HAND TOOLS AND PIPE INDUSTRIES. TO INVOLVE IN EARLY STAGE TO
DEVELOP THE NEEDED PROCESSES AND PRODUCTS SO AS TO ENHANCE
CUSTOMERS’ COMPETITIVENESS AND SHARE THE GROWTH WITH THEM.
29