chapter 10 atmospheric structure and...
TRANSCRIPT

235
Abstract Titan’s atmosphere is predominantly N 2 with CH
4
the next most abundant molecule. It has a mole fraction of 0.05 just above the surface decreasing to 0.014 in the strato-sphere. Above the homopause (~800–850 km), it increases to 0.12 at the exobase. The third abundant molecule is H
2 with a tropospheric mole fraction of 0.001 increasing
to 0.004 at ~1000 km and ~0.02 at the exobase (~1500–1600 km). This chapter reviews the various measurements acquired by the Voyager flybys, Huygens Probe, orbiting Cassini spacecraft, ground-based and orbiting telescopes of the large suite of hydrocarbons, nitriles, other nitrogen and also oxygen bearing compounds. Titan possesses a mostly stable troposphere with a well defined tropopause ( T ~ 70 K at ~44 km) and a lower stratosphere with a high static stability, which is extremely cold over the winter polar region (currently northern hemisphere) and warm over the summer pole. Remarkably in the middle stratosphere, the warmest temperatures occur at the equator and the largest meridional temperature gradients are found in the winter hemisphere. The stratopause from the summer pole to about 45° N remains
at a relatively constant pressure of 0.1 mbar/300 km and then it rises rapidly upward to ~0.01 mbar/400 km at the winter north pole, where it is the warmest region in the entire atmosphere. One possible interpretation of the Huygens Atmospheric Structure Instrument (HASI) temperature pro-file is that Titan's atmosphere is essentially isothermal ~170 K from 500–1100 km, with large amplitude thermal waves (10 K) superimposed. The existence and location of a well defined mesopause is an open question.
The chemistry of Titan's atmosphere is driven by CH 4
photolysis in the thermosphere and catalytic reactions in the stratosphere, and by N
2 dissociation due to both UV photons
and energetic electrons. Ethane is the most abundant gas product and HCN is the dominant nitrile. The mixing ratios of all photochemical species, except C
2 H
4 , increase with altitude
at equatorial and southern latitudes, indicative of transport from a high-altitude source to a condensation sink in the lower stratosphere. Northward of 45º N, most product com-pounds are enriched as a consequence of subsidence in the winter polar vortex, particularly for nitriles and more complex hydrocarbons than C
2 H
6 and C
2 H
2 . North of 45º N, most prod-
ucts have lower increases with altitude than at low latitudes.
10.1 Historical Introduction
The fi rst defi nitive detection of an atmosphere on Titan was Kuiper’s (1944) discovery of near-IR CH
4 bands in absorp-
tion. But it was not until the 1970s, that Titan became an object of intense study. Lewis (1971) noted that Titan’s low density implied an interior composition rich in ices and suggested photolysis of outgassed ammonia would lead to a nitrogen atmosphere. Trafton (1972) reported the possible detection of H
2
and interpreted the 20 m m spectral region in terms of a strong greenhouse. Gillett et al. (1973) detected pronounced peaks at 12 (C
2 H
6 ) and 8 (CH
4 ) m m in narrow band spectra, which
Danielson et al. (1973) interpreted as emission from a thermal inversion layer and substantial amounts of C
2 H
6 (~3 × 10 19
cm −2 ) in the atmosphere. Two NASA Workshops and their reports (Hunten 1974 ; Hunten and Morrison 1978) enhanced
Chapter 10 Atmospheric Structure and Composition
Darrell F. Strobel , Sushil K. Atreya , Bruno Bézard , Francesca Ferri , F. Michael Flasar , Marcello Fulchignoni , Emmanuel Lellouch , and Ingo Müller-Wodarg
R.H. Brown et al. (eds.), Titan from Cassini-Huygens, © Springer Science +Business Media B.V. 2009
D.F. Strobel (�) The Johns Hopkins University , Baltimore , MD , 21218–2687 , USA e-mail: [email protected]
S.K. Atreya University of Michigan , Ann Arbor , MI , 48109–2143 , USA e-mail: [email protected]
B. Bézard, M. Fulchignoni and E. Lellouch LESIA , Observatoire de Paris-Meudon , 92195 , Meudon Cedex , France e-mail: [email protected] e-mail: [email protected] e-mail: [email protected]
F. Ferri CISAS G.Colombo , University of Padova , 35131 , Padova , Italy e-mail: [email protected]
F. Michael Flasar NASA Goddard Space Flight Center , Greenbelt , MD , 20771 , USA e-mail: f.m.fl [email protected]
I. Müller-Wodarg Space and Atmospheric Physics Group , Imperial College London , Prince Consort Road , London , SW7 2BW , UK e-mail: [email protected]
236 D.F. Strobel et al.
and focused the intense interest in Titan in anticipation of the Voyager fl ybys years later. Lewis’ (1971) ideas for a nitrogen atmosphere from ammonia photolysis were pursued by Hunten (1978) and Atreya et al. (1978) . The ambiguous (at the time) spectroscopic evidence on what are the major atmospheric species and surface pressure was interpreted by Hunten (1978) to imply a very thick background atmosphere (~20 bar of nitrogen) in addition to the observed CH
4 . Danielson et al.
(1973) , in contrast, interpreted the spectroscopic evidence in terms of a very thin few mbar atmosphere of mostly CH
4 . With
these two divergent working models, the Voyager Missions’ scientifi c objectives for Titan’s atmosphere were well focused toward a defi nitive determination of its composition and struc-ture. More pre-Voyager history and background may be found in the companion Chapter 2.
The Voyager spacecrafts yielded defi nitive measurements and answers to the outstanding questions at the time about Titan’s atmosphere. The most noteworthy results were (1) composition, 97% N
2 , except in the lowest 15 km, with 1.5–
3% CH 4 , <10% Ar, <5% CO (Broadfoot et al. 1981 ; Hanel
et al. 1981 ; Strobel and Shemansky 1982 ; Strobel et al. 1993 ; Vervack et al. 2004) , (2) the density, pressure, and tempera-ture profi les at equatorial latitudes from the surface up to 200 km from the Voyager radio (refractive) occultation experi-ment (Lindal et al. 1983 ; Lellouch et al. 1989) , (3) thermal and chemical structure from the Voyager IRIS Instrument at the surface, tropopause, and stratosphere at latitudes between 60º S to 70º N and detection of a large suite of hydrocarbons and nitriles in Titan’s stratosphere (Hanel et al. 1981) , and (4) the equatorial thermospheric structure from the Voyager Ultraviolet Spectrometer solar (absorptive) occultation experiment for N
2 and CH
4 between 900 and 1400 km
(Broadfoot et al. 1981 ; Vervack et al. 2004) . Additional Voyager background perspective can be found in Chapter 2.
The Cassini–Huygens Mission visited the Saturnian System some 20 years later with well-instrumented orbiting spacecraft and Huygens Probe, which descended to Titan’s surface, to study in-depth Titan’s atmosphere. In the following discus-sion the scientifi c discoveries and fi ndings from this Mission on the structure and composition are reviewed and integrated with scientifi c knowledge derived from ground-based and orbiting observatories and Voyager.
10.2 Vertical Structure of the Atmosphere: Mass Density, Pressure, and Temperature
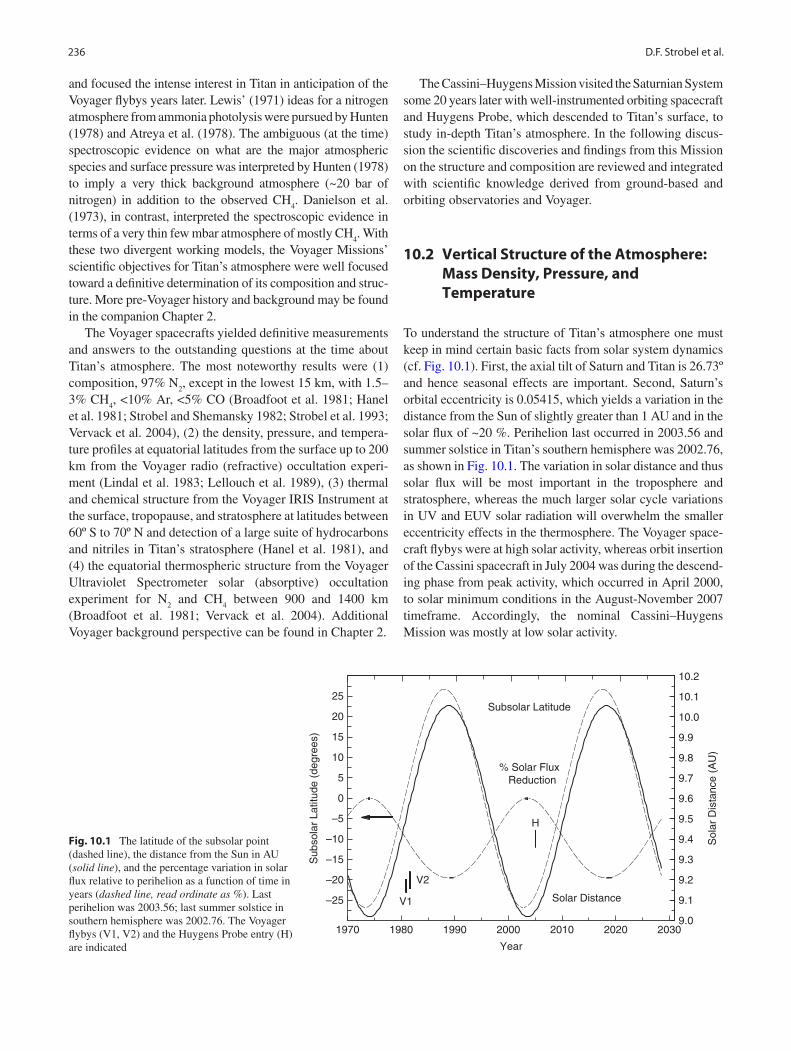
To understand the structure of Titan’s atmosphere one must keep in mind certain basic facts from solar system dynamics (cf. Fig. 10.1 ). First, the axial tilt of Saturn and Titan is 26.73º and hence seasonal effects are important. Second, Saturn’s orbital eccentricity is 0.05415, which yields a variation in the distance from the Sun of slightly greater than 1 AU and in the solar fl ux of ~20 %. Perihelion last occurred in 2003.56 and summer solstice in Titan’s southern hemisphere was 2002.76, as shown in Fig. 10.1 . The variation in solar distance and thus solar fl ux will be most important in the troposphere and stratosphere, whereas the much larger solar cycle variations in UV and EUV solar radiation will overwhelm the smaller eccentricity effects in the thermosphere. The Voyager space-craft fl ybys were at high solar activity, whereas orbit insertion of the Cassini spacecraft in July 2004 was during the descend-ing phase from peak activity, which occurred in April 2000, to solar minimum conditions in the August-November 2007 timeframe. Accordingly, the nominal Cassini–Huygens Mission was mostly at low solar activity.
Fig. 10.1 The latitude of the subsolar point (dashed line), the distance from the Sun in AU ( solid line ), and the percentage variation in solar fl ux relative to perihelion as a function of time in years ( dashed line, read ordinate as % ). Last perihelion was 2003.56; last summer solstice in southern hemisphere was 2002.76. The Voyager fl ybys (V1, V2) and the Huygens Probe entry (H) are indicated
1970 1980 1990 2000 2010 2020 2030
–25
–20
–15
–10
–5
0
5
10
15
20
25
Year
Sub
sola
r La
titud
e (d
egre
es)
9.0
9.1
9.2
9.3
9.4
9.5
9.6
9.7
9.8
9.9
10.0
10.1
10.2
Solar Distance
% Solar Flux Reduction
V1
V2
H
Sol
ar D
ista
nce
(AU
)Subsolar Latitude

23710 Atmospheric Structure and Composition
The most signifi cant spatial variation in a planetary atmosphere is the vertical stratifi cation due to gravity and characterized by an e-folding pressure scale height H, which for Titan varies from 15 to 100 km. As a consequence it is natural to take the distribution of the three thermodynamic variables that describe planetary atmospheres: mass ( r ) or number (n) density, pressure (p), and temperature (T) and write them, e. g. the latter as
+ + ′f q q f qT( , ,z,t) = T ( ) T( ,z, t) T ( , ,z,t).z
The fi rst term is the vertical temperature profi le with T aver-aged over the globe on each height or pressure surface if z = - ( ln )H d p∫ , depending on the altitude variable. The second term is temperature departure from the fi rst term averaged over longitude, f , on a latitudinal circle at latitude q and height z. The last term is the longitudinally varying departure from the fi rst two terms and characterizes waves in the atmosphere. Seasonal variations are presumed to be present in the latter two quantities and absent from the fi rst term in the troposphere and lower stratosphere, because of the long radiative time constants. Since most pronounced seasonal time variations are expected at high latitudes, 1D vertical profi les obtained at equatorial latitudes should be approximately equal to rigorously calculated T ( )z from global data.
In Fig. 10.2 , various 1D profi les obtained at equatorial latitudes are compared. For the Voyager radio occultation data acquired at 6.2ºN and 8.5ºS, the Lellouch et al. (1989) analysis is adopted. For the UVS solar occultation data taken
at 4ºN and 16ºS, the Vervack et al. (2004) profi le is shown and would imply T ~ 155 K atmosphere, if isothermal. From these data sets, the Yelle et al. (1997) engineering model was constructed for Cassini–Huygens Mission planning. Note that the agreement of this model with the Huygens Atmospheric Structure Instrument (HASI, Fulchignoni et al. 2005) density profi le was excellent below 600 km. HASI measured entry deceleration from which density was derived directly down to an altitude of ~175 km, but pressure and temperature were inferred with the assumption of hydro-static equilibrium. After ejection of the aeroshell and para-chute deployment at z ~ 150–175 km, the pressure and temperature were independently measured and density derived from the equation of state for a real gas.
The lack of any change in Titan's lower atmosphere between the Voyager fl ybys and Huygens Probe is easily understood by the very long radiative time constants (~300 year at 10–20 km, ~60 year at 50 km) in comparison to a Saturnian year (= 29.5 year). In the thermosphere, the mass density measured by HASI is higher by up to a factor of 2 than inferred by Vervack et al. (2004) from the Voyager solar occul-tation measurements. The Voyager data were taken during solar maximum activity, whereas the HASI data were obtained when solar activity was between medium and minimum solar activity. Hence one would have expected Titan’s upper atmo-sphere to have contracted relative to the Voyager epoch. Note that the Vervack et al. (2004) inferred temperature ~155 K, is about 20 K colder than HASI, so that extrapolating their den-sities to lower altitudes would merge with the HASI densities at ~1000 km. However due to Saturn's elliptical orbit around
Fig. 10.2 Comparison of Cassini–Huygens HASI density, pressure, and temperature profi les ( black lines , Fulchignoni et al. 2005) , CIRS density and temperature profi les at 15 S ( red lines , Vinatier et al. 2007a) , average INMS Northern Hemisphere density profi le ( blue line , Müller-Wodarg et al. 2008) with the Voyager Lellouch et al. (1989) and Vervack et al. (2004) results, and the Yelle et al. (1997) engineering model ( green lines ), all as functions of altitude above surface
0 25 50 75 100 125 150 175 200 225 2500
100
200
300
400
500
600
700
800
900
1000
1100
1200
1300
140010–1110–12 10–10 10–9 10–8 10–7 10–6 10–5 10–4 10–3 10–2 10–1 100 101 102 103
Hei
ght (
km)
Temperature, T (K)
Mass Density, ρ (kg m–3), Pressure, p (mbar)
HASI ρ
Yelle et al. ρ
Yelle et al. T
HASI & Lellouch et al. T
Vervacket al.
HASI p
HASI T
INMS_NH
CIRS 15S

238 D.F. Strobel et al.
the Sun, Titan was at 9.44 AU during the Voyager 1 fl yby and 9.04 AU, at the time of Huygens Probe entry. This could explain the expanded atmosphere, but not the colder tempera-tures in the thermosphere as the solar EUV and UV fl uxes at solar maximum activity for Voyager fl ybys ratioed to solar fl uxes pertinent to Probe descent would be ~2, more than enough to offset the (9.44/9.04) 2 ~1.09 factor due to Titan being closer to the Sun during the Probe descent. There is presently no explanation for the temperature difference between Vervack et al. and HASI.
Also shown in Fig. 10.2 is the Ion Neutral Mass Spectrometer (INMS) in situ data averaged for the northern hemisphere (Müller-Wodarg et al. 2008) , which is about a factor of 2.4 lower than the HASI densities at 10.3º S. As discussed in more detail below and in Chapter 11, the drag and torque on the Cassini spacecraft allow determination of densities, which are systematically higher than measured INMS densities by a factor of ~2.6 on each pass through the upper atmosphere when INMS is making measurements of the neutral atmosphere. The drag determined densities from HASI support the Cassini spacecraft derived values.
With reference to Fig. 10.2 , Titan possesses a well defi ned equatorial tropopause with T = 70.43 ± 0.25 K at 44 km. Based on the mean temperature profi le the troposphere is statically stable. The low temperatures and high densities in the troposphere require that the atmosphere be treated as a real rather than an ideal gas. Titan's lower stratosphere has a high static stability with dT/dz ~1 K km −1 , from strong solar heating by its haze absorbing visible and UV radiation and near-IR CH
4 absorption (cf. Sec. 10.4.1). The stratopause
according to HASI data is located at 260 km where T = 187 K. However, the CIRS stratospheric temperature retrievals do not agree with the HASI location and instead place it at ~312 km, where T = 183 K (Vinatier et al. 2007a) . At this altitude, the HASI temperature is 184 K, but more important the CIRS temperature is 181 K at 265 km, and computation of the IR radiance with the HASI derived atmosphere is inconsistent with the observed CIRS CH
4 7.7 µm band radi-
ance. In spite of these differences in temperature, there is remarkable agreement in mass densities up to 500 km, the upper boundary for CIRS retrievals.
Fulchignoni et al. (2005) identify the temperature mini-mum, 153 K at 494 km, as the Titan mesopause. The Yelle et al. (1997) engineering model required a well defi ned meso-pause somewhere to satisfy Voyager data obtained in the lower/middle atmosphere and the thermosphere, but its loca-tion and minimum temperature were less constrained. Just above this HASI minimum is a pronounced temperature inver-sion with peak temperature of 169 K and temperature gradient of ~3.5 K km −1 . This feature was previously detected in stellar occultation measurements, (e. g., Sicardy et al. 2006) and is the location of a detached haze layer (Porco et al. 2005) . Only a very small optical depth would suffi ce to absorb suffi cient
solar radiation to balance the implied substantial heat loss by thermal conduction (Lavvas et al. 2009) .
The HASI temperature profi le contains oscillations grow-ing in amplitude above 200 km, which is consistent with propagating waves in a gas with exponential decreasing den-sity, a possibility anticipated by Strobel and Sicardy (1997) in their engineering study. One possible interpretation of the HASI temperature profi le is that Titan's atmosphere is essen-tially isothermal ~170 K from 500–1100 km, with large amplitude thermal waves (10 K) superimposed on an iso-thermal basic state. Calculation of the wave temperature lapse rate ( dT/dz ) yields values that exceed the adiabatic lapse rate ( = g/c
p , which varies from 1.24 at the surface to
0.56 K km −1 at 1400 km) at multiple altitudes throughout the atmosphere with the conclusion that the waves attain break-ing/saturation amplitudes (cf. Fig. 3 in Fulchignoni et al. 2005) . The large vertical wavelengths associated with the largest amplitudes imply either strong horizontal winds and/or high phase speeds for propagating waves.
The mean temperature profi le above 1000 km does not have to be isothermal. Strobel (2008) has theorized that the large escape rates deduced from Cassini INMS data for CH
4
and H 2 (Yelle et al. 2008 ; Cui et al. 2008) can be explained by
slow hydrodynamic escape, with no requirement for large non-thermal escape. The bulk outfl ow produces adiabatic cooling and approximately T ∝ r −1 . Superposition of waves on this slowly decreasing mean temperature profi le could also account for the derived HASI temperature (and density) data above ~1000 km. Potential wave sources are gravitational tides, large wind shear creating Kelvin–Helmholtz instability, and gravity waves forced by topography. Further discussion on wave dynamics of the atmosphere is found in Chapter 13.
10.3 The Height and Latitude Structure of the Atmosphere
Below the relevant Cassini observations performed during the nominal mission (RSS radio occultations, CIRS remote sensing, UVIS solar and stellar occultations, and INMS in situ measurements) are discussed with an emphasis on the height and latitude variations of density, pressure, and temperature.
10.3.1 Radio Occultations
There was only one Titan earth occultation of the Voyager spacecraft (Vgr 1), with ingress at 6°N and egress at 9°S. The retrieved temperatures were nearly identical in the tro-posphere, with a lapse rate close to the dry adiabat in the

23910 Atmospheric Structure and Composition
lowest 3–4 km. Cassini had four occultations by Titan, with ingress and egress soundings at 74°S, 69°S, 53°S, 34°S, 33°S, 32°S, 53°N, 74°N. Although the data have not been fully analyzed, the occultations agree with the Voyager IRIS observations in indicating a small meridional variation of temperature in the troposphere. At the tropopause, tempera-tures retrieved from the occultations vary by 4–5 K. Near the surface they differ by ~3 K or less. The coldest temperatures are at higher northern latitudes. Temperature profi les near 30°S are nearly adiabatic above the surface. At higher lati-tudes they become more stably stratifi ed above the surface and in the winter, northern latitudes, temperatures are iso-thermal or have an inversion above the surface. Data for the lower northern polar stratosphere is of particular interest, because accurate retrievals from CIRS far-IR limb sound-ings are exceedingly diffi cult and there is no information from CIRS mid-IR soundings of the polar lower stratosphere as it is too cold.
10.3.2 Remote Sensing
In Fig. 10.3 , the temperature of Titan’s stratosphere and mesosphere is displayed as a function of latitude (75º S to 75º N) and pressure (0.001 to 10 mbar) and based on CIRS data acquired over the period from July 2004 to September 2006 (Achterberg et al. 2008) . Referring to Fig. 10.1 , this period is mostly solstitial. While no altitude scale is shown, one can
refer to Fig. 10.2 and use the altitude scale for the CIRS 15S profi le, which should be reasonable for latitudes spanning 65º S to 30º N. Remarkably in the stratosphere, the warmest tem-peratures occur at the equator and the largest meridional tem-perature gradients are found in the winter (currently, northern) hemisphere rather than in the summer (southern) hemisphere. The other noteworthy feature is the extremely cold lower polar stratosphere in the northern winter hemisphere, where the temperatures decrease by ~25–30 K from 30º N to 75º N on constant pressure surfaces between 1 and 10 mbar. The stratopause remains at a relatively constant altitude and pres-sure of 300 km and 0.1 mbar, respectively from the summer pole to about 45º N, and then it rises rapidly upward to ~400 km at the winter north pole. In fact, the warmest region in the entire atmosphere is the winter, northern polar “stratopause” at ~0.01 mbar/400 km and about 20 K warmer than the equa-torial and summer, southern regions. The polar night only extends to 315 km, so it’s possible that this warm region may have a diabatic origin. However, the enhanced mixing ratios of nitriles and hydrocarbons at winter, northern polar lati-tudes (cf. Fig. 10.10 ) suggests that subsidence and adiabatic heating is certainly occurring.
At 19 m m, CIRS detects thermal radiation from the sur-face because the atmospheric opacity is small and the latitu-dinal variation of surface temperature can be inferred from brightness temperatures. Jennings et al. (2009) fi nd that the north pole surface is 3 K lower and the south pole surface 2 K lower than the equatorial surface temperature of 93.7 ± 0.6 K, equal to the HASI value at 10º S.
Fig. 10.3 CIRS zonal mean temperatures (K) from limb and nadir spectra recorded between July 2004 and September 2006. Retrieved temperatures were averaged over 5° latitudinal intervals and smoothed three times with 10° boxcar function (after Achterberg et al. (2008) ) Latitude
30 –30 –6060
10
1
140
150
130 160
170
180
180
190200
170
160
0.1
Pre
ssur
e (m
bar)
0.01
Titan Composite Nadir + Limb Temperatures
10–3
0

240 D.F. Strobel et al.
While HASI and refractive stellar occultations (discussed below) have detected wave structure in the atmosphere, CIRS has not to date and can only place an upper limit on wave temperature amplitudes of ~1 K. But it must be kept in mind that CIRS can only probe the atmosphere up to ~500 km, and then in the limb mode. The total data coverage of the atmosphere to date is limited in extent and it is possible that waves may be detectable by CIRS eventually. However, it is necessary to average CIRS spectra with a consequent loss of spatial resolution.
10.3.3 Solar and Stellar Occultations
The Voyager UVS solar occultations were equatorial and provided the extraordinary measurement that CH
4 was well
mixed up to at least 1000 km (Vervack et al. 2004) , since confi rmed by the INMS (Waite et al. 2005 ; Yelle et al. 2008) . The Cassini Ultraviolet Imaging Spectrometer (UVIS) has performed two solar occultations during the nominal mission, but no published reports are available on the results. Shemansky et al. (2005) have reported on the fi rst UVIS stellar occultations. Their inferred temperature profi le above 400 km contains (1) a convective region around 450 km where the temperature gradient is adiabatic and (2) a mesopause at 615 km with T = 114 K. By com-parison, the HASI temperature was ~175 K there. When the UVIS retrieved temperature profi le is used with the hydro-static equation and lower boundary condition at 400 km from CIRS and HASI data to calculate the N
2 density pro-
fi le, one obtains at 1200 km an N 2 density that is a factor of
~8 and ~20 times lower than measured by INMS and HASI, respectively. Also the UVIS inferred CH
4 densities at 1200
km when coupled with this calculated N 2 density implies
that CH 4 /N
2 ratio is ~0.5, also at variance with INMS values
of ~0.035 at 1200 km. The INMS mixing ratios for major species should be far more accurate than absolute values of individual densities. Note that interstellar hydrogen ionizes and cuts off the stellar UV fl ux below 91.1 nm. Above this wavelength N
2 UV absorption occurs only in predissociated
electronic bands that are very diffi cult to interpret at UVIS spectral resolution.
Beside absorptive occultations, there have been a few refractive stellar occultations (July 1989; 21 August 1995; 20 December 2001; two on 14 November 2003) mostly at visible wavelengths. These occultations were measured with ground-based telescopes, while the previously discussed ones were measured by onboard Cassini instruments. For the November 2003 events as representative, Sicardy et al. (2006) probed the 0.1–250 m bar region of Titan’s atmo-sphere. However, the 0.1–1 m bar region is subject to initial conditions in their onion peeling analysis procedure and for
pressures greater than 12 m bar (400 km), the stellar fl uxes are attenuated by haze absorption in addition to the usual refraction effects. The retrieved temperature profi le is in essential agreement with the HASI temperature profi le and, in particular, the presence of abundant wave signatures and temperature gradients that exceed the adiabatic lapse rate. As noted above, there is a pronounced thermal inversion layer at 1.5 m bar (~507–515 km). From the central fl ash analysis which extracts latitudinal information, Sicardy et al. (2006) found an isopycnic surface equal to approximately the 250 m bar surface which rises about 50 km in altitude above an arbitrary north pole reference height when 45º N is reached and remains relatively constant all the way to the south pole. This is consistent with very strong stratospheric zonal winds in the winter northern hemisphere and much weaker zonal winds in the summer hemisphere, as found by CIRS (Achterberg et al. 2008)
10.3.4 In Situ Measurements
The fi rst in-situ measurements of Titan’s upper atmosphere were carried out by the Cassini INMS during the first targeted Titan fl yby (TA) on 26 October 2004. This initial dataset has been considerably expanded with subsequent targeted fl ybys, of which a total of 19 offered the INMS adequate observing conditions and produced data of suffi -cient quality. The INMS measured gas densities during 13 fl ybys primarily in the northern hemisphere and during the remaining 6 fl ybys in the southern hemisphere. Altitudes of closest approach ranged from 950 km (T16) to 1175 km (TA). The INMS can measure either in the Closed Source Neutral (CSN) or Open Source Ion (OSI) mode to retrieve neutral or ion densities, respectively. Ion composition was measured only during 9 of the 19 fl ybys and neutral densities during all, though not always on both inbound and outbound parts of the fl ybys.
Using the neutral gas density measurements of N 2 and
CH 4 in the northern hemisphere, Müller-Wodarg et al. (2008)
constructed a simple empirical model of gas densities and temperatures in the northern hemisphere based on fl ybys TA-T32. During these fl ybys the solar declination angle on Titan changed from -23˚ to -11˚, so the season was in transi-tion between southern hemisphere summer conditions and equinox. The model by Müller-Wodarg et al. (2008) can hence be regarded as an average representation of Titan’s winter hemisphere. The vertical range is from 1000 to 1600 km, covering altitudes that were suffi ciently sampled by the INMS. In their statistical analysis of the INMS N
2 and CH
4
densities, Müller-Wodarg et al. (2008) found no consistent trends with longitude or local time, which however may partly be due to uneven sampling which favored polar nightside or

24110 Atmospheric Structure and Composition
low latitude dayside measurements, primarily in Titan’s Saturn-facing longitude sector (Cui et al., 2008) . A clear lati-tudinal trend was detected in the INMS densities at fi xed height levels above around 1100 km (Fig. 10.4 ), with densi-ties increasing towards the equator by around 70%. The den-sity model was used to infer thermospheric temperatures in Fig. 10.4 which decrease with height from 149 ± 10 K at 1000 km to 140 ± 13 K near 1600 km, and with latitude below 1200 km with values near 1000 km from 164 ± 6 K at 20˚N to 131 ± 6 K near 80˚N.
While in-situ observations by the INMS have been made in the southern hemisphere during 9 passes, the statistical variation between these has been too large to derive a consis-tent latitudinal trend. Preliminary analysis of the structure of the southern hemisphere suggests temperatures to be warmer by ~10–15 K there than average values in the northern hemi-sphere, as expected from solar heating.
While the INMS has provided the most comprehensive set of observations yet in Titan’s thermosphere, one uncer-tainty remains in the absolute calibration of densities. Comparison of INMS densities with those by the HASI observations at equatorial latitudes near 1000 km latitude shows INMS values to be 2.4 times smaller than the HASI values. The Cassini Attitude and Atriculation Control Subsystem (AACS) detects torques on the spacecraft as it enters Titan’s upper atmosphere on each fl yby, providing an additional independent measurement of total density. Comparison of AACS-derived densities at 1000 km and those from the INMS show INMS densities to again be smaller by an average factor of 2.6 than those from the AACS, very similar to the discrepancy factor between HASI and INMS at that altitude. This unresolved discrepancy how-ever does not affect the inferred temperatures.
10.4 Interpretation of Atmospheric Temperature Structure
10.4.1 Radiative Budget of Troposphere and Stratosphere
Solar energy is absorbed in Titan’s atmosphere through methane and haze absorption and at the surface. The Descent Imager/Spectral Radiometer (DISR) aboard the Huygens probe measured the downward and upward fl uxes of sunlight at wavelengths from 350 to 1600 nm and altitudes from 150 to 0 km. These measurements have been analyzed to derive the vertical distribution and optical properties of haze aero-sols (see Chapter 12), the absorption coeffi cients of methane in Titan’s conditions, and the solar energy deposition profi le at the latitude of the Huygens landing (10°S) (Tomasko et al. 2008) . Averaged over a Titan day at the location and season of the Huygens landing, about 78% of the incoming sunlight is overall absorbed: ~11% at the surface, ~48% in the atmo-sphere below 150 km and ~19% above. The disk-averaged solar fl ux profi le, calculated with the Huygens haze model, is shown in Fig. 10.5 . It is in remarkable agreement with the earlier estimate of McKay et al. (1989) based on ground-based albedo and Voyager data.
Radiative cooling of the atmosphere occurs through thermal emission by haze particles and gases beyond ~7 m m (molecular bands and collision-induced opacity). Tomasko et al. (2008) calculated the radiative cooling rate profi le at latitudes and time close to the Huygens landing using Cassini/CIRS nadir and limb measurements. As shown in Fig. 10.5 , collision-induced opacity is the main source of atmospheric cooling below 80 km while, above, molecular
Fig. 10.4 ( a ) Temperatures in Titan’s thermosphere inferred from an empirical model of atmosphere densities measured by INMS in the Northern Hemisphere. While the atmosphere is nearly isothermal above around 1200 km altitude, temperatures below
1100 km increase towards the equator. ( b ) Normalized Mass Densities at each height to the value at 50N from the empirical model. Note the bulge at the equator (after Müller-Wodarg et al. (2008) )
a b

242 D.F. Strobel et al.
band and haze opacities dominate and are of comparable importance. The cooling rate reaches 10–20 K per Titan day at altitudes 250–400 km and decreases rapidly at lower lev-els. Dividing the temperature by the cooling rate provides a radiative time constant, also displayed in Fig. 10.5 . It is short in the upper stratosphere and mesosphere (~0.5 Earth year, i.e. 0.015 Titan year, in the range 300–400 km), reaches a Titan year (29.5 Earth years) around 80 km, and is about 10 Titan years at 20 km. The cooling rate profi le is close to that determined by Bézard et al. (1995) at 53°S from Voyager data at northern spring equinox. In the region best con-strained by the Voyager/IRIS measurements (140–250 km), the two profi les agree within 20%.
The CIRS-derived cooling rate profi le around 10°S is very close to the disk-averaged heating rate profi le based on the Huygens haze model. Both decrease by three orders of magnitude from 350 to 10 km and agree at all levels within 50%. On the other hand, the solar heating rate at 10°S exceeds the cooling rate at all altitudes below 160 km, with a maximum net heating of about 0.5 K per Titan day located around 120 km. The general circulation likely redistributes this excess heat to higher latitudes.
Bézard et al. (1995) have shown that the latitudinal varia-tions of composition strongly affect the radiative forcing in the stratosphere. At 50°N, the cooling rates derived from Voyager in the range 120–270 km (5–0.15 mbar) were some 20–40% larger than at 53°S despite the colder temperatures (7 to 15 K), a consequence of larger concentrations of infra-red emitters (gas and particles). But, as the heating rate was also larger, radiative balance was still approximately achieved at this location within error bars. Using a general circulation model, Lebonnois et al. (2003b) also pointed out the strong
enhancement of radiative cooling at high winter latitudes induced by the larger concentrations of some gases (C
2 H
6 ,
C 2 H
2 and HCN). This thermal effect was found similar to
that due to the coupling between aerosols and the general circulation (Rannou et al. 2002) in the mesosphere but smaller in the stratosphere around 1 mbar (190 km).
10.4.2 Radiative Processes in the Upper Atmosphere
Above 400 km (~0.03 mbar) non-LTE effects become impor-tant for hydrocarbon cooling rates as shown by Yelle (1991) . Above 700 km (~0.1 m bar) he showed that HCN LTE rota-tional line cooling dominates radiative cooling to the exobase. The dominant heating processes above 400 km are near-IR CH
4 heating by absorption of solar radiation in the
1.7, 2.3, and 3.3 m m bands. Above ~650 km solar UV CH 4
heating emerges as the principal heat source and above 900 km, the thermosphere is, to zeroth order, in radiative equilib-rium where solar EUV/UV heating is balanced by HCN rota-tional line cooling (Yelle 1991) . Without HCN cooling calculated thermospheric temperatures would far exceed the observed values.
Yelle’s models consistently predicted a pronounced meso-pause at 600 km (~0.5 m bar) with ~25 K temperature drop from the 300 km temperature, whereas HASI data suggested the mesopause is at 494 km (Fulchignoni et al. 2005) with a temperature minimum of 153 K to be compared with ~185 K at 300 km. In Fig. 10.2 the Yelle et al. engineering model is representative of Yelle (1991) models and can be compared
Fig. 10.5 Cooling rate profi les calculated around 10°S from Cassini/CIRS and Huygens data are compared with the solar heating rate profi le, averaged over the planet, calculated from Huygens/DISR measurements (Tomasko et al. 2008) . Cooling rates are best constrained in the ranges 10–65 km and 90–400 km and heating rates below 200 km. The radiative time constant (defi ned here as the temperature divided by the cooling rate) is also shown ( right y-scale )

24310 Atmospheric Structure and Composition
with the HASI profi les. As noted above the steep temperature gradient in the HASI temperature profi le above 494 km and inferred by Sicardy et al. (2006) from stellar occultations requires solar heating of the detached haze layer detected by Porco et al. (2005) . Above this haze layer, Liang et al. (2007b) present evidence that the aerosols extend up to 1000 km. Heating associated with discreet haze layers and the broad distribution of aerosols above the visible disk of Titan were not included in the Yelle (1991) model, but were included in Lavvas et al. (2009) , who used the Yelle computer code and found that the net effect was to raise the mesopause by ~50 km without changing its temperature, in farther disagreement with the HASI inferred mesopause at 494 km.
10.5 Composition
This section emphasizes the observational facts and divides the composition into four major categories. The major con-stituents, N
2 , CH
4 , H
2 , and the inert, noble gases all have
long chemical time constants and hence are expected to be well mixed throughout the homosphere, which extends from the surface to about 800–850 km (Yelle et al. 2008) . The one exception to being well-mixed is CH
4 , which is condensable
in the troposphere. Minor constituents are subdivided into three main classes: pure hydrocarbons, nitriles, and mole-cules containing oxygen.
10.5.1 Major Constituents and Inert, Noble Gases
From the Voyager Mission, the major constituents of the atmosphere were known. But there was considerably uncer-tainty in the CH
4 mixing ratio: its variation in the troposphere,
its magnitude in the stratosphere, and whether the tropopause region was an effective cold trap. The Huygens Gas Chromatograph Mass Spectrometer (GCMS) provided defi -nite answers to these questions (Niemann et al. 2005) . The tropospheric CH
4 mixing ratio (mole fraction) is variable
with a maximum value just above the surface of 0.0492 and decreases gradually to initially an asymptotic value of 0.0162 at 32 km, and then more slowly to its measured stratospheric value of 0.0141 as shown in Fig. 10.6 . In addition to GCMS, the Huygens Descent Imager/Spectral Radiometer (DISR) measured the surface CH
4 mixing ratio by near-IR spectros-
copy to be 0.051 ± 0.008, in agreement with GCMS (Jacquemart et al. 2008) . The CIRS inferred stratospheric value of 0.016 ± 0.005 (Flasar et al. 2005) is consistent with the in situ measurement.
The third most abundant species is H 2 , for which GCMS
has not reported a value. From the Voyager IRIS measure-ments the H
2 inferred mixing ratio was 0.00112 ± 0.00016 by
Samuelson et al. (1997) and 0.001 ± 0.0004 by Courtin et al. (1995) . CIRS measurements yield the same mixing ratio: 0.00096 ± 0.00024 southward of 40º N (Courtin et al. 2008) . These values are appropriate for the troposphere/tropopause region. At very high altitudes INMS fi nds the H
2 mixing ratio
to be 0.00405 ± 0.00003 (Waite et al. 2005) . Given the large separation distance (~1000 km) between these two indepen-dent measurements, the factor of 4 difference would not seem signifi cant except that H
2 tends to be essentially uniformly
mixed throughout the atmosphere due to its long chemical lifetime and its enormous escape rate out of the atmosphere (1.1 × 10 28 s −1 , Cui et al.; 2008) which is essentially equal to the maximum possible rate. This small positive gradient in the H
2 mixing ratio is not produced in photochemical models
to date and remains a challenge to modelers. The 40 Ar isotope is an important tracer used to determine
vertical mixing in the atmosphere and the location of the homopause (cf. Yelle et al. 2008) . The measured tropospheric mixing ratio by Huygens GCMS is (4.32 ± 0.1) × 10 –5
Fig. 10.6 The mole fraction of CH 4 to N
2 versus altitude. The CH4 mole
fraction is 0.0141 in the stratosphere., at ~8 km, it reached a plateau of about 0.049. The inset shows an increase of CH
4 at 16 m/z, when compared to N
2
(in this case 14 N + ) at m/z = 14, near 16 km. This is probably due to conden-sates evaporating in the inlet system of the mass spectrometer as the Huygens probe passed through the methane haze (after Niemann et al. (2005) )
100
30 20
CH4
16 km
14N+
15 10 5 025350
Sig
nal (
coun
tspe
r se
cond
)
80
Altitude (km)
Altitude (km)
60 40 20 0120
1.41?10–2
4?105
2?105
1.62?10–21.69?10–2
3.80?10–2
4.92?10–2
2.20?10–2
1400.00
Mol
e fr
actio
n
0.02
0.04
0.06

244 D.F. Strobel et al.
(Niemann et al. 2005) , whereas in the thermosphere INMS measured (7.1 ± 0.1) × 10 –6 (Waite et al. 2005) . Primordial 36 Ar is much less abundant, only (2.8 ± 0.3) × 10 –7 (Niemann et al. 2005) . Other noble gases, Ne, Kr, and Xe, were not detected by the Huygens GCMS. The Huygens GCMS placed an upper limit of 10 –8 on Kr and Xe, well below their cosmogonic abundance, as was also the very low, constrain-ing value for 36 Ar. The 14 N/ 15 N isotope ratio measured in situ in N
2 by the GCMS (183; Niemann et al. 2005) is a factor
three larger than that inferred from HCN (Vinatier et al. 2007b) . The implications of these isotopes for the evolution of Titan's nitrogen atmosphere are discussed in detail in Chapter 7.
10.5.2 Minor Constituents – Hydrocarbons Other than Methane
Voyager/IRIS observed a suite of hydrocarbons produced from methane photochemistry and mapped their abundances in the lower stratosphere between 50°S and 70°N (Coustenis and Bézard 1995) . Cassini/CIRS improved over the IRIS observations thanks to a higher spectral resolution (up to 0.5 cm −1 ), a broader spectral range (10–1500 cm −1 ), the use of limb-viewing geometry, and a much more extended spatial and temporal coverage (Fig. 10.7 ). Nadir measurements pro-vide information on the mean gas abundances in a broad region usually centered around 120 km while limb-viewing measurements probe the atmosphere up to ~500 km.
The hydrocarbon mixing ratios in the lower stratosphere have been derived by Coustenis and Bézard (1995) , Flasar et al. (2005) , and Coustenis et al. (2007) from IRIS and CIRS nadir spectra respectively (Fig. 10.8 ). Ethane (C
2 H
6 ) is the
most abundant photochemical product (~10 ppm at 120 km), followed by acetylene (C
2 H
2 ), propane (C
3 H
8 ), ethylene
(C 2 H
4 ), methyl acetylene (CH
3 C
2 H), diacetylene (C
4 H
2 ) and
benzene (C 6 H
6 , which was not detected in IRIS spectra). The
mixing ratio decreases with the complexity of the molecule as would be expected and, for a given number of C-atoms, saturated species are more abundant that unsaturated ones. All hydrocarbons are more abundant northward of 45°N. This enrichment is larger for C
4 H
2 and CH
3 C
2 H than for the
more stable species C 2 H
6 and C
2 H
2 . It is more pronounced in
the Voyager data recorded in 1980, a season close to north-ern spring equinox, than observed by Cassini in 2005 shortly after winter solstice (Figs. 10.1 and 10.8 ). In contrast, images taken in the period 1999–2002 with the Keck telescope at 8–13 m m suggest an accumulation of C
2 H
4 in the polar strato-
sphere south of 60°S (Roe et al. 2004) . If real, this polar enhancement, persisting through late southern Spring, has rapidly disappeared as it was not seen by Cassini three years later, i.e. one tenth of a Titan year later.
Vertical profi les have been inferred from two CIRS sequences combining nadir and limb spectra at 15°S and 80°N (Vinatier et al. 2007a) and subsequently at other lati-tudes (Vinatier 2007 ; Teanby et al. 2008b) . Information is available from about 500 km down to 100–150 km. At south-ern and mid northern latitudes, all mixing ratio profi les, except ethylene, increase with height (Fig. 10.9 ). This results
Fig. 10.7 An average of Cassini/CIRS limb spectra recorded at 100–200 km altitude and high northern latitudes, showing emission features from various hydrocarbons and nitriles. To analyze the observations, the temperature profi le is fi rst retrieved from the 1305 cm −1 (7.7 m m) methane band and the gas mixing ratio profi les are derived from the corresponding emission bands (from Bézard 2009))
0
1
2
3
4
5
6
7
600 650 700 750 800 850 900 950 1000
FP3C4H2
C3H4
HC3N
CO2
C6H6
HCN
C2H2
C3H8
C2H6
C2H4
0
0.2
0.4
0.6
0.8
1
1050 1100 1150 1200 1250 1300 1350 1400 1450 1500
Rad
ianc
e (m
W m
–2 s
r–1
/ cm
–1)
Wavenumber (cm–1)
FP4CH4
CH3DC2H6

24510 Atmospheric Structure and Composition
from photochemical production in the upper atmosphere (>500 km) and loss by condensation in the lower stratosphere (60 to 100 km depending on the species), which together maintain a positive concentration gradient. This gradient is moderate for C
2 H
6 and C
2 H
2 and steepest for C
4 H
2 which
undergoes chemical losses in the stratosphere (see Fig. 10.9 ). Ethylene is the only species whose mixing ratio decreases with height between 120 and 250 km, a behavior that may result from the fact that it does not condense and can be enriched in the lower atmosphere by equatorward transport of polar air (Crespin et al. 2008) . At high northern latitudes, beyond 45°N, the vertical profi les change drastically and exhibit larger concentrations in the lower stratosphere at least below 250–300 km (Figs. 10.9 and 10.10 ). At 50–60°N, con-centration minima are seen at 350–400 km for C
4 H
2 and C
2 H
2 .
These minima also exist at ~80°N but seem to occur at some-what lower altitudes (~300 km) and be less pronounced. At this latitude (80°N), minima are also observed for CH
3 C
2 H,
C 2 H
4 and C
2 H
6 as shown in Fig. 10.9 . A similar pattern exists
for nitriles and likely results from dynamical processes asso-ciated with the polar vortex as discussed in Sec. 10.5.3. Little is known on the vertical profi le of benzene, the least abundant hydrocarbon detected: at 79°N, its mixing ratio is constant within error bars (3–4 ppb) between 180 and 320 km (Vinatier 2007) , i.e. about 10 times larger than at mid-latitudes and ~120 km (Coustenis et al. 2007) .
Above 500 km, the atmospheric composition can be probed by stellar or solar occultations observed from space-craft. A reanalysis of the Voyager 1 UVS solar occultations at latitudes of 4°N (ingress) and 16°S (egress) provided den-sity profi les of two hydrocarbons besides methane: C
2 H
2 and
C 2 H
4 (Vervack et al. 2004) . The C
2 H
2 mixing ratio agrees
very well with that derived from Cassini/CIRS at 15°S (Fig. 10.9 ) while the C
2 H
4 value is about 2 orders of magni-
tude larger than the CIRS value at 240 km, suggesting that a
minimum exists in its mixing ratio profi le somewhere between 250 and ~450 km. Above 500 km, the mixing ratios of C
2 H
2 and C
2 H
4 increase with height to reach respectively
(0.6–2) × 10 –3 and (0.3–2) × 10 –3 at 950 km, pointing to a source at higher altitudes. A stellar occultation observed by Cassini/UVIS at 36°S provided density profi les of several hydrocarbons between ~1000 km and a lower limit ranging from 615 to 845 km (Shemansky et al. 2005) . The C
2 H
4
number densities inferred between 845 and 1000 km agree within error bars with those from Voyager 1 UVS. On the other hand, the C
2 H
2 number density at 615 km is about 20
times larger than the UVS value at the same altitude and the corresponding mixing ratio (assuming a CH
4 mole fraction
of 0.014) is about 50 times larger than the CIRS value at 500 km, which casts doubts on the reported UVIS results.
At higher altitudes, the composition of the thermosphere and ionosphere has been probed in situ by the INMS aboard Cassini. During the fi rst low-altitude pass through Titan’s atmosphere at ~39°N latitude (Ta), INMS detected the neu-trals C
2 H
2 , C
2 H
4 , C
2 H
6 , C
3 H
4 , C
4 H
2 and C
6 H
6 around 1200
km. Benzene has been detected by INMS in many passes through Titan’s atmosphere. An analysis of the signals recorded during T16 indicates a mole fraction of 1.3 × 10 –6 at 950 km near the North Pole (Vuitton et al. 2008) . This implies an ionospheric source of about 10 7 molecules cm −2 s −1 , of the same magnitude as the neutral production rate in the stratosphere needed to explain the CIRS abundance. Measurements of ion densities coupled with simple chemi-cal models provide an additional probe of the composition of the neutral atmosphere. This allowed the detection of C
2 H
4 ,
polyynes (C 4 H
2 , C
6 H
2 , C
8 H
2 ) and possibly methylpolyynes
(CH 3 C
4 H, CH
3 C
6 H) and a determination of their mole frac-
tions around 1100 km at 74°N during the T5 fl yby (Vuitton et al. 2006, 2007) . A review of the composition of Titan’s thermosphere and ionosphere can be found in Chapter 11.
Fig. 10.8 Meridional variation of composition in the lower stratosphere around 120 km. Filled symbols and solid lines represent data from Cassini/
CIRS spectra in 2005. Empty symbols and dashed lines correspond to mix-ing ratios derived by Voyager 1 in November 1980 (from Bézard 2009)
1e-08
1e-07
1e-06
1e-05
–90 –60 –30 0 30 60 90
Vol
ume
mix
ing
ratio
Latitude
–90 –60 –30 0 30 60 90
Latitude–90 –60 –30 0 30 60 90
Latitude
CO2
C2H2
C3H8
C2H4
C2H4
C2H6
1e-09
1e-08
1e-07
1e-06
CH3C2H
C6H6 x 100
1e-10
1e-09
1e-08
1e-07
1e-06
HC3N
HCN
C2N2

246 D.F. Strobel et al.
Fig. 10.9 Vertical profi les of hydrocarbons and nitriles obtained from inversion of Cassini/CIRS nadir and limb spectra recorded at four latitudes (54°S, 15°S, 54°N, and 79°N). The error bars are indicated at the maxima of the inversion kernels, which is the level of maximum information in the spectral sequences analyzed. The thick grey segment represents the Voyager 1 UVS measurement at 4°N (adapted from Vinatier 2007)

24710 Atmospheric Structure and Composition
10.5.3 Minor Constituents – N-Bearing Species and Nitriles
Voyager/IRIS and Cassini/CIRS detected three nitriles in Titan’s stratosphere: hydrogen cyanide (HCN), cyanoacety-lene (HC
3 N) and cyanogen (C
2 N
2 ) (Coustenis and Bézard
1995 ; Teanby et al. 2006) . Mixing ratios derived from nadir spectra are shown in Fig. 10.8 as a function of latitude, assuming uniform profi les above the condensation levels. HCN, the simplest and most abundant nitrile, is detected at all latitudes. Its mixing ratio is fairly constant southward of 20°S (~1 × 10 –7 around 150 km) and gradually increases towards the north. The north-to-south asymmetry is more dramatic for the two other species. In particular, the C
2 N
2
signature is extremely weak in CIRS spectra of the southern hemisphere and equatorial region and indicates a mixing ratio as low as 6 × 10 –11 ( Teanby et al. 2009). On the other hand, it is clearly detected at high northern latitudes with a mixing ratio of 9 × 10 –10 at 50°N and around 3 × 10– 9 beyond
70°N. As for hydrocarbons, the enhancement of nitriles north of ~45°N was more pronounced at the Voyager encoun-ter time than at the beginning of the Cassini mission.
Vertical profi les of HCN and HC 3 N have been derived
using CIRS limb observational sequences in the range 100–500 km at a variety of latitudes (Teanby et al. 2007 ; Vinatier 2007 ) . From southern to mid-northern latitudes (<40°N), the HCN mole fraction increases regularly with height (by a fac-tor of ~30 from 100 to 400 km) while HC
3 N exhibits a much
steeper gradient, increasing by at least 3 orders of magnitude between 200 and 500 km. The HC
3 N profi le is consistent
with those derived from ground-based millimeter and sub-millimeter heterodyne observations (Marten et al. 2002 ; Gurwell 2004) that do not resolve Titan’s disk and are thus more heavily weighted towards mid-latitudes (30°S–30°N). At latitudes northward of 45°N, the profi les are more uniform below 250–300 km while concentration minima are observed around 350–400 km for HCN and 320 km for HC
3 N. The
HCN minimum is more pronounced (and slightly higher)
200
300
400
Tan
gent
Alti
tude
(km
)
–60 –30 0 30 60
Latitude (°)
–60 –30 0 30 60
Latitude (°)
–60 –30 0 30 60
Latitude (°)
140
160
180
200
Temp (K)
–30 0 60–60 30
Latitude (°)
–30 0 60–60 30
Latitude (°)
–30 0 60–60 30
Latitude (°)
–6
–5
log10(C2H2)
200
300
400
Tan
gent
Alti
tude
(km
)
–7
–6
–5
log10(HCN)
–10
–9
–8
–7
–6
log10(HC3N)
200
300
400
Tan
gent
Alti
tude
(km
)
–9
–8
–7
log10(C3H4) log10(C4H2)
–9
–8
–7
Fig. 10.10 Cross sections of temperature and composition through Titan’s atmosphere constructed from Cassini/CIRS observations in 2006–2007. Composition is given as a volume mixing ratio and the position of the observed profi les are denoted by dotted lines. Contours indicate the vortex zonal wind speeds (in m s −1 ) and blue dashed lines show the region with the steepest horizontal potential vorticity gradient, which indicates a dynamical mixing barrier (from Teanby et al. 2008)

248 D.F. Strobel et al.
at 50–60°N than at 80°N, leading to an HCN-depleted zone limited in latitude and altitude, as shown in Fig. 10.10 (Teanby et al. 2008b) . A CIRS limb sequence at 82°N with high vertical resolution (10 km) has revealed a layered struc-ture in the profi les of HCN and HC
3 N, with variations of
about an order of magnitude over a few tens of km (Teanby et al. 2007) . This structure is reminiscent of the discrete haze layers seen in Cassini images (Porco et al. 2005) and might imply a close connection between hazes and nitriles.
Acetonitrile (CH 3 CN) has only been observed from the
ground (Marten et al. 2002) . Its disk-averaged mole fraction is about 20–50 times lower than that of HCN in the 200–500 km range, slightly increasing with height from (0.8 to 4) × 10 –8 in this interval. Below 150 km, it decreases sharply down to the condensation level around 80 km with a vertical gradient even steeper than for HC
3 N.
The enrichment of hydrocarbons and nitriles in the strato-sphere at winter latitudes seems to be roughly correlated with their vertical concentration gradient at low latitudes and anti-correlated with their lifetime in the stratosphere (e.g. Teanby et al. 2009 ; Bézard 2009). This is consistent with subsidence in the winter polar vortex, bringing air rich in photochemical compounds from their formation region in the upper atmosphere down to the stratosphere (see Sections 10.6 and 10.7 and Chapter 13). The polar vortex acts to isolate high winter latitudes but details of the hydro-carbon and nitrile distributions, such as the concentration minima observed at 350–400 km, provide evidence for dynamics more complex than predicted by general circula-tion models (Teanby et al. 2008b) .
Above the region probed by thermal emission measure-ments, information is scarce. The Voyager UVS occultation data saw evidence for absorption by HCN and/or HC
3 N but
could not disentangle the two. The Cassini UVIS occultation at 36°S indicates a HCN mole fraction around 3 × 10– 5 at 615 km increasing to 1 × 10– 3 at ~1000 km (assuming a CH
4 mole
fraction of 0.014) but these data may need to be reanalyzed (see Section 10.3.3). Cassini INMS detected in situ HCN, HC
3 N and C
2 N
2 around 1200 km at ~39°N with a mole frac-
tion less than 5 ppm (Waite et al. 2005) . Ion measurements conducted during a low-altitude pass at 1027 km near 74°N latitude were analyzed to determine indirectly the abundances of several N-bearing molecules (Vuitton et al. 2006, 2007) . The HCN, HC
3 N and CH
3 CN mole fractions derived from
INMS data are much larger than the CIRS or ground-based measurements at 500 km (about 10, 30 and 200 times respec-tively), which implies production in the upper atmosphere and transport or diffusion to lower levels. INMS data also provide the fi rst evidence for the presence of cyanobutadiyne (HC
5 N) at the ppm level, acrylonitrile (C
2 H
3 CN), propionitrile
(C 2 H
5 CN), ammonia (NH
3 ), methyleneimine/methanimine
(H 2 CNH), probably methylcyanopolyynes (CH
3 C
3 N, CH
3 C
5 N)
and two unidentifi ed N-bearing species (C 5 H
5 N, C
6 H
7 N),
which reveals the complexity of the chemistry taking place in the upper atmosphere (cf. Ch. 12).
10.5.4 Minor Constituents – Oxygen Compounds
Although Titan’s atmosphere is a reducing environment, it contains oxygen compounds, three of which have been detected so far. Carbon dioxide, the fi rst to be discovered (by Voyager 1 in 1980; Samuelson et al. 1983) , is also the best characterized, as observations by Voyager 1, Voyager 2 , ISO , and Cassini all give consistent results (see de Kok et al. 2007 ; Coustenis et al. 2007 , and references therein). To within error bars, CO
2 appears to be uniformly mixed with
latitude and altitude above its condensation level in the lower stratosphere and up to at least 200 km, with a (1.5 ± 0.4) × 10– 8 mixing ratio. CO
2 can be easily formed through reaction
of CO and OH, itself produced from the photolysis of water. CO was fi rst discovered from ground-based observations at 1.6 µm (Lutz et al. 1983) , and extensively re-observed since then, especially at 5-µm (in refl ectance spectroscopy, ther-mal emission, and non-thermal emission) and through its mm/submm rotational lines observed from the ground and recently from Cassini (see Hörst et al. 2008 for a review of all measurements). Although the early observations gener-ated a large body of controversy as to the abundance and stratospheric vertical distribution of CO, the most recent measurements point to a mean, latitude-independent, mixing ratio of about 40 ppm, with no clear evidence for altitude variation from the surface to the upper atmosphere. For both CO
2 and CO, the spatial and vertical uniformity can be
understood in terms of their long chemical lifetimes (typi-cally a few thousand and 500 million years, respectively) with respect to the horizontal and vertical transport times-cales. The third oxygen species, water vapor, has been detected by ISO (Coustenis et al. 1998) . The H
2 O column
density is 2.6 1.91.6
+− × 10 14 mol cm −2 , and the best-determined
mixing ratio is 8 64
+− × 10– 9 at 400 km, although it most likely
increases with altitude. A preliminary assessment of the CIRS/ Cassini spectra indicates that water is detected in these data (Bjoraker et al. 2008) , but no estimates on the amount and distribution of water are available yet. Finally, upper limits on CH
3 OH and CH
3 C
2 O are available from INMS/ Cassini
(Vuitton et al. 2007 ) . The presence of H
2 O and CO
2 is a direct proof of an
external source of water in Titan’s atmosphere, and photo-chemical models designed to reproduce the observed abundance of all three oxygen species require reassuringly similar OH (H
2 O) fl uxes (Table 10.1 ). The essential unsolved
question is the ultimate origin of this water infl ux, which possibly includes distant (micrometeorite ablation) and/or

24910 Atmospheric Structure and Composition
local (sputtering of icy satellite or ring surfaces, Enceladus venting) sources.
The origin of CO is more uncertain. Early models (Samuelson et al. 1983 ; Yung et al., 1984 ; Toublanc et al. 1995 ; Lara et al. 1996) assumed that the formation of CO proceeds through OH + CH
3 → CO + 2 H
2 (i.e. that a fl ux of
water alone could explain all three O-bearing compounds). However, even under this assumption, the OH fl uxes required to sustain the observed amounts of H
2 O and CO
2 fail to pro-
duce a ~ 40 ppm CO mixing ratio and the current chemical loss of CO exceeds its steady-state production by typically (1–2) × 10 6 cm −2 s −1 . The problem was exacerbated with the realization (Wong et al. 2002) that the OH + CH
3 reaction
essentially recycles water, leading to only ~2 ppm of CO in equilibrium. Suggestions to solve this dilemma included: (i) alternate external sources, such as CO contained in micro-meteorites (Lara et al. 1996) or delivered by cometary impacts (Lellouch et al. 2003) , (ii) surface or internal sources such as oceanic evaporation (Dubouloz et al. 1989) or volcanic outgassing (Baines et al. 2006) , and (iii) a CO abundance not in equilibrium and refl ecting a larger primordial abundance (Wong et al. 2002 ; Wilson and Atreya 2004) .
The recent discovery of O + ions precipitating into Titan’s atmosphere (Hartle et al. 2006) provides a new source of
oxygen and especially CO because through collisions with the atmosphere O + is ultimately converted into ground-state O( 3 P), which can react with CH
3 to produce CO, either
directly (O( 3 P) + CH 3 ® CO + H
2 + H) or through HCHO
(Hörst et al. 2008) . These authors showed that essentially all of the incoming O + is converted to CO, so that the observed O + infl ux rate of ~10 6 cm −2 s −1 can provide the observed CO abundance in ~300 million years and approximately balance the chemical loss of CO to CO
2 . Studying the sensitivity of
their model calculations to eddy diffusion profi les, Hörst et al. (2008) demonstrated that the abundances and profi les of CO, H
2 O, and CO
2 can be fi t simultaneously with realistic
fl uxes of OH (H 2 O) and O( 3 P) (O + ) .
In Tables 10.2 and 10.3, a brief summary of Titan’s strato-spheric composition is given at two latitudes (15°S, 54°N) for the 5 mbar pressure level, where the altitude is 115–120 km. It should be kept in mind that the stratospheric composi-tion varies considerably with altitude and latitude with few exceptions such as CH
4 and CO. The reader is strongly
encouraged to consult Figs. 10.8 – 10.10 in conjunction with Tables 10.2 and 10.3 .
Table 10.1 Water (OH), CO, and O + fl uxes in several chemical models. Fluxes, j , (10 6 cm −2 s −1 ) are referred to the surface
Reference Target-molecule(s) j (OH) j (CO) j (O( 3 P))
Lara et al. (1996); Lara (1998) CO
2 , CO 3 0.83 –
Coustenis et al. 1998 a H
2 O 1.3–4.5 – –
Wilson and Atreya 2004 CO
2 , H
2 O 5 (5x10– 5 ) b –
Hörst et al. 2008 c CO 2 , CO, H
2 O 2–9 – 1–4
a From rescaling of Lara et al. (1996) model. b Imposed mixing ratio. c Including sensitivity to eddy diffusion profi le.
Table 10.2 Stratospheric composition 15°S: mixing ratios (by volume) at approximately 120 km/5 mbar.
Hydrocarbonspe Nitriles Oxygen compounds
CH 4 0.014 (1) HCN 0.1 ppm (2) CO 47 ppm (7)
C 2 H
6 10 ppm (2) CH
3 CN 20 ppb a (5) CO
2 16 ppb (7)
C 2 H
2 2 ppm (2) HC
3 N 1 ppb a (5) H
2 O 0.4 ppb (3)
C 2 H
4 0.4 ppm (2) C
2 N
2 0.06 ppb (6)
C 3 H
8 0.5 ppm (2)
CH 3 C
2 H 8 ppb (2)
C 4 H
2 1 ppb (2) Noble gases
C 6 H
6 0.4 ppb (3) 36 Ar 0.28 ppm (1)
H 2 0.00096 (4) 40 Ar 43 ppm (1)
a At 300 km (disc-averaged). Source: After Bézard 2009 with additional data points from Teanby et al. 2009; (1) Niemann et al. (2005); (2) Vinatier et al. (2007a); (3) Coustenis et al. (2007); (4) Courtin et al. (2008); (5) Marten et al. (2002); (6) Teanby et al. (2009); (7) de Kok et al. (2007)
Table 10.3 Stratospheric composition 54°N: mixing ratios (by volume) at approximately 115 km/5 mbar
Hydrocarbonspe Nitriles Oxygen compounds
CH 4 HCN 0.9 ppm (1) CO
C 2 H
6 16 ppm (1) CH
3 CN CO
2 25 ppb (1)
C 2 H
2 4 ppm a (1) HC
3 N 15 ppb a (1) H
2 O
C 2 H
4 0.6 ppm (1) C
2 N
2 1 ppb (3)
C 3 H
8 1.5 ppm (1)
CH 3 C
2 H 20 ppb (1)
C 4 H
2 20 ppb a (1)
C 6 H
6 4 ppb a (1)
H 2 0.0012 (2)
a At 170 km (1 mbar). Source: (1) Vinatier (2007); (2) Courtin et al. (2008); (3) Teanby et al. (2009)

250 D.F. Strobel et al.
10.5.5 Isotope Ratios
Numerous isotopic ratios have now been determined in Titan’s atmosphere, either from in situ measurements (Huygens GCMS, Cassini INMS) or from spectroscopic observations at IR and mm wavelengths obtained from the ground and espe-cially from Cassini/CIRS (see Table 10.4 ). Most isotopic ratios have been determined separately in several molecules, allowing one to study (i) formation and evolution processes of the atmosphere as a whole, as traced by major species and (ii) chemical fractionation effects in minor species. The interpre-tation of isotopic ratios in CH
4 , N
2, and CO is discussed in
detail in the Chapters 3 and 7. Briefl y, the enhanced D/H in Titan’s methane compared to the protosolar value – typically by a factor of 6 – is thought to refl ect a combination of (i) an initially high D/H in the primordial icy material that formed Titan and (ii) fractionation processes at work in the atmosphere,
such as methane photolysis and escape (Pinto et al. 1986 ; Lunine et al. 1999 ; Mousis et al. 2002 ; Cordier et al. 2008) . As regards N
2 , the factor ~1.5 enhancement in 15 N/ 14 N has
been interpreted as due to non-thermal escape of N 2 (Lunine
et al. 1999) , and suggests that Titan’s primitive atmosphere was 2–10 times thicker than nowadays (Niemann et al. 2005) . A similar explanation, involving a massive loss of CO in Titan’s early history, was put forward by Wong et al. (2002) to explain the factor of ~2 higher than terrestrial 18 O/ 16 O ratio reported by Owen et al. (1999) . There is recent evidence, however, that the enrichment in 18 O is considerably milder (see Table 10.4 ). Finally, atmospheric escape is also qualitatively consistent with the fact that the 12 C/ 13 C ratio, as measured in CH
4 , is slightly (by 8 %), but unambiguously, smaller than the
terrestrial value of 89. The 12 C/ 13 C ratio has been measured in many molecules
besides CH 4 , including CH
3 D, C
2 H
2 , C
2 H
6 , HCN, HC
3 N, CO,
Table 10.4 Isotopic ratios determined from indicated parent molecules and techniques for Titan’s atmosphere compared with values for the Earth and the Sun
Isotope Molecule Technique Titan value Reference Earth Solar e
D/H H 2 GCMS (2.3 ± 0.5) × 10 –4 Niemann et al. 2005 1.56 × 10 –4 1.9 × 10 –5
CH 4 IR, ground (1.25 ± 0.25) x10 –4 Penteado et al. 2005
CH 4 CIRS (1.17 +0.23
–0.28 ) x10 −4 Coustenis et al. 2007
CH 4 CIRS (1.32 +0.15
–0.11 ) x10 –4 Bézard et al. 2007
C 2 H
2 CIRS (2.09 ± 0.45) x10 –4 a Coustenis et al. 2008
12 C/ 13 C CH 4 GCMS 82.3 ± 1 Niemann et al. 2005 89 89
CH 4 INMS ~81 b Waite et al. 2005
CH 4 CIRS 76.6 ± 2.7 Nixon et al. 2008a
CH 3 D CIRS 82
–18 +27 Bézard et al. 2007
C 2 H
2 CIRS 84.8 ± 3.2 Nixon et al. 2008a
C 2 H
6 CIRS 89.8 ± 7.3 Nixon et al. 2008a
CH 4 +C
2 H
2 +C
2 H
6 c CIRS 80.8 ± 2.0 Nixon et al. 2008a
HCN mm, ground 108 ± 20 d Gurwell 2004 HCN CIRS 75 ± 12 Vinatier et al. 2007b HC
3 N CIRS 79 ± 17 Jennings et al. 2008
CO 2 CIRS 84 ± 17 Nixon et al. 2008b
14 N/ 15 N N 2 GCMS 183 ± 5 Niemann et al. 2005 272 440 ± 60 f
N 2 INMS 168–211 b Waite et al. 2005
HCN mm, ground 60–70 Marten et al. 2002 HCN mm, ground 72 ± 9 d Gurwell 2004 HCN CIRS 56 ± 8 Vinatier et al. 2007b
16 O/ 18 O CO mm, ground ~250 Owen et al., 1999 499 499 CO
2 CIRS 346 ± 110 Nixon et al. 2008b
36 Ar/ 40 Ar atoms GCMS (6.5 ± 0.8) × 10 –3 Niemann et al. 2005 0.0034 3440
a From nadir observations. A slightly lower value (1.63 ± 0.27) × 10 –4 is obtained from limb observations. b Estimated in lower atmosphere from extrapolation of values measured in thermosphere (95.6 ± 0.1 for 12 C/ 13 C and 172–215 for 14 N/ 15 N). c Weighted-mean average. d Assuming thermal profi le from Lellouch (1990) . Higher values (132 ± 25 for 12 C/ 13 C and 94 ± 13 for 14 N/ 15 N) are found when the profi le from Coustenis and Bézard (1995) is used. e Lodders (2003) . f Proto-solar value, based on the Jupiter value (Owen et al. 2001) .

25110 Atmospheric Structure and Composition
and CO 2 . To within error bars, all measurements are consistent
with the value in CH 4 , although for hydrocarbons Nixon
et al. (2008a) report a possible trend for an increasing value with molecular mass. In contrast, the D/H ratio measured in H
2 (Niemann et al. 2005) is somewhat higher than in CH
4 ,
which might result from fractionation at atmospheric escape. Fractionation by photolysis may also occur. Given the higher binding energy of the C-D bond compared to C-H, this would tend to enhance the D/H ratio in C
2 H
2 , as marginally observed
(Coustenis et al. 2008) , but decrease it in H 2 . Evidence for
such an effect is best seen in HCN, in which 15 N/ 14 N is about three times higher than in N
2 . As demonstrated by Liang
et al. (2007a) , this results from the self-shielding of 14 N 14 N against photolysis, while 14 N 15 N, whose predissociation states are shifted from those of 14 N 14 N, remains optically thin to greater depths. For pure N
2 photolysis, this would in fact
lead to a HC 14 N/HC 15 N ratio as low as 23, considerably over-predicting the observed value of ~60. This implies an addi-tional source of non-fractionated atomic N, attributed to ion/electron impact on N
2 .
10.6 Sources, Sinks, and Photochemistry of Atmospheric Composition
The atmosphere of Titan contains many trace constituents in the form of hydrocarbons (C
x H
y ), nitriles (C
x H
y N
z ) and
aerosols, which are products of the photolysis of methane and nitrogen in the upper atmosphere. Even before Voyager discovered this suite of constituents and that the atmosphere was primarily nitrogen, Strobel (1974) developed the basic framework of methane photochemistry in Titan’s atmosphere and concluded that, in the absence of escaping hydrogen atoms and molecules being recaptured, methane would be irre-versibly destroyed on a time scale short compared to Titan’s age. Yung et al. (1984) developed the fi rst comprehensive post-Voyager model of Titan photochemistry that explained satisfactorily the limited composition data from Voyager.
The photochemistry of CH 4 occurs in two distinct, broad
altitude/pressure regions. When coupled with the high effi -ciency for hydrogen escape, it leads to irreversible loss of CH
4 . In addition, CH
4 may be escaping the atmosphere at
large rates (cf. Yelle et al. 2008 ; Strobel 2008, 2009) . The lifetime for atmospheric CH
4 (for column density ~7.5 × 10 24
cm −2 ) is only ~45 MY when its loss rate is constrained by its limiting fl ux through the lower stratosphere and ~15 MY when it is constrained by the largest model chemical loss rate (see Table 10.5 and discussion below) and implies that it must be continually resupplied from the interior. (Table 10.5 below provides a convenient list of all loss rates and fl uxes discussed in this section for easy reference.) Direct CH
4 pho-
tolysis is driven principally by the intense solar Lyman a
line at 121.6 nm, because UV radiation is only absorbed by CH
4 with a signifi cant cross section below 145 nm, even
though only 4.5 eV (= 285 nm) is needed to break CH 4 apart.
This photolysis is centered at pressures ~7 nbar (~825 km) and in photochemical models contributes a net destruction rate of ~2.9 × 10 9 cm −2 s −1 (e. g. Yung et al. 1984) . The radi-cals released in CH
4 photolysis react to form initially C
2 H
y
hydrocarbons (C 2 H
6 , C
2 H
4 , C
2 H
2 ). Methane can also be
destroyed by indirect catalytic C 2 H
2 dissociation, whereby
the radicals C 2 H and C
2 dissociate CH
4 and recycle C
2 H
2 .
This process is most important in the 0.1–1 mbar region (190–300 km) and contributes a loss rate of ~1 × 10 10 cm −2 s −1 , signifi cantly larger than the direct rate. To a lesser extent, methane is also destroyed by ion chemistry, with two CH
4
molecules dissociated per ion pair created. From Wilson and Atreya (2004) their globally averaged, integrated electron production rate times 2 is ~3.6 × 10 8 cm −2 s −1 or when refer-enced to the surface ~7 × 10 8 CH
4 cm −2 s −1 , are destroyed.
Thus an upward fl ux of CH 4 driven by photochemistry,
must be balanced by downward fl uxes of more complex, C 2 ,
C 3 , C
4 , etc., hydrocarbons carrying the same total number of
Table 10.5 Comparison of various rates for CH 4 photochemistry, escape
fl uxes from, and limiting diffusion fl uxes through Titan’s atmosphere
Process Rates referenced to surface (cm −2 s −1 )
H 2 escape fl ux at exobase Y: 7.2 × 10 9 ; WA: 5.0 × 10 9 ;
L: 4.2 × 10 9 ; C:1.4 × 10 10 ; S9: 1.1 × 10 10
H escape fl ux at exobase Y: 5.5 × 10 9 ; WA: 3.0 × 10 9 ; L: 9.3 × 10 8
CH 4 escape fl ux at exobase Yelle08: (2.5–3) × 10 9 ; S9: 2.1 × 10 9
Ionospheric chemical CH 4 loss (a) WA: ~7 × 10 8
Direct (Ly a ) CH 4 dissociation a Y: 2.9 × 10 9
C 2 H
2 catalytic CH
4 dissociation a Y: 1.1 × 10 10
Total net CH 4 chemical loss (a)
and gas phase C atom fl ux Y: 1.5 × 10 10 ; WA: 8.7 × 10 9 ;
L: 1.3 × 10 10 Downward C
2 H
6 fl ux at
tropopause Y: 5.8 × 10 9 ; WA: 2.2 × 10 9 ;
L: 4.1 × 10 9 Downward C
2 H
2 fl ux at
tropopause Y: 1.2 × 10 9 ; WA: 5.9 × 10 8 ;
L: 3.2 × 10 8 Downward C
3 H
8 fl ux at
tropopause Y: 1.4 × 10 8 ; WA: 2.9 × 10 8 ;
L: 3.7 × 10 8 Downward mass fl ux of aerosols L: 1.5 × 10 –14 ; B: 1.5 × 10 –14 ;
M: (0.5–2) × 10 –14 g cm −2 s −1 Downward C atom fl ux
in aerosols L: 3.8 × 10 8 Downward N atom fl ux
in aerosols L: 3.0 × 10 8 Downward H atom fl ux
in aerosols L: 2.9 × 10 8 Limiting fl ux of H
2 (@0.4%) S08: 1.3 × 10 10
Y: Yung et al. (1984) ; WA: Wilson and Atreya (2004) ; C: Cui et al. (2008) ; L: Lavvas et al. (2008) ; S8: Strobel (2008); S9: Strobel (2009) ; Yelle08: Yelle et al. (2008) ; B: Bézard (2009) ; M: McKay et al. (2001) . a Rate =
0
2 20( )( / )
exr
rL r r r dr∫ , r
0 , r
ex = Titan’s radius, exobase.

252 D.F. Strobel et al.
carbon atoms. All of these less saturated hydrocarbons condense as liquids or solids in the lower stratosphere and vicinity of Titan's cold tropopause (~70 K), with the excep-tion of C
2 H
4 , to form a pervasive haze layer. Eventually they
precipitate from the atmosphere and accumulate on the surface, although to date the precise composition, location, and depth of these end products of CH
4 photolysis is still
under intense study by Cassini scientists (cf. Chapter 6). The most abundant photolysis product is C
2 H
6 (cf. Figs. 10.8 –
10.10), which is expected to undergo condensation in the stratosphere 40–50 km above the surface.
The tentative detection of benzene (C 6 H
6 ) at ppbv levels
by ISO (Coustenis et al. 2003) , added a new dimension to Titan photochemistry, as benzene is the first ring mole-cule that is generally a precursor to a whole host of heavier hydrocarbons including polycyclic aromatic hydrocarbons (PAH’s). Aerosols can form upon polymerization of the PAH’s. The only aerosols predicted prior to the detection of benzene were from polyyne (C
2n H
2 ) polymers, HCN poly-
mers, and the condensation of stable C 2 –C
4 hydrocarbons in
the lower stratosphere. Wilson and Atreya (2004) developed a comprehensive post-ISO model of the coupled chemistry of the neutral atmosphere and the ionosphere. A simplifi ed chemical scheme for the neutral atmosphere from Atreya et al. 2006 is shown in Fig. 10.11 . Waite et al. (2007) reported molecules as large as tens of thousand daltons may be pres-ent at ionospheric heights, which are probably precursors to aerosol formation in the thermosphere. Cassini UVIS has detected aerosols from 1000 km down to the main haze layer (Liang et al. 2007b) .
Synthesis of complex hydrocarbons can be defeated by H-atom cracking reactions: e. g., H + C
2n H
2 + M → C
2n H
3 +
M, H + C 2n
H 3 → C
2 H
2 + C
2n-2 H
2 . Since the main Titan haze
layer is composed of large, condensed molecules with most of the mass contributed by hydrocarbons, Titan must some-how limit the effi ciency of these H-atom cracking reactions.
The haze particles may play a fundamental role in this process by suppressing the H atom concentration via hetero-geneous reactions which recombine H atoms on aerosol surfaces and release H
2 gas (cf. Lebonnois et al. 2003a ; Sekine
et al. 2008a, b) . These heterogeneous reactions are more than competitive with the cracking reactions that are slow at Titan's pressures and temperatures.
The key observational facts constraining CH 4 photochem-
istry are (1) the INMS inferred H 2 escape rate of (1.1–1.4) ×
10 10 cm −2 s −1 (Cui et al. 2008 ; Strobel 2009) , (2) the most abundant photochemically produced gas phase hydrocarbon molecule is C
2 H
6 followed by C
2 H
2 (cf. Figs. 10.8 , 10.10 ),
(3) the stratospheric CH 4 mole fraction is 0.0141 from
GCMS (Niemann et al. 2005) , and (4) the thermospheric CH
4 mole fraction obtained by INMS at the lowest altitudes
sampled is slightly lower than the stratospheric value (Yelle et al. 2008) and indicative of CH
4 destruction. Bézard (2009)
inferred the mass production rates of C 2 H
6 and haze from
CIRS derived C 2 H
6 and DISR derived haze profi les under the
assumption that diffusive transport dominates below their respective formation regions. He obtained a production ratio of 15 times more C
2 H
6 than haze.
From a large number of photochemical model calcula-tions, three were selected to illustrate mass balance and partitioning of photochemical products: (1) Yung et al. (1984) for comprehensive post-Voyager analysis, (2) Wilson and Atreya (2004) , and (3) Lavvas et al. (2008) for contempo-rary Cassini–Huygens analysis. Table 10.5 gives relevant magnitudes of CH
4 destruction rates, and downward, escape,
and limiting fl uxes that pertain to CH 4 photochemistry. In spite
of the 24 year time span and improvement in input quantities and more observational constraints, Yung et al. (1984) and Lavvas et al. (2008) are in essential agreement on these important rates. In addition to these gas phase production rates, Lavvas et al. (2008) calculated individual production rates of C, N, H atoms that are incorporated into haze particles
Fig. 10.11 Simplifi ed schematic of the photochemistry of N 2 and CH
4 in Titan’s atmosphere through the formation of polymers (after Atreya
et al. (2006) )
C2H5
PAH
polyacetylene polymers
PAHpolymers
C2n+2H2
nitriles
nitrilepolymershaze
C3H8
C2H4
CH4
CH3 C2H6C2H2
CH3C2H
C2H3
C3H6C4H6
C3H3
C6H6
C4H2
N2
N4S
C2N2
CN
C4N2 N2D
C2H3CN
HC3N
HCN H2CN
CH3CN
CHCN

25310 Atmospheric Structure and Composition
and the total haze production rate (cf. Table 10.5 ). This latter value is 1/14 of the gas phase mass production rate of C
2 H
6 , as
Bézard (2009) concluded from an empirical analysis of Cassini and Huygens data. But Atreya et al. (2006) argued that this ratio may be as large as ½, based on Wilson and Atreya (2004) whose gas phase production rates are systematically lower than Yung et al. (1984) and Lavvas et al. (2008) .
The chemical loss and escape of CH 4 must be balanced by
upward transport from the lower atmosphere. With the fur-ther hypothesis that CH
4 is the source of all other carbon and
hydrogen bearing molecules in the atmosphere and escaping from the atmosphere, then stoichiometrically 2 CH
4 → C
2 H
2n
+ (4-n) H 2 must hold. Note for n = 0, the measured INMS H
2
escape rate places a lower limit on the net CH 4 destruction
rate of (5.5–7) × 10 9 cm −2 s −1 . From Table 10.5 a comparison of the INMS inferred H
2 escape rates with total net CH
4 model
loss rates suggests that n = 2 would be the preferred value. But observations indicate that C
2 H
6 is the dominant product
which implies n = 3. From the Yung et al. (1984) the effective H
2 (H
2 + ½ H) escape rate is ~1 × 10 10 cm −2 s −1 , the lower end
of INMS H 2 values, whereas Wilson and Atreya (2004) and
Lavvas et al. (2008) , calculated less, 0.65 × 10 10 and 0.47 × 10 10 cm −2 s −1 , respectively. But certainly some hydrogen is escaping in atomic form, as ionospheric chemistry leads to production of H atoms high in the atmosphere. Thus models to date under predict the H
2 escape rate, because prior to the
INMS measurements it was thought that H 2 escape occurred
at the Jeans rate, a factor of ~3 lower. To achieve the larger INMS H
2 escape rate and still have C
2 H
6 the dominant prod-
uct of CH 4 chemistry, the CH
4 chemical destruction rate must
be also larger than the values given in Table 10.5 . The photochemistry of N
2 occurs mostly in Titan’s ther-
mosphere and ionosphere, because the N 2 bond strength of
9.7 eV requires energetic photons, electrons, and ion to break the molecule apart. With no optically allowed excitation paths into repulsive electronic states, dissociation occurs preferentially by indirect paths. Solar radiation between 80 and 100 nm can excite predissociating electronic states which are £ 25 % of the total source of N atoms (Liang et al. 2007a) . The ion chemistry of N
2 + preserves the N
2 bond, but
dissociative ionization of N 2 by either electron impact or
solar EUV radiation will produce one N atom and one N + ion, which will react with CH
4 to yield either an N atom or
an ion (H 2 CN + or HCN + ). The latter ion reacts with CH
4 to
form the former ion and recombination of H 2 CN + produces
the nitrile HCN and net loss of CH 4 . Energetic electrons of
photolytic and magnetospheric origins can also directly dis-sociate N
2 . The net effi ciency for producing nitriles depends
on the extent of self destruction of odd nitrogen by the reac-tion N + NH → N
2 + H. Photochemical models estimate the
net production/downward fl ux of N atoms from the thermo-sphere ~(0.5–1) × 10 9 cm −2 s −1 , whereas self destruction by the above reaction limits the downward HCN fl ux to only ~3
× 10 8 cm −2 s −1 and an equal number incorporated into haze particles (Lavvas et al. 2008) . Once the CN bond is formed, it is preserved down through the stratosphere.
10.7 Chemistry and Transport of Atmospheric Constituents
Both Voyager IRIS and Cassini CIRS spectra imply that there is enrichment of several organic compounds at high northern latitude during northern winter and early northern spring. Because most of these species are formed high up in the atmosphere from the photo- and electron-impact disso-ciation of CH
4 and N
2 , their mixing ratio surfaces increase
with altitude. A meridional circulation tilts these mixing ratio surfaces in the following sense (cf. Holton and Schoeberl 1988 ; Bacmeister et al. 1995 ; Dire 2000) . Downward motion (subsidence) brings down higher mixing ratios from above while upward motion brings lower mixing ratios from below. Hence enrichment with latitude implies subsidence over Titan’s North Pole in its current winter season during the Cassini Nominal Mission. In Fig. 10.12 is a schematic dia-gram of what is thought to be the relevant dynamical pro-cesses that generate constituent transport and based on analogy with the much better understanding of these pro-cesses in the Earth’s middle atmosphere. In Fig. 10.10 there are blue dashed lines that show the region where horizontal potential vorticity gradients are the steepest (~55–65º N) and location of dynamical mixing barriers. In this fi gure the more abundant C
2 H
2 and HCN clearly show enhanced mixing
ratios in the northern polar region at high altitudes expected from subsidence. In the case of HCN, most of its formation occurs at higher altitudes, whereas for C
2 H
2 there is also sig-
nifi cant formation in the stratosphere. However, C 2 H
2 has a
local maximum in mixing ratio at ~200 km in the polar night suggesting a local source and certainly not consistent with simple explanation from subsidence associated with a merid-ional circulation. On the other hand HCN has a local mini-mum in its mixing ratio center at ~350 km and 60º N. This cannot be due to gas phase conversion to other gas phase nitriles, e. g. H
3 CN in Fig 10.10 . But it could be due to het-
erogeneous reactions removing nitriles and/or condensation, although the temperature is still warm by Titan’s standards. Chapter 13 discusses dynamics in much more detail.
10.8 Concluding Remarks
At the end of the Cassini–Huygens Nominal Mission, we have a good fi rst order knowledge of the composition and thermal structure of the atmosphere with the exception of the

254 D.F. Strobel et al.
~500–950 km region, variously called the ignorosphere, agnostosphere, etc. Although HASI inferred the thermal structure at equatorial latitudes through this region, it did not yield a pronounced mesopause widely expected from theory. Ground-based millimeter-wavelength provided limited, globally averaged, composition measurements, in compari-son to the detailed altitudinal and latitudinal composition and temperature measurements by CIRS for the stratosphere. The UVIS stellar occultation could also provide composition and thermal structure in the ignorosphere region, but the only published analysis (Shemansky et al. 2005) has defi -ciencies noted above. Better knowledge of the ignorosphere structure would be helpful to resolve the vexing factor of ~2.5 density discrepancy among HASI, INMS, and AACS.
The thermosphere is a chemical factory that initiates the formation of complex positive and negative ions in the high thermosphere as a consequence of magnetospheric–ionospheric–atmospheric interaction involving solar EUV and UV radiation, energetic ions and electrons. This factory produces very heavy positive and negative ions and large molecules, e.g., benzene, naphthalene, nitriles, which appar-ently condense out and are detectable in solar and stellar UV occultations at ~1000 km (Liang et al. 2007a) , and initiate the haze formation process. As these particles fall through the ignorosphere and grow, they become detectable by remote sensing: UVIS at ~1000 km, ISS at ~500 km and eventual become ubiquitous throughout the stratosphere. These haze particles are strong absorbers of solar UV and visible radiation and play a fundamental role in heating
Titan's stratosphere and perhaps the ignorosphere (Lavvas et al. 2009) . The differential heating with latitude drives wind systems in Titan's middle atmosphere, much as ozone does in the Earth's middle atmosphere. How intimately cou-pled is the upper thermosphere with the stratosphere and what is the role of the ignorosphere? It is certainly the region of direct photolysis of CH
4 . Are complex positive and
negative ions and large molecules from above necessary for formation of the main haze layer? What is the role of hetero-geneous reactions in determining the partitioning of gas phase molecules and the composition of haze particles?
The Cassini Mission has just entered the fi rst extended mission known as the Cassini Equinox Mission to under-stand the transition for solstitial conditions to equinoctial conditions, especially as the northern polar region emerges out of the polar night and the polar vortex breaks up. In the planning stages is a proposal to extend the Cassini Mission into a northern, summer solstice mission to explore that tran-sition from equinox into solstitial conditions. Thus the entire duration of the Cassini Mission would be a half of Saturnian year and would permit observations of a full seasonal cycle on Titan.
Acknowledgments DFS acknowledges support by the Cassini–Huygens Mission through JPL Contract No. 1280253. SKA acknowledges support by the Cassini–Huygens Program and Planetary Atmospheres Program of NASA. BB, EL, and M Fulchignoni acknowledge fi nancial support from CNRS and CNES. The authors are indebted to Dr. Sandrine Vinatier for providing Fig. 10.9 and Dr. Eric Wilson supplying his rates referenced to the surface in Table 10.5 .
Fig. 10.12 Schematic of dynamical processes thought to be important in Titan’s winter north polar region: a single cell meridional circulation, a polar vortex of strong zonal winds, wave induced mixing by inferred equatorial barotropic and gravity waves (after Teanby et al. (2008) )
Tracerdepletedmesosphericzone
Residualcirculation
−80° −50° 0° 50° 65° 80°
Condensation
gravity waves
50 km
100 km
Meridional circulation returning branch
300 km
Meridional circulation descending branch
Upward advection
Mixing of longlived species
Barotropic instabilities
500 km
VORTEXzonal wind contours
Tracerenrichedair

25510 Atmospheric Structure and Composition
References
Achterberg RK, Conrath BJ, Gierasch PJ, Flasar FM, Nixon CA (2008) Titan’s middle-atmospheric temperatures and dynamics observed by the Cassini Composite Infrared Spectrometer. Icarus 194:263–277, doi:10.1016/j.icarus.2007.09
Atreya SK, Donahue TM, Kuhn WR (1978) Evolution of a nitrogen atmosphere on Titan. Science 201:611–613
Atreya SK, Adams EY, Niemann HB, Demick-Montelara JE, Owen TC, Fulchignoni M, Ferri F, Wilson EH (2006) Titan's methane cycle. Planet Space Sci 54:1177–1187. doi: 10.1016/j.pss.2006.05.028
Bacmeister JT, Schoeberl MR, Summers ME, Rosenfi eld JR, Zhu X (1995) Descent of long-lived trace gases in the winter polar vortex. J Geophys Res 100:11669–11684
Baines KH, Drossart P, Lopez-Valverde MA, Atreya SK, Sotin C, Momary TW, Brown RH, Buratti BJ, Clark RN, Nicholson PD (2006) On the discovery of CO nighttime emissions on Titan by Cassini/VIMS: derived stratospheric abundances and geological implications. Planet Space Sci 54:1552–1562. doi: 10.1016/j.pss.2006.06.020
Bézard B (2009) Composition and chemistry of Titan’s stratosphere. Phil Trans Royal Soc A 367:683–695. doi: 10.1098/rsta.2008.0186
Bézard B, Coustenis A, McKay CP (1995) Titan’s atmospheric tem-perature asymmetry: a radiative origin? Icarus 111:267–276
Bézard B, Nixon CA, Kleiner I, Jennings DE (2007) Detection of 13 CH
3 D on Titan. Icarus 191:397–400
Bjoraker G, Achterberg R, Anderson C, Samuelson R, Carlson R, Jennings D (2008) Cassini/CIRS observations of water vapor in Titan’s stratosphere, Bull Amer Astron Soc 40(31.12):446
Broadfoot AL et al (1981) Extreme ultraviolet observations from Voyager 1 encounter with Saturn. Science 212:206
Cordier D, Mousis O, Lunine JI, Moudens A, Vuitton V (2008) Photochemical enrichment of deuterium in Titan’s atmosphere: new insights from Cassini–Huygens. Astrophys J Lett 689:L61–L64
Courtin R, Gautier D, McKay CP (1995) Titan’s thermal emission spectrum: reanalysis of the Voyager infrared measurements. Icarus 114:114–162
Courtin RD, Sim C, Kim S, GautierD, Jennings DE (2008) Latitudinal variations of tropospheric H
2 on Titan from the Cassini CIRS inves-
tigation. 40th DPS meeting Abstract. 31.01, Ithaca, New York, Bull Amer Astron Soc 40(31.01): 446
Coustenis A, Bézard B (1995) Titan’s atmosphere from Voyager infra-red observations. IV. Latitudinal variations of temperature and com-position. Icarus 115:126–140
Coustenis A, Salama A, Lellouch E, Encrenaz T, Bjoraker GL, Samuelson RE, de Graauw T, Feuchtgruber H, Kessler MF (1998) Evidence for water vapor in Titan’s atmosphere from ISO/SWS data. Astron Astrophys 336:L85–L89
Coustenis A, Salama A, Schulz B, Ott S, Lellouch E, Encrenaz TH, Gautier D, Feuchtgruber H (2003) Titan's atmosphere from ISO mid-infrared spectroscopy. Icarus 161:383–403. doi: 10.1016/S0019-1035(02)00028-3
Coustenis A, Achterberg RK, Conrath BJ, Jennings DE, Marten A, Gautier D, Nixon CA, Flasar FM, Teanby NA, Bézard B, Samuelson RE, Carlson RC, Lellouch E, Bjoraker GL, Romani PN, Taylor FW, Irwin PGJ, Fouchet T, Hubert A, Orton GS, Kunde VG, Vinatier S, Mondellini J, Abbas MM, Courtin R (2007) The composition of Titan’s stratosphere from Cassini/CIRS mid-infrared spectra. Icarus 189:35–62. doi: 10.1016/j.icarus.2006.12.022
Coustenis A, Jennings DE, Jolly A, Bénilan Y, Nixon CA, Vinatier S, Gautier D, Bjoraker G, Romani P, Carlson R, Flasar FM (2008) Detection of C
2 HD and the D/H ratio on Titan. Icarus 197:539–548.
doi: 10.1016/j.icarus.2008.06.003 Crespin A, Lebonnois S, Vinatier S, Bézard B, Coustenis A, Teanby NA
(2008) Diagnostics of Titan’s stratospheric dynamics using Cassini/
CIRS data and the 2-dimensional IPSL Circulation Model. Icarus 197:556–57. doi: 10.1016/j.icarus.2008.05.010
Cui J, Yelle RV, Volk K (2008) Distribution and escape of molecular hydrogen in Titan’s thermosphere and exosphere. J Geophys Res 113:E10004. doi: 10.1029/2007JE003032
Danielson RE, Caldwell J, Larach DR (1973) An inversion in the atmo-sphere of Titan. Icarus 20:437–443
de Kok R, Irwin PGJ, Teanby NA, Lellouch E, Bezard B, Vinatier S, Nixon CA, Fletcher L, Howett C, Calcutt SB, Bowles NE, Flasar FM, Taylor FW (2007) Oxygen compounds in Titan’s stratosphere as observed by Cassini CIRS. Icarus 186:354–363. doi: 10.1016/j.icarus.2006.09.016
Dire JR (2000) Seasonal photochemical and meridional transport model for the stratosphere of Titan, Icarus, 145:428–444 (cf. Bull.A. A. S., 24:955–956, 1992)
Dubouloz N, Raulin F, Lellouch E, Gautier D (1989) Titan’s hypothesized ocean properties – The infl uence of surface temperature and atmo-spheric composition uncertainties. Icarus 82:81–96. doi: 10.1016/0019-1035(89)90025-0
Flasar FM et al (2005) Titan’s atmospheric temperatures, winds, and composition. Science 308:975–978
Fulchignoni M, Ferri F, Angrilliet F et al (2005) Titan’s physical charac-teristics measured by the Huygens Atmospheric Structure Instrument (HASI). Nature 438:785–791. doi: 10.1038/nature04314
Gillett FC, Forrest WJ, Merrill KM (1973) 8–13 micron observations of Titan. Astrophys J 187:L37–L38
Gurwell MA (2004) Submillimeter observations of Titan: Global measures of stratospheric temperature, CO, HCN, HC3N, and the isotopic 12C/13C and 14N/15N. Astrophys J 616:L7–L10
Hanel RA et al (1981) Infrared observations of the Saturnian system from Voyager 1. Science 212:192–200
Hartle RE, Sittler EC, Neubauer FM, Johnson RE, Smith HT, Crary F, McComas DJ, Young DT, Coates AJ, Simpson D, Bolton S, Reisenfeld D, Szego K, Berthelier JJ, Rymer A, Vilppola J, Steinberg JT, Andre N (2006) Preliminary interpretation of Titan plasma interaction as observed by the Cassini Plasma Spectrometer: comparisons with Voyager 1. Geophys Res Lett 33:8201. doi: 10.1029/2005GL024817
Holton JR, Schoeberl MR (1988) The role of gravity wave generated advection and diffusion in transport of tracers in the mesosphere. J Geophys Res 93:11075–11082
Hörst S, Vuitton V, Yelle RV (2008) The origin of oyxgen species in Titan’s atmosphere. J Geophys Res 113:E10006. doi: 10.1029/2008JE003135
Hunten D M (1974) The atmosphere of Titan. Washington, NASA SP-340 Hunten DM (1978) A Titan atmosphere with a surface temperature of
200 K. In Hunten DM, Morrison D (eds) The Saturn System, NASA Conf. Publ. 2068, Washington DC, pp 127–140
Hunten DM, Morrison D (eds) (1978) The Saturn System, NASA Conf. Publ. 2068, WashingtonDC, pp 127–140
Jacquemart D, Lellouch E, Bézard B, de Bergh C, Coustenis A, Lacome N, Schmitt B, Tomasko M (2008) New laboratory measurements of CH
4 in Titan’s conditions and a reanalysis of the DISR near-surface
spectra at the Huygens landing site. Planet Space Sci 56:613–623 Jennings DE, Nixon CA, Jolly A, Bézard B, Coustenis A, Vinatier S,
Irwin PGJ, Teanby N, Romani PN, Achterberg RK, Flasar FM (2008) Isotopic ratios in Titan’s atmosphere from Cassini CIRS limb sound-ing: HC
3 N in the north. Astrophys J Lett 681:L109–L111
Jennings DE, Flasar FM, Kunde VG, Samuelson RE, Pearl JC, Nixon CA, Carlson RC (2009) Titan’s surface brightness temperatures, Astrophys J, 691:L103–L105
Kuiper GP (1944) Titan: A satellite with an atmosphere. Astrophys J 100:378–383
Lara L (1998) Correction to “Vertical distribution of Titan’s atmo-spheric neutral constituents” by L M Lara et al., J Geophys Res 103:(E11), 25775–25775

256 D.F. Strobel et al.
Lara LM, Lellouch E, L´opez-Moreno JJ, Rodrigo R (1996) Vertical distribution of Titan’s atmospheric neutral constituents. J Geophys Res 101:23261–23283, doi:10.1029/96JE02036
Lavvas PP, Coustenis A, Vardavas IM (2008) Coupling photochemistry with haze formation in Titan's atmosphere, Part II: Results and vali-dation with Cassini/Huygens data. Planet Space Sci 56:67–99
Lavvas PP, Yelle RV, Vuitton V (2009) The detached haze layer in Titan’s mesosphere, Icarus, in press
Lebonnois S, Bakes ELO, McKay CP (2003a) Atomic and molecular hydrogen budget in Titan’s atmosphere. Icarus 161:474–485. doi: 10.1016/S0019-1035(02)00039-8
Lebonnois S, Hourdin F, Rannou P, Luz D, Toublanc D (2003b) Impact of the seasonal variations of composition on the temperature fi eld of Titan’s stratosphere. Icarus 163:164–174
Lellouch E (1990) Atmospheric models of Titan and Triton. Ann Geophys 8:653–660
Lellouch E, Coustenis A, Gauthier D, Raulin F, Dubouloz N, Frere C (1989) Titan’s atmosphere and hypothesized ocean: a reanalysis of the Voyager 1 radio-occultation and IRIS 7.7 µm Data, Icarus, 79:328–349
Lellouch E, Coustenis A, Sebag B, Cuby J-G, L’opez-Valverde M, Schmitt B, Fouchet T, Crovisier J (2003) Titan’s 5- m m window observations with the Very Large Telescope. Icarus 162:125–142. doi: 10.1016/S0019-1035(02)00079-9
Lewis JS (1971) Satellites of the outer planets: Their physical and chemical nature. Icarus 15:174–185
Liang M-C, Heays AN, Lewis BR, Gibson ST, Yung YL (2007a) Source of nitrogen isotope anomaly in HCN in the atmosphere of Titan. Astrophys. J. 664:L115–L118
Liang M-C, Yung YL, Shemansky DE (2007b) Photolytically generated aerosols in the mesosphere and thermosphere of Titan. Astrophys J 661:L199–L202
Lindal GF, Wood GE, Hotz HB, Sweetnam DN (1983) The atmosphere of Titan: an analysis of the Voyager radio occultation measure-ments. Icarus 53:348–363
Lodders K (2003) Solar system abundances and condensation tempera-tures of the elements. Astrophys J 591:220–1247
Lunine JI, Yung YL, Lorenz RD (1999) On the volatile inventory of Titan from isotopic abundances in nitrogen and methane. Planet Space Sci 47:1291–1303
Lutz BL, de Bergh C, Owen T (1983) Titan–Discovery of carbon mon-oxide in its atmosphere. Science 220:1374–1376
Marten A, Hidayat T, Biraud Y, Moreno R (2002) New millimeter het-erodyne observations of Titan: Vertical distributions of nitriles HCN, HC
3 N, CH
3 CN, and the isotopic ratio 15 N/ 14 N in its atmo-
sphere. Icarus 158:532–544 McKay CP, Pollack JB, Courtin R (1989) The thermal structure of
Titan’s atmosphere. Icarus 80:23–53 McKay CP, Coustenis A, Samuelson RE, Lemmon MT, Lorenz RD,
Cabane M, Rannou P, Drossart P (2001) Physical properties of the organic aerosols and clouds on Titan. Planet Space Sci 49:79–99
Mousis O, Gautier D, Coustenis A (2002) The D/H Ratio in methane in Titan: origin and history. Icarus 159:156–165
Müller-Wodarg ICF, Yelle RV, Cui J, Waite HJ Jr (2008) Horizontal structure and dynamics of Titan’s thermosphere. J Geophys Res 113:E10005. doi: 10.1029/2007JE003033
Niemann HB et al (2005) The abundances of constituents of Titan’s atmosphere from the GCMS instrument on the Huygens probe. Nature 438:779–784. doi: 10.1038/nature.04122
Nixon CA, Achterberg RK, Vinatier S, Bézard B, Coustenis A, Irwin PGJ, Teanby NA, de Kok R, Romani PN, Jennings DE, Bjoraker GL, Flasar FM (2008a) The 12C/13C isotopic ratio in Titan hydro-carbons from Cassini/CIRS infrared spectra. Icarus 195:778–791. doi: 10.1016/j.icarus.2008.01.012
Nixon CA, Jennings DE, Bézard B, Teanby NA, Achterberg RK, Coustenis A, Vinatier S, Irwin PGJ, Romani PN, Hewagama T,
Flasar FM (2008b) Isotopic ratios in Titan's atmosphere from Cassini CIRS limb sounding: CO2 in the equator and south. Astrophys J Lett 681:L101–L103
Owen T, Biver N, Marten A, Matthews H Meier R (1999) Saturn VI (Titan). IAU Circ 7306
Owen T, Mahaffy PR, Niemann HB, Atreya S, Wong M (2001) Protosolar Nitrogen. Astrophys. J. 553:L77–L79
Penteado PF, Griffi th CA, Greathouse K, de Bergh C (2005) Measurements of CH3D and CH4 in Titan from infrared spectroscopy, Astrophys J 629:L53–L56
Pinto JP, Lunine JI, Kim S-J, Yung YL (1986) The D to H ratio and the origin and evolution of Titan’s atmosphere. Nature 319:388–390
Porco CC et al (2005) Imaging of Titan from the Cassini spacecraft. Nature 434:159–168
Rannou P, Hourdin F, McKay CP (2002) A wind origin for Titan’s haze structure. Nature 418:853–856
Roe HG, de Pater I, McKay CP (2004) Seasonal variation of Titan’s stratospheric ethylene (C
2 H
4 ) observed. Icarus 169:440–461
Samuelson RE, Maguire WC, Hanel RA, Kunde VG, Jennings DE, Yung YL, Aikin AC (1983) CO
2 on Titan. J Geophys Res 88:8709–8715
Samuelson RE, Nath NR, Borysow A (1997) Gaseous abundances and methane supersaturation in Titan's troposphere. Planet Space Sci 45:959–980
Sekine Y, Lebonnois S, Imanaka H, Matsui T, Bakes ELO, McKay CP, Khare BN, Sugita S (2008a) The role of organic haze in Titan's atmospheric chemistry: II. Effect of heterogeneous reaction to the hydrogen budget and chemical composition of the atmosphere. Icarus 194:201–211. doi: 10.1016/j.icarus.2007.08.030
Sekine Y, Imanaka H, Matsui T, Khare BN, Bakes ELO, McKay CP, Sugita S (2008b) The role of organic haze in Titan's atmospheric chemistry: I. Laboratory investigation on heterogeneous reaction of atomic hydrogen with Titan tholin. Icarus 194:186–200. doi: 10.1016/j.icarus.2007.08.031
Shemansky DE, Stewart AIF, West RA, Esposito LW, Hallett JT, Liu X (2005) The Cassini UVIS Stellar Probe of the Titan Atmosphere. Science 308:978–982. doi: 10.1126/science.1111790
Sicardy B, Colas F, Widemann T, et al. (2006) The two stellar occulta-tions of November 14, 2003, J Geophys Res 111, doi:10.1029/2005JE002624
Strobel DF (1974) The Photochemistry of Hydrocarbons in the atmo-sphere of Titan. Icarus 21:466–470
Strobel, DF (2008) Titan’s hydrodynamically escaping atmosphere, Icarus, 193: 588–594, doi:10.1016/j.icarus.2007.08.014
Strobel, DF (2009) Titan's hydrodynamically escaping atmosphere: escape rates and the structure of the exobase region, Icarus 202:632–641, doi:10.1016/j.icarus.2009.03.007
Strobel DF, Shemansky DE (1982) EUV Emission from Titan’s upper atmosphere: Voyager 1 encounter. J Geophys Res 87:1361
Strobel DF, Sicardy B (1997) Gravity wave and wind shear models. In: Lebreton JP (ed) HUYGENS Science, Payload and Mission, ESA SP, vol 1177, pp 299–311
Strobel DF, Hall DT, Zhu X, Summers ME (1993) Upper limit on Titan’s atmospheric argon abundance. Icarus 103:333–336
Teanby NA et al (2006) Latitudinal variations of HCN, HC 3 N and C
2 N
2 in
Titan’s stratosphere derived from Cassini CIRS data. Icarus 181:243–255 Teanby NA et al (2007) Vertical profi les of HCN, HC
3 N and C
2 H
2 in Titan’s
atmosphere derived from Cassini/CIRS data. Icarus 186:364–384 Teanby NA, et al. (2008) Titan’s polar vortex structure revealed by chemi-
cal tracers. J Geophys Res, 113:E12003, doi:10.1029/2008JE003218 Teanby NA et al. (2009) Titan’s stratospheric C
2 N
2, , C
3 H
4 , and C
4 H
2,
abundance from Cassini/CIRS far-infrared spectra. Icarus, 202, 620–631, doi:10.1016/j.icarus.2009.03.022
Teanby NA, Irwin PGJ, de Kok R, Nixon CA (2009) Dynamical impli-cations of seasonal and spatial variations in Titan’s stratospheric composition. Phil Trans Royal Soc A 367:697–711, doi10.1098/rsta.2008.0164

25710 Atmospheric Structure and Composition
Tomasko M, Bézard B, Doose L, Engel S, Karkoschka E, Vinatier S (2008) Heat balance in Titan’s atmosphere. Planet Space Sci 56:648–659. doi:10.1016/j.pss.2007.10.012
Toublanc D, Parisot JP, Brillet J, Gautier D, Raulin F, McKay CP (1995) Photochemical modeling of Titan’s atmosphere. Icarus, 113:2–26. doi:10.1006/icar.1995.1002
Trafton LM (1972) On the possible detection of H 2 in Titan’s atmo-
sphere. Astrophys J 175:285–293 Vervack RJ Jr, Sandel BR, Strobel DF (2004) New perspectives on
Titan’s upper atmosphere from a reanalysis of the Voyager 1 UVS solar occultations. Icarus 170:91–112
Vinatier S (2007) Analyse des spectres infrarouges thermiques émis par l’atmosphère de Titan enregistrés par l’instrument Cassini/CIRS. Ph.D. Thesis. University of Denis Diderot, Paris VII
Vinatier S et al (2007a) Vertical abundance profi les of hydrocarbons in Titan’s atmosphere at 15°S and 80°N retrieved from Cassini/CIRS spectra. Icarus 188:120–138
Vinatier S, Bézard B, Nixon CA (2007b) The Titan 14N/15N and 12C/13C isotopic ratios in HCN from Cassini/CIRS, Icarus, 191:712–721. doi:10.1016/j.icarus.2007.06.001
Vuitton V, Yelle RV, Anicich VG (2006) The nitrogen chemistry of Titan’s upper atmosphere revealed. Astrophys J 647:L175–L178
Vuitton V, Yelle RV, McEwanMJ (2007) Ion-chemistry and N-containing molecules in Titan’s upper atmosphere. Icarus 191:722–742. doi:10.1016/j.icarus.2007.06.023
Vuitton V, Yelle RV, Cui J (2008) Formation and distribution of benzene on Titan. J Geophys Res, 113:E05007. doi:10.1029/2007JE002997
Waite Jr JW et al. (2005) Ion neutral mass spectrometer results from the fi rst fl yby of Titan. Science, 308:982–986
Waite JH, Young DT, Cravens TE, Coates AJ, Crary FJ, Magee B, Westlake J (2007) The process of tholin formation in Titan’s upper atmosphere. Science 316:870–875. doi10.1126/science.1139727
Wilson EH, Atreya SK (2004) Current state of modeling the photo-chemistry of Titan’s mutually dependent atmosphere and iono-sphere. J Geophys Res 109:E06002. doi:10.1029/2003JE002181
Wong A-S, Morgan CG, Yung YL, Owen T (2002) Evolution of CO on Titan. Icarus 155:382–392. doi:10.1006/icar.2001.6720
Yelle RV (1991) Non-LTE models of Titan’s upper atmosphere. Astrophys. J. 383:380–400
Yelle RV, Strobel DF, Lellouch E, Gautier D (1997) Engineering mod-els for Titan’s atmosphere. In: Lebreton JP (ed) HUYGENS Science, Payload and Mission, ESA SP, vol 1177, pp 243–256
Yelle RV, Cui J, Müller-Wodarg ICF (2008) Methane escape from Titan’s atmosphere. J Geophys Res 113:E10003. doi:10.1029/2007JE003031
Yung YL, Allen M, Pinto JP (1984) Photochemistry of the atmosphere of Titan – comparison between model and observations. Astrophys J 55:465–506. doi:10.1086/190963