chapter 10 overview - tu delft ocw
TRANSCRIPT

Chapter 10 ! overviewIn this chapter the basics of project monitoring and control are explained, including somestraightforward examples to illustrate the most common methods being applied on projects.It becomes clear that adequate project controls are a critical part of project success and thatthe project controls team has an important role to play. Adequate control means applying theright level of control for each scope element and associated risks during the subsequent projectphases.Being the conscience of the project manager, the project controls team needs to provide reliableinformation for timely decision making. This requires input from many different disciplines andexternal parties that needs to be analysed, integrated and reported. To perform this essential task,the project controls team needs to proactively engage with the project team and various exter-nal stakeholders, while realising that they all have their own interest in measuring and reportingproject performance.This chapter starts by explaining how to establish the right cost and schedule baseline, followedby controlling the project as it develops. Next progress reporting, the role of the project controlsteam and the importance of effective communication is being described.
Chapter 10 ! outline10.1 Introduction10.2 Cost estimating10.3 Planning and scheduling10.4 Cost and Schedule control10.5 Progress reporting10.6 Project controls team10.7 Fit-for-purpose project controls
176
Management of engineering Projects
925836-02_194_17-Feb-15_08:43:37_walter

10.1 ! IntroductionMost project managers will at least feel somewhat uncomfortable when they are asked if they arefully in control of their project. Being risk-averse by nature, a project manager will immediatelythink about matters that could go wrong, wondering whether she might have missed an uniden-tified risk and of course think about the weak spots already known.According to the online Oxford dictionary control can be defined as ‘the power to influence ordirect people’s behaviour or the course of events’. This is the essence of controlling a project,being able to influence the course of a project by knowing where to go, knowing how to getthere and knowing which steps should be taken in case the project derails.
If a project is not in control, a variety of things can go wrong. Below some statements are listedthat will sound familiar to most project managers:• The agreed schedule to deliver the project was unrealistic from the start.• The stream of scope changes during construction never seemed to stop.• We have significantly underspent budget.• It took months before producing at design capacity.• The operational cost turned out to be much higher than predicted.
Realising that projects should add value to a business, the above samples illustrate that thereare many ways to erode that value. This can be caused by poor definition of the initial premises,for example committing to an unrealistic budget or schedule. But it can also be caused by poorscope definition, lack of planning, or poor cost control. In the worst case a project gets out ofcontrol and the initial business value has vanished by the time the project is delivered.As a project develops from initial business opportunity to design and engineering, constructionand handover to the end-user, project controls mature accordingly. As the level of project defini-tion grows over time project controls will be performed on a more detailed level.
The next paragraphs describe the key elements to control project planning and execution. Theyalso discuss the impact that human behaviour can have on project controls, both from within theproject controls team as from stakeholders outside the team.
Chapter 10
Project monitoringand controlby Maurits Gerver
177
Timeand money
OutlookPeopleat work
Settingthe scene
PreparationIntroductionManagement of engineering Projects
925836-02_195_17-Feb-15_08:43:37_walter

10.2 ! Cost estimating
10.2.1 IntroductionOne of the most important elements to control during the lifetime of a project is cost, startingwith providing the right cost estimates.
The cost estimate covering the initial capital investment, also called Capital Expenditure (CAPEX),is usually generated at the very beginning of a project, or even before project initiation, and issubsequently updated and detailed during project development. The estimate covering the oper-ational cost, also known as Operational Expenditure (OPEX) or Revenue Expenditure, includesall cost incurred during normal operations once the project has been delivered. OPEX typicallyincludes the cost of operations, maintenance cost, consumables and cost of sales. Although thischapter will primarily focus on estimating and controlling the capital investment, the operationalcost is also an important input to the project economics and can be used to make trade-offsduring design and procurement on the basis of lifecycle cost, also referred to as Total Cost ofOwnership.
The Wind FarmAs Allwind will be responsible for the turnkey realisation and the 20 years’ maintenance ofthe offshore wind farm, they should look into optimising the lifecycle cost. Trade-offs canbe made between the initial capital investment (CAPEX) and maintenance cost (OPEX).While making these trade-offs there could be a potential difference of interest betweenAllwind and the owner’s organisation. Allwind could aim at optimising their combinedprofit from the turnkey realisation contract and the maintenance contract, while theowner would like to minimise the lifecycle cost and optimise the availability of the windfarm.For example if Allwind uses cheaper components they will reduce their CAPEX costunder the turnkey realisation contract, while the maintenance cost will likely go up.The owner could consider including specific performance targets in the maintenancecontract, to incentivise Allwind for optimising the availability of the wind farm, whileminimising maintenance cost. For example targets on wind farm availability, yearlymaintenance cost or response time in case of an unplanned outage.
The quality of a capital cost estimate is critical, as it impacts the economics of a project and candetermine the investment decision. Since funds and resources are constrained, a company canonly invest in a limited number of projects, depending on their business cases. Poor cost esti-mates can either result in cancellation of economically sound projects, or in wasting money andresources on non-profitable projects.
In this paragraph the different classes of estimates and their specific purposes are explained,followed by describing a cost-estimate structure and the commonly applied estimatingmethodologies.
178
Management of engineering Projects
925836-02_196_17-Feb-15_08:43:37_walter

10.2.2 Types of cost estimatesThere are many different names and classifications of cost estimates, depending on their purposeand required level of detail and accuracy. The estimate type or class is often related to a typicalset of deliverables in a project development phase like design and engineering documentation,a project execution plan and schedule. The level of estimate accuracy depends on the level ofproject definition and is an indication of the degree to which the final cost outcome for a givenproject will vary from the estimated cost. Besides the level of project definition, the estimateaccuracy also depends on a variety of factors like for example applying new technology, projectcomplexity and quality of reference cost data.
Although there are many different cost estimate classifications used in the industry, the accuracyranges and required supporting project definition are comparable. However the end usage ofan estimate can vary per stakeholder. An owner’s company could use an estimate for projectsanctioning, while an EPCM contractor uses the same class of estimate to prepare a bid. Table10.1 provides an overview of estimate classes, based on the Generic Cost Estimate ClassificationMatrix as developed by AACE International (AACE, 2011).
Table 10.1: Estimate classes
Estimate classLevel of project definition
deliverables ( % ofcomplete definition)
Typical purpose ofestimate
Typical accuracy range
Class 5 0 % – 2 % Screening or feasibility > ± 30 %
Class 4 1 % – 15 %Concept study or
feasibility± 20 %
Class 3 10 % – 40 %Budget authorisation or
control± 10 %
Class 2 30 % – 75 % Control or bid/tender ± 5 %
Class 1 65 % – 100 %Check estimate or bid/
tender< ± 5 %
It is important to realise that an estimate is never a single number, but it comes with a margin ofuncertainty or accuracy. Not seldom are cost estimate numbers treated as firm numbers, whilepeople forget the underlying risks and uncertainties.
Next each estimate class and its purpose will be explained in more detail.
Class 5: Screening estimateThe purpose of a screening estimate, also called a subjective estimate (Lester, 2014), is oftento provide a ballpark figure or order of magnitude number being used for strategic business
179
Management of engineering ProjectsIntroduction Preparation
Settingthe scene
Timeand money
Peopleat work
Outlook
925836-02_197_17-Feb-15_08:43:40_walter

planning, such as ranking of future investments. It enables management to prioritise projects bycomparing, amongst other drivers, the economics of each individual project. A screening esti-mate is usually compiled even before project initiation, or during the first project developmentphase. The level of project definition and available deliverables are limited at this stage, hence thewide accuracy range. A screening estimate can be delivered relatively fast and does not requiremuch effort to deliver.
Class 4: Concept Study estimateThe purpose of a concept study estimate can be to determine project feasibility, concept evalu-ation or to provide a preliminary budget. At this stage the project premises (e.g. objectives, keyassumptions, technical premises, etc.) are frozen, concepts have been developed and the firstengineering might have been completed to determine the technical design basis. For complexprojects it is also common to assess the feasibility of multiple options, supported by multiplecost estimates to help management compare the concepts and select one. A preliminary budgetmight be required to move to the next project phase.Since a class 4 estimate is still based on limited information, it has a fairly wide accuracy rangeand it still requires limited time and effort to deliver it.
Class 3: Budget estimateThe purpose of a budget estimate can be to support budget authorisation and/or projectsanctioning. The estimate is based on typical project deliverables like front-end engineeringdocumentation, a detailed project execution plan and a minimum percentage of firm quotesfrom vendors and service companies. The estimate has a better accuracy range and can evenbecome the first control estimate against which cost performance is being monitored.
Class 2: Control estimateA control estimate, also called an analytical estimate, provides the baseline for detailed costcontrol during project implementation. It can also serve as a tender or bid estimate, used todetermine contract value. It is the most detailed estimate typically in place at the start of con-struction and requires rigorous management of change to monitor variations to the budget.
Class 1: Check or Tender estimateClass 1 estimates are generally prepared for discrete parts of the total project rather than for theentire project. The parts of the project estimated at this level of detail will typically be used bysubcontractors for bids, or by owners for check estimates (bid checks, claims, change orders,etc.). Depending on the cost changes, it can be used to update the control estimate and toestablish a new baseline for cost control. A project definition level of 100 % will normally only bereached upon project completion, at which the actual cost are known.
10.2.3 Cost estimate basis and elementsThe basis of an estimate is often described in a Basis Of Estimate document, stating the purposeof the estimate, project scope, pricing basis, allowances, assumptions, exclusions, cost risk andopportunities. It documents the communication and agreements that have been made betweenthe estimator and other project stakeholders about the cost estimate basis (AACE, 2013).
Building up the estimate requires input from the entire project team and even from outside the
180
Management of engineering Projects
925836-02_198_17-Feb-15_08:43:43_walter

project team. All disciplines are involved in defining the scope of work and the cost estima-tor needs to interface with all of them to have a good understanding of this scope of work. Inpractice it still happens too often that an estimator develops the estimate in isolation, withoutproactively interfacing with the appropriate stakeholders. This can lead to an incomplete or mis-understood basis of estimate and ultimately in surprises when the estimate is being released.
A Basis of Estimate document helps to document the collective understanding of the scope ofwork, schedule milestones, key risks and underlying assumptions that impact the cost estimate.Therefore an estimate should always be accompanied by a Basis Of Estimate document as areference.
Next it is explained how an estimate can be structured and which cost elements are typicallyincluded.
Work Breakdown Structure (WBS)A WBS defines the hierarchical decomposition of tasks and subtasks. A high-level WBS will be pro-duced at the very beginning of a project and will become more detailed as the project matures.The objective of defining a WBS is to be able to control the project by allocating resources(human, material and financial) and giving time constraints to each (sub)task (Lester, 2014). So aWBS provides the structure for cost allocation and scheduling.
Figure 10.1: Example Work Breakdown Structure
Wind TurbineGenerator
(WTG)
Environmentalimpact
Assessment
Wind TurbineGenerators
Sub sea soilpreparation Test WTG’s
WTG fondation Constructionpermits
WTGfoundations
Installfoundations Test substation
Substation Operationspermits Sub station Install WTG’s Test in-field
cabling
In-fieldcabling
In-field andexport cables
Installsubstation
Install in-fieldcabling
Install exportpower cables
Test powerexport cables
Power exportcables
Offshore servicesuppliers
WEPOffshore Wind
Farm
Design Permitting Contracting &Procurement Construction Test &
Commissioning
181
Management of engineering ProjectsIntroduction Preparation
Settingthe scene
Timeand money
Peopleat work
Outlook
925836-02_199_17-Feb-15_08:43:43_walter

In some industries a Product Breakdown Structure (PBS) instead of a WBS is being used. A PBS isbased on products and defines the hierarchy of products and sub-products, rather than tasks andsubtasks. In practice many combinations of WBSs and PBSs are used.
Once a WBS has been drawn up, a bottom-up estimate can be produced by costing the individu-al work packages at the lowest level and adding them up at the levels above. The result is a CostBreakdown Structure (CBS). Similarly cost can be allocated top-down, starting at the top level ofthe WBS. In practice both ways are being applied, also depending on the purpose of the estimateand required accuracy. In Figure 10.1 an example of a WBS is shown for the design and construc-tion of the offshore wind farm.
Next the main elements of a capital cost estimate are described, being a base estimate, allowances,contingency and escalation.
Base estimateA base estimate, also called point estimate, is built up from the activities and deliverables iden-tified in a Work Breakdown Structure (WBS). The more detailed the WBS becomes as the projectmatures, the more accurate the estimate becomes. The base estimate can be defined as an esti-mate including allowances, but excluding escalation, foreign currency exchange, contingencyand management reserves (AACE, 2014).The estimate consists of many different cost elements, depending on the scope of work and typeof project. It includes all equipment, materials and labour required to execute the scope of work,also considering the execution approach and schedule. Cost elements to be considered can besplit up in direct and indirect cost (Burke, 2003):• Direct cost. These are costs that can be directly allocated to a specific scope of work or an
activity. For example:– Equipment and material cost.– Cost of project management team.– Direct labour cost, like scaffolding, welders, fitters etc.– Direct expenses, such as 3rd party services or sub-contractor fees.
• Indirect cost or overhead cost. These are costs not directly attributable to the completion of anactivity, which are typically allocated or spread across all activities on a predetermined basis(AACE, 2014). For example:– Field in-directs during construction, such as field administration, supervision, capital tools,
start-up costs, etc.– Company overhead cost, like senior management, IT, human resource department, finance,
etc.– Training cost, depreciation, insurance, taxes…etc.
The cost elements may be estimated using different estimating techniques depending on thelevel of scope definition and the size and complexity of the project.
AllowancesAs part of the base estimate and on top of the base cost, allowances can be added to cover lackof scope detail or the ‘known unknowns’. Below are some examples that are typically included inestimates as allowances:
182
Management of engineering Projects
925836-02_200_17-Feb-15_08:43:46_walter

• Design allowances for engineered equipment• Material Take Off allowances, to cover differences between actual and calculated quantities• Material inefficiencies, cutting and waste allowance• Rework• Non-productive construction time (poor productivity)• Weather conditions
ContingencyContingency is added to the cost estimate to cover the uncertainty and variability associatedwith a cost estimate, and unforeseeable elements of cost within the defined project scope (AACE,2013). Contingency covers inadequacies in project scope definition, estimating methods andestimating data. The amount of contingency included in the estimate should be determined, aswell as the method used to derive the appropriate amount.Contingency is typically estimated using statistical analysis or judgment based on past asset orproject experience. Contingency usually excludes:• Major scope changes such as changes in end-product specification, capacities, building sizes,
and location.• Unforeseen major events such as earthquakes, labour strikes, etc. Management reserves (addi-
tional budget to be allocated at management’s discretion).
The amount of contingency to add to the base estimate is usually related to the required confi-dence level of an estimate. Management can for example choose for a certain confidence level tofund a project. Most cost estimates have a P50 confidence level, which means that the amount ofcontingency added to the base estimate results in a 50/50 chance to either overrun or underrunbudget.
In case a probabilistic risk analysis technique is applied to the base cost (see also Chapter 8), theprobability of achieving a certain point estimate can be determined. A Monte Carlo simulationis the most commonly applied technique to analyse the impact of risks and uncertainties onproject cost and schedule. The simulation not only calculates the probability of achieving a costestimate, but it also calculates the associated required amount of contingency. It therefore uses acost estimate without any contingency as a starting point for the simulation (AACE, 2011).
Normally only the high risks are used for the simulation. Each risk is quantified by determining itslikelihood of occurring and potential cost impact. In more traditional approaches the impact of arisk on the estimate is represented by a three-point estimate, resulting in a triangular distributionas explained in Chapter 8.
According to Figure 10.2 there is a 30 % probability to achieve the base estimate (X). By addingcontingency C1 to the base estimate, the confidence level of the estimate (Y) increases to 50 %,also called the P50 estimate. By adding even more contingency to the base estimate, for exampleC2, the confidence level increases to 80 %, also called a P80 estimate. Sometimes part of the con-tingency is allocated as a management reserve which is not freely available to the project team,but instead will be allocated by management.
183
Management of engineering ProjectsIntroduction Preparation
Settingthe scene
Timeand money
Peopleat work
Outlook
925836-02_201_17-Feb-15_08:43:49_walter

As contingency is related to uncertainties and risks, it is also possible to run down contingenciesin case specific risks do not materialise during project execution. An example: the material selec-tion for a gas treatment plant depends on the specific composition of the gas produced by newwells. This risk has been identified in the risk assessment and has been included in the overallcontingency. After drilling the new wells it turns out that the gas composition allows for cheapermaterial to be applied. In that case the remaining contingency required till project completioncan be lowered and associated budget can be freed up for other investments.
EscalationEscalation is a provision in costs or prices for uncertainchanges in technical, economic, and market conditions overtime (AACE, 2014). It is important to consider this ‘time valueof money’, since it can have an impact on purchasing powerand earning potential. The two main components of escala-tion are inflation (or deflation) and market factors. Inflationis the rate at which the general level of prices for goods andservices is rising over a certain period of time in an econ-omy. It reflects the future value of money. Market factorsreflect future market developments that, for example, caninfluence equipment and material prices.
Figure 10.3 shows the main components of a capital costestimate.
Figure 10.2: Estimate probability distribution curve
Confidence level
Base estimate +contingency C2
Base estimate +contingency C1
Base estimate +
C2C1
80%
50%
30%
0%
Cost estimate (€)X Y Z
Figure 10.3: Capital cost estimate
184
Management of engineering Projects
925836-02_202_17-Feb-15_08:43:49_walter

The capital cost estimate as presented is also referred to as the Total Installed Cost, or TotalCapital Investment. The capital estimate is an important input for the project economics asexplained in Chapter 11.
Now that the estimate classes, structure and main elements have been defined, the most com-mon cost estimating methodologies are described.
10.2.4 Cost estimating methodologiesSelecting the appropriate cost estimating methodology starts by determining the required levelof accuracy of the estimate. This depends on the purpose of the estimate in a specific projectphase and the available level of project definition. In this paragraph four common cost estimatingmethodologies are described. Depending on the available project definition these methodolo-gies include a stochastic or deterministic approach (AACE, 2011).
Stochastic methods are often applied during the early project development phases, making useof estimating factors, metrics and models. For example, multiplying a (statistical) factor withequipment cost to calculate the total installed cost of a specific piece of equipment. It can beused for class 3 to 5 estimates, ranging from screening to budget estimates.
Deterministic methods are usually applied at a later stage when more scope detail is available(control or tender estimates). In practice it is possible to end up with a mix of these estimatingmethodologies in the same estimate, depending on the level of detail available for specific partsof the scope.
Four common estimating methodologies are briefly explained (Lester, 2014) (Burke, 2003).
SubjectiveThis methodology, sometimes called ‘guestimating’, is applied to provide a ‘ballpark figure’ at theearly stages of a project. As there is no detailed information available yet, the accuracy of theestimate strongly depends on the estimator’s experience of similar projects.
As an example the Lang Factor can be applied, being the ratio of the total cost of installation, orTotal Installed Cost, to the cost of its major technical components. This factor is widely used inthe process industry to help estimate the cost of new facilities. A typical Lang Factor for a newchemical unit would be in the range of 3.0 to 5.0. This means that the sum of all major equipmentmultiplied by a factor 3.0 to 5.0 gives a rough estimate of the total installed cost of the plant,including equipment, materials, construction and engineering.
AnalogousThe analogous method, or comparative method, is using similar past projects to estimate the costof a new project. It is applied when there is not sufficient data available to generate a detailedestimate yet, but sufficient technical definition to make adjustments of estimates made for sim-ilar projects. It is preferred to use quantifiable changes and apply factors to make the estimateadjustments, for example using scaling factors.
185
Management of engineering ProjectsIntroduction Preparation
Settingthe scene
Timeand money
Peopleat work
Outlook
925836-02_203_17-Feb-15_08:43:49_walter

The Wind FarmIn the early phases of the wind farm project, an analogous or comparative cost estimatecould be made, based on similar offshore wind farms that have been built around theworld. Even local data could be obtained from the existing wind farm located next to theselected location of the project.Although the technical complexity of wind farms seems to be relatively low, compared tofor example chemical plants, there can be many differences between wind farm projects.To provide a proper analogous estimate, the following technical and execution aspects,amongst others, could be analyzed to make justifiable changes to estimates of similarprojects:• Seabed conditions and water depth (could lead to different soil preparation and subsea
foundation)• Weather conditions (impact of wind profile and sea state on design and construction
time)• Distance to nearest port• WTG size and technical novelty• Distance to onshore power grid• Power cable routing (buried, drilling, crossing pipelines/cables, sensitive areas…etc)• Local opposition against the project (could impact permitting duration)
ParametricParametric estimating, also called factoring or component ratio method, is a technique that developscost estimates based upon the examination and validation of the relationships between a project’stechnical, programmatic, and cost characteristics as well as the resources consumed during its devel-opment, manufacture, maintenance, and/or modification (ISPA, 2008). These relationships are knownas the Cost Estimating Relationships (CERs). Parametric models range from simple to very complex,depending on the number of CERs and the complexity of the algorithms used.CERs can be based upon many different parameters like functional design parameters, quantitiesof equipment, hardware sizes and weight or operational environment, for example onshore ver-sus offshore.
AnalyticalThe analytical method, also referred to as the detailed or engineering build-up method, is typi-cally applied to generate the control estimate or a ‘bid’ estimate required by a contractor beforesubmitting a bid. It is the most accurate, deterministic estimating method, and it requires theproject to be broken down to the lowest WBS level. For each individual component the materialand labour cost are then estimated and the sum of all pieces, including overhead, becomes theproject estimate. The analytical method can be time-consuming and requires close cooperationbetween the cost estimator and the engineers who have developed all the details including thepart lists, bill of material etc.
186
Management of engineering Projects
925836-02_204_17-Feb-15_08:43:52_walter

Figure 10.4 illustrates the development of the cost estimate accuracy and estimating method as theproject matures from Front-End-Loading (FEL) to Execution. It also shows that the Subjective andAnalogous methodologies are typically applied in the early project phases, while the Parametricand Analytical methodologies are used when there is a better project definition.
Human aspectIt is critical for an estimator to understand that estimating is not an activity to be performed insplendid isolation. Understanding the project scope and assuring all project team members pro-vide the right input, requires a very proactive and open approach. There needs to be a two-waycommunication enabling the estimator to have a full understanding of the basis of estimate,while the other project team members develop an understanding of the impact that their specificscope or execution method has on the cost estimate. It should be an ongoing dialogue, start-ing early in the project development phase to avoid misalignment amongst stakeholders andunpleasant surprises when releasing the estimate. The discussed and agreed scope and execu-tion assumptions need to be written down in a Basis of Estimate document.It is also important to realise that stakeholders have different interests in the project and poten-tially will try to influence the cost estimate or the way it is presented. For example, a businessmanager is interested in submitting a competitive bid, aiming at winning a tender, so she willpush for a lower estimate. A project manager wants to deliver his/her project within budget, soshe will push for at least a realistic estimate, but perhaps even some additional pocket money.Similar pressure can be experienced when classifying specific cost. Some would like to classifytraining cost for operations as OPEX, while others would classify it as CAPEX. There are alsoexamples of estimates being decreased to an acceptable level by management to obtain projectsanctioning, resulting in a high chance of overrunning the approved budget.
Figure 10.4: Estimate accuracy development
From stochastic to deterministic
Increasing estimate accuracy
Subjective Analogous Parametric Analytical
Front End Loading (FEL) Execution
187
Management of engineering ProjectsIntroduction Preparation
Settingthe scene
Timeand money
Peopleat work
Outlook
925836-02_205_17-Feb-15_08:43:52_walter

10.3 ! Planning and scheduling
10.3.1 IntroductionAs already explained in Chapter 1, a project lifecycle exists of a number of distinct phases. Ineach project phase many activities are taking place and many deliverables are produced. Tocontrol the planning and execution of a project, all scope and activities need to be broken downinto manageable activities, linked to a WBS as explained in the previous paragraph. The WBSforms the basis for compiling a schedule and brings scope, cost and schedule together. The WBSwork packages can be broken down into lists of activities and events that form the basis for theproject schedule. For each activity and event the predecessors, successors and the duration aredefined and these interdependencies can be graphically displayed in a network planning. Nextthe network planning can be analysed to optimise the work sequence and project duration. Notall activities need to be scheduled at the same level of detail. It depends on the specific risk of anactivity or work package and the level of control required.There are many books written on how to create a network planning, explaining the differenttechniques in detail. The following part is only meant to give a high-level overview of the mostcommon techniques, followed by an introduction into Gantt charts as a commonly appliedmethod for schedule representation.
10.3.2 Network PlanningA network planning shows the logical sequence of project activities and the transfer points fromone activity to another. There are two basic formats to draw a network:• Activity-On-Arrow (AOA): activities are displayed as arrows and nodes represent the event or
transition between the activities. Nowadays AOA is often referred to as Arrow DiagrammingMethod (ADM).
• Activity-On-Node (AON): activities are presented as nodes (rectangles or circles) and arrowsare representing their relationships.
Figure 10.6: Activity-On-Node example
Figure 10.5: Activity-On-Arrow example
Activity 1 Activity 4
Activity 3
Activity 2
Activity Activity
Activity Activity
188
Management of engineering Projects
925836-02_206_17-Feb-15_08:43:55_walter
In general the AON format seems to be favoured over the AOA format, as it has some graphicaladvantages which make it easier to analyse and optimise the network.There are two well-known network planning techniques, commonly used in projects:• Program Evaluation and Review Technique (PERT)• Critical Path Method (CPM)Both techniques will be briefly explained.
Program Evaluation and Review Technique (PERT)The PERT method was developed in the 1950s for the United States Navy. It was designed to ana-lyse and represent the tasks involved in completing a project, using the AOA representation ofactivities and relationships. It is a probabilistic methodology aiming at determining the minimumtime needed to complete the entire project.The PERT method is usually applied on large-scale, non-routine projects, in conjunction with theCritical Path Method (CPM). PERT differs from the CPM, because it uses a probabilistic approachinstead of adding up durations of critical activities to establish the critical path.In the original PERT approach an estimate of the pessimistic (P), optimistic (O) and ‘most likely’(M) duration is made for each activity. The expected duration of each activity is then calculated asa weighted average of these three durations (O + 4M + P)/6. The most likely duration is weightedfour times as much as the other two values.
Critical Path Method (CPM)CPM was developed around the same period as PERT and is commonly used in all kinds ofprojects to determine the critical path of a project and to assess float or slack in non-criticalactivities. It uses the AON representation of activities and relationships. The critical path consistsof continuous successive activities that determine the minimum overall project duration. Float isthe amount of time an activity may slip upon commencement and completion before becomingcritical. By definition there is no float on a critical path, so any delay in the critical activities willdirectly impact the overall project duration accordingly. On complex projects there are oftenmultiple (almost) critical paths running in parallel.Nowadays the Precedence Diagram Method (PDM) is often applied to analyse the critical path,using the AON format to display the network planning. The PDM will be explained in more detail,using a simplified example of the wind farm case.
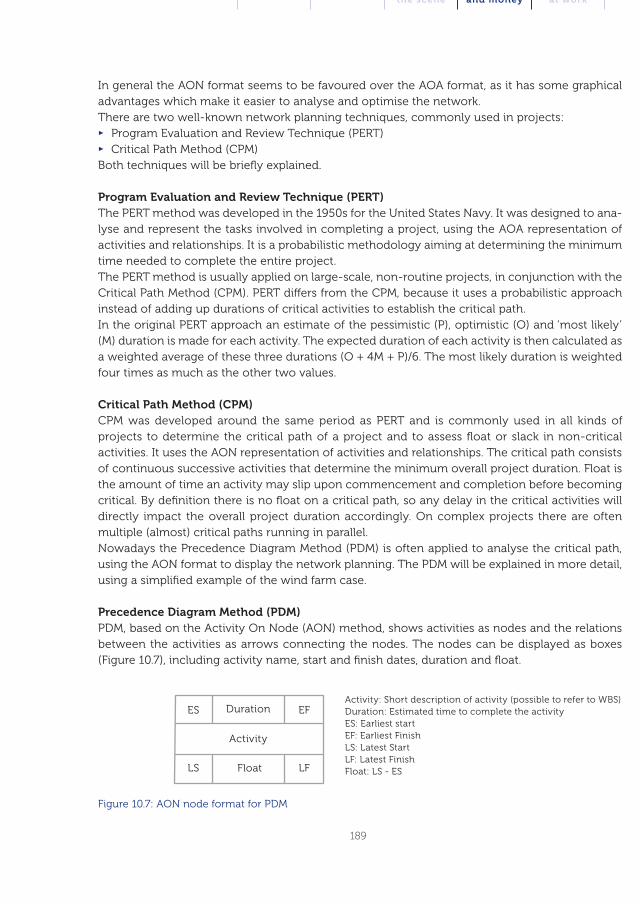
Precedence Diagram Method (PDM)PDM, based on the Activity On Node (AON) method, shows activities as nodes and the relationsbetween the activities as arrows connecting the nodes. The nodes can be displayed as boxes(Figure 10.7), including activity name, start and finish dates, duration and float.
Figure 10.7: AON node format for PDM
Activity: Short description of activity (possible to refer to WBS)Duration: Estimated time to complete the activityES: Earliest startEF: Earliest FinishLS: Latest StartLF: Latest FinishFloat: LS - ES
Duration
Activity
FloatLS LF
ES EF
189
Management of engineering ProjectsIntroduction Preparation
Settingthe scene
Timeand money
Peopleat work
Outlook
925836-02_207_17-Feb-15_08:43:55_walter

In projects it is common to have many complex relationships between the activities. There canbe specific start and finish restrictions like:• Finish to Start: this is the most straightforward restriction, dictating that an activity cannot start
before its predecessor has been completed.• Start to Start: an activity cannot start before its predecessor has started.• Finish to Finish: an activity cannot be completed until its predecessor has been completed first.• Start to Finish: an activity can only finish after the predecessor activity has started. So the pre-
decessor must start first and then the successor can finish. This restriction does not appearvery often, since there are usually easier ways to describe the relationship.
Usually there are also lead and lag times between activities. A start-to-start lag for example,determines the minimum amount of time that must pass between the start of an activity and thestart of its successor.Next PDM will be explained looking at a simplified example for the wind farm case.
The Wind FarmIn the table below some key activities of the wind farm project are listed, including theirduration and predecessors. As explained in the table, there are some execution restrictionsdue to the limited availability of vessels. WTG testing can be performed in parallel with theWTG installation, starting 3 months after the start of WTG installation (a Start-Start relation,with a lag of 3 months).
Table 10.2: Network activities ‘Wind Farm’
No. Activity Duration (months) Predecessors Comments
1 Soil investigation 3
2 Wind study 3
3 Design foundation 3 1
4 Fabricate foundations 9 3
All foundations willbe fabricated anddelivered as onebatch before start ofinstallation
5 Soil preparation 12 3
6 Install foundations 9 4, 5
Can only start aftercompleting the soilpreparation, due tovessel availability
7 Design WTG 6 2WTG: Wind TurbineGenerator
190
Management of engineering Projects
925836-02_208_17-Feb-15_08:43:58_walter

8Fabricate and TestWTG’s
15 7
9 Install WTG’s 9 6, 8
Can only startafter installing allfoundations, due tovessel availability
10 Test WTG’s 7 9
Testing can start 3months after startingthe WTG installation(Start-Start, lag +3months)
The following network can be drawn using the AON format and connecting all activitiesto their predecessors.
Figure 10.8: AON ‘Wind Farm’ network
A forward pass analysis will determine the early start and early finish of each activity. Firstdetermine the ES and EF for activities at the beginning of the network (Soil investigationand Wind study), next determine the ES and EF of the other activities following thenetwork relations from left to right.To determine the latest start and latest finish of each activity, a backward pass analysishas to be performed. The backward pass starts with determining the LS and LF of the lastactivity (Test WTG’s) on the right, to then determine the LS and LF of all predecessorsfollowing the network relations from right to left.From the analysis it becomes clear which chain of activities determines the overallduration, being the critical path (dark blue activities and blue arrows). In this case it takes37 months to design and construct the Wind Farm.For all activities the float can be calculated, being the difference between LS and ES.For example ‘Fabricate foundations’ has a float of 3 months. So the fabrication could bedelayed by 3 months and still finish on time to start the installation of the WTG’s.
Install foundationsDesign foundations
Design WTG
Soil investigation
Wind study
Start
Soil preparation
Fabricatefoundations
Test WTG’s End
Fabricate and test WTG’s
Install WTG’s
373027
183
18
0
0
0
6
6
9
000
03
0
0
3
0
12
9
15
373736
276
27
3
3
0
18
15
24
373736
276
27
3
6
0
18
18
27
000
00
0
0
3
0
0
3
3
373027
183
18
0
3
0
6
9
12
lag + 3 months
191
Management of engineering ProjectsIntroduction Preparation
Settingthe scene
Timeand money
Peopleat work
Outlook
925836-02_209_17-Feb-15_08:44:01_walter
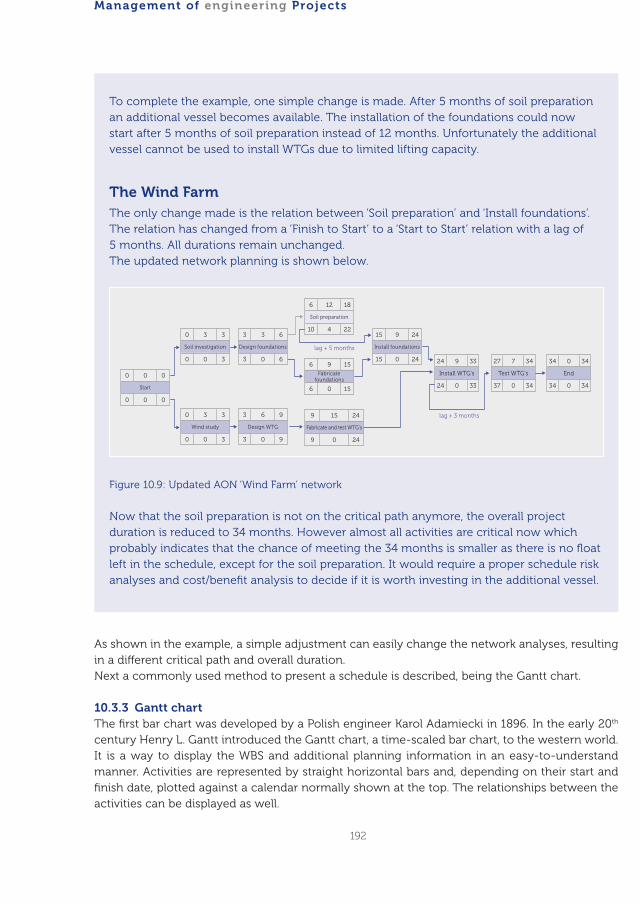
To complete the example, one simple change is made. After 5 months of soil preparationan additional vessel becomes available. The installation of the foundations could nowstart after 5 months of soil preparation instead of 12 months. Unfortunately the additionalvessel cannot be used to install WTGs due to limited lifting capacity.
The Wind FarmThe only change made is the relation between ‘Soil preparation’ and ‘Install foundations’.The relation has changed from a ‘Finish to Start’ to a ‘Start to Start’ relation with a lag of5 months. All durations remain unchanged.The updated network planning is shown below.
Figure 10.9: Updated AON ‘Wind Farm’ network
Now that the soil preparation is not on the critical path anymore, the overall projectduration is reduced to 34 months. However almost all activities are critical now whichprobably indicates that the chance of meeting the 34 months is smaller as there is no floatleft in the schedule, except for the soil preparation. It would require a proper schedule riskanalyses and cost/benefit analysis to decide if it is worth investing in the additional vessel.
As shown in the example, a simple adjustment can easily change the network analyses, resultingin a different critical path and overall duration.Next a commonly used method to present a schedule is described, being the Gantt chart.
10.3.3 Gantt chartThe first bar chart was developed by a Polish engineer Karol Adamiecki in 1896. In the early 20th
century Henry L. Gantt introduced the Gantt chart, a time-scaled bar chart, to the western world.It is a way to display the WBS and additional planning information in an easy-to-understandmanner. Activities are represented by straight horizontal bars and, depending on their start andfinish date, plotted against a calendar normally shown at the top. The relationships between theactivities can be displayed as well.
Install foundationsDesign foundations
Design WTG
Soil investigation
Wind study
Start
Soil preparation
Fabricatefoundations
Test WTG’s End
Fabricate and test WTG’s
Install WTG’s
342724
153
3
0
0
0
6
6
9
079
93
6
3
3
0
12
9
15
343433
246
9
3
3
0
18
15
24
343433
246
9
3
3
0
22
15
24
000
00
0
0
0
0
4
0
0
343724
153
3
0
0
0
10
6
9
lag + 3 months
lag + 5 months
192
Management of engineering Projects
925836-02_210_17-Feb-15_08:44:01_walter

It is also possible to show progress per activity for example by colouring the baseline or drawinga progress bar underneath the activity bar. By combining all this information in an easy-to-readchart, management can have a good impression of the project at a glance.
Gantt charts can also be used to allocate resources to the activities. They can then be used toanalyse and optimise resources and create a fully resource loaded schedule, showing all requireddisciplines and contractors over time. A common way to display resources over time is a histo-gram. In Figure 10.10 a Gantt chart example for the wind farm case is shown.
The figure represents all activities and their relationships by bars against a timeline on the top.The actual progress is shown as progress bars inside the activity bars and the critical path showsup in dark blue.Nowadays most Gantt charts are generated automatically by planning or scheduling softwarelike Microsoft Project or Primavera.
10.3.4 Probabilistic SchedulingSimilar to probabilistic cost estimating, probability distributions can be linked to the duration ofscheduled activities, depending on the uncertainty of these durations.Nowadays it is also possible to combine the probabilistic cost and schedule analysis in the sameMonte Carlo simulation (see Chapter 8). It provides insight in the likelihood of meeting both pro-ject cost and schedule, by analysing the cost and schedule impact of the identified risks.
The analysis requires a detailed, resource loaded schedule, including all work to be completedand unbiased, most likely durations. The purpose of resource loading the schedule is to allocatethe entire ‘contingency-free’ budget to the scheduled activities. Experience shows that schedulesof 300 to 1000 activities can be used in the risk analysis. The number of risks is typically around20 to 40.
Figure 10.10: Gantt chart example Wind Farm
ID Task Name Duration PredecessorsQtr 1 2015 Qtr 1 2016 Qtr 1 2017 Qtr 1 2018
jan may sep jan may sep jan may sep jan may sep jan may
1 Wind Farm 740 days
2 Soil investigations 3 mons
3 Wind study 3 mons
4 Design foundation 3 mons 2
5 Fabricate foundations 9 mons 4
6 Soil preparation 12 mons 4
7 Install foundations 9 mons 5; 6
8 Design WTG 6 mons 3
9 Fabricate and test WTG’s 5 mons 8
10 Install WTG’s 9 mons 7; 9
11 Test WTG’s 7 mons 10SS+3 mons
193
Management of engineering ProjectsIntroduction Preparation
Settingthe scene
Timeand money
Peopleat work
Outlook
925836-02_211_17-Feb-15_08:44:01_walter
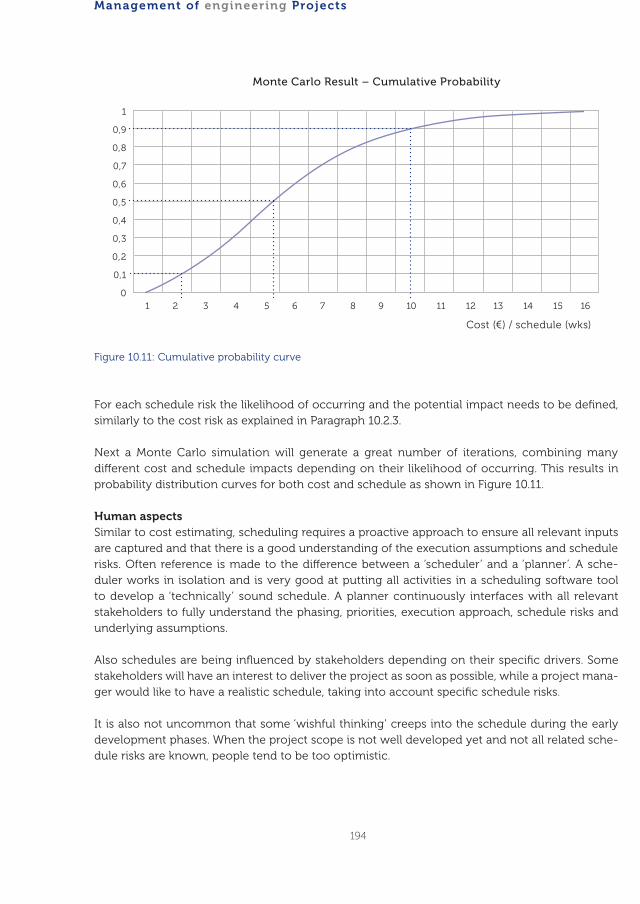
For each schedule risk the likelihood of occurring and the potential impact needs to be defined,similarly to the cost risk as explained in Paragraph 10.2.3.
Next a Monte Carlo simulation will generate a great number of iterations, combining manydifferent cost and schedule impacts depending on their likelihood of occurring. This results inprobability distribution curves for both cost and schedule as shown in Figure 10.11.
Human aspectsSimilar to cost estimating, scheduling requires a proactive approach to ensure all relevant inputsare captured and that there is a good understanding of the execution assumptions and schedulerisks. Often reference is made to the difference between a ‘scheduler’ and a ‘planner’. A sche-duler works in isolation and is very good at putting all activities in a scheduling software toolto develop a ‘technically’ sound schedule. A planner continuously interfaces with all relevantstakeholders to fully understand the phasing, priorities, execution approach, schedule risks andunderlying assumptions.
Also schedules are being influenced by stakeholders depending on their specific drivers. Somestakeholders will have an interest to deliver the project as soon as possible, while a project mana-ger would like to have a realistic schedule, taking into account specific schedule risks.
It is also not uncommon that some ‘wishful thinking’ creeps into the schedule during the earlydevelopment phases. When the project scope is not well developed yet and not all related sche-dule risks are known, people tend to be too optimistic.
Figure 10.11: Cumulative probability curve
1 2 3 4 5 6 7 8 9 10 11 12 13 14 15 16
1
0,9
0,8
0,7
0,6
0,5
0,4
0,3
0,2
0,1
0
Cost (€) / schedule (wks)
Monte Carlo Result – Cumulative Probability
194
Management of engineering Projects
925836-02_212_17-Feb-15_08:44:04_walter

10.4 ! Cost and schedule control
10.4.1 IntroductionA project needs to have appropriate controls in place to make sure it is completed against theagreed targets. Besides safety performance, risk management, quality and stakeholder satis-faction, these have been described in other chapters, the key aspects to control are cost andschedule.Project control includes the following primary steps:• Perform project planning, including establishing project cost and schedule baselines• Measure project performance• Compare measurements against the project plan and baselines• Take corrective actions as may be determined through forecasting and further planning.
In essence it comes down to applying the well-known Deming circle; Plan, Do, Check, Act(PDCA-circle).
10.4.2 Project Controls PlanIt is common to write a ‘project controls plan’ in which the above steps are described in moredetail. Depending on the size and complexity of a project, the project controls plan can also beincluded in the overall project execution plan. A project controls plan typically includes:• Project controls organisation (organisation chart, roles and responsibilities)• Project planning, key milestones• Project scope and execution strategy• Schedule development and resource planning• Cost estimating and budgeting• Risk management• Cost control• Progress and performance measurement• Forecasting• Change management• Project reporting
Sometimes additional topics, like document control or auditing, can be included, depending onthe tasks assigned to the project controls team.It is also important to realise that there are possibly multiple contractors involved in the exe-cution of the project, all performing their own project controls and reporting. Therefore largecomplex projects require an integrated project controls plan that clearly describes the interfaceswith all contractors involved.Another important aspect of project control is ‘management of change’. A project requires a for-mal process to identify, assess and approve changes to the approved project plan and to capturethe impact on schedule and cost.Next the basis of schedule control, cost control and management of change will be explained.
10.4.3 Schedule controlThe first step is to establish a baseline schedule. This is normally the schedule that, together withthe project plan and baseline cost estimate, is authorised at project sanctioning. Although it is
195
Management of engineering ProjectsIntroduction Preparation
Settingthe scene
Timeand money
Peopleat work
Outlook
925836-02_213_17-Feb-15_08:44:04_walter

very well possible that more detailed execution schedules will be developed after sanctioning,schedule performance will be measured against the approved milestones.
The schedule is based on the WBS and progress will be monitored for the individual WBS ele-ments. The level of schedule detail for each element and the WBS level at which progress ismeasured, depends on the complexity of the scope and schedule risks. For example applyinga new technology which is on the critical path of your project requires more rigorous progressmonitoring than a routine task with significant float.
To measure progress it is important to be able to measure real progress, or physical progress.Physical progress is the percentage of work scope completed at a certain date. It is determinedby using predefined, objectively measurable achievements, like the number of completed engi-neering documents, or meters of pipeline installed. To determine the overall project progress,weighting can be applied to different WBS elements to reflect their relative contribution to thephysical progress.
In a complex project there may be many parties involved in providing progress data. Contractorsinvolved will normally monitor and report progress for their specific scope of work. The projectplanner must check and integrate all progress data to determine the overall project progress. Theamount of involvement of the owner’s planner also depends on the type of contracts. A lumpsum turnkey contract requires less involvement from the owner than managing a reimbursablecontract.
During project execution it can be decided to re-baseline the schedule if the original baselineschedule has become obsolete due to changes. If there are major changes of the project scope,or the actual progress deviates significantly from the original baseline schedule, it can be decidedto establish a new baseline to measure progress. A need to re-baseline often results from poorproject definition and/or poor project control. Reassessment of the project control process goingforward is typically an element of re-baselining (AACE, 2014).
Besides monitoring progress and measuring schedule performance against the baseline, it is alsocommon practice to forecast the remaining project duration.
10.4.4 Cost controlAACE International defines cost control as ’the application of procedures to monitor expendi-tures and performance against progress of projects or manufacturing operations; to measurevariance from authorised budgets and allow effective action to be taken to achieve minimumcosts’ (AACE, 2014).During the early project development phases, prior to formal project sanctioning, cost controlbasically comes down to managing all cost related to studies, design and engineering, ownersteam and other third party services. As soon as a final investment decision has been taken andthere is an authorised budget to deliver the project, cost control becomes more advanced.
The first step is to establish a baseline estimate, usually being the authorised budget at projectsanctioning. The cost performance will be measured against the initially authorised budget andany budget changes that were approved during project execution.
196
Management of engineering Projects
925836-02_214_17-Feb-15_08:44:07_walter

The level of detail at which cost control needs to be performed, depends on the specific scope ofwork and associated risk. Since the cost estimate is broken down according to the WBS elements,it can be decided for each element how to perform cost control and which supporting data tocollect. For example a low risk WBS element being executed under a lump sum contract (seeChapter 9 for further explanation about contract types) requires less stringent cost control thanhigh risk scope being executed on a reimbursable basis.
Since the same WBS activities and deliverables as included in the cost estimate are also in theschedule, the cost (CAPEX) phasing over time can be determined. The cost phasing can be visual-ised in a typical S-curve, also often used for cost control and reporting.
Figure 10.12: Cost S-curve
Besides an S-curve presenting cumulative cost over time, many different S-curves are usedfor project control and reporting. For example showing actual man hours, earned man hours,installed quantities or resources over time.Next a commonly used integrated cost and schedule method will be described, the Earned ValueAnalysis.
Earned Value AnalysisEarned Value Analysis (EVA) is a quantitative method for evaluating project performance andpredicting final project results, based on comparing the progress and budget of work packagesto planned work and actual costs. The advantage of EVA is that both cost and schedule perfor-mance can be analysed using one method based on cost or monetary value.
To explain the EVA method some key terms need to be defined (Dierick & Van Biezen, 2009).
• The Earned Value (EV) of a work package, or the whole project, equals the sum of budgetedcost of the work performed to date. EV is also called the Budgeted Cost of Work Performed. SoEV is not the same as the actual cost of work performed.
Time
Cumulative cost
S-curve
197
Management of engineering ProjectsIntroduction Preparation
Settingthe scene
Timeand money
Peopleat work
Outlook
925836-02_215_17-Feb-15_08:44:07_walter

• The Planned Value (PV) equals the sum of budgeted cost of the work scheduled to date, alsocalled Budgeted Cost of Work Scheduled.
• Actual Cost (AC) is the sum of all actual cost to date, also called Actual Cost of Work Performed.• Actual Time Spent (ATS) is the total duration from start to date.• Budget At Completion (BAC) equals the sum of all budgeted cost till the end of the project.• Time At Completion (TAC) is the planned overall duration from start till end of the project.
The definitions above can be used to analyse cost and schedule performance in the followingmanner.To analyse schedule performance the Schedule Variance (SV) or Schedule Performance Index(SPI) can be determined. Both measures indicate whether the project runs ahead or behindschedule.• SV = EV – PV (positive number: ahead of schedule, negative number: behind schedule)• SPI = EV/PV (number > 1: ahead of schedule, number < 1: behind schedule)
The cost performance can be analysed looking at the Cost Variance (CV) or Cost PerformanceIndex (CPI). Both measures indicate whether the project runs over or under budget.• CV = EV – AC (positive number: under budget, negative number: over budget)• CPI = EV/AC (number > 1: under budget, number < 1: over budget)
Next the overall project duration and cost can be forecasted, taking into account the projectperformance to date.
The Estimated Time at Completion (ETAC) provides a forecast of the overall project duration,taking into account the schedule performance to date.• ETAC = TAC/SPI (a SPI > 1: forecasted duration shorter than planned, SPI < 1: forecasted dura-
tion longer than planned)From the ETAC the Estimate To Complete (ETC) can be derived, being the remaining forecastedtime to complete the project.• ETC = ETAC – Actual Time Spend (ATS)
The Estimated Cost at Completion (ECAC) gives a forecast of the total cost at completion of theproject, taking into account the cost performance to date.• ECAC = BAC/CPI (a CPI > 1: forecasted cost at completion under budget, CPI < 1: forecasted
cost at completion over budget)From the ECAC the CTC can be derived, being the remaining cost to complete the project.• CTC = ECAC – Actual Cost (AC)
The importance of using Earned Value in the performance analysis will be illustrated by a simpleexample, in which the contribution of the activities to the overall progress is weighted equally.
198
Management of engineering Projects
925836-02_216_17-Feb-15_08:44:10_walter

EVA exampleThe table below shows the planning of 5 activities over 10 months,including the budgeted cost and planned spent per month for each activity.
Table 10.3: Activity planning and cost
The cumulative cost curve is shown below.
For each activity the EV is calculated, using the actual % complete.The table below shows the % complete, EV, PV and Actual Cost.
Table 10.4: EVA calculations
Figure 10.13:
Cost curve EVA
example
Time (months) To date
Cost 1 2 3 4 5 6 7 8 9 10
Activity 1 € 5.000 5k
Activity 2 € 10.000 10k
Activity 3 € 25.000 5k 20k
Activity 4 € 75.000 5k 10k 15k 25k 15k 5k
Activity 5 € 10.000 5k 5k
% complete EV PV AC
Activity 1 € 5.000 100% € 5.000 € 5.000 € 4.000
Activity 2 € 10.000 100% € 10.000 € 10.000 € 12.000
Activity 3 € 25.000 75% € 18.750 € 25.000 € 15.000
Activity 4 € 75.000 10% € 7.500 € 15.000 € 7.500
Activity 5 € 10.000 0% € - € -
€ 125.000 € 41.250 € 55.000 € 38.500
Cum. Planned Value
Cum. Earned Value
Cum. Actual Value
€ 120,000
€ 100,000
€ 80,000
€ 60,000
€ 40,000
€ 20,000
00 2 4 6 8 10
Months
199
Management of engineering ProjectsIntroduction Preparation
Settingthe scene
Timeand money
Peopleat work
Outlook
925836-02_217_17-Feb-15_08:44:13_walter

The project schedule and cost performance can now be calculated:• SV = 41,250 – 55,000 = -13,750 (running behind schedule!)• SPI = 41,250 / 55,000 = 0.75• CV = 41,250 – 38,500 = 2,750 (budget underrun)• CPI = 41,250 / 38,500 = 1.07
So although the project is running behind schedule, the cost performance looks positive.The schedule and cost forecast can also be calculated:• ETAC = 10 / 0.75 = 13.3 months• ECAC = 125,000 / 1.07 = € 116,667
Looking at the EVA analysis management might decide to take measures to reduce the sche-dule delay. Obviously this depends on the project’s value drivers and possibilities to speed up thework. Adding more people to the job or introducing double shifts might be a solution, but willcome at a cost.
10.4.5 Management of changeFrom the early phases onwards it is critical to manage project changes adequately to avoidscope creep, schedule delays and cost increases. Normally there is an approved project baselineagainst which changes are being assessed and formally approved before implementation. Someexamples of changes are change of original business premises, additional safety or operationalrequirements, change of execution plan etc. Depending on the change there can be severaldisciplines, or even contractors, involved in assessing the impact of the change.For most projects it is common to have a formal change management process to identify,assess and approve changes to the project plan and to capture the impact on schedule and cost.Depending on the impact of a change, project management or a more senior level approves theimplementation of the change.To assess the cost impact, it is important to differentiate between changes due to already iden-tified uncertainties and unexpected scope changes. The first category is likely already includedin the contingency and therefore does not require additional budget. If the change concernsunforeseen additional scope, the budget needs to be raised.
Human aspectSimilar to the previous paragraphs on the human aspect, there are many stakeholders with differ-ent interests when it comes to controlling a project. Just a few examples to illustrate situationsthat have occurred in practice:• Management decreasing the baseline cost estimate to have a project sanctioned.• A construction contractor reporting more construction progress than is actually made to meet
a project milestone and receive an incentive fee.• A project manager forecasting the overall project cost too optimistically to positively influence
his appraisal.• An engineering contractor not making any effort to improve the engineering efficiency, aiming
to maximise the engineering man hours under a reimbursable contract.
200
Management of engineering Projects
925836-02_218_17-Feb-15_08:44:13_walter
It requires an experienced project team to recognise these different interests, and challenge thedata received for cost and schedule control.Another known issue is the fact that most people are too optimistic about project executionand resolving problems along the way. This often results in significant ‘wishful thinking’ whenforecasting project duration or the overall project cost. It takes experience to recognise thesesituations and avoid over-optimistic estimates and schedules.Management of change requires discipline from the project team and other parties involved.All parties involved need to follow the formal change management process and all relevantdisciplines need to assess the impact of the change. It happens in practice that, due to timepressure, changes do not follow the formal change process, which can lead to unsafe situationsor unpleasant schedule or cost surprises later on. A common reason not to follow the changemanagement process is simply because it is taking too long. Especially during construction thereis not much time to wait for the formal approval of a change before implementation. Therefore itis key to structure the process such that the turnaround time is as short as possible, and at leastthe relevant disciplines have reviewed a change prior to formal approval.
10.5 ! Progress reportingIn practice there are many different reports for many different purposes and audiences. Someexamples are listed below:• Weekly internal project highlights• Monthly progress reports• Project portfolio updates• External progress reports for investors and partners• Management dashboards
Various stakeholders need to be informed and might ask for different information. Dependingon their interest and management level, the specific information, aggregation level and report-ing frequency can vary. It also depends on the project development phase, because progressreporting can become much more complex as the number of external parties increases towardsexecution.
Many project teams consider progress reporting as a burden that not necessarily adds any valueto the project. Especially the sometimes many ad hoc requests for information or progress dataare disrupting the day-to-day project activities. Besides disruption, this ad hoc reporting can eas-ily lead to mistakes or the provision of incomplete information. On top of that this informationcould start to ‘live its own life’, being used and presented by stakeholders in their own interest.The trick is to produce one simple, formal progress report that satisfies most of the stakeholders.However there can still be good reasons to compile tailor-made reports, but always using thesame data as included in the formal progress report. Ad hoc requests should be minimised tolimit the additional reporting burden of the project team at any time.
The positive thing about reporting is that it requires the project team and third parties to fre-quently review project performance and to update the cost and schedule forecasts. It forcescommunication between all parties to first collect the required progress data and next to explainproject performance and required recovery measures to the various stakeholders.
201
Management of engineering ProjectsIntroduction Preparation
Settingthe scene
Timeand money
Peopleat work
Outlook
925836-02_219_17-Feb-15_08:44:14_walter

Figure 10.14: Example of a progress report of the Wind Farm Energy Polder
202
Management of engineering Projects
925836-02_220_17-Feb-15_08:44:16_walter

Progress reports can also have a contractual purpose, for example to formally document approvedscope changes or to document the status of earned incentives. The reports could even end up incourt, in case a claim needs to be settled after project completion.The data and information in the progress report needs to be highly reliable as the project teamand other stakeholders must be able to take decisions based on this report. Example: A pro-ject manager decided to introduce working shifts to catch up, following a progress report thatshowed a poor construction progress. Two months later it turned out that there was a significantdelay in collecting and reporting construction progress data and that the actualConstruction progress was even ahead of schedule. Accurate progress reporting could haveprevented the additional cost of working shifts.A progress report typically includes the following topics:• Management summary• HSE performance• Project Key Performance Indicators (KPIs)• Key risks and mitigation actions• Schedule• Cost control• Quality• Engineering• Contracting and Procurement• Construction• Commissioning and Start-up• Scope changes
For schedule and cost most reports include progress and cost curves, showing the planned,actual and forecasted data. An example of a typical monthly progress report for the Wind Farmproject is given in Figure 10.14.
Human aspectThe quality of a progress report strongly depends on the competencies of the project controlsteam and their understanding of the scope and execution. The team must be able to challengethe received data and information and should understand how to integrate it into one overallprogress report. The project manager should take full ownership of the progress report, beingable to explain all information included.For the project controls team it is important to realise that informal communication can be asimportant as formal communication. For example a cost controller who really connects withthe project team, who understands the scope of work and knows what is going on during con-struction, can fulfil his role much more proactively than a cost controller sitting behind his deskall day.
The way progress is being presented and communicated can be influenced by many parties. Aproject manager can benefit from presenting a success story, while a contractor would like toreport all mistakes and omissions from the owner. It is therefore important to ensure the reportreflects the actual situation and represents issues in a fair way. In the end it comes down to trustbetween all parties involved, particularly between the owner and contractors. Since conflict-ing interests will exist at all times, making money versus saving money, it works best to openly
203
Management of engineering ProjectsIntroduction Preparation
Settingthe scene
Timeand money
Peopleat work
Outlook
925836-02_221_17-Feb-15_08:44:16_walter

acknowledge these differences and to focus on the common interests and goals, like for examplea good safety performance.
10.6 ! Project controls teamThe Project Controls (PC) team is part of the overall project team and can typically include thefollowing disciplines:• Cost estimation• Scheduling• Cost control• Risk management• Document control
The PC team is normally led by a Project Controls lead or manager and the size of the team willvary depending on the size and complexity of the project. The PC manager is normally a mem-ber of the project management team.
The PC team plays a vital role in providing management information to the project team andvarious stakeholders. To fulfil this role the PC team needs to:• Establish a clear project baseline, including a proper understanding of the business drivers.• Compile a fit-for-purpose project controls plan.• Proactively collect and challenge project information and data.• Integrate and analyse the information from all sub-projects, disciplines and third parties.• Provide reliable management information to the project team to help them take the right
decisions.• Consolidate all relevant progress information and data in a formal progress report.• Support management of change and assess the impact of changes on cost and schedule.• Facilitate risk management.
The PC team can only succeed if they are involved from the start of the project, if they are beingrecognised for their critical role and provided they communicate and engage with the right peo-ple at the right time. This requires full support from project management and the right mix ofanalytical and people skills in the PC team.
10.7 ! Fit-for-purpose project controlsFit-for-purpose project controls means applying the right level of cost and schedule control for aproject in each lifecycle phase. For large projects this can even be different for each major WBSelement. The level of control depends on the scope of work, associated risk, complexity and alsothe contracting strategy. Building a multi-billion euro chemical plant under a joint venture with aconsortium of contractors requires a different level of control than building a small-size pedestri-an bridge by one contractor under a lump sum contract.
204
Management of engineering Projects
925836-02_222_17-Feb-15_08:44:19_walter

Below some examples are given to illustrate the need for fit-for-purpose project controls.
Cost estimateDepending on the project phase and the level of project definition, the completeness and accu-racy of the estimates varies. Sometimes stakeholders are asking for a very accurate estimate inthe early development phases of a project, while the required level of project definition is notavailable yet. This can result in an extensive exercise and expenditure, to obtain the necessarydetail required to establish the desired level of accuracy. The issue with producing very accurateestimates too early, lies in making too many assumptions and trying to collect reliable cost datawhile there are still a lot of unknowns and uncertainties. A famous one-liner applies here: ‘It isbetter to be roughly right, than precisely wrong.’ So unless there is a clear need for an accurate(deterministic) estimate early in the development, likely related to risk, stakeholders should reallyfocus on the objective of an estimate and on which decisions it should support.
ScheduleSame as for the cost estimate it is important to make sure that the level of scheduling detail isaligned with the purpose of the schedule. It is no use to develop a detailed, fully resource loadedschedule, if you only need rough milestones and lead times to compare different design con-cepts in the early project phases.
Similarly it is highly unlikely that the small-size pedestrian bridge requires a fully integrated costand schedule Monte Carlo risk analysis. On the flip side, the multi-billion chemical plant doesrequire this integrated analysis since the complexity and associated risks are entirely different.In summary, applying fit-for-purpose project controls requires full understanding of the projectvalue drivers, risks and the specific purpose of estimates and schedules in each project lifecyclephase.
205
Management of engineering ProjectsIntroduction Preparation
Settingthe scene
Timeand money
Peopleat work
Outlook
925836-02_223_17-Feb-15_08:44:19_walter