chapter 10 resettlement action plan framework study
TRANSCRIPT

CHAPTER 10 RESETTLEMENT ACTION PLAN FRAMEWORK STUDY
JICA PREPARATORY SURVEY ON GREATER CAIRO METRO LINE NO.4
Final Report - Volume 3 10-1
CHAPTER 10 RESETTLEMENT ACTION PLAN FRAMEWORK STUDY
10.1 Introduction
The purpose of the Resettlement Action Plan (RAP) Framework Study is to prepare a policy framework for land acquisition and resettlement by taking appropriate social considerations as a basis for detailed study of land acquisition and resettlement to be conducted in the next stage, namely, the Basic Design stage. In order to achieve this propose, the RAP Framework is prepared by reflecting regional conditions, which are studied through site reconnaissance and a socio-economic interview survey, and by considering donor policies such as JICA and ex-JBIC Guidelines as well as World Bank Operational Polices 4.12 on Involuntary Resettlement and Egyptian regulations. The results of RAP Framework Study are in a separate report (Resettlement Policy Framework (RPF) for Greater Cairo Metro Line No.4). Some results in the RAP Framework Study are utilized in this Chapter.
Land acquisition and resettlement conducted in the projects and executed by NAT are based on Egyptian regulations, supplemented by the initiative of relevant departments in governorates. In the case of donor funding projects, appropriate considerations for environmental and social issues as requested by donor policies are necessary for a project proponent. Therefore, the RAP Framework Study is expected to be utilized by NAT as a basis for resettlement and land acquisition to be conducted as well as to take serious considerations for different approaches between donor policies and Egyptian regulations.
As described in the previous chapters, the Metro Line 4 Project (hereafter referred to as the Project) is composed of different levels of study for Phase 1 and Phase 2, namely, preliminary design in the former and outline design in the latter. Thus, the project implementation schedule differs between the 2 phases. Under this circumstance, the RAP framework is examined in two different levels, as indicated below:
Detailed examination of potential impact due to land acquisition and resettlement is done in Phase 1.
Preliminary examination of potential impact due to land acquisition and resettlement is done in Phase 2.
Policy for compensation is examined in Phase 1 and Phase 2.
10.2 Legislative System on Resettlement in Egypt
10.2.1 Fundamental Laws and Regulations on Land Acquisition and Resettlement
The relevant regulations on land acquisition and resettlement are shown in Annex 9-1.
Among relevant regulations, Law No. 10/1990 or the Expropriation of Real Estate for Public Interest serves as the fundamental regulation. The law defines that land acquisition can be exercised for the purpose of public interest, as indicated below:
Construction, enlargement, amendment, and extension of roads, streets, and squares

JICA PREPARATORY SURVEY ON GREATER CAIRO METRO LINE NO.4
Final Report - Volume 3 10-2
Projects related to water and wastewater
Projects related to irrigation and drainage
Projects related to power and energy
Construction and amendments on bridge and surface passage (railroad crossings) and underground passage
Projects related to transportation and communication
Projects related to urban planning and improvement of public utilities, which is defined in other regulations
The law also defines that the owners are eligible to be compensated for loss due to land acquisition.
10.2.2 Procedure for Land Acquisition and Resettlement
Law No. 10/1990 defines the responsibilities of relevant governorate departments and procedures for land acquisition as mentioned below:
(1) Relevant Authorities
Several governmental bodies are involved in land acquisition or resettlement. An assessment committee plays the key role in land acquisition and resettlement under the supervision of the National Survey Authority. An assessment committee is established in each governorate by the decree of the Minister of Water Resources and Irrigation, and membership is changed every two years.
1) Central Level
The Egyptian General Survey Authority (EGSA), as the national authority, is mandated to assess property loss and the amount of compensation by Law No. 10/1990. The project proponent is responsible for budget arrangement on land acquisition and compensation.
2) Governorate Level
The assessment committee is composed of relevant bodies with responsibilities as indicated in Table 10-1. It is entitled to assess the amount of property loss and compensation under the supervision of EGSA, and is also entitled to have consultation with Project Affected Persons (PAPs)1. In the case of land acquisition within Cairo Governorate, assessment of property loss and compensation amount is implemented by relevant departments in the governorate without the supervision of EGSA.
1 PAPs are defined as those who are entitled for compensation in this report.
JICA PREPARATORY SURVEY ON GREATER CAIRO METRO LINE NO.4
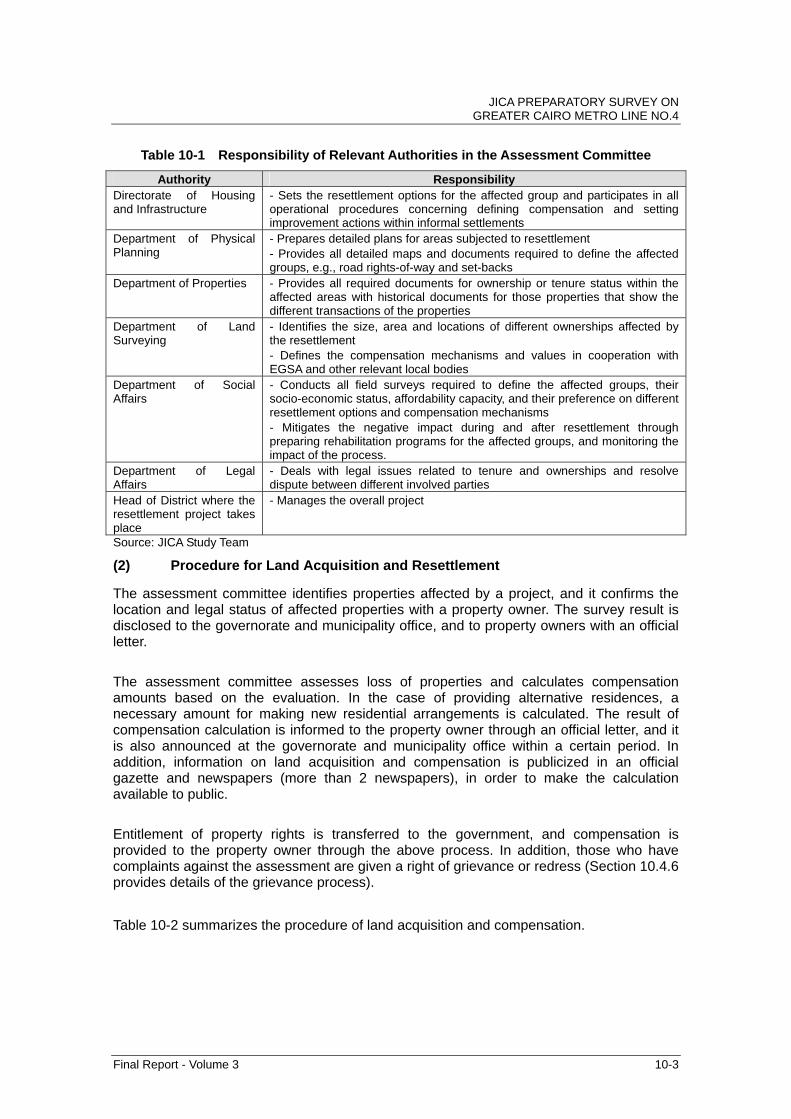
Table 10-1 Responsibility of Relevant Authorities in the Assessment Committee
Authority Responsibility Directorate of Housing and Infrastructure
- Sets the resettlement options for the affected group and participates in all operational procedures concerning defining compensation and setting improvement actions within informal settlements
Department of Physical Planning
- Prepares detailed plans for areas subjected to resettlement - Provides all detailed maps and documents required to define the affected groups, e.g., road rights-of-way and set-backs
Department of Properties - Provides all required documents for ownership or tenure status within the affected areas with historical documents for those properties that show the different transactions of the properties
Department of Land Surveying
- Identifies the size, area and locations of different ownerships affected by the resettlement - Defines the compensation mechanisms and values in cooperation with EGSA and other relevant local bodies
Department of Social Affairs
- Conducts all field surveys required to define the affected groups, their socio-economic status, affordability capacity, and their preference on different resettlement options and compensation mechanisms - Mitigates the negative impact during and after resettlement through preparing rehabilitation programs for the affected groups, and monitoring the impact of the process.
Department of Legal Affairs
- Deals with legal issues related to tenure and ownerships and resolve dispute between different involved parties
Head of District where the resettlement project takes place
- Manages the overall project
Source: JICA Study Team
(2) Procedure for Land Acquisition and Resettlement
The assessment committee identifies properties affected by a project, and it confirms the location and legal status of affected properties with a property owner. The survey result is disclosed to the governorate and municipality office, and to property owners with an official letter.
The assessment committee assesses loss of properties and calculates compensation amounts based on the evaluation. In the case of providing alternative residences, a necessary amount for making new residential arrangements is calculated. The result of compensation calculation is informed to the property owner through an official letter, and it is also announced at the governorate and municipality office within a certain period. In addition, information on land acquisition and compensation is publicized in an official gazette and newspapers (more than 2 newspapers), in order to make the calculation available to public.
Entitlement of property rights is transferred to the government, and compensation is provided to the property owner through the above process. In addition, those who have complaints against the assessment are given a right of grievance or redress (Section 10.4.6 provides details of the grievance process).
Table 10-2 summarizes the procedure of land acquisition and compensation.
Final Report - Volume 3 10-3

JICA PREPARATORY SURVEY ON GREATER CAIRO METRO LINE NO.4
Table 10-2 Procedure of Land Acquisition and Resettlement
Procedure Stage Items Responsible Agency Preliminary Survey 1-1 Identification of land/property owners and
necessary area to be acquired Project proponent
Preparation for Approval
2-1 Informing the result of identification to responsible ministry
Project proponent
2-2 Responsible ministry informs relevant governorates about land acquisition
Responsible ministry
2-3 Relevant governorates request the government to issue Prime Ministerial decree on land acquisition
Relevant governorates
Approval 3-1 Issuing Prime Ministerial decree on land acquisition for public interest
Prime Minister
Detailed Survey 4-1 Announcement of compensation targets EGSA, relevant governorates 4-2 Conducting detailed survey EGSA, relevant governorates Disclosure 5-1 Announcement of detailed survey result EGSA, relevant governorates Land Acquisition 6-1 Compensation payment and land
ownership transfer EGSA, relevant governorates
Source: JICA Study Team 10.2.3 Consistency with JICA & Ex-JBIC Guidelines
(1) Requirements of the Guidelines
In the case of an ODA loan project, the following items are requested in the ex-JBIC Guidelines to borrowers:
Effective measures to minimize impact and compensate for losses must be agreed upon with the people who will be affected if involuntary resettlement is inevitable.
People who will be resettled involuntarily and people whose means of livelihood will be affected must be sufficiently compensated in a timely manner.
Project proponents must make efforts to enable the people affected by the project, improve their standard of living, income opportunities and production levels, or at least restore them to status prior to the project.
Appropriate participation by the community affected must be promoted in planning, implementation and monitoring of involuntary resettlement plans and measures against the loss of their means of livelihood.
(2) Comparison and Verification between Egyptian System and Guidelines
1) Experience of Donor Funding Project
In the course of interpreting policies on land acquisition and resettlement, experience from previous donor-funding projects is also examined. There are several active projects funded by the World Bank (WB), African Development Bank (AfDB), and European Investment Bank (EIB), and no resettlement is confirmed on the basis of these projects. However, some of them prepare Resettlement Policy Framework (RPF) reports by considering donor policies in case studies. It is considered that there is no actual operational policy on resettlement in donor-funded projects in Egypt so far.
Final Report - Volume 3 10-4

JICA PREPARATORY SURVEY ON GREATER CAIRO METRO LINE NO.4
Final Report - Volume 3 10-5
2) Policy Gap between Egyptian System and Guidelines
Table 10-3 identifies discrepancies between JICA and JBIC Guidelines, and Egyptian regulations regarding land acquisition and resettlement.
Table 10-3 Discrepancies between JICA and JBIC Guidelines and Egyptian Regulations
Item Donor Policies Egyptian Regulations Actual Operation in Egypt
1 Establishment of support system for socially vulnerable groups
Socially vulnerable groups tend to be exposed to environmental and social impacts. In addition, they have limited access to decision making processes. Thus, it is necessary to give appropriate consideration to them.
There is no description about support to socially vulnerable groups.
There is no operational experience to support socially vulnerable groups since there is no exact categorization of socially vulnerable groups in Egypt.
2 Provide assistance to restore and improve living standards.
Living standards, income opportunities, and production levels of project affected people should be improved or at least restored to their pre-project levels.
There is no description about improvement of living standards.
Assistance for restoring and improving living standards has not been provided. PAPs were provided with cash compensation based on property loss assessment, although additional financial and practical support appeared not to be provided.
3 Enhancement of public participation in planning and implementation of resettlement plans
Appropriate participation by the affected people and their communities should be promoted in planning, implementation and monitoring of involuntary resettlement plans and measures taken against the loss of their means of livelihood.
Property owners whose properties will be taken are requested to attend the identification of property. However, there is no description about participation of project affected people and communities in the preparation and implementation of measures, as well as in conducting monitoring.
In the case of Metro Line 3, there were some interviewees who were not given sufficient notice of their resettlement, in some cases being informed just before their relocation. Appropriate consultation with PAPs appeared not to be implemented.
4 Compensation for land acquisition with replacement cost2
Regarding environmental and social considerations, reference is made to
There is no description about replacement cost.Compensation amount
Compensation is basically calculated for land and properties based on market
2 Replacement cost does not mean a market value or governmental rate. Replacement cost include: i) market cost for materials to build a replacement structure with an area and quality similar or better than the project scope; ii) cost for transporting materials to a new site; iii) cost for labour and contractor fee; iv) cost for tax and registration. Depreciation of asset and value of salvage should not be taken into account in determining the replacement cost. For details, please see footnote 1 of Annex-A of OP4.12 of World Bank.

JICA PREPARATORY SURVEY ON GREATER CAIRO METRO LINE NO.4
Final Report - Volume 3 10-6
Item Donor Policies Egyptian Regulations Actual Operation in Egypt
regulations and good practices of international agencies, regional agencies, and developed countries, such as Japan, (in this project, compensation will be done with replacement cost in according with OP4.12 of World Bank on Involuntary Resettlement.
is evaluated based on the market value3 at the time of the decree issued for land acquisition and resettlement for a specific project
value, and does not include transaction costs such as moving cost. Regarding administration cost, it was said to be covered by a project proponent according to interviews with relevant parties. In the case of Metro Line 3, compensation for licensed and unlicensed shops, and interior decoration ere made in addition to compensation for property loss. Besides, a uniform amount was paid when PAPs complained about their compensation amount.
5 Providing support for illegal occupants
People to be resettled involuntarily and whose means of livelihood will be affected should be sufficiently compensated and supported by the project proponents in an appropriate time.
The targets for compensation are the property owners. There are no definite plans about compensation for illegal occupants.
As a practical custom, there was an example in Cairo Governorate that apparent owners at the time of census were provided some compensation for their properties. Thus, illegal occupants would have an opportunity to be provided financial support if they had been regarded as apparent owners at the time of census. Due examination was done to decide whether financial support should be provided for illegal occupants.
Source: JBIC Guidelines and OP4.12 Involuntarily Resettlement compiled by JICA Study Team 10.2.4 Findings and Actual Practice of Land Acquisition and Resettlement in
Egypt
From 1958 to 2009, approximately 200 decrees on land acquisition were issued according to the official gazette. Among them, two decrees were issued for the Metro Line 3 project, such as; i) Decree 1506/2006 for Phase 1 issued on 31st August 2006; and
3 Article 6 of Section 2 in Law No. 10/1990 specifies that “the indemnity shall be evaluated according to the prices prevailing at the time of the promulgation of the expropriation decree”. It is confirmed from interviews so far that the prices mean the market value, although further confirmation is necessary.

JICA PREPARATORY SURVEY ON GREATER CAIRO METRO LINE NO.4
ii) Decree 3296/2008 for Phase 2 issued on 15th January 2009. However, there was no decree on land acquisition for the Metro Line 1 and 2 projects.
When a project in the public interest is executed, implementation of land acquisition and resettlement is much more flexible than might be suggested by strict legal interpretation, by taking social aspects into consideration for compensation assessment. The following were found from relevant documents and interviews in the field to represent actual practice in the Metro Line 3 project.
(1) Magnitude of Impact on Affected Properties and Persons in the Metro Line 3 Phase 1 Project
The Phase 1 section of Metro Line 3 is from Attaba to Abbasia, and the negative impacts are shown in the table below.
Table 10-4 Magnitude of Land Acquisition and Resettlement at Metro Line 3 Phase1
Category Affected Number Affected Persons 92Affected Flats 21Affected Shops 56Affected Kiosks 7Affected Wells 8
Source: JICA Study Team
Compensation for losses was basically provided at the rates given below.
House owners: LE3,000 per square metre
Tenants : LE15,000 per room
Shop: LE2,000 per square metre (in the case of total shop area of up to 50 m²), LE500 per square metre (in the case that total shop area is bigger than 50 m²), LE5,000 for license, LE5,000 for decoration, and additional LE5,000 if there are any complaints
Others: LE7,000 for kiosks, LE5,000 for licensed booths, and LE2,500 for unlicensed booths
(2) Findings of Compensation in the Metro Line 3 project
For land acquisition within Cairo Governorate, the property department of the governorate is responsible instead of EGSA, as mentioned previously. Although land acquisition in the governorate was implemented according to Law No. 10/1990, several considerations for compensation were carried out in addition to the law as a policy of Cairo Governorate and NAT. The major considerations are:
i) Compensation for tenants and illegal settlers
ii) Compensation for unlicensed shops
iii) Compensation for shops was provided based on the assessment of physical properties
Final Report - Volume 3 10-7

JICA PREPARATORY SURVEY ON GREATER CAIRO METRO LINE NO.4
iv) Compensation for loss of income source was not provided according to interviews with relevant departments in Cairo Governorate
v) Consultation and negotiation were carried out as necessary
vi) Timing of information disclosure was relatively late
Although compensation was made in addition to the law, replacement cost and livelihood restoration of people affected were not considered.
10.3 Baseline Information of Social Conditions
10.3.1 Objective and Methodology
It is indispensable to examine socio-economic conditions in the project area to grasp current living conditions of households for examining negative impacts on the affected area and households, as well as considering mitigation measures against negative resettlement impacts and necessary compensation to the affected persons.
The objective was achieved by collecting secondary information and conducting interview surveys in the regions alongside the proposed alignment. The questionnaires were used and were composed of two forms: a perception survey and a general socio-economic survey, as shown in Annex 10-1. In total, 240 samples in Phase 1 and 2 areas were interviewed, representing the following interviewee distributions as seen below.
Table 10-5 Distribution of Household Interview Survey
(Unit: %) Variable Phase 1 Phase 2 Total
Male 50.5 54.1 52.5 Sex Female 49.5 45.9 47.5 Less than 30 years 7.5 9.0 8.3 30-49 32.7 18.8 25.0 40-49 23.4 29.3 26.7 50-59 16.8 19.5 18.3
Age
Over 60 years 19.6 23.3 21.7 Source: JICA Study Team
10.3.2 Survey of Public Perception of the Project
In the perception survey, households were interviewed regarding the following:
(1) Current Situation of Transportation Mode
The most used transportation mode in the study area is through privately owned cars, as shown in the following figure.
Final Report - Volume 3 10-8

JICA PREPARATORY SURVEY ON GREATER CAIRO METRO LINE NO.4
27%
24%23%
11%
15% Own Car
Micro Bus
Metro
Taxi
Other
Source: JICA Study Team
Figure 10-1 Transportation Mode Used at the Study Area
(2) Understanding about the Project
Most of interviewees had a positive perception on the project, although approximately 70% of interviewees were not aware of the project before the survey. However, a small percentage of the population (7%) had a negative perception on the project. The most dominant reasons on negative perceptions were reported as deterioration of environment during construction and disruption of livelihood due to resettlement.
(3) Opinion to Involuntary Resettlement
Approximately 35% of interviewees had no objection to resettlement while 55% had some concerns. Approximately 60% of interviewees who had concerns were afraid of receiving inappropriate compensation. Among the alternative modes of compensation, the method favourable to the majority of interviewees was providing alternative residences rather than cash compensation. From these findings, appropriate evaluation of compensation for loss of property and means of income is absolutely necessary, as a pre-requisite for people that requested to resettle.
10.3.3 General Socio-Economic Condition of Public
(1) Number of Persons in the Average Household
The interview survey was conducted in four governorates in the project area, namely Qalyobeya, Giza, Cairo, and 6th of October. The average family size of the project area is approximately 4.2 persons per household as the following table shows in detail:
Table 10-6 Average Number of Persons per Household in the Study Area
sl no. Governorate Average Family Number 1 Qaliobeya 4.8 2 Giza 4.2 3 Cairo 4.2 4 6th October 3.8
Average 4.2 Source: JICA Study Team
(2) Average Monthly Income
The project area covers a wide range of people with varying occupations and sources of income, which ranges from the top management to the labour level. According to a study on minimum wage in sectors of the Egyptian economy conducted by Egyptian Center for Economic Studies in 2006, the minimum wage is LE168 per month in the public sector and
Final Report - Volume 3 10-9

JICA PREPARATORY SURVEY ON GREATER CAIRO METRO LINE NO.4
LE154 per month in the private sector. However, the minimum wage defined in Law No. 53 of 1984 for the Labuor Code is LE105 per month, after modifying from LE35 per month.
As for the monthly income in the study area, almost all interviewees exceeded the minimum salary described in the law, except for one. The following table shows the average monthly income in the project area:
Table 10-7 Average Monthly Income in Governorates of the Project Area
(Unit: LE) sl no. Governorate Average Monthly Income
1 Qaliobeya 1,077 2 Giza 2,793 3 Cairo 2,319 4 6th October 2,064 Average 2,793
Source: JICA Study Team
Table 10-8 Average Monthly Income by Occupational Category in the Project Area
(Unit: LE) sl no. Category Distribution of persons by
occupational category Average Monthly Income
1 Top Management Level 23% 2,8032 Top Technical Level 42% 2,7903 Technical Assistant 25% 2,2554 Service, Retail & Trade 21% 2,9385 Administrative Work 1.7% 2,3506 Industrial Labour 1.7% 1,3007 Agriculture and Fishing 1.3% 1,9008 Handicraft 1.3% 880
Source: JICA Study Team
As compared with the data in the Statistical Year Book 2008 by CAPMAS relating to average monthly income in Egypt, the average monthly income in the project area is considered to be higher.
Table 10-9 Average Weekly and Monthly Wage (for Selected Sectors) in Egypt
sl no. Category Average Weekly Wage (Public/Private)
Average Monthly Wage (Public/Private)
1 Construction & Building 255 / 214 1,020 / 8562 Whole Sale, Retail, Trade & Repairing 254 / 222 1,016 / 8883 Hotel & Restaurants 131 / 150 524 / 6004 Transport, Storage & Communication 296 / 254 1,184 / 1,0165 Real Estate Activity, Renting & Business
Services 180 / 231 720 / 924
Source: JICA Study Team
(3) Rental Fee
Some 41% of tenants interviewed pay LE25 or less for rent per month; 18% pay LE26-50; 14% pay LE51-100; and 10% pay LE101-200. Approximately 16% pay more than LE200 per month. The mean average monthly rent is calculated to be LE128.56, between a minimum monthly rent of LE2 and a maximum of LE1,500. Disaggregated data shows that the rental amount is significantly higher in Phase 1 than in Phase 2. The average rent amount in the Phase 1 section is calculated at LE242.62 with a maximum rent of LE1,500, while the average in the Phase 2 section is LE57.47, with a maximum of LE350.
Final Report - Volume 3 10-10
JICA PREPARATORY SURVEY ON GREATER CAIRO METRO LINE NO.4
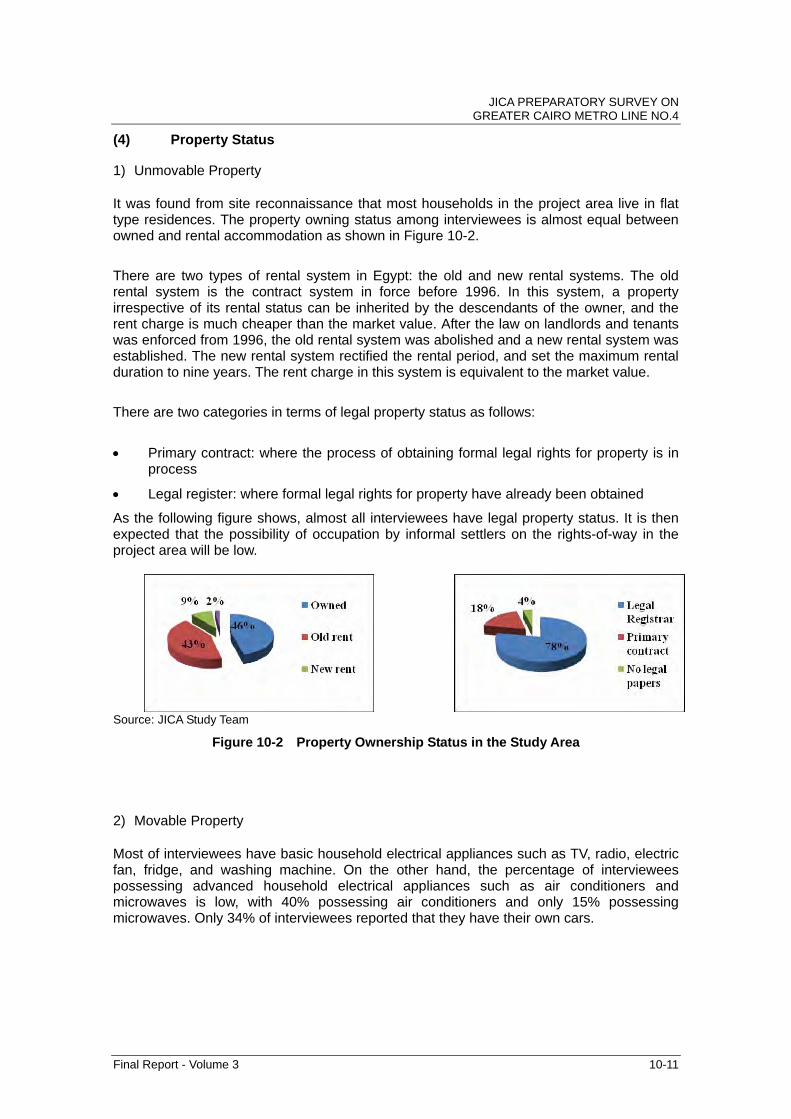
(4) Property Status
1) Unmovable Property
It was found from site reconnaissance that most households in the project area live in flat type residences. The property owning status among interviewees is almost equal between owned and rental accommodation as shown in Figure 10-2.
There are two types of rental system in Egypt: the old and new rental systems. The old rental system is the contract system in force before 1996. In this system, a property irrespective of its rental status can be inherited by the descendants of the owner, and the rent charge is much cheaper than the market value. After the law on landlords and tenants was enforced from 1996, the old rental system was abolished and a new rental system was established. The new rental system rectified the rental period, and set the maximum rental duration to nine years. The rent charge in this system is equivalent to the market value.
There are two categories in terms of legal property status as follows:
Primary contract: where the process of obtaining formal legal rights for property is in process
Legal register: where formal legal rights for property have already been obtained
As the following figure shows, almost all interviewees have legal property status. It is then expected that the possibility of occupation by informal settlers on the rights-of-way in the project area will be low.
Source: JICA Study Team
Figure 10-2 Property Ownership Status in the Study Area
2) Movable Property
Most of interviewees have basic household electrical appliances such as TV, radio, electric fan, fridge, and washing machine. On the other hand, the percentage of interviewees possessing advanced household electrical appliances such as air conditioners and microwaves is low, with 40% possessing air conditioners and only 15% possessing microwaves. Only 34% of interviewees reported that they have their own cars.
Final Report - Volume 3 10-11

JICA PREPARATORY SURVEY ON GREATER CAIRO METRO LINE NO.4
10.4 Policy and Framework of Resettlement for the Project
10.4.1 Basic Policy
Final and detailed investigation of the impact of the project on land acquisition and resettlement will be done upon delineation of the project area, and the basic policy for resettlement will be examined in detail. The RAP Framework Study leads in preparing a basic resettlement policy for future study.
Since this is the first experience for NAT to implement land acquisition and resettlement considering donor policies in addition to Egyptian regulations, due consideration should be given to basic policies, which are practical and feasible for NAT to implement within the Egyptian framework. Achieving donor requirements successfully is a must to minimize the gaps as mentioned in Section 10.2.3.
The main donor policies are as follows:
i) Effective measures to minimize impacts and compensate for losses must be agreed upon with the people who will be affected if involuntary resettlement is required.
ii) People who will be resettled involuntarily and people whose livelihood will be affected must be sufficiently compensated in a timely manner.
iii) Project proponents must make efforts to enable the people affected by the project, improve their standard of living, income opportunities, and production levels, or at least restore them to their pre-project status.
iv) Appropriate participation by the people affected and their communities must be promoted in the preparation, implementation and monitoring of involuntary resettlement plans and measures against the loss of their means of livelihood.
As described, donor policies pay attention to appropriate compensation and participation of PAPs. Socio-economic surveys on public opinions reveal the importance of appropriate compensation. Hence, it is essential for the project to consider the involvement of PAPs. It is proposed that the project should observe the following principles at the time of detailed study of land acquisition and resettlement in order to provide appropriate measures and compensation for the PAPs.
i) By examining all possible alternatives from engineering as well as environmental and social perspectives, land and property acquisition will be avoided or minimized as much as possible.
ii) PAPs must be consulted in a meaningful and timely manner in order to reflect their opinion on the resettlement plan and to promote their participation for planning and implementing of the resettlement plan.
iii) Compensation will be provided in a timely manner based on the agreement with PAPs, and will be completed not later than the date of evacuation.
iv) Compensation for loss of assets, income and business will be based on replacement cost in order to improve the livelihoods, standards of living or income opportunities of PAPs, or at least restore them to their pre-project levels.
v) All PAPs living, working, and doing business in the project area at the time of cut-off date will be entitled to compensation.
Final Report - Volume 3 10-12

JICA PREPARATORY SURVEY ON GREATER CAIRO METRO LINE NO.4
vi) The legal or tenure status and practical manner of the properties affected and operational practice in Egypt will be carefully considered in determining their eligibility for compensation.
vii) Necessary institutional arrangements, including grievance mechanisms, will be assured for preparation and implementation of resettlement in a timely manner.
viii) Adequate financial arrangements will be committed and arranged within the time frame to cover the cost of land acquisition, resettlement, and rehabilitation.
ix) An appropriate monitoring, reporting, and evaluation framework will be assured in the resettlement management system.
10.4.2 Eligibility and Entitlement
(1) Eligibility
The first criterion to for eligibility will be the cut-off date. If the residency was identified through the census survey, the owner will be entitled for compensation for their loss of properties and/or assistance for livelihood stabilization. On the other hand, if a person encroached the project area after the cut-off date, they are not entitled to compensation
The second criterion for eligibility will be the legal status of those who were qualified from the first criterion. Identified PAPs are basically classified into the following categories in the donor policies:
Those who have formal legal rights to land (including customary and traditional rights recognized under the laws of the country)
Those who do not have formal legal rights to land at the beginning of the census, but have a claim to such land or assets; provided that such claims are recognized under the law of the country or process identified in the resettlement plan
Those who have no recognizable legal right or claim to the land they are occupying
Although Egyptian regulations do not mention entitlement of compensation for those who do not have legal rights, such persons have been compensated in the course of operational practice if they were previously regarded as the apparent owners of the affected properties. Considering donor policies and Egyptian legal status and practical manner, the categorization for entitlement to compensation in the project will be proposed as follows.
A) Household or Individual
i) Those who are identified at the cut-off date and regarded as apparent owners of properties by the assessment committee. Apparent owners shall include the following legal categories:
Those who have legal rights to land and/or property (including customary and traditional rights recognized under the laws of the country);
Those who do not have legal rights to land and/or property at the cut-off date but have a claim to such land or assets - provided that such claims are recognized under the laws of the country or become recognized through a process identified in the resettlement plan;
Final Report - Volume 3 10-13

JICA PREPARATORY SURVEY ON GREATER CAIRO METRO LINE NO.4
Those who have no recognizable legal right or claim to the land and/or property they are occupying but regarded as apparent owners at the cut-off date if they are occupying permanent structures such as flats and houses.
ii) Those who are identified at the cut-off date and regarded as apparent tenants by the assessment committee. Apparent tenants include the following:
Those who have legal right or in the course to obtain legal right on land
Those who have no recognizable legal right or claim on tenant status but regarded as tenants at the cut-off date.
iii) Those who have no recognizable legal right or claim to land they occupy but regarded as apparent owners by the assessment committee due to their settlement in illegally established structures such as sheds.
B) Business Owners
Those who are identified at the cut-off date and regarded as apparent business owners by the assessment committee. Apparent business owners shall include the following legal categories:
i) Those who are registered business owners (including customary and traditional rights recognized under the laws of the country);
ii) Those who are not yet registered business owners at the cut-off date but have a claim to such land or assets - provided that such claims are recognized under the laws of the country or recognized through a process identified in the resettlement plan;
iii) Those who are not regarded as registered business owners at the cut-off date but as apparent business owners
(2) Entitlement
The entitlement to compensation and assistance of livelihood stabilization shall be defined according to Egyptian regulations in compliance with donors’ policies. Entitlement shall be categorized based on the proposed eligibility to the loss:
1) Compensation for Land Loss:
Project affected land users, households and individuals regarded as the apparent land owners shall be compensated through either of the following:
Allocation of land with equivalent value and same use purposes
Cash compensation for acquired land at full replacement cost.
2) Compensation for Households, Structure and Other Establishment Loss:
a) Apparent Owners
Cash compensation for acquired properties at full replacement cost
Final Report - Volume 3 10-14

JICA PREPARATORY SURVEY ON GREATER CAIRO METRO LINE NO.4
Final Report - Volume 3 10-15
Allocation of equivalent value of property with equivalent social convenience
b) Tenants
Providing assistance according to the decision of the assessment committee,
Providing additional assistance for moving if it is not included in the decision.
c) Temporary Apparent Owners
Resettlement of temporary apparent owner in the current proposed route is not confirmed by the site reconnaissance, but the following policies are proposed in case:
Providing cash assistance for relocation
Providing cash and administrative assistance for new properties and their administrative registration
3) Compensation for Social Service
Orphanage and hospital in Station 1, bus terminal in Station 4, public school in Station 6, governmental hospital in Station 10, and mini bus terminal in Station 11 are regarded as social service in this report4. They shall be assisted with the following:
Orphanage affected partially shall be relocated and renewed in the same site, and
Compensation for bus and mini bus terminal shall be based on full replacement cost
4) Compensation for Business Owners and Employees:
Eligible business owners shall be compensated for their income loss based on the decision by the assessment committee. In addition, the following measures should be taken if the decision is not regarded as considering livelihood stabilization:
Cash compensation for allowance
Assistance for rehabilitation of livelihood stabilization
Employees and labourers whose job will be affected either temporarily or permanently shall be compensated in stabilizing their livelihood.
Cash compensation equivalent to three months of salary as maximum
Assistance to secure new jobs including training for job applications.
4 Acquisition of public land is conducted by transferring ownership between relevant ministries. Thus, compensation for relevant ministries is not included in the entitlement.

JICA PREPARATORY SURVEY ON GREATER CAIRO METRO LINE NO.4
5) Compensation for Street Stalls
According to the Metro Line 3 experience, street stalls are categorized as kiosks, licensed booths, and unlicensed booths. Compensation for them is proposed as follows.
Cash compensation for relocation at each category based on the decision by the assessment committee
Assistance for relocation.
6) Compensation for the Poor
In the course of site reconnaissance, habitation of poor was not confirmed. However, those who are less than the poverty line will be provided with the following assistance if such persons are identified as PAPs during the basic design stage:
Cash compensation equivalent to three months of income in case of not relocation
Cash compensation equivalent to six months of income in case of relocation Cash compensation equivalent to twelve months of income in case of relocation in the different socio-economic condition
Providing programs for new job applications if necessary 10.4.3 Overall Procedure
The procedure for land acquisition and resettlement will conform with the procedure of the Egyptian regulations as mentioned in section 10.2.2. For this project, it is also important to consider donor policies in the implementation procedure of land acquisition and resettlement.
10.4.4 Institutional and Organizational Arrangement Land acquisition and resettlement is implemented by the assessment committee initiated by EGSA, or governorate in the case of Cairo governorate, in cooperation with NAT, as described in the statement of responsibilities (see Table 10-2). This system is considered to be applicable for the project since an assessment committee, which has much experience with legal rights, is better equipped to deal with this issue than a working group established within NAT. 10.4.5 Monitoring and Evaluation
Monitoring will be done during and after land acquisition and resettlement to confirm proper completion in accordance with the following objectives:
i) verification of proposed activities in the resettlement plan
ii) evaluation of implementation situation and the effectiveness of the mitigation measures proposed
iii) confirmation of any unforeseeable situation at the time of preparation of resettlement plan (to allow preparation of additional support)
Monitoring is proposed to be done both internally and externally to ensure its reliability.
Final Report - Volume 3 10-16

JICA PREPARATORY SURVEY ON GREATER CAIRO METRO LINE NO.4
There seems to be no established system for monitoring land acquisition and resettlement. It was found that monitoring was not implemented in previous NAT projects. Therefore, appropriate instructions and training prior to monitoring is required. Necessary action for land acquisition and resettlement is generally the responsibility of the assessment committee under EGSA or relevant departments in governorates. Under such circumstances, it is proposed that internal monitoring will be conducted regularly by the assessment committee in cooperation with NAT. Monitoring result will be reported to the responsible ministries and relevant governorates quarterly.
For external monitoring, the project executing agency will hire an independent consultant possessing adequate experience and capacity in the monitoring and evaluation of land acquisition and resettlement. It is necessary for external monitoring to be implemented for the period between the early stages of land acquisition and resettlement, and a specified period after the completion of compensation.
The proposed checklist for internal and external monitoring is given in Table 10-10.
Table 10-10 Proposed Monitoring Checklist
Internal Monitoring External Monitoring
a) Identification of entitlement of project affected
people according to the policy enunciated in
the RAP to be prepared for review and update
in the BD stage
b) Timely implementation of compensation and
resettlement in various categories, according
to RAP, to be prepared.
c) Public consultation, information dissemination
and grievance resolution procedures in
accordance with Egyptian regulations and
donor polices.
d) Implementation of rehabilitation assistance to
PAPs in accordance with RAP.
e) Confirmation of completion of compensation
and resettlement, as well as commencement
of civil works.
a) Review of existing baseline data obtained
through site investigation and population
census
b) Assessment of effectiveness, impact and
sustainability of entitlement
c) Assessment of discrepancy between RAP and
actual implementation
d) Assessment of further mitigation
measurements and recommendation for
improvement of resettlement
e) Monitoring and assessment of grievances
f) Assessment of satisfaction level of project
affected people
g) Assessment of project awareness of affected
people on compensation policy
Source: JICA Study Team
Final Report - Volume 3 10-17
JICA PREPARATORY SURVEY ON GREATER CAIRO METRO LINE NO.4
10.4.6 Consideration of Grievance Redress
All PAPs enjoy their right to complain and express their grievances about the result of land acquisition and resettlement (including compensation, if it is not agreeable). In addition, it is also important that the grievance process covers the entire procedure of land acquisition and resettlement including compensation. Law No. 10/1990 ensures that both PAPs and the expropriating entity(ies) are given grievance rights, as follows:
Give owners thirty days after the expiry of public announcement to notify grievances to the central office of the expropriating entity or governorate.
Allow the expropriating entity until four months after expiry of the public announcement to contest the evaluation.
However, Law No. 10/1990 does not cover completion of compensation. Therefore, it is proposed to establish a contact window in the assessment committee where PAPs can communicate their grievances at any time. It is proposed to inform all PAPs of this procedure during the stakeholder meeting, as well as during individual consultations.
10.4.7 Assurance of Participation and Consultation
Information disclosure and public consultation will contribute to the transparency of the project and encourage public participation. In addition, potential conflict with the affected people on resettlement and compensation will be avoided if they are consulted during the very early stages of the project, since their opinions should be reflected in the preparation of policies. On the other hand, it is difficult to disclose project information to the public, since the provision of incorrect information can confuse the people affected. This could introduce a negative factor for project implementation. Therefore, the appropriate timing for information disclosure and public consultation is important.
A project proponent does not have any right to conduct consultation with PAPs in Egypt, as mentioned in Section 10.2.2. Only relevant departments in governorates and the assessment committee are entitled to conduct such consultation. For regulations, only the relevant departments in governorates and the assessment committee can conduct consultations with PAPs during the preliminary assessment if necessary. Considering Egyptian regulations and donor policies, the following policies on consultation are proposed:
As a first step, hold meetings with stakeholders and PAPs at the stage of EIA disclosure to provide PAPs an opportunity to understand the project;
As the second step, consult with all PAPs in individual meetings at the time of population census, which will be conducted when the station locations are almost fixed;
As the third step, a governorate and an assessment committee will establish a contact window, where PAPs can contact freely and obtain necessary information at any time.
10.4.8 Implementation Schedule
Land acquisition and resettlement is basically implemented according to the procedures of Egyptian regulations, while taking donor policies into account. The major procedure is proposed as follows for the preparation, implementation and monitoring of a detailed plan of resettlement, which is summarized in Table 10-11 and Table 10-12.
Final Report - Volume 3 10-18

JICA PREPARATORY SURVEY ON GREATER CAIRO METRO LINE NO.4
i) Preliminary Survey and Individual Consultation
The first step in the preparation of a detailed resettlement and compensation plan involves identifying potential PAPs. Relevant departments in a governorate and an assessment committee will conduct a preliminary survey to identify ownership of land and properties to be acquired upon project implementation, and individual consultations will also be held at that time to know their opinions and requirements on land acquisition and resettlement.
ii) Approval of Land Acquisition and Issuing Prime Ministerial Decree on Public Interest
The Prime Ministerial decree on land acquisition in the public interest will issued when the preliminary survey is completed and if it is approved. The decree will include the detailed procedure to be applied for land acquisition and compensation.
iii) Preparation of Basic Policy on Land Acquisition/Resettlement and Compensation
Based on the result of the preliminary survey and individual consultation, a basic policy will be prepared, including: i) legal framework; ii) compensation and assistance for livelihood stabilization rates with replacement cost; iii) brief clarification of entitlement on compensation; and iv) financial source(s). This policy will be prepared by referring from previous lessons and considering donor policies.
iv) Detailed Survey
When the decree on land acquisition in the public interest is issued by the Prime Minister, a detailed survey by relevant departments in a governorate and the assessment committee will commence. During that period, several individual consultations will be held to assess property loss and prepare appropriate compensation.
v) Preparation of Resettlement Plan
A resettlement plan will be prepared including detailed entitlement and estimation of compensation amount based on the result of the detailed survey and individual consultations. It will be notified in a public place, not only to PAPs, but to people who are interested in the project.
vi) Compensation and Evacuation
Compensation will be paid to PAPs according to the resettlement plan, and evacuation must be completed within five months.
vii) Monitoring
Internal and external monitoring will be conducted regularly during and after implementation of resettlement to examine and confirm its appropriateness and fairness. It will provide a basis for preparation of additional measures on compensation if the necessity for these is confirmed during monitoring.
Final Report - Volume 3 10-19

JICA
PR
EP
AR
AT
OR
Y S
UR
VE
Y O
N
GR
EA
TE
R C
AIR
O M
ET
RO
LINE
NO
.4
Final R
eport - V
olume 3
10-20
Table 10-11 Proposed Schedule of Land Acquisition and Resettlement for Phase 1
Source: JICA Study Team
M1 M2 M3 M4 M5 M6 M7 M8 M9 M10 M11 M12 M1 M2 M3 M4 M5 M6 M7 M8 M9 M10 M11 M12 M1 M2 M3 M4 M5 M6 M7 M8 M9 M10 M11 M12
Loan AgreementBD & TD PreparationContractor ProcurementConstruction
Preliminary Survey and IndivisualConsultationApproval of Land Acquisition andIssuing Prime Minister Decree onPublic InterestPreparation of Basic Policy forLand Acquisition andDetailed Survey and IndivisualConsultationPreparation of Resettlement PlanAnnoucement of Resettlement PlanCompensationLand Acquisition and Resettlement
Internal MonitoringExternal Monitoring
Monitoring
Year 1
Schedule of Project
Schedule of Land Acquisition and Resettlement
Year 2 Year 3

JICA
PR
EP
AR
AT
OR
Y S
UR
VE
Y O
N
GR
EA
TE
R C
AIR
O M
ET
RO
LINE
NO
.4
Final R
eport - V
olume 3
10-21
Table 10-12 Proposed Schedule of Land Acquisition and Resettlement for Phase 2
Source: JICA Study Team
M1 M2 M3 M4 M5 M6 M7 M8 M9 M10 M11 M12 M1 M2 M3 M4 M5 M6 M7 M8 M9 M10 M11 M12 M1 M2 M3 M4 M5 M6 M7 M8 M9 M10 M11 M12 M1 M2 M3 M4 M5 M6 M7 M8 M9 M10M11M12M1 M2 M3 M4 M5 M6 M7 M8 M9 M10M11 M12
Loan AgreementBD & TD PreparationContractor ProcurementConstruction
Preliminary Survey and IndivisualConsultationApproval of Land Acquisition andIssuing Prime Minister Decree onPublic Interest
Preparation of Basic Policy forLand Acquisition andResettlementDetailed Survey and IndivisualConsultationPreparation of Resettlement PlanAnnoucement of Resettlement PlanCompensationLand Acquisition and Resettlement
Internal MonitoringExternal Monitoring
Year 5
Schedule of Project
Schedule of Land Acquisition and Resettlement
Monitoring
Year 1 Year 2 Year 3 Year 4
JICA PREPARATORY SURVEY ON GREATER CAIRO METRO LINE NO.4
Final Report - Volume 3 10-22
10.5 Preliminary Cost Estimation for Compensation
10.5.1 Objective, Methodology and Limitation
The objective is to estimate the compensation cost as an input for the project capital cost estimate and for the economic and financial appraisal of the project.
The compensation estimate is based on available secondary data, such as the census data issued by CAPMAS on December 2008, and socio-economic data related to the project area obtained from a household survey conducted by JICA Study Team in July 2009. Since the available data is very limited, it will be necessary to review the cost estimate during the preparation of the resettlement plan.
10.5.2 Consideration of Minimizing Resettlement
The route and the station location have been designed with due consideration during the F/S stage in order to minimize potential impacts of land acquisition and resettlement. Since the project includes construction of stations, land acquisition and resettlement is necessary.
The following measures are taken in general to minimize potential impacts of land acquisition and resettlement.
In the case of road crossings, it is designed under the existing roads and also designed to be constructed by a tunnel boring machine (TBM). Therefore, resettlement will be avoidable.
Stations are basically constructed by the cut and cover method. If the resettlement impact is not negligible, alternative construction methods, instead of cut and cover, will be applied to minimize the resettlement impact.
A typical effort to minimize the negative impact of land acquisition and resettlement is described as follows:
Station 1
It is planned to construct scissor crossings for the purpose of shuttling and emergency use. If the cut and cover method is applied for the construction of the entire station including the scissors portion in the currently proposed area, acquiring two additional residential buildings and a mosque with clinics is necessary. Thus, the cut and cover method is not considered to avoid significant impacts caused by land acquisition of these properties.
Station 2
There will be a high possibility of acquisition of a large size of residential building if the cut and cover method is used without any countermeasures. Since the impact of such an acquisition is significant, measures such as underpinning of large residential buildings will be proposed. It is expected that the resettlement of residents will be avoided through this method.
JICA PREPARATORY SURVEY ON GREATER CAIRO METRO LINE NO.4
10.5.3 Estimated Magnitude of Socio-Economic Impacts
(1) Phase 1
Prior to construction for Phase 1, land acquisition and resettlement for construction of stations, exits and annexes will be necessary at the following stations, although some mitigation measures will be taken as mentioned above. Table 10-13 gives a summary of the estimated magnitude of the proposed land acquisition and resettlement, while Annex 10-2 provides detailed information on the properties to be demolished.
a) Station 1
Land acquisition is necessary since this station is planned to be made with the cut and cover method. Due to construction of the station, land acquisition of one residential building, a part of an orphanage, a part of a hospital, and eight shops will be necessary. In addition, nine street stalls will be requested to relocate during construction.
b) Station 2
Land acquisition for exits and station construction is necessary. It will be necessary to acquire one gas station and two fast food restaurants to permit construction. In addition, it will be necessary to acquire three shops for the construction of exits. However, resettlement of residents due to land acquisition is not expected.
c) Station 3
It is expected to acquire eight shops for the construction of station exits (i.e., 3 shops for exit construction and 5 shops for cooling tower and ventilation installation). In addition, it will be necessary to acquire open space, including a garden on private land, for the installation of a cooling tower.
d) Station 4
This is the connection to El Giza station of Metro Line 2, and therefore an appropriate traffic arrangement, such as preparation of bus terminal, is necessary. Land acquisition is necessary to allow construction of this terminal. Although resettlement of residents is not expected, temporary relocation of 27 street stalls is required.
e) Stations 5 to 15 except Stations 6, 10 and 12
In the cases of stations 5 to 15 of Phase 1, no resettlement of residents is expected, since the existing road width is sufficient for station construction. However, land acquisition of open spaces, including a garden on private land and a footpath on public land will be necessary to allow the construction of exits and the installation of a cooling tower.
f) Station 6
Four exits are planned to be constructed, where two are planned to be constructed in public spaces, such as sidewalks. The remaining two exits will require land acquisition of an open space from a public school.
Final Report - Volume 3 10-23

JICA PREPARATORY SURVEY ON GREATER CAIRO METRO LINE NO.4
Final Report - Volume 3 10-24
g) Station 10
Land acquisition for construction of an exit is necessary. The planned location for the exit is inside the area of a government hospital. Therefore, it is expected that land ownership be transferred through negotiation with the relevant ministries.
h) Station 12
Land acquisition for facility installation and exit construction is necessary. As for facility installation, it is planned to use a public land, which is reported to be owned by the Ministry of Tourism. Therefore, transfer of ownership between ministries is necessary.
Table 10-13 Expected Magnitude of Land Acquisition and Resettlement at Phase 1
Land Residential Building Shops Social Service
Street Stall
Displaced Persons5
No. Private (m2) (*1)
Public (m2) (*1)
Total Area
(m2) (*1)
Affected Building
(*2)
Affected Family
(*3)
Total Area(m2) (*1)
Affected Shop No.
Affected Area (*2)
Affected Number
(*4)
Expected Number (person)
1 - - 2,700 1 11 1,394 6(*5) 3,334 9 472 - 155 - - - 1,900 6 - - - 3 105 293 - - - 844 8 - - - 4 315 100 - - - - - 2,115(*6) 27 - 5 - 400 - - - - - - - - 6 - 670 - - - - - - - - 7 60 533 - - - - - - - - 8 358 538 - - - - - - - - 9 - 370 - - - - - - - - 10 409 255 - - - - - 255 - - 11 250 100 - - - - - 265 - 12 30 595 - - - - - - - - 13 - - - - - - - - - - 14 - - - - - - - - - - 15 - - - - - - - - - -
Remarks: *1: Information about total area is obtained form the drawings based on satellite image. *2: Information is obtained through site investigation. *3: Information about affected family number is obtained from site investigation and interviews with the
neighbourhood *4: Information is obtained through site investigation. *5: Two shops which did not open at the time of site investigation are included. *6: Only necessary area for construction in the bus terminal is calculated. Source: JICA Study Team
(2) Phase 2
Land acquisition and resettlement are necessary at Station 2 and Station 8, respectively. For Station 2, five residential buildings and two shops will be acquired. For Station 8, six residential buildings will be acquired. The estimated magnitude of land acquisition and resettlement is summarized in the following table and Annex 10-2 shows detailed information of the properties to be demolished.
5 Displaced persons is defined as those who are requested physical displacement in this report.

JICA PREPARATORY SURVEY ON GREATER CAIRO METRO LINE NO.4
Table 10-14 Expected Magnitude of Land Acquisition and Resettlement at Phase 2 Sta. Land Residential Building Shops Street Stall No. (m2) (*1) Total
Area (m2) (*1)
No. of Affected Building
No. of Affected
Family (*3)
Total Area(m2)
No. of Affected Shop (*4)
No. of Affected
Street Stall (*4)
2 2,890 2,310 5 27 150 2 - 8 - 15,520 6 119 2,520 30 - Remarks are same at the Table 10-13. Source: JICA Study Team 10.5.4 Preliminary Cost Estimation for Compensation
(1) Condition for Preliminary Estimation of Compensation Cost
Preliminary compensation estimation is composed of costs such as i) private land acquisition; ii) private property acquisition (mainly residential flat); iii) commercial property acquisition (mainly small shops); iv) allowances for flat tenants including moving cost; v) allowances of income restoration for shops including moving cost; and vi) administration fee. In addition, preliminary compensation is estimated with the following conditions:
i) Cash compensation is provided to all PAPs, instead of providing alternatives.
ii) For public lands such as sidewalks, land in governmental hospital, and space in public
schools, compensation amount is not estimated since it is said that land acquisition of
public land is done through ownership transfer between relevant ministries.
iii) Properties which are difficult to distinguish as public or private from external
appearance are regarded as privately owned.
iv) Since during the F/S stage, it is impossible to distinguish the status of property
ownership for flats whether they are owners or tenants. Therefore, a residential building
is considered as owned by one owner and households living in flats are regarded as
tenants.
v) The unit cost of flats is composed of costs for land and property. These costs cannot be
separated in any practical manner.
vi) The unit price of land and flats is identified from interviews with local real estate agents
at each station location.
vii) The allowance for tenants is assumed to be based from the experience with the Metro
Line 3 project, without any modification. In addition, one family is estimated to have
three rooms in their flat.
viii) Allowance for shops, such as rehabilitation assistance, is estimated by referring to the
average monthly salary data collected from the household survey conducted by JICA
Study Team, since JICA Study Team does not have the right to obtain exact data.
ix) The number of workers in shops is estimated to be four based on the result of
Final Report - Volume 3 10-25
JICA PREPARATORY SURVEY ON GREATER CAIRO METRO LINE NO.4
socio-economic interview survey.
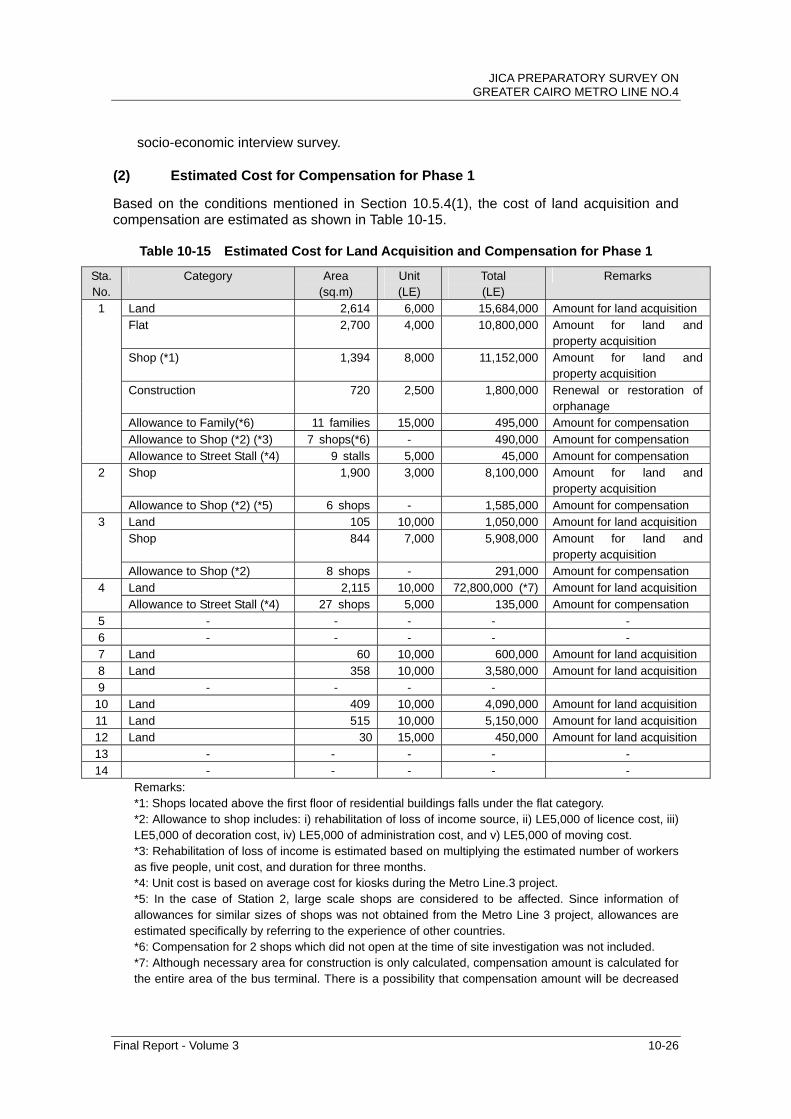
(2) Estimated Cost for Compensation for Phase 1
Based on the conditions mentioned in Section 10.5.4(1), the cost of land acquisition and compensation are estimated as shown in Table 10-15.
Table 10-15 Estimated Cost for Land Acquisition and Compensation for Phase 1
Sta. No.
Category Area (sq.m)
Unit (LE)
Total (LE)
Remarks
1 Land 2,614 6,000 15,684,000 Amount for land acquisition Flat 2,700 4,000 10,800,000 Amount for land and
property acquisition Shop (*1) 1,394 8,000 11,152,000 Amount for land and
property acquisition Construction 720 2,500 1,800,000 Renewal or restoration of
orphanage Allowance to Family(*6) 11 families 15,000 495,000 Amount for compensation Allowance to Shop (*2) (*3) 7 shops(*6) - 490,000 Amount for compensation Allowance to Street Stall (*4) 9 stalls 5,000 45,000 Amount for compensation
2 Shop 1,900 3,000 8,100,000 Amount for land and property acquisition
Allowance to Shop (*2) (*5) 6 shops - 1,585,000 Amount for compensation 3 Land 105 10,000 1,050,000 Amount for land acquisition Shop 844 7,000 5,908,000 Amount for land and
property acquisition Allowance to Shop (*2) 8 shops - 291,000 Amount for compensation
4 Land 2,115 10,000 72,800,000 (*7) Amount for land acquisition Allowance to Street Stall (*4) 27 shops 5,000 135,000 Amount for compensation
5 - - - - - 6 - - - - - 7 Land 60 10,000 600,000 Amount for land acquisition 8 Land 358 10,000 3,580,000 Amount for land acquisition 9 - - - - 10 Land 409 10,000 4,090,000 Amount for land acquisition 11 Land 515 10,000 5,150,000 Amount for land acquisition 12 Land 30 15,000 450,000 Amount for land acquisition 13 - - - - - 14 - - - - -
Remarks: *1: Shops located above the first floor of residential buildings falls under the flat category. *2: Allowance to shop includes: i) rehabilitation of loss of income source, ii) LE5,000 of licence cost, iii) LE5,000 of decoration cost, iv) LE5,000 of administration cost, and v) LE5,000 of moving cost. *3: Rehabilitation of loss of income is estimated based on multiplying the estimated number of workers as five people, unit cost, and duration for three months. *4: Unit cost is based on average cost for kiosks during the Metro Line.3 project. *5: In the case of Station 2, large scale shops are considered to be affected. Since information of allowances for similar sizes of shops was not obtained from the Metro Line 3 project, allowances are estimated specifically by referring to the experience of other countries. *6: Compensation for 2 shops which did not open at the time of site investigation was not included. *7: Although necessary area for construction is only calculated, compensation amount is calculated for the entire area of the bus terminal. There is a possibility that compensation amount will be decreased
Final Report - Volume 3 10-26

JICA PREPARATORY SURVEY ON GREATER CAIRO METRO LINE NO.4
to the necessary area only (around 30% to the entire area) as a result from negotiations with land owners.
Source: JICA Study Team
Table 10-16 Estimated Cost for Land Acquisition and Compensation for Phase 2
Sta. No.
Category Area (sq.m)
Unit (LE)
Total (LE)
Remarks
2 Flat 2,310 3,000 6,930,000 amount for land and property acquisition
Shop(*1) 150 15,000 2,250,000 amount for land and property acquisition
Parking 1,244 6,000 7,464,000 amount for land acquisition
Garden 1,665 6,000 9,990,000 amount for land acquisition
Allowance to Family 27 families 15,000 1,215,000 amount for compensation Allowance to Shop (*2)(*3) 2 shops - 122,000 amount for compensation8 Flat 15,520 7,000 108,640,000 amount for land and
property acquisition Shop(*1) 2,520 10,000 25,250,000 amount for land and
property acquisition Allowance to Family 119 families 15,000 6,435,000 (*4) amount for compensation Allowance to Shop (*2)(*3) 30 shops - 2.100,000 amount for compensation
Remarks: *1: Shops located above the first floor of residential buildings falls under the flat category. *2: Allowance to shop includes: i) rehabilitation of loss of income source; ii) LE5,000 of licence cost; iii) LE5,000 of decoration cost; iv) LE5,000 of administration cost; and v) LE5,000 of moving cost. *3: Rehabilitation of loss of income is estimated based on multiplying the estimated number of workers as five people, unit cost, and duration for three months. *4: Compensation cost is calculated for the entire rooms of a residential building regardless of some empty rooms. That means, there were 24 empty rooms in total in the residential buildings at Station 8 during site investigation, and compensation to these rooms are included in the calculation.
Source: JICA Study Team
10.6 Plan of Population Census for Potential PAPs
As mentioned in the procedure of land acquisition in Section 10.2.2, identifying potential PAPs is the first step for implementing land acquisition and resettlement. Identification of potential PAPs in the early stages of a project will help avoid influx of squatters and unnecessary compensation to them. In addition, it is also expected that cooperation from potential PAPs will enhance by disclosing appropriate information in a timely manner.
Potential PAPs will be identified by conducting a population census, which is regarded as the stage of preliminary survey in the Egyptian procedure mentioned in the implementation schedule (see Section 10.4.7). The preliminary survey will be conducted by the relevant departments in governorates in cooperation with NAT after the project area is almost delineated. In these circumstances, it is emphasized that all relevant bodies should have close communications for the smooth execution of census. The implementation schedule is given in Table 10-11 and Table 10-12 for Phases 1 and 2, respectively.
Final Report - Volume 3 10-27
JICA PREPARATORY SURVEY ON GREATER CAIRO METRO LINE NO.4
Final Report - Volume 3 10-28
It is necessary to consider donor policies in conducting the population census. Questions to be covered in the population census are outlined below, and Annex 10-3 provides these in detail.
Number of target properties
Names of household heads in the target properties
Family structure with number
Legal status of the property
Living period in the property

CHAPTER 11 ARCHAEOLOGICAL ASSESSMENT STUDY
JICA PREPARATORY SURVEY ON GREATER CAIRO METRO LINE NO.4
CHAPTER 11 ARCHAEOLOGICAL ASSESSMENT STUDY
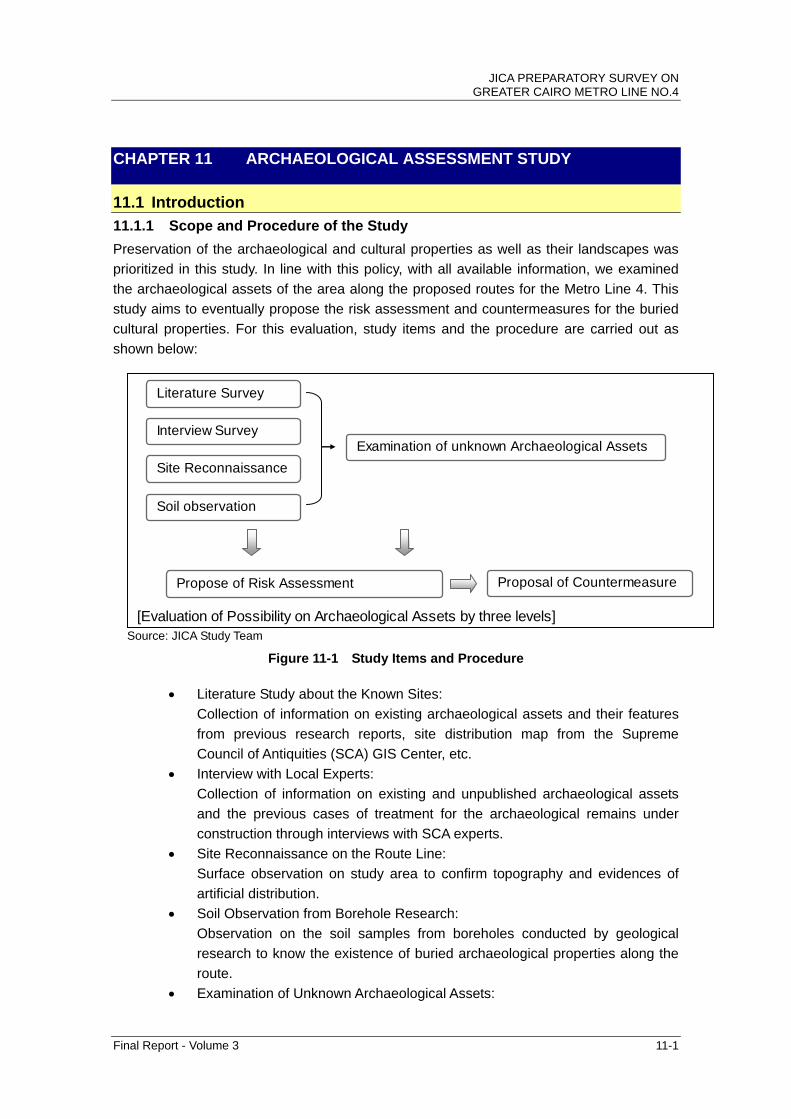
11.1 Introduction
11.1.1 Scope and Procedure of the Study
Preservation of the archaeological and cultural properties as well as their landscapes was
prioritized in this study. In line with this policy, with all available information, we examined
the archaeological assets of the area along the proposed routes for the Metro Line 4. This
study aims to eventually propose the risk assessment and countermeasures for the buried
cultural properties. For this evaluation, study items and the procedure are carried out as
shown below:
[Evaluation of Possibility on Archaeological Assets by three levels]
Literature Survey
Interview Survey
Site Reconnaissance
Soil observation
Examination of unknown Archaeological Assets
Propose of Risk Assessment Proposal of Countermeasure
Source: JICA Study Team
Figure 11-1 Study Items and Procedure
Literature Study about the Known Sites:
Collection of information on existing archaeological assets and their features
from previous research reports, site distribution map from the Supreme
Council of Antiquities (SCA) GIS Center, etc.
Interview with Local Experts:
Collection of information on existing and unpublished archaeological assets
and the previous cases of treatment for the archaeological remains under
construction through interviews with SCA experts.
Site Reconnaissance on the Route Line:
Surface observation on study area to confirm topography and evidences of
artificial distribution.
Soil Observation from Borehole Research:
Observation on the soil samples from boreholes conducted by geological
research to know the existence of buried archaeological properties along the
route.
Examination of Unknown Archaeological Assets:
Final Report - Volume 3 11-1

JICA PREPARATORY SURVEY ON GREATER CAIRO METRO LINE NO.4
Final Report - Volume 3 11-2
Examination of the location and features of unknown buried assets based on
collected information.
Results of these researches were combined to consider the possibility of
unknown archaeological properties. Then, risk assessment was evaluated in
three levels with dividing small areas along the proposed routes. Finally,
countermeasures were proposed in accordance with the risk assessment.
In addition, to understand the work procedure and treatment for the possible findings, the
legal system for archaeological properties and SCA were examined.
11.2 Examination of the Legal System and SCA’s Organization
11.2.1 Legal System
The Egyptian legal system, Law No. 117/1983 “Protection of Antiquities”, is the fundamental
regulation for all issues concerning cultural assets1. The law stipulates all antiquities, even
those yet to be discovered, are regarded as the possession of Egypt. It also regulates that
the Egyptian Antiquities Authority has all responsibility for archaeological and historical
properties, and has authority for the excavation, restoration and protection of antiquities.
The “Authority” mentioned in the law means the present SCA, which was reorganized by
virtue of the Presidential Decree Number 82 of 1994.
This law consists of 51 articles, in which some essential and relevant to our project are
outlined below:
a) Article 5
The Egyptian Antiquities Authority shall be the quarter concerned with control and supervision of all antiquities affairs in the antique, ancient and historical sites and areas, even if these have been come across by accident.
b) Article 17
Violating party shall restore the situation to its original condition, otherwise the Authority may proceed with restoring it to its original condition at the cost of the violator.
c) Article 20
No construction licenses shall be granted for archaeological sites and lands. No third party shall erect establishments or build roads in archaeological sites or the lands lying within the approved lines of beautification of such antiquities.
d) Article 23
Any person who discovers and finds a real antiquity shall notify the Authority. The Authority shall take steps as necessary to preserve and maintain such antiquity, and it shall have the power within three months either to lift the antiquity existing in
1 It was purchased at The Middle East Library for Economic Services, Agouza
JICA PREPARATORY SURVEY ON GREATER CAIRO METRO LINE NO.4
Final Report - Volume 3 11-3
the realty of individuals, or take steps of land expropriation where the antiquity is found, or leave the antiquity in its place. The value of antiquities existing in the expropriated land shall not enter in the estimation of its value.
e) Article 24
Any person who comes accidentally across antiquity shall notify such discovery to the nearest administrative department within 48 hours, and preserve and maintain it until the appropriate authority shall receive it, otherwise he shall be considered as holder of the antiquity without being licensed therefore. The department shall also notify the Authority thereof, on the spot.
To summarize the articles, the points regarding this study are as follows:
No construction is permitted on the existing archaeological sites.
Any antiquities which would be discovered must be reported to the SCA within
48 hours.
The SCA shall determine appropriate countermeasure on the antiquities. 11.2.2 SCA Organization2
SCA is an agency under the Ministry of Culture. In SCA, the Administrative Council acts as
a governing body in which the President of the Council is the Minister for Culture who is the
sole legal representative of SCA. Their tasks are undertaken by six sectors: the General
Secretariat Sector; the Egyptian (Pharaonic) and Greco-Roman Antiquities Sector; the
Coptic and Islamic Antiquities Sector; the Antiquities and Museum Financial Support Fund
Sector; the General Projects Sector; and the Museums Sector. The heads of the six sectors
form the executive core of the Administrative Council as permanent members (ex officio; by
virtue of their office) in which the head of the General Secretariat Sector, the General
Secretary, acts as the executive head of SCA.
The SCA has Inspectorate Offices in each governorate to manage the excavation,
management and supervision on their jurisdiction. As mentioned in Law No. 117/1983
Article 24, discovery of antiquities should be informed to the nearest administrative
department, which corresponds to the present Inspectorate Office. The local Inspectorate
Offices, which cover the area along the planning route of Metro Line 4 in the Greater Cairo,
are listed in Table 11-1.
2 It was referred to SCA Homepage (Eternal Egypt http://www.eternalegypt.org/).
JICA PREPARATORY SURVEY ON GREATER CAIRO METRO LINE NO.4
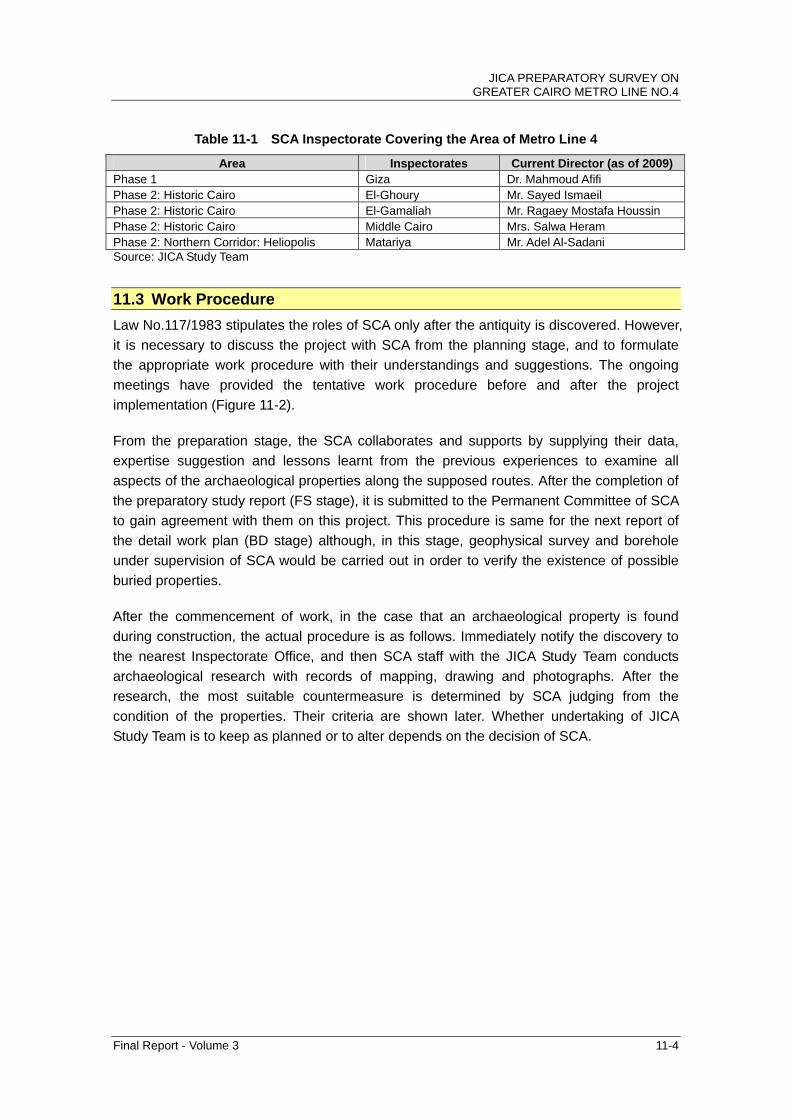
Table 11-1 SCA Inspectorate Covering the Area of Metro Line 4
Area Inspectorates Current Director (as of 2009)Phase 1 Giza Dr. Mahmoud Afifi Phase 2: Historic Cairo El-Ghoury Mr. Sayed Ismaeil Phase 2: Historic Cairo El-Gamaliah Mr. Ragaey Mostafa Houssin Phase 2: Historic Cairo Middle Cairo Mrs. Salwa Heram Phase 2: Northern Corridor: Heliopolis Matariya Mr. Adel Al-Sadani Source: JICA Study Team
11.3 Work Procedure
Law No.117/1983 stipulates the roles of SCA only after the antiquity is discovered. However,
it is necessary to discuss the project with SCA from the planning stage, and to formulate
the appropriate work procedure with their understandings and suggestions. The ongoing
meetings have provided the tentative work procedure before and after the project
implementation (Figure 11-2).
From the preparation stage, the SCA collaborates and supports by supplying their data,
expertise suggestion and lessons learnt from the previous experiences to examine all
aspects of the archaeological properties along the supposed routes. After the completion of
the preparatory study report (FS stage), it is submitted to the Permanent Committee of SCA
to gain agreement with them on this project. This procedure is same for the next report of
the detail work plan (BD stage) although, in this stage, geophysical survey and borehole
under supervision of SCA would be carried out in order to verify the existence of possible
buried properties.
After the commencement of work, in the case that an archaeological property is found
during construction, the actual procedure is as follows. Immediately notify the discovery to
the nearest Inspectorate Office, and then SCA staff with the JICA Study Team conducts
archaeological research with records of mapping, drawing and photographs. After the
research, the most suitable countermeasure is determined by SCA judging from the
condition of the properties. Their criteria are shown later. Whether undertaking of JICA
Study Team is to keep as planned or to alter depends on the decision of SCA.
Final Report - Volume 3 11-4

JICA PREPARATORY SURVEY ON GREATER CAIRO METRO LINE NO.4
Preparation of ReportData collectionSoil observation
Assessmentetc.
SCA’s collaboration forData supply
Expertise suggestionInspection
etc.
Submission of Report to SCA
Approval of Report by SCA
Review of Report by SCA
Recommendations from SCA
Amendment of Report
Application of the Work Plan to SCA
Approval of the Work Plan by SCA
Optional surveyGeophysical ExplorationBorehole
Preparation of detail Work Plan
SCA’s supervision
Commencement of the Work
Report to SCA
Chance Find!!
Research by SCA + JST
Completion
SCA’ssupervision
Data recoveryand rescue
Alteration of siteAnd/or undertaking
Countermeasure determined by SCA
Legend: Work to be done by JST
Work to be done by SCA
BEFORE the
Commencementof the w ork
AFTER theCommencementof the w ork
Source: JICA Study Team
Figure 11-2 Work Procedure of Archaeological Asset Study
Final Report - Volume 3 11-5

JICA PREPARATORY SURVEY ON GREATER CAIRO METRO LINE NO.4
11.4 Baseline Information
To confirm the location and characteristics of the archaeological properties along the route
of Metro Line 4, examination of literature and interviews with SCA and relevant authorities
were undertaken. In addition, this baseline information is reinforced by the up-to-date digital
map showing the location of the archaeological and historical sites with a description of
their value, which was prepared by SCA-GIS Center.
Source: JICA Study Team
Figure 11-3 Map Showing Location of Existing Archaeological Properties at Giza Area
11.4.1 Phase 1: Giza Area
(1) G-1: Desert Area near Workshop (Depot)
Around the desert area where the workshop is planned to be constructed, there have been
no reports on the existence of archaeological properties. Confirmation of this general
survey was conducted on the area. This survey was especially focused on area from the
proposed depot site to the back of the Grand Egyptian Museum (GEM), which covers about
6.0 km extending west to east. Although it was a surface observation by walk, there
appeared to be no archaeological remains on the desert area. This result is also in
agreement with the literature data and historical perspective of the Giza Plateau, which
show that the archaeological sites have been found at the fringe of the Nile alluvial
cultivation area.
Final Report - Volume 3 11-6
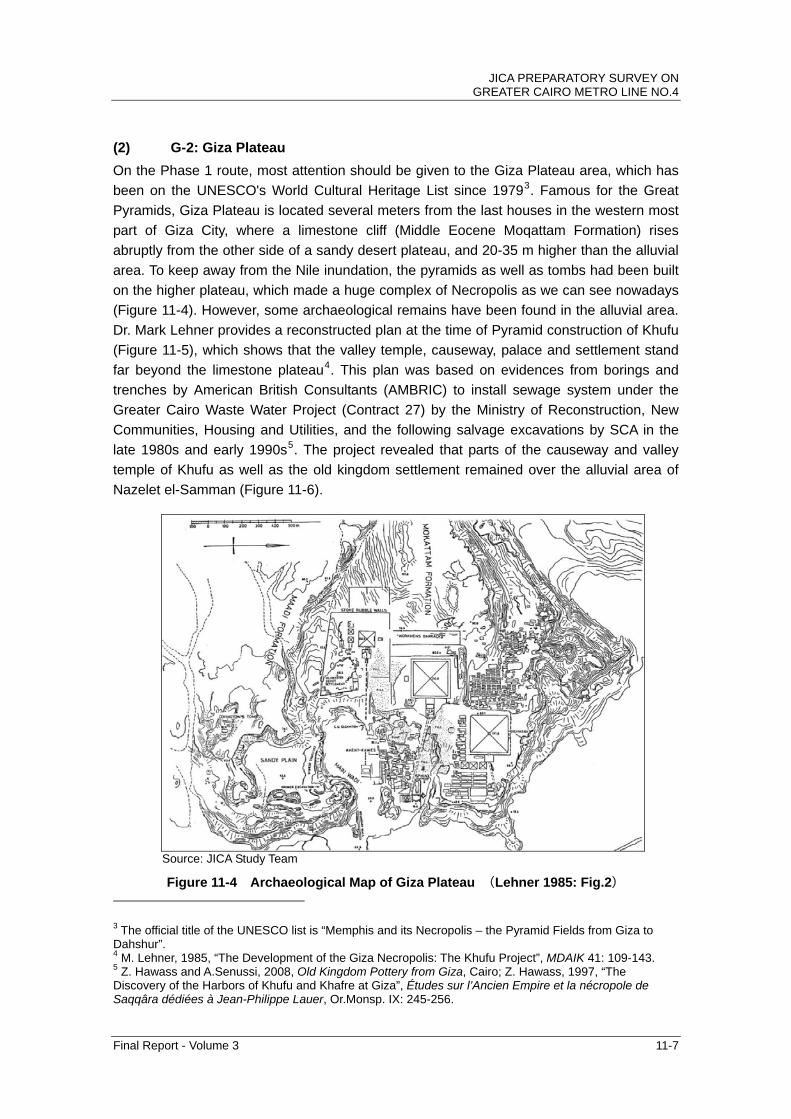
JICA PREPARATORY SURVEY ON GREATER CAIRO METRO LINE NO.4
Final Report - Volume 3 11-7
(2) G-2: Giza Plateau
On the Phase 1 route, most attention should be given to the Giza Plateau area, which has
been on the UNESCO's World Cultural Heritage List since 19793. Famous for the Great
Pyramids, Giza Plateau is located several meters from the last houses in the western most
part of Giza City, where a limestone cliff (Middle Eocene Moqattam Formation) rises
abruptly from the other side of a sandy desert plateau, and 20-35 m higher than the alluvial
area. To keep away from the Nile inundation, the pyramids as well as tombs had been built
on the higher plateau, which made a huge complex of Necropolis as we can see nowadays
(Figure 11-4). However, some archaeological remains have been found in the alluvial area.
Dr. Mark Lehner provides a reconstructed plan at the time of Pyramid construction of Khufu
(Figure 11-5), which shows that the valley temple, causeway, palace and settlement stand
far beyond the limestone plateau4. This plan was based on evidences from borings and
trenches by American British Consultants (AMBRIC) to install sewage system under the
Greater Cairo Waste Water Project (Contract 27) by the Ministry of Reconstruction, New
Communities, Housing and Utilities, and the following salvage excavations by SCA in the
late 1980s and early 1990s5. The project revealed that parts of the causeway and valley
temple of Khufu as well as the old kingdom settlement remained over the alluvial area of
Nazelet el-Samman (Figure 11-6).
Source: JICA Study Team
Figure 11-4 Archaeological Map of Giza Plateau (Lehner 1985: Fig.2) 3 The official title of the UNESCO list is “Memphis and its Necropolis – the Pyramid Fields from Giza to Dahshur”. 4 M. Lehner, 1985, “The Development of the Giza Necropolis: The Khufu Project”, MDAIK 41: 109-143. 5 Z. Hawass and A.Senussi, 2008, Old Kingdom Pottery from Giza, Cairo; Z. Hawass, 1997, “The Discovery of the Harbors of Khufu and Khafre at Giza”, Études sur l’Ancien Empire et la nécropole de Saqqâra dédiées à Jean-Philippe Lauer, Or.Monsp. IX: 245-256.

JICA PREPARATORY SURVEY ON GREATER CAIRO METRO LINE NO.4
①Pyramid of Khufu ②Causeway ③Valley Temple ④Palace and Settlement
①
②
③
④
Source: JICA Study Team
Figure 11-5 Reconstruction Plan at the Time of Pyramid Construction of Khufu (Lehner 1985: Fig.3C) (Red line: Modern Border between Desert and Alluvial Areas)
Final Report - Volume 3 11-8

JICA PREPARATORY SURVEY ON GREATER CAIRO METRO LINE NO.4
Final Report - Volume 3 11-9
Source: JICA Study Team
Figure 11-6 Map of Sewers with Spots of Archaeological Founds (Hawass and Senussi 2008: Plan 6) (Blue: Architectural Remains, Red: Scattered Objects)
(3) G-3: Near El Remayah Square
The Greater Cairo Waste Water Project covered a wide area stretching 3 km to the north
from the plateau, where a large amount of pottery sherds and some mudbrick structures
were found scattered around the El Remayah Square and the Pyramids Street (Figure 11-6,
Figure 11-7). In response to this, the archaeological works were conducted by SCA in 1992.
In this research, an open trench excavation and over 400 borings were conducted on the
wider area. The trench excavation was carried out on the north-east side of the Mansouria
Canal Road6 near the El Remayah Square. In the trench, there were discoveries of some
pottery vessels and a fragment of a basalt beaker, which are parallel in shape to those from
Predynastic Maadi Culture context7. The vessels were buried at the depth of 6.5-6.8 m
below the road surface.
A series of boreholes were mainly made beside the Marrioutia Canal8. Archaeological
deposits composed of pottery fragments and other indicators of human presence were
recognized at the elevation of 12 m in borings 1 and 7, and at 7.5 m in Boring 8. The former
6 The Mansouria Canal was dug in the 1930s. 7 A. El-Sanussi and M. Jones, 1997, “A Site of the Maadi Culture near the Giza Pyramids”, MDAIK 53: 241-253. 8 The Maryoutia Canal is considered to have been used since Ancient time.
Pyramid Street
el-Remaya Square
Marrioutia Canal
el-Mansouria Canal

JICA PREPARATORY SURVEY ON GREATER CAIRO METRO LINE NO.4
Final Report - Volume 3 11-10
elevation is almost equivalent to the results of the boreholes in the Nazelet el-Samman
area.
A probable reason that archaeological remains were found deep in the Marrioutia Canal
was due to the migration of the Nile. The Nile channel is supposed to be moving laterally at
rates of up to 9 km per 1000 years, and on the Giza area, the Nile appears to shift
eastward. Based on their topographical map around the Giza, it is suggested that a branch
of the Nile was located to the far west of the valley prior to the building of Giza pyramids,
and the Marrioutia Canal is a former levee in ancient time9. The levee is suitable for the
living place because the Nile flood did not reach the area.
In addition, according to authors, there was a previous report of Maadi Culture pottery
found at Giza in 1898. It described that two small oval jars (egg-shaped with short necks
and not very prominent lips) were found during the construction of a part of a tramway near
the Giza Pyramids. Although the provenance is not exactly known, the authors suggest that
the spot is probably close to the northern edge of the present Mena House golf course or a
little further east along the Pyramids Street.
9 K. Lutley and J. Bunbury, 2008, “The Nile on the move”, Egyptian Archaeology 32: 3-5.

JICA PREPARATORY SURVEY ON GREATER CAIRO METRO LINE NO.4
Source: JICA Study Team
Figure 11-7 Map with Location of Trench Excavation and Borings (El-Sanussi and Jones 1997: Fig.2)
Final Report - Volume 3 11-11

JICA PREPARATORY SURVEY ON GREATER CAIRO METRO LINE NO.4
Final Report - Volume 3 11-12
(4) G-4: Dokki
There have been no archaeological reports about the area of the eastern portion of the
Pyramid Street and around the Giza Station, but two archaeological spots were found at the
Dokki area. The first was discovered in 1993 roughly 100 m north of the Dokki Square,
which was also during the work of the Greater Cairo Waste Water Project Contract 20A.
The discovery was made during the manually operated drilling of three well points for
dewatering in advance of open trench excavation, and followed by rescue research by SCA.
They only found scattered movable artifacts composed of potsherds, redbrick limestone
fragments, quartzite chips and pieces of broken bone at a depth of 15.0 to 18.0 m beneath
the modern road surface, which is 20.7 m above sea level.
Information of the second spot was obtained from the interview with Dr. Mahmoud Afifi,
General Director of Giza Antiquities. Two pottery jars were found at the 60 m deep during
the construction of the Bohooth Station of the Metro Line 2 near the Tahrir Street. Because
there were no scientific reports, the detail is unknown.
11.4.2 Phase 1: Near El Malek El Saleh Station (G5) The area south to El Malek El Saleh Station is famous for the monuments from Roman and
Christian to Islamic times, e.g., Babylon, Hanging Church and Amr Mosque; however,
Pharaonic sites were also reported10. Late period tombs were found in the quarry site and
other Ramesside monuments were recorded to the south at Athar Al-Nabi, which is
supposed to be the place called Pi-Hapi (House of God Hapi) in Pharaonic time.
11.4.3 Phase 2: Historic Cairo Area Known as a UNESCO World Heritage registered area, the Historic Cairo encompasses a
number of cultural monuments; especially standing historical properties. Based on the
digital map produced by SCA-GIS Center and the literature survey11, the important sites
located close to the proposed metro route are listed below (Figure 11-8, Figure 11-9).
(1) Northern Corridor
GIS No. 114: Qanatir al-Miyah (Magra al-'Uyun Wall) Location: Route intersection Description: Known as an aqueduct running from Fumm Al-Khalig on the bank of the Nile to the Sayeda Aisha area of Cairo, the wall was built in the reign of Sultan Al-Nasser Mohamed Ibn Qalawun at the beginning of the 14th century (Mamluk Period). Afterwards, a plan was instigated to construct waterwheels linking up with the great Al-Qanatir barrages, north of Cairo, and channelling water to the citadel. Water flowed through the aqueduct as
10 D. Jeffreys and A. Tavares, 1994, “The Historic Landscape of Early Dynastic Memphis”, MDAIK 50: 143-173. 11 Referred mainly to N. Warner, 2005, The Monuments of Historic Cairo: A Map and Descriptive Catalogue, Cairo.

JICA PREPARATORY SURVEY ON GREATER CAIRO METRO LINE NO.4
far as the Citadel of Salaheddin. The aqueduct remained an integral part of the Cairo water system until the mid 19th century. GIS No. 101: Mosque and shrine of 'Ali Zayn al-'Abidin Location: 50 m to the east Description: The mosque dates back to the Fatimid period. It is believed that the mosque is dedicated to Ali Zein Al-Abedeen, the son of El-Hussein, prophet Mohamed’s grandson. The mosque has been renovated and enlarged to 4,600 m2. GIS No. 39: As-Sayyidah Zaynab mosque area Location: 30 m to the west
Description: This mosque is dedicated to Sayeda Zeinab, daughter of Aly Ibn and Abu Taleb, and the granddaughter of the prophet Mohammed. Her mosque which houses her shrine is located in the Sayeda Zeinab Mosque built originally at the time of the Hussein Mosque. Her mosque was set up shortly after her arrival to Egypt on the appearance of the new crescent moon of Shaaban (the eighth month of the Hegira calendar) in the year 61 A.H (AD 680 – 681, Islamic Period). It was renovated in 1549, rebuilt again in 1761 and completely rebuilt in 1884 and 1942. The main façade, minaret and cupola are typical of the Mameluke style. The interior is finely decorated with arabesque and inscriptions. It contains a colonnaded prayer hall with a painted wood ceiling and cupola in front of the mihrab. The western mausoleum is topped by a cupola also, supported by a pendentive of stalactites, and the cenotaph is enclosed within a finely worked bronze grille.
In this area, there are other historical monuments close to route, i.e., Sabil Ibrahim Bik Al-Mnesterli (GIS No. 154), Al-Ginyid mosque minaret (GIS No. 156), Ibrahim Katkhuda as-Sinnari house and as-Sayyidah Zaynab endowment house (GIS No. 36), Sabil and Kuttab as-Sit Salhah (GIS No. 35), Sabil and mosque of Timraz al-Ahmadi (GIS No. 34), and Zu al-Fuqar Bik mosque (GIS No. 42). GIS No. 31: Khanqah Sa'd ad-Din Ibn Ghurab Location: Above the route Description: This building is known also as the zawiya of Sa’ad al-Din Ibrahim al-Arabi, which is occupied today by SCA offices. A Comité-style kuttab projection in timber to the south side of the portal has been glazed to make an office. The interior has the remains of a fine inlaid marble qibla wall and mihrab. The floor and ceiling are modern, perhaps dating 1910, when the building was remodeled by the Comité. GIS No. 30: Al-Amir Bashtak mosque (interior door and minaret) Location: Beside the route, to the east Description: The minaret and door of the original mosque of the amir Bashtak (AD 1336) have been incorporated into the structure of a 17th century mosque. The portal of the original mosque has an extraordinary deep horizontal muqarnas soffit. A spiral stair leading to the roof level is set within the solid masonry to one side of the portal, while the other side provides the base for the minaret itself. All three tiers of the stone-baluster minaret are intact. GIS No. 32: Sabil Waldit Mustafa Basha Fadel Location: Above the route Description: This is a typical Ottoman-style bow-fronted sabil (AD 1863). The ornate floral bronze grilles appear to be intact, but are boarded over. The marble cladding and inscriptions are generally in good condition. The building is used as a storeroom and is permanently locked. The building was registered in the dying days of the Comité but has no official number.
Final Report - Volume 3 11-13

JICA PREPARATORY SURVEY ON GREATER CAIRO METRO LINE NO.4
GIS No. 28: Sabil Bashir Agha Location: Beside the route, to the east Description: This sabil-kuttab was built by the black eunuch Bashir Agha along traditional Mamluk lines (AD 1718), before he undertook the construction of the following takiya of Sultan Mahmud. It has original bronze grilles with intact shutters and marble basins behind and marble slabs in front of them. The building was extensively restored by the Comité. GIS No. 27: Tikiyyit and Sabil as-Sultan Mahmud Location: Beside the route, to the east Description: This building was constructed for Sultan Mahmud (AD 1750) by the block eunuch Bashir Agha who had already built his own opposite foundation (GIS No. 28). The crenulated façades have two continuous decorative bands of arabesques running around them. The main portal is a pointed arch with cushioned voussoirs, decorative strapwork framing, tiled inlay panels, and marble inscriptions. The courtyard has a central baldachin on four columns at its centre, and is surrounded by an arcade of columns that relates to an outer ring of cell units with shallow pendent domes. The interior is now occupied by the offices of the main inspectorate of SCA’s Coptic and Islamic Section (South Sector). GIS No. 150: Sabil Kalsan Endowement Location: Beside the route, to the west Description: This Ottoman sabil (AD 1689) has a finely decorated interior that belies its rather run-down external appearance. The interior is extremely ornate, with a painted wood ceiling, deep cornice, and flat wooden muqarnas niche-heads on the flank walls, as well as a muqarnas hood to the missing salsabil. This building seems to be a part of the adjacent Aqsunqur dome (GIS No. 151). GIS No. 26: Remains of Katkhuda hostel (Ribat) and ash-Shaykh Ramadan mosque Location: 70 m to the west Description: This complex was originally constructed by Abd al-Rahman Kathhuda (AD 1762), whose decorative style can be seen in the two cusped moulded arches on the northern façade fronting the tomb chamber. There is no evidence of the sabil today, and only the base of the minaret survives. The interior had been recently refurbished. GIS No. 95: Yusuf Agha al-Hin mosque Location: Above the route Description: This mosque was originally built on the Khalig al-Masri (AD 1625). This may account for the presence of the large mashrabiya on the western façade which would have overlooked the canal. The Sabil-kuttab on the eastern façade is original to the complex and is noteworthy for its fine painted wood ceiling. The Ottoman-style minaret is intact. The building was restored by the SCA in 1999. GIS No. 135: Islamic Art museum building Location: Beside the route, to the west Description: The Museum was established by a decree from Khedive Ismail, on an initiative from Ali Pasha Mubarak. By virtue of that decree in AD 1870, the Library of the Egyptian Khedivite occupied the first floor in the Palace of Prince Mustafa Fadel, the Khedive's brother, in Darb Al Gamamiz. As the library grew, the palace became crowded with the collection, and a new location was found in Bab El Khalq Square for the Khedivite Library and the House (Dar) of Arab Antiquities, the present Museum of Islamic Art. The ground floor was allocated to the latter, while the two upper floors were allocated to the former. The library moved to the new premises in the year 1903 and was officially opened in the beginning of the following year. The bulk of the various collections of the museum originate from Egypt and the Arab countries, and as the other regions where Islam dominated. It was reopened and renewed in 2007 to become a magnificent architectural
Final Report - Volume 3 11-14

JICA PREPARATORY SURVEY ON GREATER CAIRO METRO LINE NO.4
masterpiece and a beacon of science and knowledge from which a ray of Arab culture and global climate trends and the movement of cultural and civilization in Egypt. GIS No. 15: Madrasit al-Amir 'Abd al-Ghani al-Fakharani (al-Banat mosque) Location: Beside the route, to the east Description: This mosque was built in AD 1418 for a wazir of Sultan Farag ibn Barquq and al-Mu’ayyad Shaykh. It is known as the Mosque of the Girls (al-banat). The main portal leads through a bent corridor into a courtyard with four iwans. The ceilings of the qibla and western iwans are Comité-period decorated ceilings. It was restored in the nineteenth century by Umm Husayn who added the Ottoman-style minaret, and again most recently (in 2000) by the SCA. GIS No. 13: Al-Qadi Yahya Zayn ad-Din mosque Location: Above the route Description: The building (AD 1444) was originally situated within an urban block beside the Khalig al-Masri, which ran its eastern side. This was heavily restored by the Comité from 1884 to 1897, during which the entire southern façade and part of the northern façade were created. The main entrance is through an inscribed portal at the north that leads through a dog-legged approach into a covered four-iwan madrasa. The minaret remains intact. GIS No. 14: Murad Basha mosque Location: Beside the route, to the east Description: This mosque’s principal façade has two trilobed portals separated by three recessed window bays (AD 1578). A minaret of typical Ottoman design used to stand above the southern portal; it was taken down by the Comité and never rebuilt. The interior of the mosque has four marble columns supporting the roof and a stone mihrab with arabesque carving at its top. GIS No. 11: Abd al-Wahhab ash-Sha'rani dome Location: 70 m to the east Description: ‘Abd al Wahhab ash-Sha'rani was a popular Sufishaykh. The mausoleum (dome) was added to a large complex (AD 1567), including a takiya, mosque, and madrasa, that had been built for ash-Sha'rani during his lifetime by Qadi ‘Abd al-Qadir. Of these buildings, only the mausoleum survives. The interior is decorated with polychrome arabesque painting, which also covers the vault of dome. GIS No. 136: Northern Wall of Cairo Location: Beside the route, to the east Description: As a part of the entire extent of the Ayyubid city walls, the walls in this sector extend west to the Bab al-Shariya and east to the Bab al Futuh. The break in the wall at the Bab al Shariya is marked with a plaque. From the Bab, the wall continued west toward the Bab al-Hadid, and sections of it can be seen at various points along its route.
Final Report - Volume 3 11-15
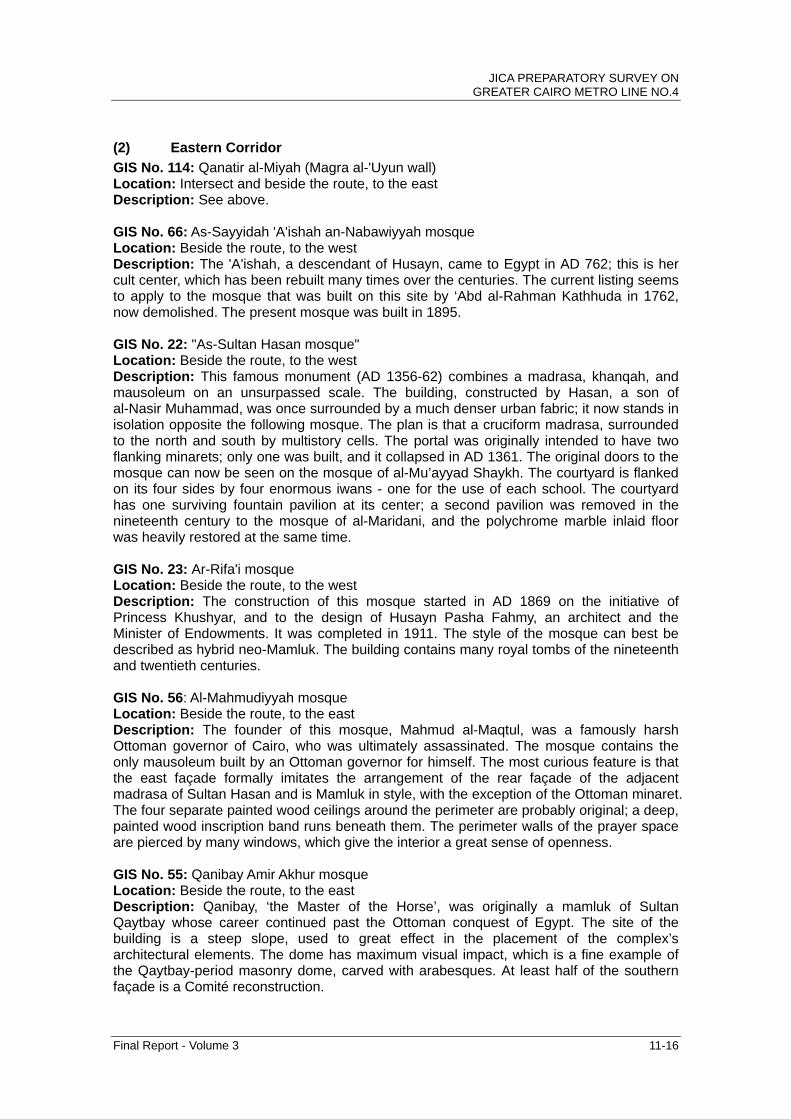
JICA PREPARATORY SURVEY ON GREATER CAIRO METRO LINE NO.4
(2) Eastern Corridor
GIS No. 114: Qanatir al-Miyah (Magra al-'Uyun wall) Location: Intersect and beside the route, to the east Description: See above. GIS No. 66: As-Sayyidah 'A'ishah an-Nabawiyyah mosque Location: Beside the route, to the west Description: The 'A'ishah, a descendant of Husayn, came to Egypt in AD 762; this is her cult center, which has been rebuilt many times over the centuries. The current listing seems to apply to the mosque that was built on this site by ‘Abd al-Rahman Kathhuda in 1762, now demolished. The present mosque was built in 1895. GIS No. 22: "As-Sultan Hasan mosque" Location: Beside the route, to the west Description: This famous monument (AD 1356-62) combines a madrasa, khanqah, and mausoleum on an unsurpassed scale. The building, constructed by Hasan, a son of al-Nasir Muhammad, was once surrounded by a much denser urban fabric; it now stands in isolation opposite the following mosque. The plan is that a cruciform madrasa, surrounded to the north and south by multistory cells. The portal was originally intended to have two flanking minarets; only one was built, and it collapsed in AD 1361. The original doors to the mosque can now be seen on the mosque of al-Mu’ayyad Shaykh. The courtyard is flanked on its four sides by four enormous iwans - one for the use of each school. The courtyard has one surviving fountain pavilion at its center; a second pavilion was removed in the nineteenth century to the mosque of al-Maridani, and the polychrome marble inlaid floor was heavily restored at the same time. GIS No. 23: Ar-Rifa'i mosque Location: Beside the route, to the west Description: The construction of this mosque started in AD 1869 on the initiative of Princess Khushyar, and to the design of Husayn Pasha Fahmy, an architect and the Minister of Endowments. It was completed in 1911. The style of the mosque can best be described as hybrid neo-Mamluk. The building contains many royal tombs of the nineteenth and twentieth centuries. GIS No. 56: Al-Mahmudiyyah mosque Location: Beside the route, to the east Description: The founder of this mosque, Mahmud al-Maqtul, was a famously harsh Ottoman governor of Cairo, who was ultimately assassinated. The mosque contains the only mausoleum built by an Ottoman governor for himself. The most curious feature is that the east façade formally imitates the arrangement of the rear façade of the adjacent madrasa of Sultan Hasan and is Mamluk in style, with the exception of the Ottoman minaret. The four separate painted wood ceilings around the perimeter are probably original; a deep, painted wood inscription band runs beneath them. The perimeter walls of the prayer space are pierced by many windows, which give the interior a great sense of openness. GIS No. 55: Qanibay Amir Akhur mosque Location: Beside the route, to the east Description: Qanibay, ‘the Master of the Horse’, was originally a mamluk of Sultan Qaytbay whose career continued past the Ottoman conquest of Egypt. The site of the building is a steep slope, used to great effect in the placement of the complex’s architectural elements. The dome has maximum visual impact, which is a fine example of the Qaytbay-period masonry dome, carved with arabesques. At least half of the southern façade is a Comité reconstruction.
Final Report - Volume 3 11-16

JICA PREPARATORY SURVEY ON GREATER CAIRO METRO LINE NO.4
GIS No. 57: Ali Labib house Location: Beside the route, to the east Description: This is an Ottoman merchant’s house (18th century AD), with a plastered façade adorned by mashrabiya windows. The small door is surrounded by ornate stone moldings. The interior spaces are grouped around two small courtyards, densely overhung with mashrabiya. The interior was remodelled in the late 19th and early 20th centuries. In more recent times, the top floor of the house served as the studio of the famous Egyptian architect Hassan Fathy. GIS No. 24: Aytumush al-Bagasi mosque Location: Beside the route, to the east Description: Aytumush was an amir of Sultan Barquq who subsequently became the regent for Barquq’s son Farag. He fled Cairo and was killed in Damascus in AD 1400. His empty tomb chamber in this mosque has a distinctive spiral-ribbed brick-and-plaster dome with an inscription at its base. The main façade has a high-level inscription band. The sabil has a fine inscription and cup blazon on its wooden lintel. The Comité restored the stonework on the northern façade and introduced steel ties into the main façade to counteract its outward inclination. The interior is plain, with a newly tiled mihrab, a damaged painted wood ceiling over the main iwan, and a roof with lantern over the sahn.
Final Report - Volume 3 11-17

JICA PREPARATORY SURVEY ON GREATER CAIRO METRO LINE NO.4
Source: SCA-GIS Center
Figure 11-8 SCA-GIS Map Showing Standing Properties in Historic Cairo Area
(Square marks point properties along the route)
Final Report - Volume 3 11-18

JICA PREPARATORY SURVEY ON GREATER CAIRO METRO LINE NO.4
Source: SCA-GIS Center
Figure 11-9 SCA-GIS Map Showing Standing Properties in Historic Cairo Area
(Square marks point properties along the route)
Final Report - Volume 3 11-19

JICA PREPARATORY SURVEY ON GREATER CAIRO METRO LINE NO.4
Final Report - Volume 3 11-20
11.4.4 Phase 2: Matariya Area On the northern route of Phase 2, the area is quite important for archaeological asset. With
the result of site reconnaissance with Adel Al-Sadani, General Director of Matariya
Inspectorate, the distribution of archaeological remains and the current excavations in this
area are reported here.
Called Heliopolis in Greek, the area covering Matariya and Ain Shams was one of the three
main cities and religious centre of Sun cult in ancient Egypt. Despite the city’s importance,
no spectacular monuments could be seen in the area nowadays, except an obelisk of
Senwosert I standing in the small concession area of SCA. Because it is close to Cairo,
most of them were reused for the architectural materials and buried underground of modern
houses and cultivation. However, according to records, there was a ‘temenos’ of God
Ra-Aten and at least 10 temples surrounded by massive mud-brick walls, the scale of
which is estimated to measure some 1.2 km by 1 km at this place (Figure 11-10). Some
parts of the walls have been uncovered, and recent excavations revealed architectural
remains at a depth of 2.0 m beyond the area of SCA (Figure 11-11), which indicates the
archaeological remains spread across wider area.
With confirmations from previous researches (Figure 11-10), tombs of the 6th Dynasty have
been found 550 m southeast of the obelisk, some 950 m to the same direction were tombs
of the Late Period, about 1.3 km northeast of the obelisk was Mnevis Bulls’ tomb12. In
addition, recent excavations uncovered high-official tombs such as Panehsy and Waja-Hor
from the 26th Dynasty, some kilometres east of the obelisk13, and some parts of a sun
temple precinct mainly belonging to Ramesses II about 60 m west of the obelisk14. Adel
Al-Sadani said that around this area the stratum with artifacts starts from 2-3 m below
ground surface to 8.0 m at most.
The planned route directing to El-Sawaha Square runs along the Port Said Street beside
the Ismailiya Nile branch, which is the western end of Matariya district. Figure 11-10 shows
that the sites are clustered in the eastern side, and according to Adel Al-Sadani, no
archaeological evidence has so far been uncovered in the west. However, the German
mission working on the sun temple of Ramesses II assumes that the temple of Heliopolis
was connected to the Nile branch by a canal, and had a large gate and sphinx avenue to
the west. Hence, there is a possibility that archaeological properties are also buried around
the western area.
12 J. Baines and J. Malek, 1980, Atlas of Ancient Egypt, Oxford; A. Dodson, 2005, “ Bull Cults”, in S. Ikram (ed.), Divine Creatures: Animal Mummies in Ancient Egypt, Cairo and New York: 72-105. 13 N. El-Aref, 2006, “Empire of the sun”, Al-Ahram Weekly 784, 2-8 March. 14 SCA, 2006, Antiquities of Egypt: SCA’s Monthly Letter 1: 5; Deutsches Archäologisches Institut, 2006, Rundbrief 2006: 21-24.

JICA PREPARATORY SURVEY ON GREATER CAIRO METRO LINE NO.4
Source: JICA Study Team
Figure 11-10 Site Distribution Map in the Matariya Area (based on Dodson 2005: Fig.4.5)
Source: JICA Study Team
Figure 11-11 Pavements Uncovered Outside of SCA’s Concession
Final Report - Volume 3 11-21
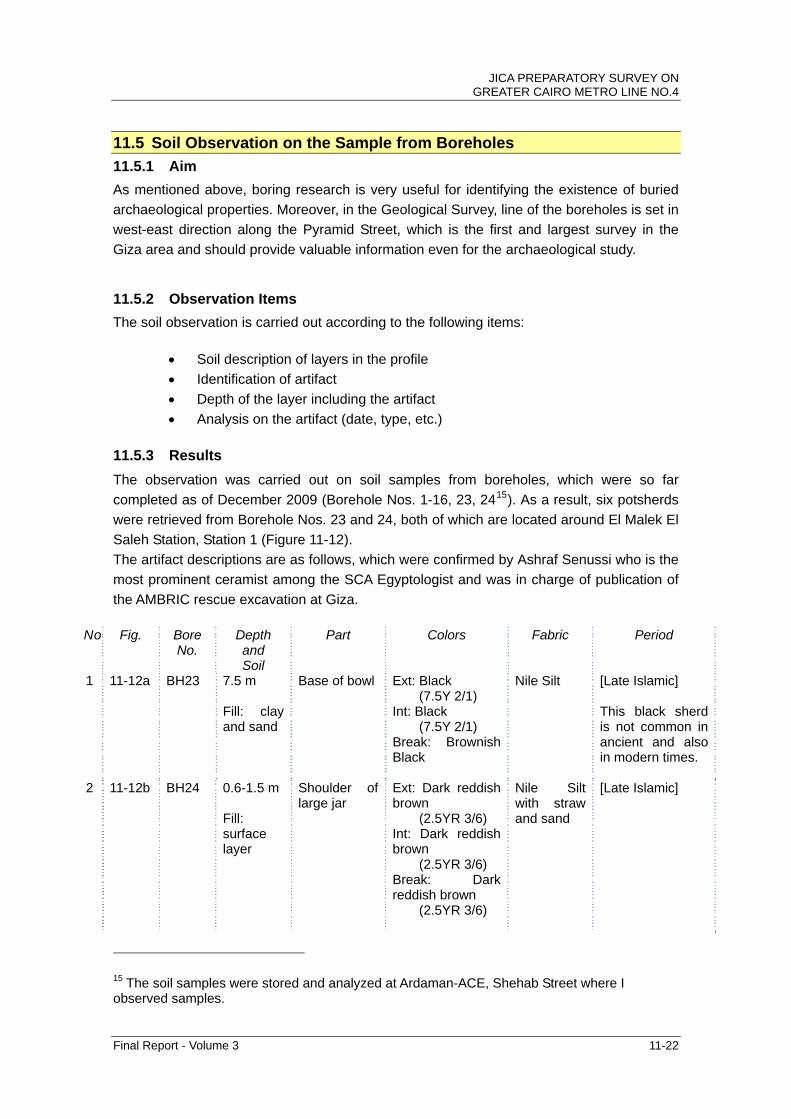
JICA PREPARATORY SURVEY ON GREATER CAIRO METRO LINE NO.4
Final Report - Volume 3 11-22
11.5 Soil Observation on the Sample from Boreholes
11.5.1 Aim
As mentioned above, boring research is very useful for identifying the existence of buried
archaeological properties. Moreover, in the Geological Survey, line of the boreholes is set in
west-east direction along the Pyramid Street, which is the first and largest survey in the
Giza area and should provide valuable information even for the archaeological study.
11.5.2 Observation Items
The soil observation is carried out according to the following items:
Soil description of layers in the profile
Identification of artifact
Depth of the layer including the artifact
Analysis on the artifact (date, type, etc.)
11.5.3 Results
The observation was carried out on soil samples from boreholes, which were so far
completed as of December 2009 (Borehole Nos. 1-16, 23, 2415). As a result, six potsherds
were retrieved from Borehole Nos. 23 and 24, both of which are located around El Malek El
Saleh Station, Station 1 (Figure 11-12).
The artifact descriptions are as follows, which were confirmed by Ashraf Senussi who is the
most prominent ceramist among the SCA Egyptologist and was in charge of publication of
the AMBRIC rescue excavation at Giza.
No. Fig. Bore
No. Depth and Soil
Part Colors Fabric Period
1 11-12a BH23 7.5 m Fill: clay and sand
Base of bowl Ext: Black (7.5Y 2/1) Int: Black (7.5Y 2/1) Break: Brownish Black
Nile Silt [Late Islamic] This black sherd is not common in ancient and also in modern times.
2 11-12b BH24 0.6-1.5 m Fill: surface layer
Shoulder of large jar
Ext: Dark reddish brown (2.5YR 3/6) Int: Dark reddish brown (2.5YR 3/6) Break: Dark reddish brown (2.5YR 3/6)
Nile Silt with straw and sand
[Late Islamic]
15 The soil samples were stored and analyzed at Ardaman-ACE, Shehab Street where I observed samples.

JICA PREPARATORY SURVEY ON GREATER CAIRO METRO LINE NO.4
3 11-12c BH24 0.6-1.5 m Fill surface layer
Shoulder of jar
Ext: Bright reddish brown (2.5YR 5/6) Int: Bright reddish brown (2.5YR 5/6) Break: Reddish brown (2.5YR 4/6)
Nile Silt with small amount of calcite, grit and Mica
[Islamic] Mica in fabric is not included among modern pots because Nile flood already ended.
4 11-12d BH24 0.6-1.5 m Fill surface layer
Unknown Ext: Dark red (7.5R 3/6) Int: Brown (7.5YR 4/6) Break: Brown (7.5YR 4/6)
Nile Silt with large amount of straw and sand
[Ancient ] This rough ware is typical of Meat or Beer jar during the Old-New Kingdom.
5 11-12e BH24 0.6-1.5 m Fill surface layer
Base of plate or bowl with glazed surface decoration
Ext: Light yellow (7.5Y 7/4) Int: Light yellow (7.5Y 7/4) Break: Orange (7.5YR 6/6)
Calcareous Marl Clay
[Late Islamic] Although the glazed surface is also common in modern, the fabric is higher quality than modern one.
6 11-12f BH24 3.9 m Fill: Clay and Sand
Part of Amphora
Ext: bright brown (7.5YR 5/6)
Int: Red (10R 4/6)
Break: Grayish yellow brown (10YR 5/2)
Nile Silt with small amount of calcite and mica
[Late Roman] The thick sherd with horizontal lines on the exterior is a feature of Late Roman Amphora.
Based on the fabric and surface features, all collected potsherds could belong not to the
Modern, but to the Ancient, Roman and Islamic pottery. This, however, does not directly
mean the existence of buried archaeological properties. Borehole No. 24 near the El Malek
El Saleh Station, where most potsherds were retrieved, is located in the Historical Cairo
area, and the depth of the sherds is very close to the surface (mainly 0.6-1.5 m). Although it
is not certain through the fragmental information, it is possible that these artifacts came
from just dumped layer. This assumption is supported by the different periods of the
collected potsherds.
There is low chance that archaeological layers are buried around the El Malek El Saleh
Station. However, a preliminary research such as test trench excavation should be carried
out on this area before the construction stage.
Final Report - Volume 3 11-23

JICA PREPARATORY SURVEY ON GREATER CAIRO METRO LINE NO.4
Source: JICA Study Team
Figure 11-12 Sherds Retrieved from Borehole Soils
Final Report - Volume 3 11-24

JICA PREPARATORY SURVEY ON GREATER CAIRO METRO LINE NO.4
11.6 Risk Assessment
11.6.1 Criteria for Risk Assessment Based on the literature study and interviews with SCA staff, the buried archaeological
properties could be categorized into three levels, which are evaluated according to the
criteria such as size, historical importance and location. This evaluation is to be revalidated
by SCA.
Level A is a substantial property which encompasses immovable architectural
remains such as temple, settlement or cemetery and movable artifacts spread
over large area.
Level B is a scattered property which has part of immovable architectural
remains and movable artifacts in a limited area.
Level C is a scattered property with only movable artifacts in a limited area.
Table 11-2 Level and the Criteria of Buried Archaeological Properties
Level Criteria (Characters of Properties) A Substantial property with immovable architectural remains such as temple or
settlement/cemetery B Scattered property with part of immovable architectural remains and movable artifacts C Scattered property with only movable artifacts
Source: JICA Study Team
Final Report - Volume 3 11-25

JICA PREPARATORY SURVEY ON GREATER CAIRO METRO LINE NO.4
11.6.2 Risk Assessment on the Study Area
(1) For Buried Archaeological Property
According to the baseline information, possibility of existence of the buried property and the
level for Risk Assessment are suggested as follows:
Source: JICA Study Team
Table 11-3 Risk Assessment on Study Area
Area Area Name Station Possibility Level 1 Desert near Depot Low ----- 2 Desert fringe near GEM Middle B-C 3 Al Remayah Sq. to Marrioutia Canal High B-C 4 Pyramid Street Low ----- 5 El Giza Station Middle C 6 El Malek El Saleh Station Middle B-C 7 Historic Cairo (North Corridor) Middle C 8 North of Ghamra Station Low ----- 9 Matariya Middle B-C 10 South of El Khosos Low ----- 11 Historic Cairo (South Corridor) Middle B-C 12 Nasr City Low -----
Source: JICA Study Team
Final Report - Volume 3 11-26

JICA PREPARATORY SURVEY ON GREATER CAIRO METRO LINE NO.4
Final Report - Volume 3 11-27
Area 1: Possibly no buried properties according to the previous studies and site reconnaissance in this area.
Area 2: Although no archaeological remains have been reported in this area, ancient settlements were ordinarily occupied on the border between desert and alluvial terrains. This is supported by discoveries of settlements east of the Giza Plateau and near Ausim located 13 km north of Giza Plateau where part of the Old Kingdom settlement was discovered during the Greater Cairo Waste Water Project16.
Area 3: As mentioned in the baseline information, there have been buried properties at the area from Al Remayah Square to the Marrioutia Canal by trench excavation and boreholes. There is a possibility that buried properties exist in this area. The level of risk assessment would be B-C based on previous researches.
Area 4: Along the Pyramid Street to the east from the Marrioutia Canal, archaeological remains have not yet been found. However, the final remark should await the borehole observation.
Area 5: Around El Giza station on the Pyramid Street, no archaeological remains have been found yet. However, given the cases at Dokki, there is a possibility that these remains will be found.
Area 6: No archaeological remains have been reported at the El Malek El Saleh Station. However, given that there are archaeological and historic properties to the south of the station, there is a possibility that these remains will be found, which is supported by the results of the borehole survey.
Area 7: Along the Port Said Street (North Corridor) in the Historic Cairo area, there are no reports of buried archaeological remains. However, considering that this street was an ancient canal, as well as this segment is inside the Historic Cairo, there is a possibility to find debris of archaeological property.
Area 8: Along the Port Said Street (North Corridor) to the north of Ghamra Station, there is possibly no buried property according to the previous studies.
Area 9: In Matariya, famous for the Ancient town Heliopolis, archaeological sites are distributed over the eastern side. The route in this segment runs beside Ismailiya Nile branch, which is far west of the ancient area. However, there is also a possibility that part of the temple precinct is buried around the western side.
Area 10:
Along the Port Said Street (North Corridor) to the south of El Khosos, there is possibly no buried property according to the previous studies.
Area 11:
Along the east corridor in a segment of the Historic Cairo area, there is no report of buried archaeological remains. However, given that this area has a long history and houses densely-distributed monuments, there is a possibility to find remains or deposits such as architectural foundation.
Area 12:
There is possibly no buried property according to the precious studies in the Nasr City area.
16 M. Jones, 1995, “A New Old Kingdom Settlement near Ausim”, MDAIK 51:85-98.
JICA PREPARATORY SURVEY ON GREATER CAIRO METRO LINE NO.4
Final Report - Volume 3 11-28
(2) For Existing Historical Property
As far as the baseline information shows, there is no existing archaeological property on
the limited area along the Phase 1 of Metro Line 4. However, in the historic Cairo Area of
the Phase 2, there are historical properties on and beside the proposed routes; especially
around al-Sayyidah Zaynab mosque, and the intersection of Port Said and Ratib streets in
the northern corridor, and around al-Sultan Hasan mosque in the eastern corridor.
Consequently, the risk on these areas should be higher.
11.7 Countermeasure
In spite of their scale and character, all archaeological properties possess universal value
to be preserved as precious cultural resources. However, in the case when archaeological
remains are found during a construction work, it is sometimes necessary to remove or
transfer them by salvage or rescue operations. Based on reviews of previous cases of
possible findings, countermeasure to be applied for each Level of Risk Assessment is
discussed, which has been confirmed with archaeological experts from the SCA
Committee.
11.7.1 Previous Cases
(1) Case for Level A
Regarding previous countermeasures, several interviews with SCA Staff identified that if
highly important architectural remains such as a temple or large cemetery are found, they
should be preserved on site. In fact, there was such case in Greater Cairo. In 1995, a group
of tombs were found at the fringe of desert 3.0 km south from Giza Plateau which is very
close to a half-built highway of the Ring Road planned to link with Alexandria and Fayoum
Desert Roads. After UNESCO complained that the highway violated a world cultural
heritage convention, SCA sent their staff to excavate and realized that the tombs were
probably part of a large cemetery dating from 600 BC. Since the cemetery stands on the
area listed as a UNESCO World Heritage, SCA and UNESCO committees requested the
Egyptian authorities to halt the construction and to use alternative route well outside the
protected area17. As a result, the highway route was changed to use the Marrioutia Canal
Road that runs parallel to the desert.
(2) Case for Level B
Except for the case of the ring road, however, there has been no precedent case of
preserving buried archaeological remains with cessation of construction works in Greater
Cairo. Only individual tombs and scattered remains such as parts of pavements and
pothsards have been found during construction works. These findings have been removed
and transferred after full data recovery by mapping, drawing and photographs. For example,
in Matariya, tombs of the 26th Dynasty were accidentally discovered underground in the
course of the demolition of houses with the recent urban expansion (for the detail, see
17 This information was collected from the interviews from SCA staff and the article of Reuter, 8 Feb. 1995.
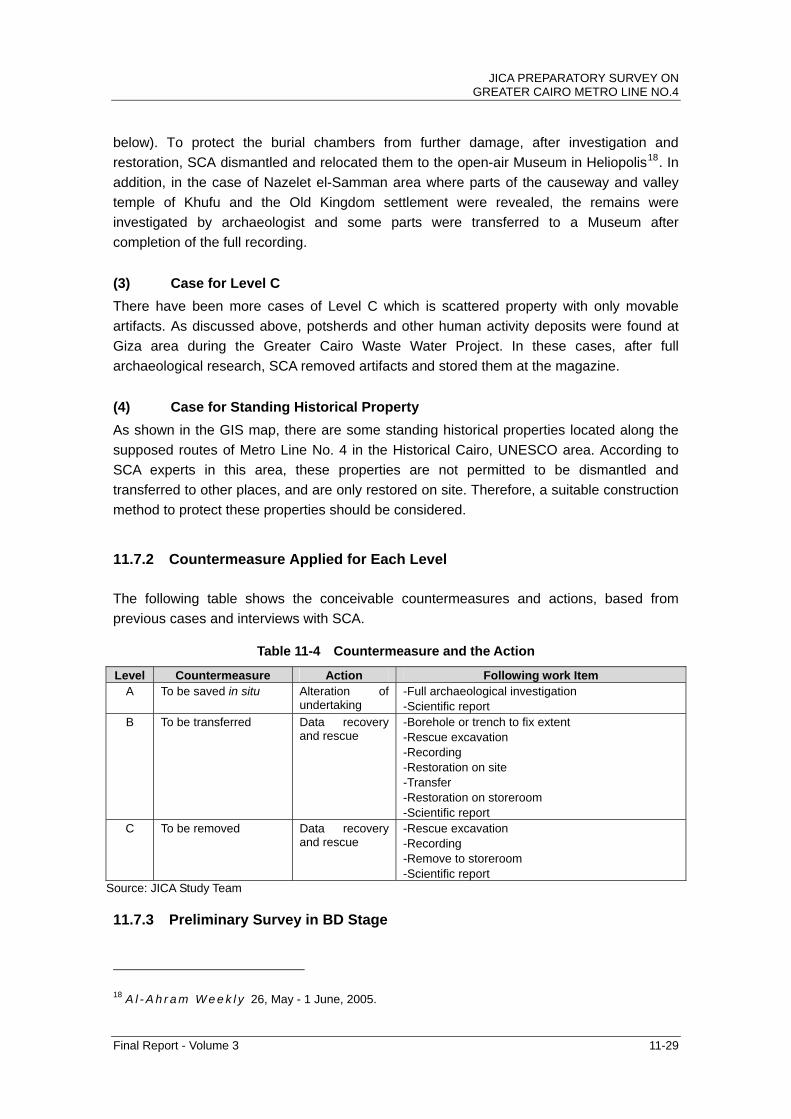
JICA PREPARATORY SURVEY ON GREATER CAIRO METRO LINE NO.4
Final Report - Volume 3 11-29
below). To protect the burial chambers from further damage, after investigation and
restoration, SCA dismantled and relocated them to the open-air Museum in Heliopolis18. In
addition, in the case of Nazelet el-Samman area where parts of the causeway and valley
temple of Khufu and the Old Kingdom settlement were revealed, the remains were
investigated by archaeologist and some parts were transferred to a Museum after
completion of the full recording.
(3) Case for Level C
There have been more cases of Level C which is scattered property with only movable
artifacts. As discussed above, potsherds and other human activity deposits were found at
Giza area during the Greater Cairo Waste Water Project. In these cases, after full
archaeological research, SCA removed artifacts and stored them at the magazine.
(4) Case for Standing Historical Property
As shown in the GIS map, there are some standing historical properties located along the
supposed routes of Metro Line No. 4 in the Historical Cairo, UNESCO area. According to
SCA experts in this area, these properties are not permitted to be dismantled and
transferred to other places, and are only restored on site. Therefore, a suitable construction
method to protect these properties should be considered.
11.7.2 Countermeasure Applied for Each Level The following table shows the conceivable countermeasures and actions, based from
previous cases and interviews with SCA.
Table 11-4 Countermeasure and the Action
Level Countermeasure Action Following work Item A To be saved in situ Alteration of
undertaking -Full archaeological investigation -Scientific report
B To be transferred Data recovery and rescue
-Borehole or trench to fix extent -Rescue excavation -Recording -Restoration on site -Transfer -Restoration on storeroom -Scientific report
C To be removed Data recovery and rescue
-Rescue excavation -Recording -Remove to storeroom -Scientific report
Source: JICA Study Team 11.7.3 Preliminary Survey in BD Stage
18 A l - A h r a m W e e k l y 26, May - 1 June, 2005.

JICA PREPARATORY SURVEY ON GREATER CAIRO METRO LINE NO.4
The results of risk assessment suppose that there are some areas where archaeological
properties could be buried underground. Among them, it is most likely to be found at areas
around El Remayah Square (Area 3), which is ranked Level B-C.
To confirm this suggestion and make further plans appropriately, it is proposed that a
preliminary survey should be carried out before construction. Taking for example the El
Remayah Square, the work schedule of the preliminary survey is estimated here.
(1) Work Items
Geophysical Exploration:
For the area covered by asphalt road, the Electromagnetic Radiation method
is effective. Firstly, this exploration is conducted on the proposed line and the
buffer zone, which cover approximately 0.1 km wide, to examine the
existence of buried property as well as its extent and depth. The result is
shown as a map with anomaly.
Borehole:
This is carried out to confirm the anomaly of geophysical exploration. It is
better to use a wider bore than that used in the geological survey and to set
boreholes on the anomaly area at 5.0 m interval. The retrieved soil samples
are examined at a laboratory to detect artificial contents and observe the
depth and soil condition.
Trench Excavation:
The trench area is selected based on the borehole survey. First trench is
5 m x 3 m, and then, if archaeological deposit spreads wider, it would be
expanded. Full recording of measurement and photographs is carried out in
this work.
Report Making:
Putting all data together, a scientific report will be made.
(2) Schedules
In Area 3 of El Remayah Square, the supposed route line runs approximately 2.5 km on the
road of the Cairo-Alexandria and Pyramids Street. To survey on this area, a schedule plan
is tentatively proposed below.
The works on site (geophysical, borehole and trench) would take about nine weeks, and the
following report work would take another six weeks. However, the number of the trench
excavation depends on the result of the borehole survey, and it may require more weeks.
Final Report - Volume 3 11-30

JICA PREPARATORY SURVEY ON GREATER CAIRO METRO LINE NO.4
Final Report - Volume 3 11-31
Table 11-5 Schedule of Preliminary Survey
Work Item 1 2 3 4 5 6 7 8 9 10 11 12 13 14 15
Geophysical Exploration
Borehole (including lab work)
Trench Excavation
Report Making
Period (week)
2 weeks
4 weeks
4 weeks
6 weeks
Source: JICA Study Team

CHAPTER 12 DRAFT ENVIRONMENTAL CHECKLIST
OF EX-JBIC GUIDELINES

JICA PREPARATORY SURVEY ON GREATER CAIRO METRO LINE NO.4
Final Report - Volume 3 12-1
CHAPTER 12 DRAFT ENVIRONMENTAL CHECKLIST OF EX-JBIC
GUIDELINES
In this F/S, various environmental and social considerations were examined and
incorporated into the plan and design of the project. EIA and RAP framework studies
especially for Phase 1 have been also conducted in line with the project planning and
design.
The key points obtained In the course of environmental and social studies as of F/S stage
for Phase 1 of the project are summarized in Table 12-1, by using the format of
Environmental Checklists No. 15 for Roads and Railways, defined by ex-JBIC Guidelines
for confirmation of environmental and social considerations (April, 2002).

JICA
PR
EP
AR
AT
OR
Y S
UR
VE
Y O
N
GR
EA
TE
R C
AIR
O M
ET
RO
LINE
NO
.4
Final R
eport - V
olume 3
12-2
Table 12-1 Environmental Checklists for Phase 1 by ex-JBIC Guidelines (No. 15 Roads and Railways)
Category
EnvironmentalItem
Main Check Items Confirmation of Environmental Considerations
(1) EIA andEnvironmentalPermits
① Have EIA reports been officially completed?② Have EIA reports been approved by authorities of the host country’sgovernment?③ Have EIA reports been unconditionally approved? If conditions are imposedon the approval of EIA reports, are the conditions satisfied?④ In addition to the above approvals, have other required environmental permitsbeen obtained from the appropriate regulatory authorities of the host country’sgovernment?
① EIA reports are being finalized for the purpose of official submission to EEAA as ofFebruary, 2010.② Official approval of EIA is expected to be obtained in a few months after submission offinal EIA report to EEAA.③ EIA reports are going to be submited and approved. It is unknown whether or not EIAwould be approved unconditionally as of February, 2010.④ There is no additional approval to be obtained by the project proponent.
(2) Explanation tothe Public
① Are contents of the project and the potential impacts adequately explained tothe public based on appropriate procedures, including information disclosure? Isunderstanding obtained from the public?② Are proper responses made to comments from the public and regulatoryauthorities?
① According to the Egyptian regulation on EIA, explanation of project description is alreadycompleted at the scoping stage. Information disclosure to public at the draft EIA report stagewas also arranged through the 2nd stakeholder meeting held on 28th December 2009, andpotential impacts with proposed mitigation measures ware explained with plain expression.② Various opinions and suggestions were exchanged at the 2nd stakeholder meeting.Comments raised at the meeting were integrated in the final EIA reports as well as projectdesign accordingly.
(1) Air Quality
① Is there a possibility that air pollutants emitted from various sources, such asvehicle traffic will affect ambient air quality? Does ambient air quality complywith the country’s ambient air quality standards?② Where industrial areas already exist near the route, is there a possibility that theproject will make air pollution worse?
① Ambient air quality in and aroung the Project area is currently exceeding the standards ingeneral. Although the impact by the Project will be limited and temporal in construction stage,the possibility of air pollution is expected due to operation of heavy equipment and vehicles.Mitigation measures to reduce the impact likely caused by the construction activities areproposed. It is not expected during OM stage to induce significant impacts on air qualitydirectly caused by the Project.② There is no industrial areas to be taken into considerations near the Project area.
(2) Water Quality
① Is there a possibility that soil runoff from the bare lands resulting fromearthmoving activities, such as cutting and filling will cause water qualitydegradation in downstream water areas?② Is there a possibility that surface runoff from roads will contaminate watersources, such as groundwater?③ Do effluents from various facilities, such as stations and parking areas/serviceareas comply with the country’s effluent standards and ambient water qualitystandards? Is there a possibility that the effluents will cause areas that do notcomply with the country’s ambient water quality standards?
① There is some possibility of water pollution during constrcution stage due to turbid watergenerated by such works as shielding (TBM), although all of the construction works will bedone underground. Treatment plants for turbid water will be installed as countermeasuressimilary to Metro Line 3 project to reduce likely impacts.② There is some possiblity of groundwater pollution during the constrcution stage due toaccidental spillage of such chemicals as oil. Proper management of constrcution sites will bemade to reduce such risks.③ The effluents from such facilities as stations and depot will be treated according to therequirements of Egyptian legislation. Therefore no or negligible impacts are expected.
(3) Noise andVibration
① Do noise and vibrations from vehicle and train traffic comply with the country’sstandards?
① No or negligible impacts of noise and vibrations in OM stage of the Project, since tracksand stations will be constructed underground with enough depth from ground.
1 Permits andExplanation
2 MitigationMeasures

JICA
PR
EP
AR
AT
OR
Y S
UR
VE
Y O
N
GR
EA
TE
R C
AIR
O M
ET
RO
LINE
NO
.4
Final R
eport - V
olume 3
12-3
CategoryEnvironmental
ItemMain Check Items Confirmation of Environmental Considerations
(1) Protected Areas
① Is the project site located in protected areas designated by the country’s laws orinternational treaties and conventions? Is there a possibility that the project willaffect the protected areas?
① The Project area does not include protected areas, and does not locate close to protectedarea. There is no possibility to affect the protected area due to Project.
(2) Ecosystem
① Does the project site encompass primeval forests, tropical rain forests,ecologically valuable habitats (e.g., coral reefs, mangroves, or tidal flats)?② Does the project site encompass the protected habitats of endangered speciesdesignated by the country’s laws or international treaties and conventions?③ If significant ecological impacts are anticipated, are adequate protectionmeasures taken to reduce the impacts on the ecosystem?④ Are adequate protection measures taken to prevent impacts, such as disruptionof migration routes, habitat fragmentation, and traffic accident of wildlife andlivestock?⑤ Is there a possibility that installation of roads will cause impacts, such asdestruction of forest, poaching, desertification, reduction in wetland areas, anddisturbance of ecosystems due to introduction of exotic (non-native invasive)species and pests? Are adequate measures for preventing such impactsconsidered?⑥ In cases where the project site is located at undeveloped areas, is there apossibility that the new development will result in extensive loss of naturalenvironments?
①②③④⑤⑥ The Project area is located in metropolitan city with highly urbanization.Therefore, there are no issues on ecosystem to be cautioned.
(3) Hydrology
① Is there a possibility that alteration of topographic features and installation ofstructures, such as tunnels will adversely affect surface water and groundwaterflows?
① There is no possibility of alternation of topographic features due to the Project. However,sheilding works (TBM) underground during construction stage might cause lowering ofgroundwater level, although the duration will be limited and temporal. Monitoring ofgroundwater level is proposed at the existing wells near the Project area.
(4) Topography andGeology
① Is there a soft ground on the route that may cause slope failures or landslides?Are adequate measures considered to prevent slope failures or landslides, whereneeded?② Is there a possibility that civil works, such as cutting and filling will cause slopefailures or landslides? Are adequate measures considered to prevent slope failuresor landslides?③ Is there a possibility that soil runoff will result from cut and fill areas, waste soildisposal sites, and borrow sites? Are adequate measures taken to prevent soilrunoff?
①② Existence of a soft ground is not reported along the Project route. And constrcutionworks of major facilities such as tracks and stations will be made underground. Therefore, noposibility of causing slope failures or landslides is expected.③ The surface areas where cut and cover method will be applied are limited to the stations'construction, therefore the possibility of soil runoff due to constrcution work will benegligible. Slurry generated by sheilding works (TBM) will be treated at the treatment plants,whereas surplus soil will be disposed of according to the related legislation in Egypt, in orderto prevent the impacts due to soil runoff.
3 NaturalEnvironment
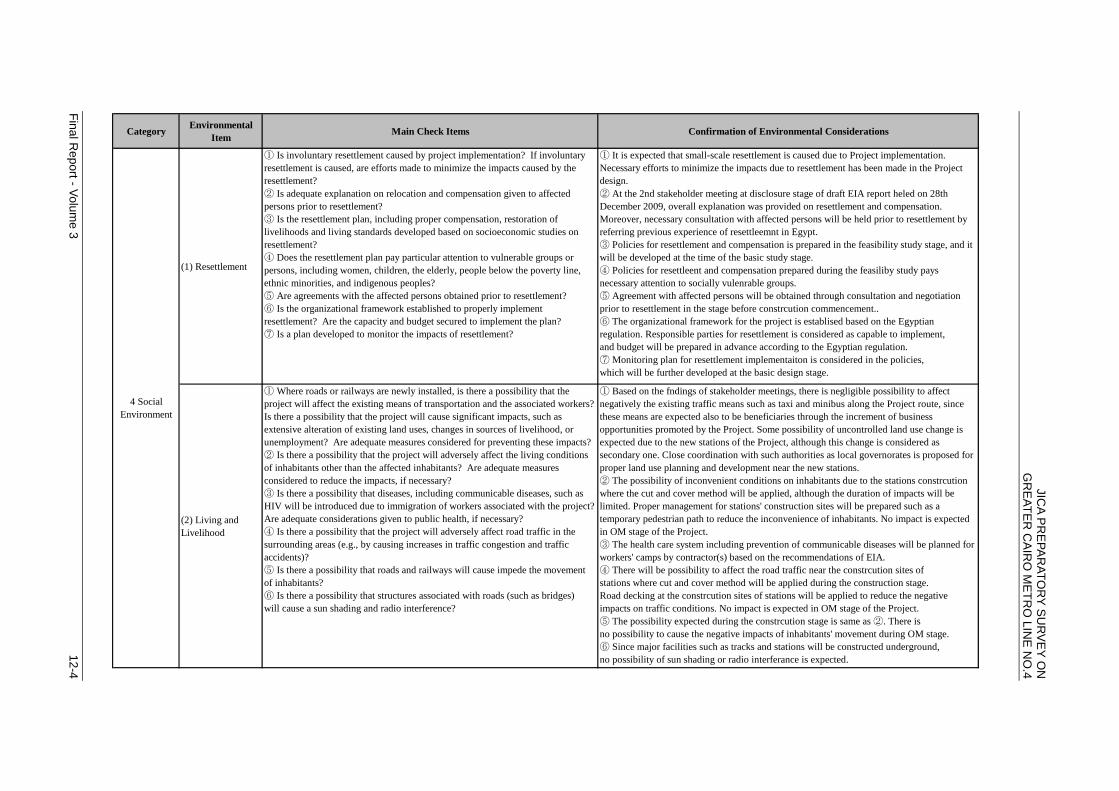
JICA
PR
EP
AR
AT
OR
Y S
UR
VE
Y O
N
GR
EA
TE
R C
AIR
O M
ET
RO
LINE
NO
.4
Final R
eport - V
olume 3
12-4
CategoryEnvironmental
ItemMain Check Items Confirmation of Environmental Considerations
(1) Resettlement
① Is involuntary resettlement caused by project implementation? If involuntaryresettlement is caused, are efforts made to minimize the impacts caused by theresettlement?② Is adequate explanation on relocation and compensation given to affectedpersons prior to resettlement?③ Is the resettlement plan, including proper compensation, restoration oflivelihoods and living standards developed based on socioeconomic studies onresettlement?④ Does the resettlement plan pay particular attention to vulnerable groups orpersons, including women, children, the elderly, people below the poverty line,ethnic minorities, and indigenous peoples?⑤ Are agreements with the affected persons obtained prior to resettlement?⑥ Is the organizational framework established to properly implementresettlement? Are the capacity and budget secured to implement the plan?⑦ Is a plan developed to monitor the impacts of resettlement?
① It is expected that small-scale resettlement is caused due to Project implementation.Necessary efforts to minimize the impacts due to resettlement has been made in the Projectdesign.② At the 2nd stakeholder meeting at disclosure stage of draft EIA report heled on 28thDecember 2009, overall explanation was provided on resettlement and compensation.Moreover, necessary consultation with affected persons will be held prior to resettlement byreferring previous experience of resettleemnt in Egypt.③ Policies for resettlement and compensation is prepared in the feasibility study stage, and itwill be developed at the time of the basic study stage.④ Policies for resettleent and compensation prepared during the feasiliby study paysnecessary attention to socially vulenrable groups.⑤ Agreement with affected persons will be obtained through consultation and negotiationprior to resettlement in the stage before constrcution commencement..⑥ The organizational framework for the project is establised based on the Egyptianregulation. Responsible parties for resettlement is considered as capable to implement,and budget will be prepared in advance according to the Egyptian regulation.⑦ Monitoring plan for resettlement implementaiton is considered in the policies,which will be further developed at the basic design stage.
(2) Living andLivelihood
① Where roads or railways are newly installed, is there a possibility that theproject will affect the existing means of transportation and the associated workers?Is there a possibility that the project will cause significant impacts, such asextensive alteration of existing land uses, changes in sources of livelihood, orunemployment? Are adequate measures considered for preventing these impacts?② Is there a possibility that the project will adversely affect the living conditionsof inhabitants other than the affected inhabitants? Are adequate measuresconsidered to reduce the impacts, if necessary?③ Is there a possibility that diseases, including communicable diseases, such asHIV will be introduced due to immigration of workers associated with the project?Are adequate considerations given to public health, if necessary?④ Is there a possibility that the project will adversely affect road traffic in thesurrounding areas (e.g., by causing increases in traffic congestion and trafficaccidents)?⑤ Is there a possibility that roads and railways will cause impede the movementof inhabitants?⑥ Is there a possibility that structures associated with roads (such as bridges)will cause a sun shading and radio interference?
① Based on the fndings of stakeholder meetings, there is negligible possibility to affectnegatively the existing traffic means such as taxi and minibus along the Project route, sincethese means are expected also to be beneficiaries through the increment of businessopportunities promoted by the Project. Some possibility of uncontrolled land use change isexpected due to the new stations of the Project, although this change is considered assecondary one. Close coordination with such authorities as local governorates is proposed forproper land use planning and development near the new stations.② The possibility of inconvenient conditions on inhabitants due to the stations constrcutionwhere the cut and cover method will be applied, although the duration of impacts will belimited. Proper management for stations' construction sites will be prepared such as atemporary pedestrian path to reduce the inconvenience of inhabitants. No impact is expectedin OM stage of the Project.③ The health care system including prevention of communicable diseases will be planned forworkers' camps by contractor(s) based on the recommendations of EIA.④ There will be possibility to affect the road traffic near the constrcution sites ofstations where cut and cover method will be applied during the construction stage.Road decking at the constrcution sites of stations will be applied to reduce the negativeimpacts on traffic conditions. No impact is expected in OM stage of the Project.⑤ The possibility expected during the constrcution stage is same as ②. There isno possibility to cause the negative impacts of inhabitants' movement during OM stage.⑥ Since major facilities such as tracks and stations will be constructed underground,no possibility of sun shading or radio interferance is expected.
4 SocialEnvironment

JICA
PR
EP
AR
AT
OR
Y S
UR
VE
Y O
N
GR
EA
TE
R C
AIR
O M
ET
RO
LINE
NO
.4
Final R
eport - V
olume 3
12-5
CategoryEnvironmental
ItemMain Check Items Confirmation of Environmental Considerations
(3) Heritage
① Is there a possibility that the project will damage the local archeological,historical, cultural, and religious heritage sites? Are adequate measures consideredto protect these sites in accordance with the country’s laws?
① No damege is expected on local archeological, historical, cultural and religious heritagesites by the Project, because the stations will be designed to avoid suth valuable sites.However, buried cultural assets might be damaged due to the constrcution works (tracks andstations), if undiscovered assets exist underground along the route. Investigation suchmethods as non-destructive survey and boring are proposed to be done in the basic designstage for reducing the risk of unexpected discovery of buried assets during construction stage.
(4) Landscape① Is there a possibility that the project will adversely affect the local landscape?Are necessary measures taken?
① Negligible impact on landscape is expected due to the Project, since the major facilitiessuch as tracks and stations will be constructed underground.
(5) EthnicMinorities andIndigenous Peoples
① Where ethnic minorities and indigenous peoples are living in the rights-of-way,are considerations given to reduce the impacts on culture and lifestyle of ethnicminorities and indigenous peoples?② Does the project comply with the country’s laws for rights of ethnic minoritiesand indigenous peoples?
① Egypt is said to be no category of ethnic minorities as well as indigenous people. However,there is a high possiblity that socially vulnerable groups such as the poor lives in the righs-of-way. Necessary considration for socially vulnerable groups is taken to reduce impact to them.② There are no laws for the rights of ethnic minorities and indigenous people in Egypt.However, special consideration for socially vulnerable groups is taken.
(1) Impacts duringConstruction
① Are adequate measures considered to reduce impacts during construction (e.g.,noise, vibrations, turbid water, dust, exhaust gases, and wastes)?② If construction activities adversely affect the natural environment (ecosystem),are adequate measures considered to reduce impacts?③ If construction activities adversely affect the social environment, are adequatemeasures considered to reduce impacts?④ If necessary, is health and safety education (e.g., traffic safety, public health)provided for project personnel, including workers?
① Adequate measures will be planned and provided to reduce the negative impacts ofenvironmental pollution during constrcution stage, such as proper maintenance of heavyequipment and vehicles, water spraying, management of construction waste, etc. according tolegislation and recommendations of EIA.② The Project area is located in metropolitan city with high urbanization. Therefore, there areno issues of ecosystem to be cautioned on construction activities.③ Adequate measures will be planned and provided to reduce the negative impacts of socialenvironment during constrcution stage, such as road decking to reduce traffic jam at stations'construction sites, temporary pedestrian paths, etc.④ It is proposed to provide primary health check, first aid kit, instrution of health and tarafficsafety, etc. for the workers by a contractor during the constrcution stage.
(2) Monitoring
① Does the proponent develop and implement monitoring program for theenvironmental items that are considered to have potential impacts?② Are the items, methods and frequencies included in the monitoring programjudged to be appropriate?③ Does the proponent establish an adequate monitoring framework (organization,personnel, equipment, and adequate budget to sustain the monitoring framework)?④ Are any regulatory requirements pertaining to the monitoring report systemidentified, such as the format and frequency of reports from the proponent to theregulatory authorities?
① Environmental monitoring plan is proposed for pre-construction, construction and OMstages of the Project, based on the impact prediction and mitigation measures proposed.② Parameters, methods, and frequency in the monitoring plan are considered to be enoughfor identifying the effectiveness of mitigation measures and/or unforseen impacts in the courseof Projet implementation.③ Institutional arrangement to carry out the monitoring plan is proposed including entitiesconcerned and roles of each entity.④ There are no regulatory requirements in Egypt such as reporting system of monitoringresults, except the inspection system to industrial sector being carried out by environmentalauthorities
5 Others
4 SocialEnvironment
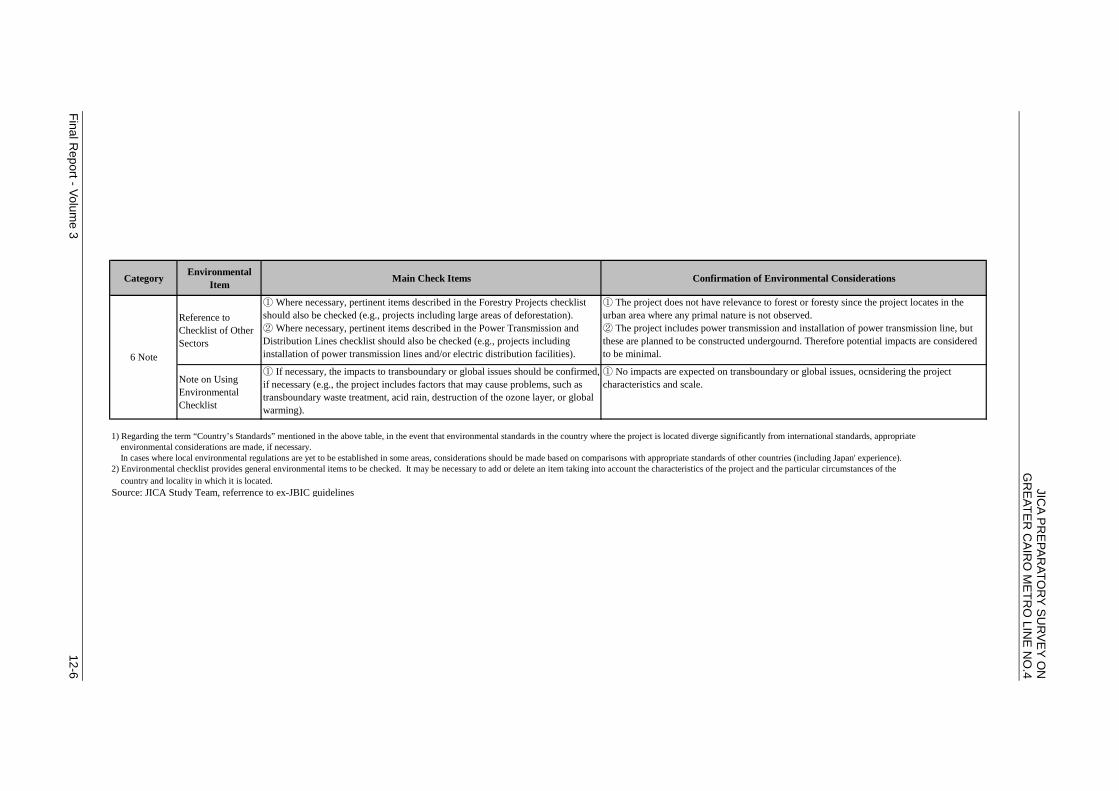
JICA
PR
EP
AR
AT
OR
Y S
UR
VE
Y O
N
GR
EA
TE
R C
AIR
O M
ET
RO
LINE
NO
.4
CategoryEnvironmental
ItemMain Check Items Confirmation of Environmental Considerations
Reference toChecklist of OtherSectors
① Where necessary, pertinent items described in the Forestry Projects checklistshould also be checked (e.g., projects including large areas of deforestation).② Where necessary, pertinent items described in the Power Transmission andDistribution Lines checklist should also be checked (e.g., projects includinginstallation of power transmission lines and/or electric distribution facilities).
① The project does not have relevance to forest or foresty since the project locates in theurban area where any primal nature is not observed.② The project includes power transmission and installation of power transmission line, butthese are planned to be constructed undergournd. Therefore potential impacts are consideredto be minimal.
Note on UsingEnvironmentalChecklist
① If necessary, the impacts to transboundary or global issues should be confirmed,if necessary (e.g., the project includes factors that may cause problems, such astransboundary waste treatment, acid rain, destruction of the ozone layer, or globalwarming).
① No impacts are expected on transboundary or global issues, ocnsidering the projectcharacteristics and scale.
1) Regarding the term “Country’s Standards” mentioned in the above table, in the event that environmental standards in the country where the project is located diverge significantly from international standards, appropriate environmental considerations are made, if necessary. In cases where local environmental regulations are yet to be established in some areas, considerations should be made based on comparisons with appropriate standards of other countries (including Japan' experience).2) Environmental checklist provides general environmental items to be checked. It may be necessary to add or delete an item taking into account the characteristics of the project and the particular circumstances of the countr
Final R
eport - V
olume 3
12-6
y and locality in which it is located.Source: JICA Study Team, referrence to ex-JBIC guidelines
6 Note

CHAPTER 13 ECONOMIC AND FINANCIAL ANALYSIS

JICA PREPARATORY SURVEY ON GREATER CAIRO METRO LINE NO.4
Final Report - Volume 3 13-1
CHAPTER 13 ECONOMIC AND FINANCIAL ANALYSIS
13.1 Introduction
This chapter presents the methodology, assumptions and results of economic and financial
appraisals of the Cairo Metro Line 4 construction project. These appraisals were
undertaken both for the case of Phase 1 route only (i.e. without the addition of the second
phase route) and for the case of an entire metro route comprising both the Phase 1 and
Phase 2 route components.
These appraisals are intended to demonstrate the economic and financial viability of the
project under varying assumptions as to the level of ridership demand, road traffic impacts,
capital costs, O&M costs and fares. In addition, the financial appraisal considers the effect
of different financing sources and conditions on the financial returns available from the
project.
The chapter first reviews estimates of the project capital and O&M costs, which provide a
common base for both economic and financial appraisals, before presenting individually the
methodology, assumptions and results of these two appraisals.
13.2 Project Costs
Estimates of the initial capital and operating and maintenance (O&M) costs of the project
are fully described in Chapter 7 (please see Sections 7.1 and 7.2, respectively).
These estimates are valued in financial terms and are suitable as bases for the financial
appraisal. For the economic appraisal, however, all project costs and benefits must reflect
values relevant to the wider economy. Often these values are referred to as “resource
values” and their main characteristic is that they exclude government taxes, charges, and
transfer payments, as well as the effect of any distortions of prices from market determined
values. They may be estimated by adjusting financial costs by shadow pricing factors
(SPFs), which exclude the non-economic cost elements. An example of the calculation of
SPF for the capital cost of station civil works is given in Figure 13-1 below.
Figure 13-1 Example of SPF Calculation (Station Civil Works Cost)
Cost component
Estimated distribution in total station civil
works cost (%)
Tax proportion assumed to apply to
cost component (%)
Weighted average tax proportion
Labour 15 10 0.015 Material - Concrete 35 10 0.035 - Steel 20 25 0.050 Equipment 30 25 0.075 Total (all components) 100 0.175* * SPF = 1 – 0.175 = 0.825 Source: JICA Study Team

JICA PREPARATORY SURVEY ON GREATER CAIRO METRO LINE NO.4
Final Report - Volume 3 13-2
The SPF estimated for the project’s construction capital costs, comprising civil works and
E&M system costs, is 0.82 and for the cost of rolling stock purchases, 0.75, giving an
overall factor for the project capital cost of 0.81.
The O&M costs of the project comprise the costs of staff, electricity consumption, and
materials and spare parts. SPFs estimated for these components are respectively 0.90,
1.30 and 0.75, giving a weighted average for consolidated O&M costs of 0.86. In the case
of electricity consumption, the SPF reflects an adjustment to remove the government
electricity subsidy, which is estimated at 30%.1
13.2.1 Summary of Costs Used for Financial and Economic Appraisals
(i) Capital Costs
Table 13-1 provides a summary of the financial estimates of initial capital costs of the
project, which are discussed in detail in Chapter 7. These costs have been separated into
four main components: namely tunnelling costs; civil works costs (including station, depot
and track work construction costs); electrical and mechanical (E&M) system costs; and
rolling stock costs. It is assumed that these costs would be disbursed over the construction
periods assumed for Phase 1 (2012-2019) and Phase 2 (2017-2022), in accordance with a
schedule developed by the JICA Study Team. An alternative schedule was developed for
the project, assuming that it would be financed by a Normal ODA Loan. In this instance,
Basic Design of the project would be undertaken and financed by the Egyptian government
under a tender let in accordance with International Competitive Bidding methods, and for
this reason would be implemented over a longer time frame than if the project was financed
by a STEP Loan. The summary of initial capital costs disbursed under Normal ODA Loan
conditions is given in Table 13-2.
The SPFs for the major capital cost components (derived by the procedure shown in Table
13-1) were applied to these financial cost estimates for the STEP Loan case to calculate
the economic cost estimates as input for the economic appraisal. The resulting estimates
are given in Table 13-3.
In addition, the capital cost stream used for both economic and financial appraisals includes
future rolling stock investments, including new equipment purchases to satisfy future
demand, half-life refurbishments after 15 years in service, and new purchases to replace
life-expired stock. These costs in financial values are given in Table 13-4 and in economic
values in Table 13-5.
(ii) O&M costs Detailed calculations of the project O&M costs, in financial values, are given in Chapter 7 of
this report (see Section 7.2). These costs and their conversion to economic values are
summarized for specified reference years in Table 13-6.
1 Information obtained from the Ministry of Finance website shows that a subsidy of L.E. 2.0 billion was paid to electric power producers in 2007/08, in order to compensate them for the increased cost of CNG inputs and allow them to maintain electricity prices at current levels. Based on total electricity consumption of about 98.9 billion Kwh, this subsidy was equivalent to L.E. 0.0202 per Kwh. When compared with the price of L.E. 0.068 per Kwh quoted by the electricity supply company for the supply of electricity to the metro, the rate of subsidy is about 30%.

JICA
PR
EP
AR
AT
OR
Y S
UR
VE
Y O
N
GR
EA
TE
R C
AIR
O M
ET
RO
LIN
E N
O.4
Fin
al R
epo
rt - Vo
lum
e 3
1
3-3
Table 13-1 Summary of Initial Capital Costs used as Input for the Discounted Cash Flow (DCF) Analysis (STEP Loan)
Source: JICA Study Team
Capital cost component 2011 2012 2013 2014 2015 2016 2017 2018 2019 2020 2021 2022 Phase Project totalstotals (Phases 1+2)
Civil works - tunnellingPhase 1 0.0 20.7 279.7 518.1 497.3 238.2 0.0 0.0 0.0 0.0 0.0 0.0 1,554.1Phase 2 0.0 0.0 0.0 0.0 0.0 0.0 0.0 56.5 313.3 342.4 143.8 0.0 855.9 2,410.0
Civil works (except tunnelling)Phase 1 0.0 373.9 1,183.7 1,496.2 1,434.8 625.4 333.9 0.0 0.0 0.0 0.0 0.0 5,447.9Phase 2 0.0 0.0 0.0 0.0 0.0 0.0 342.5 1,127.8 1,417.9 1,183.9 694.0 0.0 4,766.2 10,214.1
E&M equipmentPhase 1 0.0 0.0 0.0 248.0 547.0 893.7 1,112.3 665.5 0.0 0.0 0.0 0.0 3,466.5Phase 2 0.0 0.0 0.0 0.0 0.0 0.0 0.0 0.0 103.4 951.2 1,197.7 1,198.4 3,450.7 6,917.3
Total construction capital costsPhase 1 0.0 394.6 1,463.5 2,262.3 2,479.1 1,757.3 1,446.2 665.5 0.0 0.0 0.0 0.0 10,468.5Phase 2 0.0 0.0 0.0 0.0 0.0 0.0 342.5 1,184.3 1,834.5 2,477.5 2,035.6 1,198.4 9,072.8 19,541.4
Rolling stockPhase 1 0.0 0.0 0.0 0.0 0.0 562.7 562.7 562.7 562.7 112.5 0.0 0.0 2,363.2Phase 2 0.0 0.0 0.0 0.0 0.0 0.0 0.0 0.0 0.0 0.0 0.0 5,064.0 5,064.0 7,427.3
Total construction & rolling stockPhase 1 0.0 394.6 1,463.5 2,262.3 2,479.1 2,320.0 2,008.9 1,228.2 562.7 112.5 0.0 0.0 12,831.8Phase 2 0.0 0.0 0.0 0.0 0.0 0.0 342.5 1,184.3 1,834.5 2,477.5 2,035.6 6,262.5 14,136.9 26,968.6
GC Service fee (7%)Phase 1 0.0 27.6 102.4 158.4 173.5 162.4 140.6 86.0 39.4 7.9 0.0 0.0 898.2Phase 2 0.0 0.0 0.0 0.0 0.0 0.0 24.0 82.9 128.4 173.4 142.5 438.4 989.6 1,887.8
Sub-totalPhase 1 0.0 422.2 1565.9 2420.7 2652.6 2482.4 2149.5 1314.2 602.1 120.4 0.0 0.0 13,730.0Phase 2 0.0 0.0 0.0 0.0 0.0 0.0 366.5 1267.2 1962.9 2650.9 2178.1 6700.9 15,126.4 28,856.4
Land Acquisition and re-settlementPhase 1 113.9 56.1 0.0 0.0 0.0 0.0 0.0 0.0 0.0 0.0 0.0 0.0 170.0Phase 2 0.0 0.0 0.0 0.0 47.5 95.0 47.5 0.0 0.0 0.0 0.0 0.0 190.0 360.0
Public utility relocationPhase 1 115.3 115.3 0.0 0.0 0.0 0.0 0.0 0.0 0.0 0.0 0.0 0.0 230.6Phase 2 0.0 0.0 0.0 0.0 0.0 69.3 69.3 0.0 0.0 0.0 0.0 0.0 138.6 369.2
TOTAL PROJECT CAPITAL COSTPhase 1 229.2 593.6 1565.9 2420.7 2652.6 2482.4 2149.5 1314.2 602.1 120.4 0.0 0.0 14,130.5Phase 2 0.0 0.0 0.0 0.0 47.5 164.3 483.3 1267.2 1962.9 2650.9 2178.1 6700.9 15,455.0 29,585.6
Year

JICA
PR
EP
AR
AT
OR
Y S
UR
VE
Y O
N
GR
EA
TE
R C
AIR
O M
ET
RO
LIN
E N
O.4
Fin
al R
epo
rt - Vo
lum
e 3
1
3-4
Table 13-2 Summary of initial capital costs used as input for the Discounted Cash Flow (DCF) analysis (Normal Loan)
Capital cost component 2011 2012 2013 2014 2015 2016 2017 2018 2019 2020 2021 2022 Phase Project totalstotals (Phases 1+2)
Civil works - tunnellingPhase 1 0.0 0.0 0.0 20.7 279.7 518.1 497.3 238.2 0.0 0.0 0.0 0.0 1,554.1Phase 2 0.0 0.0 0.0 0.0 0.0 0.0 0.0 0.0 198.6 342.4 285.9 29.1 855.9 2,410.0
Civil works (except tunnelling)Phase 1 0.0 0.0 0.0 373.9 1,183.7 1,496.2 1,434.8 625.4 333.9 0.0 0.0 0.0 5,447.9Phase 2 0.0 0.0 0.0 0.0 0.0 0.0 0.0 697.8 1,473.0 1,417.8 828.7 348.9 4,766.2 10,214.1
E&M equipmentPhase 1 0.0 0.0 0.0 0.0 0.0 248.0 547.0 893.7 1,112.3 665.5 0.0 0.0 3,466.5Phase 2 0.0 0.0 0.0 0.0 0.0 0.0 0.0 0.0 0.0 551.2 868.6 868.6 2,288.4 5,754.9
Total construction capital costsPhase 1 0.0 0.0 0.0 394.6 1,463.5 2,262.3 2,479.1 1,757.3 1,446.2 665.5 0.0 0.0 10,468.5Phase 2 0.0 0.0 0.0 0.0 0.0 0.0 0.0 697.8 1,671.5 2,311.4 1,983.2 1,246.6 7,910.5 18,379.0
Rolling stockPhase 1 0.0 0.0 0.0 0.0 0.0 562.7 562.7 562.7 562.7 112.5 0.0 0.0 2,363.2Phase 2 0.0 0.0 0.0 0.0 0.0 0.0 0.0 0.0 0.0 0.0 0.0 5,064.0 5,064.0 7,427.3
Total construction & rolling stockPhase 1 0.0 0.0 0.0 394.6 1,463.5 2,825.0 3,041.8 2,320.0 2,008.9 778.1 0.0 0.0 12,831.8Phase 2 0.0 0.0 0.0 0.0 0.0 0.0 0.0 697.8 1,671.5 2,311.4 1,983.2 6,310.6 12,974.5 25,806.3
GC Service fee (7%)Phase 1 0.0 0.0 0.0 27.6 102.4 197.7 212.9 162.4 140.6 54.5 0.0 0.0 898.2Phase 2 0.0 0.0 0.0 0.0 0.0 0.0 0.0 48.8 117.0 161.8 138.8 441.7 908.2 1,806.4
Sub-totalPhase 1 0.0 0.0 0.0 422.2 1565.9 3022.7 3254.7 2482.4 2149.5 832.5 0.0 0.0 13,730.0Phase 2 0.0 0.0 0.0 0.0 0.0 0.0 0.0 746.6 1788.5 2473.2 2122.0 6752.4 13,882.7 27,612.7
Land Acquisition and re-settlementPhase 1 0.0 0.0 116.3 57.3 0.0 0.0 0.0 0.0 0.0 0.0 0.0 0.0 173.5Phase 2 0.0 0.0 0.0 0.0 23.7 95.0 71.2 0.0 0.0 0.0 0.0 0.0 190.0 363.5
Public utility relocationPhase 1 0.0 0.0 115.3 115.3 0.0 0.0 0.0 0.0 0.0 0.0 0.0 0.0 230.6Phase 2 0.0 0.0 0.0 0.0 0.0 0.0 138.6 0.0 0.0 0.0 0.0 0.0 138.6 369.2
BD and TDPhase 1 0.0 0.0 55.1 55.1 0.0 0.0 0.0 0.0 0.0 0.0 0.0 0.0 110.2Phase 2 0.0 0.0 0.0 0.0 0.0 0.0 110.2 0.0 0.0 0.0 0.0 0.0 110.2 220.5
TOTAL PROJECT CAPITAL COSTPhase 1 0.0 0.0 286.7 649.9 1565.9 3022.7 3254.7 2482.4 2149.5 832.5 0.0 0.0 14,244.3Phase 2 0.0 0.0 0.0 0.0 23.7 95.0 320.1 746.6 1788.5 2473.2 2122.0 6752.4 14,321.5 28,565.9
Year

JICA
PR
EP
AR
AT
OR
Y S
UR
VE
Y O
N
GR
EA
TE
R C
AIR
O M
ET
RO
LIN
E N
O.4
Fin
al R
epo
rt - Vo
lum
e 3
1
3-5
Table 13-3 Summary of Initial Capital Costs used as Input for the Economic Flow Analysis
Source: JICA Study Team
Capital Cost Component SPF 2011 2012 2013 2014 2015 2016 2017 2018 2019 2020 2021 2022 Phase Project totalstotals (Phases 1+2)
Civil works - tunnelling 0.830.0 17.1 230.8 427.5 410.3 196.5 0.0 0.0 0.0 0.0 0.0 0.0 1,282.10.0 0.0 0.0 0.0 0.0 0.0 0.0 46.6 258.4 282.4 118.6 0.0 706.1 1,988.2
Civil works (except tunnelling) 0.840.0 314.0 993.0 1,256.2 1,205.6 526.9 280.5 0.0 0.0 0.0 0.0 0.0 4,576.10.0 0.0 0.0 0.0 0.0 0.0 288.2 947.2 1,192.2 995.4 583.7 0.0 4,006.6 8,582.7
E&M equipment 0.790.0 0.0 0.0 195.9 432.1 706.8 877.2 523.9 0.0 0.0 0.0 0.0 2,736.00.0 0.0 0.0 0.0 0.0 0.0 0.0 0.0 81.8 752.1 946.6 942.9 2,723.4 5,459.4
Total construction capital costs 0.810.0 331.0 1,223.8 1,879.6 2,048.0 1,430.2 1,157.7 523.9 0.0 0.0 0.0 0.0 8,594.20.0 0.0 0.0 0.0 0.0 0.0 288.2 993.8 1,532.4 2,030.0 1,648.9 942.9 7,436.2 16,030.4
Rolling stock 0.750.0 0.0 0.0 0.0 0.0 422.0 422.0 422.0 422.0 84.4 0.0 0.0 1,772.40.0 0.0 0.0 0.0 0.0 0.0 0.0 0.0 0.0 0.0 0.0 3,798.0 3,798.0 5,570.4
Total construction & rolling stock0.0 331.0 1,223.8 1,879.6 2,048.0 1,852.2 1,579.7 945.9 422.0 84.4 0.0 0.0 10,366.60.0 0.0 0.0 0.0 0.0 0.0 288.2 993.8 1,532.4 2,030.0 1,648.9 4,740.9 11,234.2 21,600.8
GC Service fee (7%)0.0 23.2 85.7 131.6 143.4 129.7 110.6 66.2 29.5 5.9 0.0 0.0 725.70.0 0.0 0.0 0.0 0.0 0.0 20.2 69.6 107.3 142.1 115.4 331.9 786.4 1,512.1
Sub-total0.0 354.2 1309.4 2011.2 2191.4 1981.9 1690.3 1012.1 451.5 90.3 0.0 0.0 11,092.30.0 0.0 0.0 0.0 0.0 0.0 308.3 1063.4 1639.7 2172.1 1764.3 5072.8 12,020.6 23,112.9
Land Acquisition and re-settlement 1.0113.9 56.1 0.0 0.0 0.0 0.0 0.0 0.0 0.0 0.0 0.0 0.0 170.0
0.0 0.0 0.0 0.0 47.5 95.0 47.5 0.0 0.0 0.0 0.0 0.0 190.0 360.0Public utility relocation 1.0
115.3 115.3 0.0 0.0 0.0 0.0 0.0 0.0 0.0 0.0 0.0 0.0 230.60.0 0.0 0.0 0.0 0.0 69.3 69.3 0.0 0.0 0.0 0.0 0.0 138.6 369.2
TOTAL PROJECT CAPITAL COST229.2 525.6 1309.4 2011.2 2191.4 1981.9 1690.3 1012.1 451.5 90.3 0.0 0.0 11,492.9
0.0 0.0 0.0 0.0 47.5 164.3 425.1 1063.4 1639.7 2172.1 1764.3 5072.8 12,349.2 23,842.0
Phase 1Phase 2
Phase 1Phase 2
Phase 1Phase 2
Phase 1Phase 2
Phase 1Phase 2
Phase 1Phase 2
Phase 1Phase 2
Phase 1Phase 2
Phase 1Phase 2
Phase 1Phase 2
Phase 1Phase 2
Year

JICA
PR
EP
AR
AT
OR
Y S
UR
VE
Y O
N
GR
EA
TE
R C
AIR
O M
ET
RO
LIN
E N
O.4
Fin
al R
epo
rt - Vo
lum
e 3
1
3-6
(ii) Entire Project (Phases 1 and 2) –Financial Costs
Source: JICA Study Team
Table 13-4 Summary of Rolling Stock Investment Costs used for DCF Analysis
(i) Phase 1 Only – Financial Costs
Source: JICA Study Team
Year Purchase Disbursement Half-life Disbursement Rolling stock Total rolling stockschedule -init.purchase refurbishment - refurbishmenreplacements capital (No. cars)unit price: schedule unit price: unit price: disbursements
14.07 (No. cars) 9.85 14.07L.E. mill. L.E. mill. L.E. mill. L.E. mill.
201120122013201420152016 40 562.67 562.672017 40 562.67 562.672018 40 562.67 562.672019 40 562.67 562.672020 8 112.53 112.532021 0 0.00 0.002022 0 0.00 0.002023 0 0.00 0.002024 8 112.53 112.532025 8 112.53 112.532026 8 112.53 112.532027 0 0.00 0.002028 0 0.00 0.002029 8 112.53 112.532030 0 0.00 0.002031 8 112.53 112.532032 0 0.00 0.002033 0 0.00 0.002034 16 225.07 160 1,575.48 1,800.552035 0 0.00 8 78.77 78.772036 0 0.00 0 0.00 0.002037 8 112.53 0 0.00 112.532038 0 0.00 0 0.00 0.002039 0 0.00 8 78.77 78.772040 8 112.53 8 78.77 191.312041 0 0.00 8 78.77 78.772042 0 0.00 0 0.00 0.002043 8 112.53 0 0.00 112.532044 0 0.00 8 78.77 78.772045 0 0.00 0 0.00 0.002046 8 112.53 8 78.77 191.312047 0 0.00 0 0.00 0.002048 0 0.00 0 0.00 0.002049 8 112.53 16 157.55 2,250.69 2,520.772050 0 0.00 0 0.00 112.53 112.53
Residual value -300.09 -330.85 -2,213.18 -2,844.12Totals 264 3,413.54 224 1,874.82 150.05 5,438.41

JICA
PR
EP
AR
AT
OR
Y S
UR
VE
Y O
N
GR
EA
TE
R C
AIR
O M
ET
RO
LIN
E N
O.4
Fin
al R
epo
rt - Vo
lum
e 3
1
3-7
(ii) Entire project (Phases 1 and 2) – Economic Costs
Source: JICA Study Team
Table 13-5 Summary of Rolling Stock Investment Costs used for Economic Flow Analysis
(i) Phase 1 Only – Economic Costs
Source: JICA Study Team

JICA PREPARATORY SURVEY ON GREATER CAIRO METRO LINE NO.4
Final Report - Volume 3 13-8
Table 13-6 O&M Costs – Financial and Economic (LE million)
(i) Phase 1 only - Financial
Year Personnel Parts and materialsPower consumptionSecurity and other Total
2020 35.245 50.693 13.534 9.546 109.0182023 34.069 52.381 13.959 9.568 109.9772027 17.234 57.445 14.666 9.620 98.9652050 19.298 72.637 16.522 9.768 118.226
(ii) Phase 1 only - Economic
Year Personnel Parts and materialsPower consumptionSecurity and other Total
2020 33.889 38.020 17.560 8.592 98.0612023 32.692 39.286 18.112 8.611 98.7012027 15.511 43.084 19.029 8.658 86.2812050 17.368 54.478 21.438 8.791 102.075
(iii) Entire route (Phases 1 and 2 combined) - Financial
Year Personnel Parts and materialsPower consumptionSecurity and other Total
2020 35.245 50.693 13.534 9.546 109.0182023 55.225 142.728 32.397 19.191 249.5422027 37.396 146.104 32.789 19.265 235.5552050 37.924 149.480 33.299 19.297 240.000
(iv) Entire route (Phases 1 and 2 combined) - Economic
Year Personnel Parts and materialsPower consumptionSecurity and other Total
2020 33.889 38.020 17.560 8.592 98.0612023 52.325 107.046 42.036 17.272 218.6782027 33.656 109.578 42.544 17.339 203.1182050 34.132 112.110 43.206 17.367 206.815
Source: JICA Study Team
13.2.2 Other Common Assumptions related to the Economic and Financial Appraisals of Line 4
(i) Evaluation Period The evaluation period assumed for the appraisal of both the Phase 1 route section and the
entire route (Phase 1 and 2) starts in 2011, when land must be acquired and compensation
to affected persons paid to allow construction to proceed, and ends in 2050, which is the
last year of the demand forecast. The construction period (2012-2019 in the case of Phase
1 and 2017-2023 in the case of Phase 2) forms part of the evaluation period, as does the
operating period (2020-2050 in case of the Phase 1 only project and 2023-2050 in the case
of the combined Phase 1 and 2 project).
If the project would be financed by General Loan (rather than by a STEP Loan), construction would be delayed by two years owing to the need to appoint a consultant, through an International Competitive Bidding process, to undertake the BD. In this case,
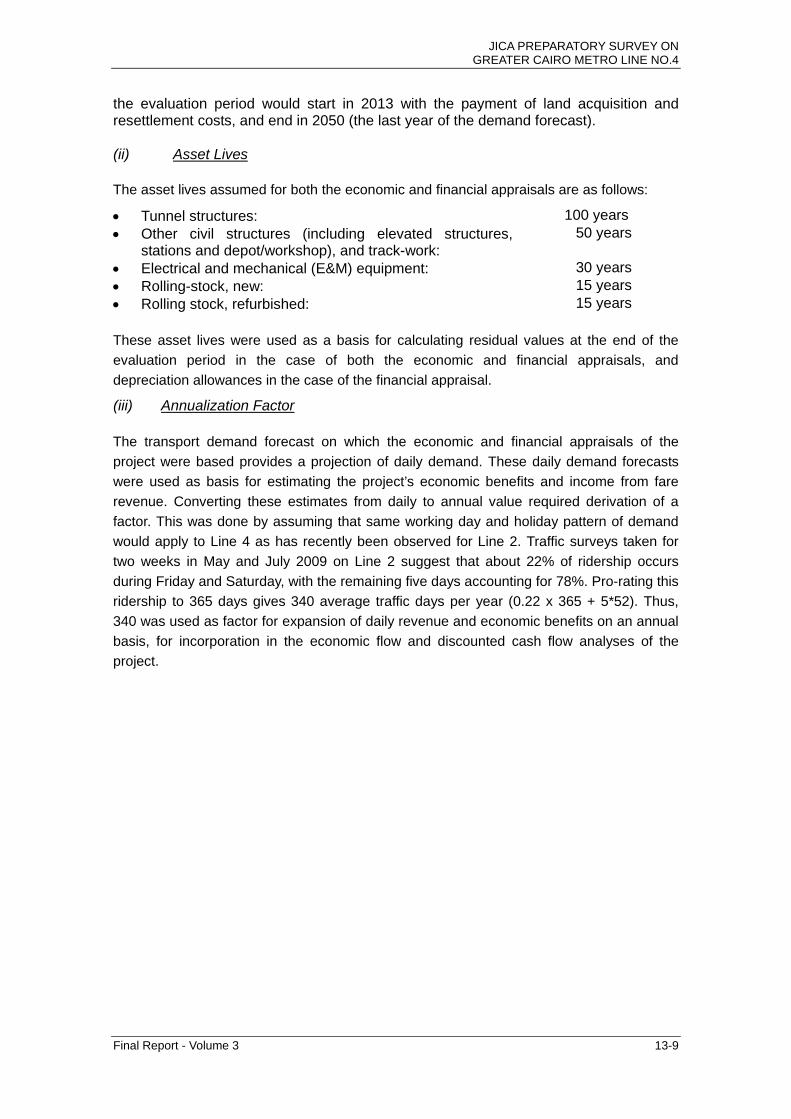
JICA PREPARATORY SURVEY ON GREATER CAIRO METRO LINE NO.4
Final Report - Volume 3 13-9
the evaluation period would start in 2013 with the payment of land acquisition and resettlement costs, and end in 2050 (the last year of the demand forecast). (ii) Asset Lives The asset lives assumed for both the economic and financial appraisals are as follows:
Tunnel structures: 100 years Other civil structures (including elevated structures,
stations and depot/workshop), and track-work: 50 years
Electrical and mechanical (E&M) equipment: 30 years Rolling-stock, new: 15 years Rolling stock, refurbished: 15 years These asset lives were used as a basis for calculating residual values at the end of the
evaluation period in the case of both the economic and financial appraisals, and
depreciation allowances in the case of the financial appraisal.
(iii) Annualization Factor The transport demand forecast on which the economic and financial appraisals of the
project were based provides a projection of daily demand. These daily demand forecasts
were used as basis for estimating the project’s economic benefits and income from fare
revenue. Converting these estimates from daily to annual value required derivation of a
factor. This was done by assuming that same working day and holiday pattern of demand
would apply to Line 4 as has recently been observed for Line 2. Traffic surveys taken for
two weeks in May and July 2009 on Line 2 suggest that about 22% of ridership occurs
during Friday and Saturday, with the remaining five days accounting for 78%. Pro-rating this
ridership to 365 days gives 340 average traffic days per year (0.22 x 365 + 5*52). Thus,
340 was used as factor for expansion of daily revenue and economic benefits on an annual
basis, for incorporation in the economic flow and discounted cash flow analyses of the
project.

JICA PREPARATORY SURVEY ON GREATER CAIRO METRO LINE NO.4
Final Report - Volume 3 13-10
13.3 Economic Appraisal
This section describes the methodology, assumptions and results of economic appraisals
undertaken in the case of the Phase 1 only section and of the entire route incorporating
both Phases 1 and 2.
13.3.1 Methodology
This economic appraisal of the Cairo Metro Line 4 project conventionally measures the net
economic benefits of the project to society (in this case the local economy) by comparing,
over the life of the project, its economic benefits with its shadow-priced capital and
operating costs.
The economic costs of the project have been identified and defined in the foregoing
sections of this chapter.
The economic benefits of the project are measured by comparing the economic, or
resource, costs of urban transport in the Greater Cairo Area, “with” and “without” the project.
The presumption is that the project will reduce these costs, by reducing the volume of traffic
circulation (measured in terms of vehicle-kilometres and vehicle-hours) on the urban road
network. The reduction in the volume of road traffic circulation will save in vehicle operating
costs (VOCs) and reduce air pollution costs and indirectly, through a reduction in traffic
congestion and an increase in the average road traffic speed, save value of travel time
(VOT).
The following sections describe the key assumptions and demand forecasts underlying the
analysis of the project’s economic benefits.
(i) Definition of the “With” and “Without” Project Cases The “without” project case was established by determining what alternative transport modes
and routes will operate, as part of the urban public transport network, in the absence of
Cairo Metro Line 4. This case will therefore include all existing transport components of this
network which are expected to continue operating, in addition to projects currently under
construction; or for which funding has been, or is likely to be, committed to enable
construction to be completed and operation to start, within the forecast period up until 2050.
The Greater Cairo transport network, which is assumed to operate in the absence of Line 4,
was defined in Section 4.4.1 (2) of Feasibility Study Report 1. This network includes:
The existing metro network, consisting of Lines 1 and 2, with the addition of Line 3 (currently under construction);
The existing urban road network; The existing ENR suburban network and the Heliopolis tram; A total of sixteen urban road projects, which were identified in the SDMP report as
being either under construction or under detailed planning in 2007; and

JICA PREPARATORY SURVEY ON GREATER CAIRO METRO LINE NO.4
Final Report - Volume 3 13-11
A total of six additional urban transport projects identified by the General Office for Physical Planning (GOPP) 2 as in progress or committed and which are likely to have an impact on the demand for Cairo Metro Line 4. These include: the East Wing Railway of ENR; the Exclusive Busway system in the 26th July Corridor from Cairo University Metro Station to 6th October City (about 40 km); the Heliopolis Super Tram Project upgrading of Heliopolis Tram and extension to New Cairo (NUC); the Urban Tollway Project in East Cairo; and six road projects around the Grand Egyptian Museum and El Remayah Square aimed at relief of local traffic congestion.
The “with” project case then measures the traffic impact of the addition of the Cairo Metro
Line 4 project to the Greater Cairo transport network operated in the “without” case.
(ii) Estimation and comparison of traffic circulation volumes associated with the “With” and “Without” project cases The economic benefits of the project are measured by comparing the economic cost
streams associated with the “with” and “without” project cases. These cost streams are in
estimated based on the comparison of daily traffic circulation volumes for each case,
expressed in terms of PCU-kilometres and PCU-hours.3 In addition, the reduction in
passenger-hours resulting from the reduced travel time for metro passengers, “with” the
project, is also measured. These estimates have been produced as a by-product of the
transport demand forecast, and are summarized in the case of traffic circulation in Greater
Cairo in Table 13-7 and the case of reduced travel time for metro users in Table 13-8.
Table 13-7 Greater Cairo Daily Traffic Circulation “With” and “Without” the Project
(i) Phase 1 Project Only
PCU-km per day PCU-hr per day Forecast Year “With”
project “Without”
project Difference “With”
project “Without”
project Difference
2020 98,731,961 99,121,495 -389,534 4,282,355 4,325,890 -43,5352023 110,374,324 110,822,126 -447,803 4,916,638 4,965,616 -48,9782027 130,692,469 131,379,443 -686,974 6,046,580 6,115,575 -68,9962050 246,472,181 247,710,296 -1,238,115 12,996,878 13,122,064 -125,186
(ii) Entire Route (Phase 1 and 2 Combined)
PCU-Km per day PCU-Hours per day Forecast Year “With”
project “Without”
project Difference “With”
project “Without”
project Difference
2020 98,731,961 99,121,495 -389,534 4,282,355 4,325,890 -43,5352023 110,374,324 111,320,065 -945,741 4,916,638 4,993,470 -76,8312027 130,692,469 131,680,555 -988,086 6,046,580 6,129,664 -83,0842050 246,472,181 248,000,050 -1,527,870 12,996,878 13,145,552 -148,673
Source: JICA Study Team
2 A division of the Ministry of Housing, Public Utilities and Urban Development. 3 “PCU” means “Passenger Car Unit”, a standard unit for measuring traffic volume, which results from expressing different vehicle types as in terms of an equivalent number of PCU, e.g. a large truck or a large bus is equivalent to 2.5 PCU, a motorcycle is equivalent to 0.3 PCU, and so on.
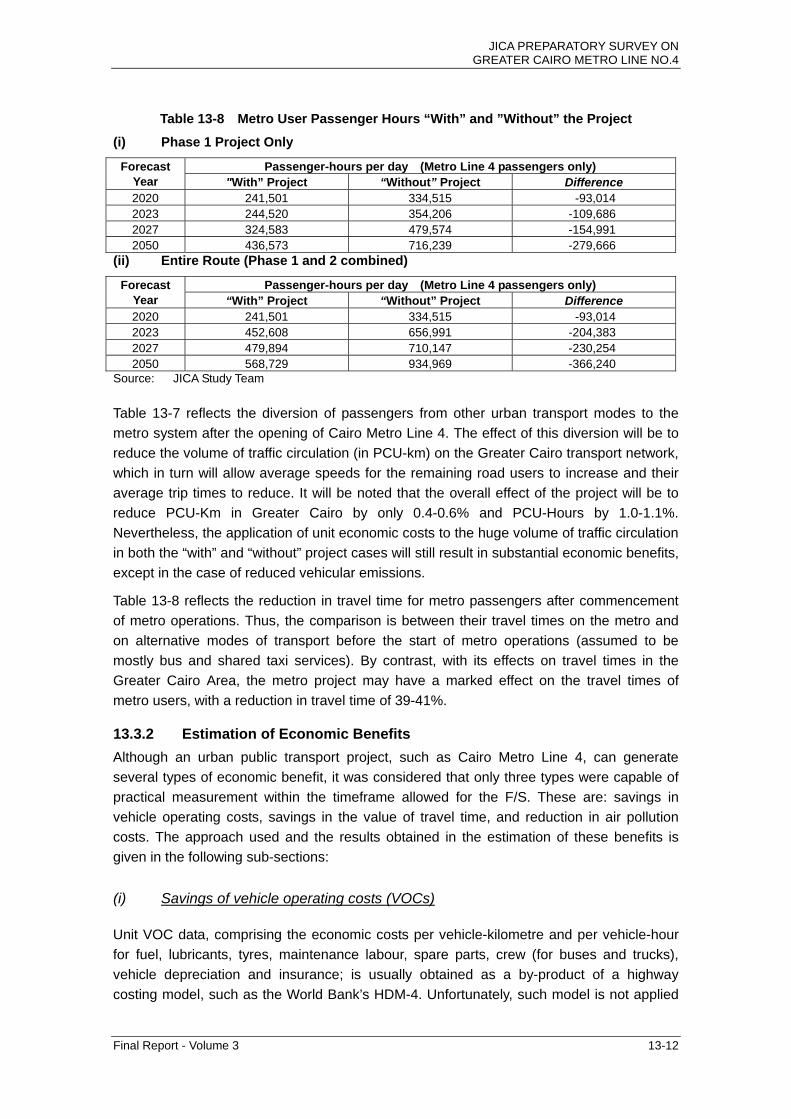
JICA PREPARATORY SURVEY ON GREATER CAIRO METRO LINE NO.4
Final Report - Volume 3 13-12
Table 13-8 Metro User Passenger Hours “With” and ”Without” the Project
(i) Phase 1 Project Only
Passenger-hours per day (Metro Line 4 passengers only) Forecast Year "With” Project “Without” Project Difference 2020 241,501 334,515 -93,014 2023 244,520 354,206 -109,686 2027 324,583 479,574 -154,991 2050 436,573 716,239 -279,666
(ii) Entire Route (Phase 1 and 2 combined)
Passenger-hours per day (Metro Line 4 passengers only) Forecast Year “With” Project “Without” Project Difference 2020 241,501 334,515 -93,014 2023 452,608 656,991 -204,383 2027 479,894 710,147 -230,254 2050 568,729 934,969 -366,240
Source: JICA Study Team Table 13-7 reflects the diversion of passengers from other urban transport modes to the
metro system after the opening of Cairo Metro Line 4. The effect of this diversion will be to
reduce the volume of traffic circulation (in PCU-km) on the Greater Cairo transport network,
which in turn will allow average speeds for the remaining road users to increase and their
average trip times to reduce. It will be noted that the overall effect of the project will be to
reduce PCU-Km in Greater Cairo by only 0.4-0.6% and PCU-Hours by 1.0-1.1%.
Nevertheless, the application of unit economic costs to the huge volume of traffic circulation
in both the “with” and “without” project cases will still result in substantial economic benefits,
except in the case of reduced vehicular emissions.
Table 13-8 reflects the reduction in travel time for metro passengers after commencement
of metro operations. Thus, the comparison is between their travel times on the metro and
on alternative modes of transport before the start of metro operations (assumed to be
mostly bus and shared taxi services). By contrast, with its effects on travel times in the
Greater Cairo Area, the metro project may have a marked effect on the travel times of
metro users, with a reduction in travel time of 39-41%.
13.3.2 Estimation of Economic Benefits
Although an urban public transport project, such as Cairo Metro Line 4, can generate
several types of economic benefit, it was considered that only three types were capable of
practical measurement within the timeframe allowed for the F/S. These are: savings in
vehicle operating costs, savings in the value of travel time, and reduction in air pollution
costs. The approach used and the results obtained in the estimation of these benefits is
given in the following sub-sections:
(i) Savings of vehicle operating costs (VOCs) Unit VOC data, comprising the economic costs per vehicle-kilometre and per vehicle-hour
for fuel, lubricants, tyres, maintenance labour, spare parts, crew (for buses and trucks),
vehicle depreciation and insurance; is usually obtained as a by-product of a highway
costing model, such as the World Bank’s HDM-4. Unfortunately, such model is not applied

JICA PREPARATORY SURVEY ON GREATER CAIRO METRO LINE NO.4
Final Report - Volume 3 13-13
for the purposes of transport project evaluation in Egypt, so it was necessary to make
estimates on the basis of information supplied by auto retailers, bus operating companies,
truck operators, and insurance companies, as well as to review the VOC data generated in
the SDMP study.
Fuel costs have been estimated separately from non-fuel VOCs, mainly because of the
differences in the economic structure of fuel prices, as compared with the prices of other
VOC components. Hence, the methods to be used must have conversion of VOCs in
financial values to economic values. In addition, since the emissions of GHGs (Greenhouse
Gases) and other pollutants are related to the volume of fuel consumed, it was necessary
to make a separate calculation of fuel consumed in both the “with” and ”without” cases. This
is done by applying to vehicle-kilometre in both cases, the typical fuel consumption rates of
representative vehicles in each type category.
For the economic appraisal, fuel is valued at retail price, plus an allowance for the fuel price
subsidies applied by the Egyptian Government. Although CNG is now widely used as an
automotive fuel in Cairo, its overall volume as a share of the total volume of fuel consumed
in the city is still quite small. Thus, it was assumed that, for all practical purposes, diesel
and gasoline would account for nearly all of the fuel consumed in the Greater Cairo area.
The physical vehicle characteristics used as parameters for establishing unit VOCs are
given in Table 13-9.
Table 13-9 Physical Characteristics of Vehicle Population
Private cars Taxis Shared taxis (mini-buses)
Medium buses
Large buses Light trucks Medium trucks
Heavy trucks
Representative vehicle type
1600 CC sedan
Four wheel rigid
Six wheel rigid
Ten wheel rigid
Annual Km 20,000 80,000 100,000 75,000 75,000 50,000 75,000 75,000
Annual operating hours
400 3,433 4,286 4,737 4,737 1,300 1,950 1,950
Fuel consumption 96 100 138 160 300 160 250 357
(litres/'000 kmAssumed life (yrs) 13 10 10 10 13 10 12 13
Deprec % dist.rel. 79% 81% 81% 89% 90% 88% 89% 89%
Deprec % time rel. 21% 19% 19% 11% 10% 12% 11% 11%
Tyre number 4 4 4 6 6 4 6 10
Average crew size Not relevant 1 1 2 2 1 2 2
Average vehicle occupancy
1.9 2.0 11.0 15.0 47.0 Not relevant Not relevant Not relevant
Item Vehicle type:
Sources: SDMP study report; consultant’s estimates, based on enquiries to transport operators
For the purposes of revaluing unit VOCs from financial to economic values, it was
necessary to establish appropriate conversion factors. Different factors were derived for
different types of inputs.
Traded inputs, such as imported vehicles and tyres, are valued at border prices by
excluding import duties and other taxes. For this purpose, a standard conversion factor
developed for the SDMP study of 0.84 was used. This factor was derived as the ratio

JICA PREPARATORY SURVEY ON GREATER CAIRO METRO LINE NO.4
Final Report - Volume 3 13-14
between the value of imports and exports and with the addition of import duties and
subtraction of export duties.4
The economic values for non-traded inputs, comprising services and locally manufactured
goods, were established by eliminating the sales tax component from domestic prices, and
in certain special cases (such as petroleum fuels) by eliminating subsidies. Since sales tax
rates of 10% and 15% apply respectively to services and to most locally manufactured
goods, economic values for these inputs were established through adjustment factors of
0.91 and 0.87 to domestic prices.
The rate of subsidy on petroleum fuels was the quotient the total amount of the subsidy in
2006/07 for gasoline and diesel fuel respectively by the total volume of these fuels
consumed domestically in that particular year. This rate was reduced to reflect the expected
reduction of LE15 billion in the level of the subsidy over the next three years, as shown in
Table 13-10.
Table 13-10 Estimation of Petroleum Fuel Subsidies
Amount of subsidy in 2006/2007
Volume consumed
domestically in 2006/2007
Estimated subsidy per
litre
Estimated subsidy after reduction in
2008/2009
(L.E. Million) (Million Litres) (L.E.) (L.E.)
Diesel 10,360 11,670 0.89 0.74Gasoline (all grades) 3,130 4,990 0.63 0.53Average 13,490 16,660 0.81 0.71
Fuel type
Sources: (1) Ministry of Finance website (petroleum subsidies) (2) American Chamber of Commerce: Oil and Energy Profiles in Egypt, 2008 (petroleum consumption) Notes: Fuel prices in Egypt increased in May 2008 by an average of about 46 % per litre5. This was
expected to lead to a reduction in the subsidy of about L.E. 15 billion over three years. The subsidies identified in this table were added to the retail prices of diesel and gasoline to
arrive at the economic prices for these fuels.
Unit economic values for each VOC component are given in Table 13-11, below. They were
derived by the application of relevant conversion factors to financial estimates, which were
obtained from inquiries with motor vehicle sales companies, transport operators, insurers
and repair shops.
For vehicle maintenance costs, it was assumed that: (a) the cost of lubricants is included in
the annual maintenance cost, and (b) that the cost for materials (including spare parts and
lubricants) and the cost of maintenance labour would comprise 45% and 55%, respectively,
4 The Strategic Urban Development Master Plan Study for a Sustainable Development of the Greater Cairo Region in the Arab Republic of Egypt, Final Report (Volume 4), page 8-3 5 After the fuel price increase in May 2008, Egypt still had among the cheapest fuel prices in the world. For example the retail price of gasoline was only L.E. 1.85, or US$ 0.34 per litre, at a time when many developing countries had fuel prices which exceeded US$ 1.00 per litre. Removal of the subsidy would increase this price to L.E. 2.38, or US$ 0.43 per litre, still well below prevailing fuel prices in many countries of the world.
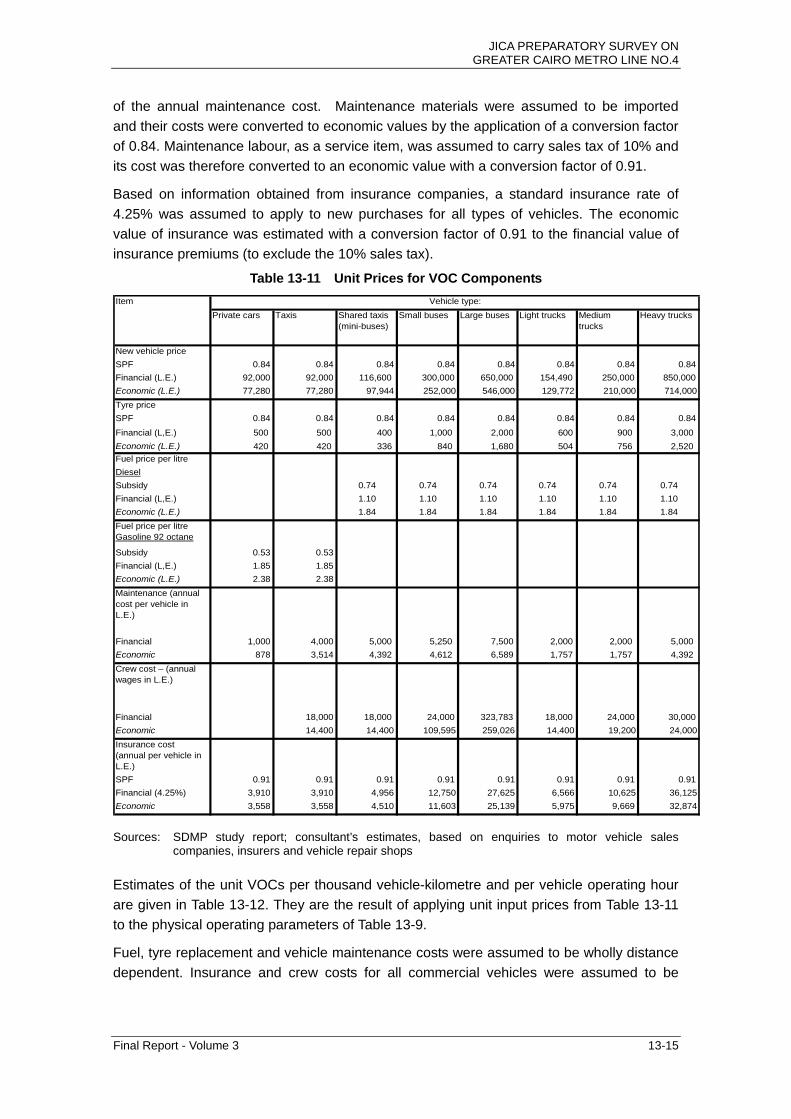
JICA PREPARATORY SURVEY ON GREATER CAIRO METRO LINE NO.4
Final Report - Volume 3 13-15
of the annual maintenance cost. Maintenance materials were assumed to be imported
and their costs were converted to economic values by the application of a conversion factor
of 0.84. Maintenance labour, as a service item, was assumed to carry sales tax of 10% and
its cost was therefore converted to an economic value with a conversion factor of 0.91.
Based on information obtained from insurance companies, a standard insurance rate of
4.25% was assumed to apply to new purchases for all types of vehicles. The economic
value of insurance was estimated with a conversion factor of 0.91 to the financial value of
insurance premiums (to exclude the 10% sales tax).
Table 13-11 Unit Prices for VOC Components
Private cars Taxis Shared taxis (mini-buses)
Small buses Large buses Light trucks Medium trucks
Heavy trucks
New vehicle price
SPF 0.84 0.84 0.84 0.84 0.84 0.84 0.84 0.84
Financial (L.E.) 92,000 92,000 116,600 300,000 650,000 154,490 250,000 850,000
Economic (L.E.) 77,280 77,280 97,944 252,000 546,000 129,772 210,000 714,000
Tyre price
SPF 0.84 0.84 0.84 0.84 0.84 0.84 0.84 0.84
Financial (L,E.) 500 500 400 1,000 2,000 600 900 3,000
Economic (L.E.) 420 420 336 840 1,680 504 756 2,520
Fuel price per litre
Diesel
Subsidy 0.74 0.74 0.74 0.74 0.74 0.74
Financial (L,E.) 1.10 1.10 1.10 1.10 1.10 1.10
Economic (L.E.) 1.84 1.84 1.84 1.84 1.84 1.84
Fuel price per litre Gasoline 92 octane
Subsidy 0.53 0.53
Financial (L,E.) 1.85 1.85
Economic (L.E.) 2.38 2.38
Maintenance (annual cost per vehicle in L.E.)
Financial 1,000 4,000 5,000 5,250 7,500 2,000 2,000 5,000
Economic 878 3,514 4,392 4,612 6,589 1,757 1,757 4,392
Crew cost – (annual wages in L.E.)
Financial 18,000 18,000 24,000 323,783 18,000 24,000 30,000
Economic 14,400 14,400 109,595 259,026 14,400 19,200 24,000
Insurance cost (annual per vehicle in L.E.)
SPF 0.91 0.91 0.91 0.91 0.91 0.91 0.91 0.91
Financial (4.25%) 3,910 3,910 4,956 12,750 27,625 6,566 10,625 36,125
Economic 3,558 3,558 4,510 11,603 25,139 5,975 9,669 32,874
Item Vehicle type:
Sources: SDMP study report; consultant’s estimates, based on enquiries to motor vehicle sales
companies, insurers and vehicle repair shops Estimates of the unit VOCs per thousand vehicle-kilometre and per vehicle operating hour
are given in Table 13-12. They are the result of applying unit input prices from Table 13-11
to the physical operating parameters of Table 13-9.
Fuel, tyre replacement and vehicle maintenance costs were assumed to be wholly distance
dependent. Insurance and crew costs for all commercial vehicles were assumed to be

JICA PREPARATORY SURVEY ON GREATER CAIRO METRO LINE NO.4
Final Report - Volume 3 13-16
wholly time related. Vehicle depreciation was assumed to be 80-90% distance dependent
and 10-20% time dependent.
Tyres were assumed to be replaced every two years for private cars and every year for all
other vehicles.
Table 13-12 Estimated Unit Vehicle Operating Costs (VOCs)
Private cars Taxis Shared taxis (mini-buses)
Medium buses
Large buses Light trucks Medium trucks
Heavy trucks
Fuel cost 228.48 238.00 253.92 294.40 552.00 294.40 460.00 656.88
Tyre cost 42.00 42.00 26.88 38.64 84.00 40.32 60.48 336.00
Maintenance cost 43.90 43.93 43.92 61.49 87.85 35.14 23.43 58.56
Depreciation cost 236.07 78.43 79.46 199.07 276.99 227.76 206.65 650.25
Sub-total 550.45 402.35 404.18 593.60 1,000.84 597.62 750.56 1,701.69
Overhead rate 15% 15% 20% 20% 25% 35% 35%
Overhead cost 0 60.35 60.63 118.72 200.17 149.40 262.70 595.59
Total 550.45 462.71 464.81 712.32 1,201.01 747.02 1,013.25 2,297.28
Crew cost 4.19 3.36 4.05 5.07 11.08 9.85 12.31
Insurance cost 8.90 1.04 1.05 1.63 2.92 4.60 4.96 16.86
Depreciation Cost 39.81 4.24 4.30 3.95 6.38 12.25 12.32 41.03
Sub-total 48.70 9.47 8.71 9.63 14.37 27.92 27.12 70.19
Overhead rate 15% 15% 20% 20% 25% 35% 35%
Overhead cost - 1.42 1.31 1.93 2.87 6.98 9.49 24.57
Total 48.70 10.89 10.02 11.56 17.24 34.90 36.61 94.76
Annual Km 20,000 80,000 100,000 75,000 75,000 50,000 75,000 75,000
Annual Hours 400 3,433 4,286 4,737 4,737 1,300 1,950 1,950
Distance related VOC (L.E. per thousand Km)
Time related VOC (L.E. per hour)
Item Vehicle type:
Sources: SDMP study report; consultant’s estimates
Since the transport demand forecasts used as a basis for economic benefit estimation are
expressed in terms of PCU-kilometre and PCU-hour (see section 13.3.1), it was necessary
to convert the vehicle operating costs in Table 13-12 to PCU-based rates. This was done by
weighting costs by vehicle type in relation to both their distribution in the traffic population
and to their PCU equivalence.
Table 13-13 and Table 13-14 give the resulting calculations for distance related and time related PCU, respectively.

JICA PREPARATORY SURVEY ON GREATER CAIRO METRO LINE NO.4
Final Report - Volume 3 13-17
Table 13-13 Conversion of VOC per Vehicle-km to per PCU-km
L.E. L.E.Car 0.529 1 0.5290 0.4805 0.55 0.26Taxi 0.172 1 0.1720 0.1562 0.46 0.0723Shared Taxi 0.151 1.5 0.2265 0.2057 0.46 0.0956Minibus 0.0000Public Bus 0.019 2.5 0.0475 0.0431 1.99 0.0858Private bus 0.0000Pick-up 0.063 1 0.0630 0.0572 0.46 0.02662-Axle 0.018 2 0.0360 0.0327 0.75 0.02443-Axle 1.01 0.0000>3-Axle 0.003 2.5 0.0075 0.0068 2.40 0.0164Motor cycle 0.04 0.3 0.0120 0.0109 0.0000Other 0.005 1.5 0.0075 0.0068 0.0000
Average per PCU-Km 1.000 1.1010 1.0000 0.5856
Type of vehicle
Actual vehicle distribution by type
PCU factor applicable to vehicle type
PCU distribution by vehicle type
Coefficient VOCVOC per vkm Weighted
av.VOC per PCU-Km
Sources: Cairo Metro Line 4 Traffic Survey 2009 (Vehicle Distribution); JICA Study Team estimates (VOC
data).
Table 13-14 Conversion of VOC per Vehicle-hour to per PCU-hour
L.E. L.E.Car 0.529 1 0.5290 0.4805 48.69 23.39Taxi 0.172 1 0.1720 0.1562 10.89 1.7014Shared Taxi 0.151 1.5 0.2265 0.2057 10.02 2.0620Minibus 0.0000Public Bus 0.019 2.5 0.0475 0.0431 85.91 3.7065Private bus 0.0000Pick-up 0.063 1 0.0630 0.0572 10.02 0.57352-Axle 0.018 2 0.0360 0.0327 34.90 1.14113-Axle 36.61 0.0000>3-Axle 0.003 2.5 0.0075 0.0068 94.76 0.6455Motor cycle 0.04 0.3 0.0120 0.0109 0.0000Other 0.005 1.5 0.0075 0.0068 0.0000
Average per PCU-Hour 1.000 1.1010 1.0000 33.2248
Type of vehicle
Actual vehicle distribution by type
PCU factor applicable to vehicle type
PCU distribution by vehicle type
Coefficient VOCVOC per v-hr Weighted
av.VOC per PCU-Hr
Sources: Cairo Metro Line 4 Traffic Survey 2009 (Vehicle Distribution); JICA Study Team estimates (VOC
data). (ii) Travel time savings Travel time savings typically represent a major economic benefit of mass transit projects. In
this F/S, travel time savings have been estimated both for mass transit and remaining road
users. The former receives a direct benefit as a result of much faster mass transit trip times
and while latter receives an indirect benefit resulting from faster average road speeds the
transfer of traffic from the roads to the mass transit system.
VOT savings is conventionally based on household income data with different rates on
different categories of commuters. This reflects the likelihood that bus passengers will value
time differently from private car occupants, while mass transit passengers will value their
time differently from the other two groups of commuters.

JICA PREPARATORY SURVEY ON GREATER CAIRO METRO LINE NO.4
Final Report - Volume 3 13-18
Benefits resulting from the reduction of travel time will be estimated by applying travel time
values to the difference between the person-hours estimated for urban transport network in
the “with” and “without” project cases.
In this F/S, estimates of urban travel time values are based on household income estimates
derived from a household opinion survey conducted by the SDMP study team between
June and July 2007. The SDMP study extended base estimates of value of time up until
2027 at the rates of increase forecast for GDRP per Capita. For the purposes of the F/S, it
was necessary to re-cast the SDMP estimates on the basis of revised per capita GDRP
growth projections (as outlined in Section 3.1.4 of FS Report 1) and to extend the forecast
to 2050.
The socio-economic framework used to forecast household income and the average
income per worker in the study area is given in Table 13-15.
Table 13-15 Socio-Economic Framework in the Study Area
Indicator Unit 2006 2007 2008 2009 2010 2011 2012 2020 2030 2040 2050
Population 1000 16,101 16,464 16,836 17,217 17,606 18,004 18,411 21,639 25,387 28,801 31,815 No.of Households 1000 4,007 4,097 4,190 4,284 4,381 4,480 4,582 5,385 6,318 7,168 7,918 Household S ize Persons/household 4.02 4.02 4.02 4.02 4.02 4.02 4.02 4.02 4.02 4.02 4.02 Average age of HH members Years 28.70 29.00 29.18 29.36 29.54 29.72 29.90 31.68 32.80 33.97 35.17 Labour force 1000 4,613 4,777 4,915 5,056 5,202 5,352 5,506 6,858 8,427 10,005 11,475 Unemployment % 7% 6% 6% 6% 6% 6% 6% 5% 5% 4% 4%No.of Workers Primary 1000 260 266 275 283 288 296 306 380 463 551 627
Secondary 1000 1,667 1,741 1,797 1,849 1,895 1,950 2,014 2,517 3,064 3,642 4,138 Tertiary 1000 2,384 2,467 2,547 2,620 2,707 2,785 2,876 3,619 4,477 5,412 6,251 Total 1000 4,310 4,475 4,620 4,753 4,890 5,031 5,196 6,515 8,006 9,605 11,016
GRDP Million L.E. 148,648 159,202 170,665 178,344 187,083 196,812 208,620 372,070 731,918 1,310,753 2,135,078 GRDP per Capita L.E. per capita 9,232 9,670 10,137 10,359 10,626 10,932 11,331 17,194 28,831 45,510 67,110 Household Income L.E. per household 1,072 1,134 1,189 1,215 1,246 1,282 1,329 2,016 3,381 5,337 7,870 No.workers in household worker/household 1.08 1.09 1.10 1.11 1.12 1.12 1.13 1.21 1.27 1.34 1.39 Worker's income L.E. per worker 997 1,038 1,078 1,095 1,117 1,142 1,172 1,667 2,668 3,983 5,657 Sources: SDMP study; consultant’s estimates The survey-derived household income data on which average values of time were based
are given in Table 13-16. The average number of working hours per month used to
calculate the average monthly income for workers in area was assumed to be 176 (22
working days per month x 8 hours per day).
Table 13-16 Average Monthly and Hourly Income for Workers in the Study Area
Item Unit 2007 2008 2009 2010 2011 2012 2020 2030 2040 2050Low and Middle Income Households L.E./month 748 784 801 822 846 877 1330 2230 3520 5191
High Income Household L.E./month 2,985 3129 3198 3280 3375 3498 5308 8900 14049 20717High and Middle Income Households L.E./month 1,322 1386 1416 1453 1495 1549 2351 3942 6222 9175
Workers/HH 1.09 1.10 1.11 1.12 1.12 1.13 1.21 1.27 1.34 1.39 Low and Middle Income Workers L.E./month 685 711 722 736 753 773 1,099 1,760 2,627 3,731
High Income Workers L.E./month 2,733 2,838 2,882 2,939 3,005 3,085 4,387 7,024 10,484 14,890 High and Middle Income Workers L.E./month 1,210 1,257 1,277 1,302 1,331 1,366 1,943 3,111 4,643 6,595
Hours/month 176 176 176 176 176 176 176 176 176 176Low and Middle Income Workers L.E./hour 3.89 4.04 4.10 4.18 4.28 4.39 6.25 10.00 14.93 21.20High Income Workers L.E./hour 15.53 16.12 16.38 16.70 17.08 17.53 24.93 39.91 59.57 84.60High and Middle Income Workers L.E./hour 6.88 7.14 7.25 7.40 7.56 7.76 11.04 17.67 26.38 37.47
Worker's Hourly Income
Household Income
Workers in household
Worker's Income
Working Hours per Month
Sources: SDMP study; consultant’s estimates Since it is likely that different categories of commuters will value their time differently, it is
necessary to calculate a factor reflecting the weighted average distribution of commuter
trips according to trip purpose, to convert hourly income into time values. This factor, which
was derived from the SDMP demand survey, was found to be 75.5% (see Table 13-17). The
factor was used with the hourly income data in the above table to calculate the average
values of time for the three main commuter categories: public transport users, car users
and taxi and shared taxi users.

JICA PREPARATORY SURVEY ON GREATER CAIRO METRO LINE NO.4
Final Report - Volume 3 13-19
Table 13-17 Weighted Distribution of Commuter Trips by Trip Purpose
Trip Purpose Share (%) Weight Weighted Distribution (%)
Work 44.0 1.0 44.0Business 7.0 1.0 7.0Study 28.9 0.5 14.5Private 20.1 0.5 10.1Total 100.0 3.0 75.5
Source: SDMP study reportNote: The summation of the weighted shares of commuter trips by purpose (75.5%) represents the factor used for conversion of average worker income to average values of travel time. The resulting time value estimates are given in Table 13-18. These estimates assume that:
Public transport users are mostly from the middle and low income groups;
Car users are predominantly from the high income group; and
Taxi and shared taxi users (including air conditioned bus users) are mostly from the high and middle income groups
Table 13-18 Estimated Value of Travel Time, by Commuter Category, in the Study Area
Commuter category Assumed income Unit 2007 2008 2009 2010 2011 2012 2017 2020 2022 2030 2040 2050category
Public Transport Users Middle and low L.E./hour/person 2.94 3.05 3.10 3.16 3.23 3.32 4.13 4.72 5.182 7.55 11.27 16.01Car Users High L.E./hour/person 11.72 12.17 12.37 12.61 12.89 13.23 16.5 18.82 20.68 30.13 44.98 63.88Taxi and shared taxi users High and middle L.E./hour/person 5.19 5.39 5.48 5.58 5.71 5.86 7.3 8.34 9.158 13.34 19.92 28.29 Sources: SDMP study report; consultant’s estimates.
To calculate the value of time savings for the remaining road users, it was necessary to
convert the above unit values of time estimates to rates per PCU-hour. The same method
was used for this purpose as was used with the conversion of VOC estimates. The resulting
estimates of the weighted average value of travel time per PCU-hour in each of the forecast
reference years are given in Table 13-19 below. These estimates were applied to the
savings in PCU-hours to calculate the stream of travel time benefits for road users.
Table 13-19 Conversion of VOT per Person-Hour to per PCU-Hour (Remaining Road Users)
L.E./pers.hr L.E./pers.hr L.E./pers.hr L.E./pers.hr L.E./pers.hr L.E./pers.hr L.E./pers.hr L.E./pers.hr L.E./pers.hr L.E./pers.hr L.E./pers.hr L.E./pers.hrCar 0.529 1 0.5290 0.4805 1.9 0.91 12.61 6.06 16.49 7.92 20.68 9.94 30.13 14.48 44.98 21.61 63.88 30.69Taxi 0.172 1 0.1720 0.1562 2.0 0.31 5.58 0.87 7.30 1.14 9.16 1.43 13.34 2.08 19.92 3.11 28.29 4.42Shared Taxi 0.151 1.5 0.2265 0.2057 11.0 2.26 5.58 1.15 7.30 1.50 9.16 1.88 13.34 2.75 19.92 4.10 28.29 5.82Minibus 0.00Public Bus 0.019 2.5 0.0475 0.0431 55.0 2.37 3.16 0.14 4.13 0.18 5.18 0.22 7.55 0.33 11.27 0.49 16.01 0.69Private bus 0.00Pick-up 0.063 1 0.0630 0.0572 1.0 0.06 3.16 0.18 4.13 0.24 5.18 0.30 7.55 0.43 11.27 0.64 16.01 0.922-Axle 0.018 2 0.0360 0.0327 1.0 0.03 3.16 0.10 4.13 0.14 5.18 0.17 7.55 0.25 11.27 0.37 16.01 0.523-Axle 0.00>3-Axle 0.003 2.5 0.0075 0.0068 2.0 0.01 3.16 0.02 4.13 0.03 5.18 0.04 7.55 0.05 11.27 0.08 16.01 0.11Motor cycle 0.04 0.3 0.0120 0.0109 1.0 0.01 3.16 0.03 4.13 0.05 5.18 0.06 7.55 0.08 11.27 0.12 16.01 0.17Other 0.005 1.5 0.0075 0.0068 1.0 0.01 3.16 0.02 4.13 0.03 5.18 0.04 7.55 0.05 11.27 0.08 16.01 0.11
Average per PCU 1.000 1.1010 1.0000 5.9824 8.5766 11.2185 14.0665 20.4963 30.5953 43.4524Weighted av. per PCU-hour 51.31
Coefficient Av. occupancy per vehicle (no.persons)
Av. occupancy per PCU (no.persons)
2010
Type of vehicle
Actual vehicle distribution by type
PCU factor applicable to vehicle type
PCU distribution by vehicle type
2017 2022 2030 2040 2050Value of time Weighted av.
value of time Value of time Weighted av.
value of time per Value of time Weighted av.
value of time Value of time Weighted av.
value of time Value of time Weighted av.
value of time Value of time
Weighted av. value of
67.11 84.15 122.62 183.03 259.95 Sources: Cairo Metro Line 4 Traffic Survey 2009 (Vehicle Distribution); JICA Study Team (VOT data).
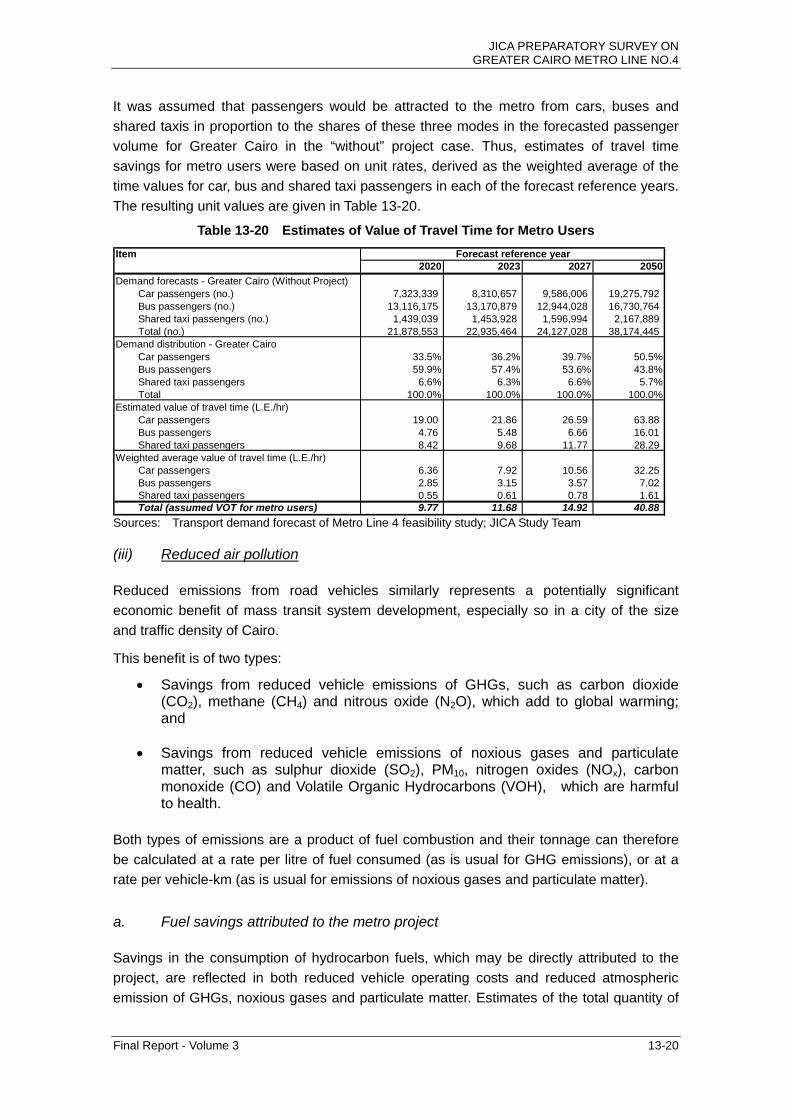
JICA PREPARATORY SURVEY ON GREATER CAIRO METRO LINE NO.4
Final Report - Volume 3 13-20
It was assumed that passengers would be attracted to the metro from cars, buses and
shared taxis in proportion to the shares of these three modes in the forecasted passenger
volume for Greater Cairo in the “without” project case. Thus, estimates of travel time
savings for metro users were based on unit rates, derived as the weighted average of the
time values for car, bus and shared taxi passengers in each of the forecast reference years.
The resulting unit values are given in Table 13-20.
Table 13-20 Estimates of Value of Travel Time for Metro Users
Item2020 2023 2027 2050
Demand forecasts - Greater Cairo (Without Project) Car passengers (no.) 7,323,339 8,310,657 9,586,006 19,275,792 Bus passengers (no.) 13,116,175 13,170,879 12,944,028 16,730,764 Shared taxi passengers (no.) 1,439,039 1,453,928 1,596,994 2,167,889 Total (no.) 21,878,553 22,935,464 24,127,028 38,174,445 Demand distribution - Greater Cairo Car passengers 33.5% 36.2% 39.7% 50.5% Bus passengers 59.9% 57.4% 53.6% 43.8% Shared taxi passengers 6.6% 6.3% 6.6% 5.7% Total 100.0% 100.0% 100.0% 100.0%Estimated value of travel time (L.E./hr) Car passengers 19.00 21.86 26.59 63.88 Bus passengers 4.76 5.48 6.66 16.01 Shared taxi passengers 8.42 9.68 11.77 28.29 Weighted average value of travel time (L.E./hr) Car passengers 6.36 7.92 10.56 32.25 Bus passengers 2.85 3.15 3.57 7.02 Shared taxi passengers 0.55 0.61 0.78 1.61 Total (assumed VOT for metro users) 9.77 11.68 14.92 40.88
Forecast reference year
Sources: Transport demand forecast of Metro Line 4 feasibility study; JICA Study Team (iii) Reduced air pollution Reduced emissions from road vehicles similarly represents a potentially significant
economic benefit of mass transit system development, especially so in a city of the size
and traffic density of Cairo.
This benefit is of two types:
Savings from reduced vehicle emissions of GHGs, such as carbon dioxide (CO2), methane (CH4) and nitrous oxide (N2O), which add to global warming; and
Savings from reduced vehicle emissions of noxious gases and particulate matter, such as sulphur dioxide (SO2), PM10, nitrogen oxides (NOx), carbon monoxide (CO) and Volatile Organic Hydrocarbons (VOH), which are harmful to health.
Both types of emissions are a product of fuel combustion and their tonnage can therefore
be calculated at a rate per litre of fuel consumed (as is usual for GHG emissions), or at a
rate per vehicle-km (as is usual for emissions of noxious gases and particulate matter).
a. Fuel savings attributed to the metro project Savings in the consumption of hydrocarbon fuels, which may be directly attributed to the
project, are reflected in both reduced vehicle operating costs and reduced atmospheric
emission of GHGs, noxious gases and particulate matter. Estimates of the total quantity of

JICA PREPARATORY SURVEY ON GREATER CAIRO METRO LINE NO.4
Final Report - Volume 3 13-21
fuel saved by diversion of traffic from the urban road network to metro were made by
applying a rate of fuel consumed per PCU-km to the forecasted saving in PCU-km. This in
turn was calculated by comparison of traffic circulation volumes in “with” and “without”
project cases.
The rate of fuel consumption per PCU-km used for the estimation of fuel savings was
calculated as the weighted average of fuel consumption rates for the various vehicle types,
as shown in Table 13-21.
Table 13-21 Calculation of Fuel Consumption per PCU-km
(Litres/'000 km) (Litres/'000 km)Car 0.529 1 Gasoline 0.5292 0.4806 96 46.1355Taxi 0.172 1 Gasoline 0.1717 0.1560 100 15.5962Shared Taxi 0.151 1.5 Diesel 0.2262 0.2054 138 28.3472Minibus 0.0000Public Bus 0.019 2.5 Diesel 0.0468 0.0425 550 23.3906Private bus 0.0000Pick-up 0.063 1 Diesel 0.0632 0.0574 110 6.31492-Axle 0.018 2 Diesel 0.0368 0.0334 160 5.34973-Axle 0.0000>3-Axle 0.003 2.5 Diesel 0.0081 0.0074 400 2.9509Motor cycle 0.040 0.3 Gasoline 0.0120 0.0109 20 0.2178Other 0.005 1.5 Diesel 0.0071 0.0064 160 1.0248
Average per PCU-km 1.000 1.1011 1.0000 129.3276
Coefficient Fuel consumption Actual rate Weighted
average rateType of vehicle
Actual vehicle distribution by type
PCU factor applicable to vehicle type
PCU distribution by vehicle type
Fuel Type
Sources: Cairo Metro Line 4 Traffic Survey 2009 (vehicle distribution); JICA Study Team (fuel
consumption data). It was earlier observed (see section 13.3.1) that the metro would reduce the volume of
traffic circulation on the urban road network of Greater Cairo by only 0.4-0.6% over the
forecast period. The fuel savings associated with this reduction are therefore estimated to
represent a similar proportionate reduction in the total fuel consumed on the urban road
network. In volume terms, traffic diversion to full scale metro is expected to result in a fuel
saving rising from 17 million litres in 2020 to 67 million litres in 2050. It is estimated that this
saving is split between diesel and gasoline in the ratio of 52%:48%.
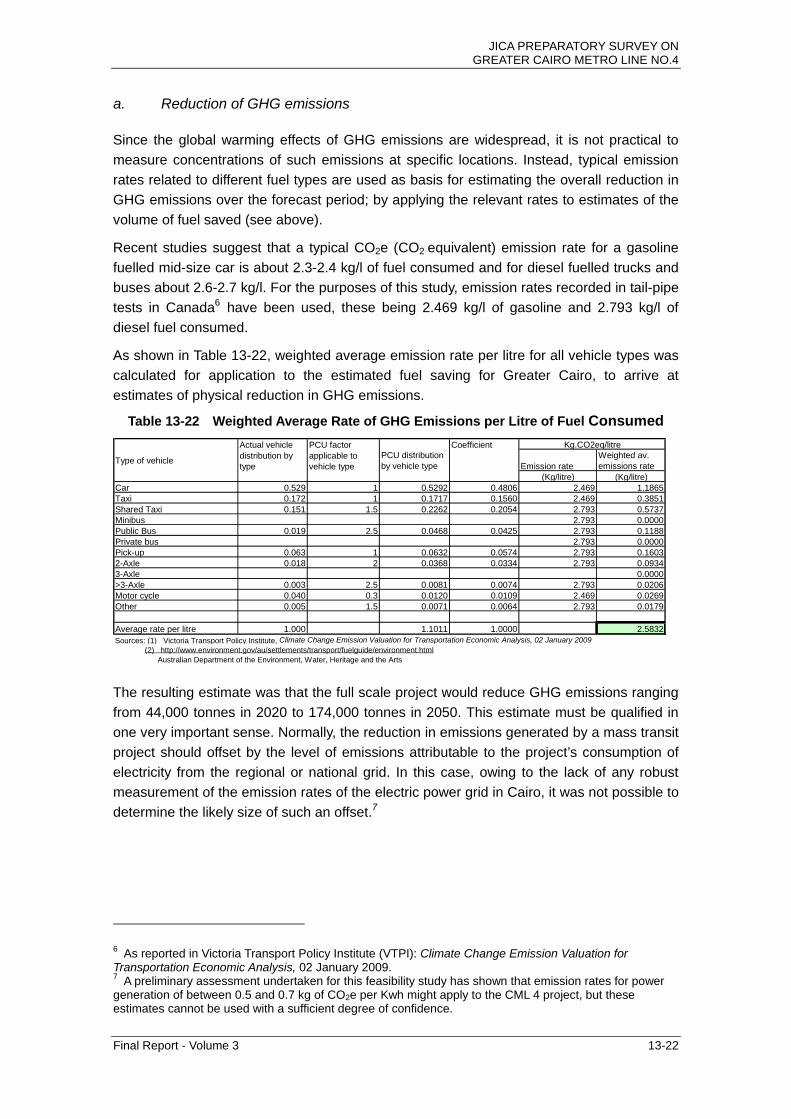
JICA PREPARATORY SURVEY ON GREATER CAIRO METRO LINE NO.4
Final Report - Volume 3 13-22
a. Reduction of GHG emissions Since the global warming effects of GHG emissions are widespread, it is not practical to
measure concentrations of such emissions at specific locations. Instead, typical emission
rates related to different fuel types are used as basis for estimating the overall reduction in
GHG emissions over the forecast period; by applying the relevant rates to estimates of the
volume of fuel saved (see above).
Recent studies suggest that a typical CO2e (CO2 equivalent) emission rate for a gasoline
fuelled mid-size car is about 2.3-2.4 kg/l of fuel consumed and for diesel fuelled trucks and
buses about 2.6-2.7 kg/l. For the purposes of this study, emission rates recorded in tail-pipe
tests in Canada6 have been used, these being 2.469 kg/l of gasoline and 2.793 kg/l of
diesel fuel consumed.
As shown in Table 13-22, weighted average emission rate per litre for all vehicle types was
calculated for application to the estimated fuel saving for Greater Cairo, to arrive at
estimates of physical reduction in GHG emissions.
Table 13-22 Weighted Average Rate of GHG Emissions per Litre of Fuel Consumed
(Kg/litre) (Kg/litre)Car 0.529 1 0.5292 0.4806 2.469 1.1865Taxi 0.172 1 0.1717 0.1560 2.469 0.3851Shared Taxi 0.151 1.5 0.2262 0.2054 2.793 0.5737Minibus 2.793 0.0000Public Bus 0.019 2.5 0.0468 0.0425 2.793 0.1188Private bus 2.793 0.0000Pick-up 0.063 1 0.0632 0.0574 2.793 0.16032-Axle 0.018 2 0.0368 0.0334 2.793 0.09343-Axle 0.0000>3-Axle 0.003 2.5 0.0081 0.0074 2.793 0.0206Motor cycle 0.040 0.3 0.0120 0.0109 2.469 0.0269Other 0.005 1.5 0.0071 0.0064 2.793 0.0179
Average rate per litre 1.000 1.1011 1.0000 2.5832
Type of vehicle
Actual vehicle distribution by type
Kg.CO2eq/litre
Emission rateWeighted av. emissions rate
PCU distribution by vehicle type
CoefficientPCU factor applicable to vehicle type
Sources: (1) Victoria Transport Policy Institute, Climate Change Emission Valuation for Transportation Economic Analysis, 02 January 2009 (2) http://www.environment.gov/au/settlements/transport/fuelguide/environment.html Australian Department of the Environment, Water, Heritage and the Arts The resulting estimate was that the full scale project would reduce GHG emissions ranging
from 44,000 tonnes in 2020 to 174,000 tonnes in 2050. This estimate must be qualified in
one very important sense. Normally, the reduction in emissions generated by a mass transit
project should offset by the level of emissions attributable to the project’s consumption of
electricity from the regional or national grid. In this case, owing to the lack of any robust
measurement of the emission rates of the electric power grid in Cairo, it was not possible to
determine the likely size of such an offset.7
6 As reported in Victoria Transport Policy Institute (VTPI): Climate Change Emission Valuation for Transportation Economic Analysis, 02 January 2009. 7 A preliminary assessment undertaken for this feasibility study has shown that emission rates for power generation of between 0.5 and 0.7 kg of CO2e per Kwh might apply to the CML 4 project, but these estimates cannot be used with a sufficient degree of confidence.
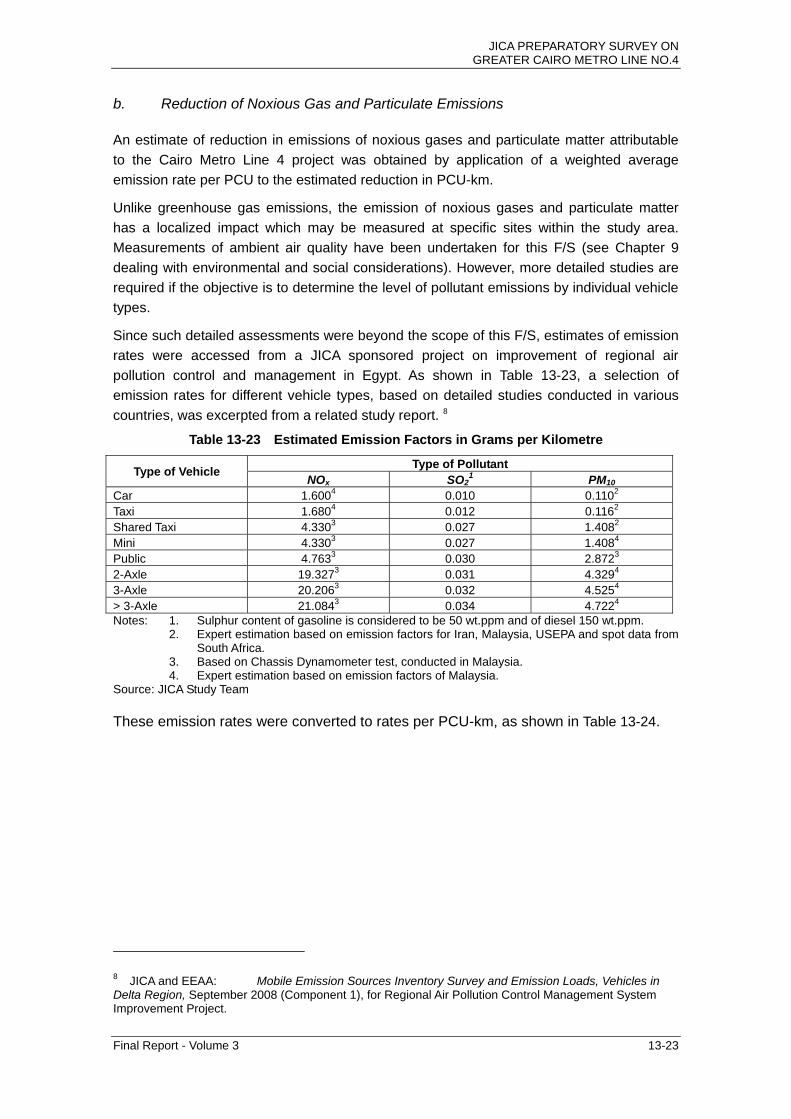
JICA PREPARATORY SURVEY ON GREATER CAIRO METRO LINE NO.4
Final Report - Volume 3 13-23
b. Reduction of Noxious Gas and Particulate Emissions An estimate of reduction in emissions of noxious gases and particulate matter attributable
to the Cairo Metro Line 4 project was obtained by application of a weighted average
emission rate per PCU to the estimated reduction in PCU-km.
Unlike greenhouse gas emissions, the emission of noxious gases and particulate matter
has a localized impact which may be measured at specific sites within the study area.
Measurements of ambient air quality have been undertaken for this F/S (see Chapter 9
dealing with environmental and social considerations). However, more detailed studies are
required if the objective is to determine the level of pollutant emissions by individual vehicle
types.
Since such detailed assessments were beyond the scope of this F/S, estimates of emission
rates were accessed from a JICA sponsored project on improvement of regional air
pollution control and management in Egypt. As shown in Table 13-23, a selection of
emission rates for different vehicle types, based on detailed studies conducted in various
countries, was excerpted from a related study report. 8
Table 13-23 Estimated Emission Factors in Grams per Kilometre
Type of Pollutant Type of Vehicle
NOx SO21 PM10
Car 1.6004 0.010 0.1102
Taxi 1.6804 0.012 0.1162 Shared Taxi 4.3303 0.027 1.4082
Mini 4.3303 0.027 1.4084
Public 4.7633 0.030 2.8723
2-Axle 19.3273 0.031 4.3294
3-Axle 20.2063 0.032 4.5254
> 3-Axle 21.0843 0.034 4.7224
Notes: 1. Sulphur content of gasoline is considered to be 50 wt.ppm and of diesel 150 wt.ppm. 2. Expert estimation based on emission factors for Iran, Malaysia, USEPA and spot data from
South Africa. 3. Based on Chassis Dynamometer test, conducted in Malaysia. 4. Expert estimation based on emission factors of Malaysia. Source: JICA Study Team These emission rates were converted to rates per PCU-km, as shown in Table 13-24.
8 JICA and EEAA: Mobile Emission Sources Inventory Survey and Emission Loads, Vehicles in Delta Region, September 2008 (Component 1), for Regional Air Pollution Control Management System Improvement Project.

JICA PREPARATORY SURVEY ON GREATER CAIRO METRO LINE NO.4
Final Report - Volume 3 13-24
Table 13-24 Conversion of Emission Factors per VKM to per PCU-Km - Noxious gases and Particulate Matter
(grams/km) (grams/km) (grams/km) (grams/km) (grams/km) (grams/km)Car 0.4806 1.6004 0.769116575 0.010 0.0048058 0.110 0.0528635Taxi 0.1560 1.6804 0.26207907 0.012 0.0018715 0.116 0.0180916Shared Taxi 0.2054 4.3303 0.889505272 0.027 0.0055462 1.408 0.2892232Minibus 4.3303 0.027 1.408 0.0000000Public Bus 0.0425 4.7633 0.202575402 0.030 0.0012759 2.872 0.1221415Private bus 4.547 0.028 1.478 0.0000000Pick-up 0.0574 17.570 1.008666614 0.028 0.0016074 3.935 0.22590232-Axle 0.0334 19.327 0.64620465 0.031 0.0010365 4.329 0.14474153-Axle 20.206 0.032 4.525 0.0000000>3-Axle 0.0074 21.0843 0.155544955 0.034 0.0002508 4.722 0.0348356Motor cycle 0.0109 0.21 0.002287203 0.005 0.0000545 0.205 0.0022327Other 0.0064 0.231 0.001479518 0.027 0.0001729 0.226 0.0014475
Average per PCU-Km 1.0000 3.93745926 0.0166215 0.8914795
Source: JICA and EEAA: Mobile emission Sources Inventory Survey and Emission Loads, September 2008for Regional Air Pollution Control Management System Improvement Project.
Type of vehicle Coefficient
NOx
Emission rateWeighted av. emissions rate
SO2
Emission rateWeighted av. emissions rate
PM10
Emission rateWeighted av. emissions rate
It was estimated that the full scale project would reducein emissions of noxious gases and
particulate matter in Greater Cairo of 642 tonnes in 2020, rising to 2,517 tonnes in 2050.
c. Valuation of Reduction in Atmospheric Emissions While fairly robust indicators are available for the measurement of the physical volume of
emissions, both of GHG and noxious gases from vehicles, the valuation of emissions
presents a particular problem. This is especially so where a carbon trading market does not
operate, or where there are no monetary measurements of the local damage from
emissions of noxious gases in the country under study. Egypt does not have a carbon
trading scheme, nor indeed is there any similar scheme operating in the Middle East, and,
thus, there have been no studies of monetary consequences from atmospheric pollution in
Cairo.
For these reasons, the valuation of road vehicle emissions in Cairo is based on the
European Union Emissions Trading Scheme in the case of GHG emissions; and on data
from a World Bank study on energy and environment in Egypt for emissions of noxious
gases and particulate matter.9
The valuation of greenhouse gas emissions in line with the price of European carbon
emission permits (or EUAs) is considered valid for two reasons. First, they represent the
willingness to pay for the right to emit greenhouse gases and, thus, are an appropriate
market measure of value. Second, since the effects of the GHG emissions are widespread,
there will be a tendency for global carbon prices to converge towards the prices established
in the European Carbon Trading Scheme, which is the largest and longest established of
the world’s carbon markets.
For the purposes of valuing the reduction in GHGs, which is attributed to the Cairo Metro
Line 4 project, the December 2009 benchmark price of EUAs was used. This price was
9 World Bank and EEAA: The Energy-Environment Review, 2002.

JICA PREPARATORY SURVEY ON GREATER CAIRO METRO LINE NO.4
Final Report - Volume 3 13-25
€14.75, equivalent to LE120.51, per tonne (Source: Carbon Positive
(http://www.carbonpositive.net), Carbon Trading Prices 29/10/09).
The valuation of noxious gas and particulate emissions is more problematical, since the
effects of noxious gas emissions are specifically related to the number of receptors (or
exposed persons); the extent to which their health is impaired; and the extent to which their
health impairment will be reflected in increased medical costs. Clearly, the measurement of
these effects requires substantial amounts of time and resources, which may explain why
no such studies have been conducted in Cairo to date.
This F/S makes use of the unit values of noxious gas and particulate emissions as
estimated in the World Bank study of 2002. Estimates of the damage costs from emission
of certain pollutants in Egypt were given in this study as shown in Table 13-25. These
estimates were inflated to 2009 values based on the trend in per capita health expenditures
in Egypt10, as also shown in this table.
Table 13-25 Estimates of Air Pollution Damage Costs in Egypt
Pollutant Value (L.E. per tonne)
as at July 2002 Value (L.E. per tonne)
as at July 2008 PM10 16,000 33,046 NOx 2,200 4,544 SO2 6,800 14,045 CO 700 1,446 NMVOC’s 1.80 3.72 Sources: World Bank and EEAA: The Energy-Environment Review 2002; JICA Study Team’s estimate The benefits of reduced air pollution by the project were estimated by comparing and
valuing the volumes of pollutants emitted by road traffic in the “with” and “without” project
cases.
(iv) Summary and Significance of Economic Benefits The estimated economic benefits of the Cairo Metro Line 4 projects are depicted respectively in Figure 13-2 and Figure 13-3 for the Phase 1 and combined Phases 1 and 2 route sections, respectively.
10 Between 2002/03 and 2007/08, per capita Health Expenditures were estimated to have increased from L.E. 72.61 to L.E. 149.97, equivalent to a growth factor of 2.065.

JICA PREPARATORY SURVEY ON GREATER CAIRO METRO LINE NO.4
Final Report - Volume 3 13-26
Reduced noxious gas emissions
L.E.mill.595.59, 0.2%
Reduced GHG emissions
L.E.mill.362.39, 0.1%
VOT savings (motorists)
L.E.mill.158,559.06, 61.8%
VOC savings L.E.mill.41,796.08,
16.3%VOT savings (metro passengers)L.E.mill.55,140.07,
21.5%
Source: JICA Study Team
Figure 13-2 Distribution of Economic Benefits by Type (2020-2050) for Phase 1 Route Section Only
VOT savings (metro passengers)L.E.mill.75,299.53,
24%
VOC savings L.E.mill.43,545.18,
14%
VOT savings (motorists)
L.E.mill.189,854.22, 61.2%
Reduced GHG emissions
482.65, 0.2%
Reduced noxious gas emissions793.24, 0.3%
Source: JICA Study Team
Figure 13-3 Distribution of Economic Benefits by Type (2020-2050) for Phases 1 and 2 route
In both cases, VOT savings for motorists are estimated to account for by far the greatest
share (more than 60%) of the project’s consolidated economic benefits. In combination with
savings in the VOT for metro passengers, this element is estimated to comprise 83-85% of
the project’s overall economic benefits. Project F/S conducted within the past 12 months in
Bangkok and Panama City indicated that VOT savings comprise a similar proportion of total
economic benefits. This was after allowing for the much higher cost of fuel in that particular
year, which tended to inflate the share of VOC savings in the overall economic benefits of
these projects.
Savings in VOCs from the Cairo Metro Line 4 project was estimated to account for a
significantly smaller share (14-16%) of overall economic benefits than was the case for
other recently evaluated projects, where VOC savings comprised 23-30%. This reflects of
that fuel prices in Egypt are very cheap, which even after removal of subsidies are still
substantially lower fuel prices than in most developing countries.

JICA PREPARATORY SURVEY ON GREATER CAIRO METRO LINE NO.4
Final Report - Volume 3 13-27
Finally, environmental benefits from reduced GHGs, noxious gas and particulate emissions
are estimated to comprise an almost negligible share of total benefits. This is because the
diversion of traffic from urban roads to the metro will have a very small impact on the
reduction of road traffic circulation in Greater Cairo.
13.3.3 Results of Economic Appraisal The results of the economic appraisal are given in detail for Phase 1 route section only in
Table 13-26 and for Phases 1 and 2 routes combined in Table 13-27, while the key
indicators, Economic Internal Rate of Return (EIRR), Economic Net Present Value (ENPV),
and Benefit Cost Ratio, are depicted in Figure 13-4.
17.10%
15.04%
14.00%
14.50%
15.00%
15.50%
16.00%
16.50%
17.00%
17.50%
Phase 1 only Phase 1+2
EIRR %
6,751.45,165.5
0.0
1,000.0
2,000.0
3,000.0
4,000.0
5,000.0
6,000.0
7,000.0
L.E. million
Phase 1 only Phase 1+2
ENPV
1.961.45
0.00
0.50
1.00
1.50
2.00
Phase 1 only Phase 1+2
BCR
Source: JICA Study Team
Figure 13-4 Key Economic Indicators for Cairo Metro Line 4 Project

JICA PREPARATORY SURVEY ON GREATER CAIRO METRO LINE NO.4
Final Report - Volume 3 13-28
These results show that in both cases may generate robust economic returns, with EIRRs of at least 15% and positive ENPVs. These results are in line with economic returns which are typical of urban mass transit projects in many countries. The results are stronger for the Phase 1 only than for the combined Phase 1 and Phase 2. The demand forecast for Phase 1 reflects stronger ridership attraction due to fewer transport alternatives than in Phase 2.

JICA
PR
EP
AR
AT
OR
Y S
UR
VE
Y O
N
GR
EA
TE
R C
AIR
O M
ET
RO
LIN
E N
O.4
Fin
al R
epo
rt - Vo
lum
e 3
1
3-2
9
Table 13-26 Analysis of Net Economic Benefits – Phase 1 Route Section only
Source: JICA Study Team
YearTunnel Civil Works E&M Rolling Rolling Rolling Land Utility Construction O&M Total VOC VOT savings VOT savings Total Net
(except tunnel) Stock Stock Stock Acquisition Relocation Supervision Costs Costs Savings - motorists - metro pax. GHG Noxious gases Benefits Benefit-initial inv. -refurb. -replace & Resett. & PM
2011 0.0 0.0 0.0 0.0 0.0 0.0 113.9 115.3 0.0 229.2 0.0 -229.22012 14.6 357.0 0.0 0.0 0.0 0.0 56.1 115.3 26.0 569.0 0.0 -569.02013 197.9 1113.1 0.0 0.0 0.0 0.0 0.0 0.0 91.8 1402.8 0.0 -1402.82014 366.6 1428.5 214.1 0.0 0.0 0.0 140.6 2149.9 0.0 -2149.92015 351.9 1387.0 472.2 0.0 0.0 0.0 154.8 2365.9 0.0 -2365.92016 168.6 631.4 704.1 443.1 0.0 0.0 136.3 2083.4 0.0 -2083.42017 0.0 263.5 723.3 443.1 0.0 0.0 100.1 1530.0 0.0 -1530.02018 0.0 0.0 371.3 443.1 0.0 0.0 57.0 871.5 0.0 -871.52019 0.0 0.0 0.0 443.1 0.0 0.0 31.0 474.1 0.0 -474.12020 84.4 0.0 0.0 0.0 98.9 183.3 569.3 1144.5 308.9 5.3 8.8 2036.8 1853.52021 0.0 0.0 0.0 92.8 92.8 593.6 1244.8 348.7 5.6 9.2 2201.9 2109.12022 0.0 0.0 0.0 94.3 94.3 618.0 1349.2 390.9 5.9 9.6 2373.6 2279.32023 0.0 0.0 0.0 99.5 99.5 956.9 1481.2 435.5 6.1 10.1 2889.8 2790.32024 84.4 0.0 0.0 94.3 178.7 986.5 1720.7 513.8 6.9 11.4 3239.4 3060.72025 84.4 0.0 0.0 83.0 167.4 1016.0 1976.7 598.3 7.8 12.8 3611.5 3444.12026 84.4 0.0 0.0 84.8 169.2 1045.6 2249.0 689.0 8.6 14.1 4006.3 3837.12027 0.0 0.0 0.0 86.6 86.6 1075.2 2537.6 785.9 9.4 15.5 4423.6 4337.02028 0.0 0.0 0.0 86.6 86.6 1112.1 2744.3 875.0 9.7 16.0 4757.1 4670.52029 84.4 0.0 0.0 86.6 171.0 1149.1 2958.9 968.2 10.1 16.5 5102.7 4931.82030 0.0 0.0 0.0 88.4 88.4 1186.1 3181.5 1065.5 10.4 17.1 5460.5 5372.22031 84.4 0.0 0.0 88.4 172.8 1223.1 3445.1 1167.0 10.7 17.6 5863.5 5690.82032 0.0 0.0 0.0 90.2 90.2 1260.1 3718.7 1272.7 11.0 18.1 6280.7 6190.52033 0.0 0.0 0.0 90.1 90.1 1297.0 4002.4 1382.5 11.4 18.7 6712.0 6621.92034 168.8 1181.6 0.0 90.1 1440.6 1334.0 4296.1 1496.5 11.7 19.2 7157.6 5717.02035 0.0 59.1 0.0 93.4 152.5 1371.0 4599.9 1614.7 12.0 19.8 7617.3 7464.92036 0.0 0.0 0.0 93.4 93.4 1408.0 4913.7 1737.0 12.4 20.3 8091.3 7997.92037 84.4 0.0 0.0 93.4 177.8 1445.0 5237.5 1863.5 12.7 20.8 8579.4 8401.72038 0.0 0.0 0.0 95.2 95.2 1481.9 5571.4 1994.1 13.0 21.4 9081.8 8986.62039 0.0 59.1 0.0 95.2 154.2 1518.9 5915.3 2128.9 13.3 21.9 9598.3 9444.12040 84.4 59.1 0.0 95.2 238.6 1555.9 6269.2 2267.8 13.7 22.5 10129.0 9890.42041 0.0 59.1 0.0 97.0 156.1 1592.9 6691.0 2410.9 14.0 23.0 10731.8 10575.82042 0.0 0.0 0.0 97.0 97.0 1629.9 7125.7 2558.2 14.3 23.5 11351.6 11254.62043 84.4 0.0 0.0 97.0 181.4 1666.8 7573.1 2709.6 14.6 24.1 11988.3 11806.92044 214.1 0.0 59.1 0.0 98.8 372.0 1703.8 8033.2 2865.2 15.0 24.6 12641.9 12269.92045 472.2 0.0 0.0 0.0 98.8 571.0 1740.8 8506.2 3025.0 15.3 25.2 13312.4 12741.42046 704.1 84.4 59.1 0.0 98.8 946.4 1777.8 8991.9 3188.9 15.6 25.7 13999.9 13053.52047 723.3 0.0 0.0 0.0 100.6 823.9 1814.7 9490.4 3357.0 16.0 26.2 14704.3 13880.42048 371.3 0.0 0.0 0.0 100.6 471.9 1851.7 10001.7 3529.2 16.3 26.8 15425.7 14953.82049 0.0 84.4 118.2 443.1 100.6 746.2 1888.7 10525.8 3705.6 16.6 27.3 16164.0 15417.72050 -708.3 -1482.8 -4970.2 -225.1 -248.1 -413.6 -170.0 -230.6 -737.6 102.4 -9083.9 1925.7 11062.6 3886.1 16.9 27.9 16919.2 26003.1
Totals 391.2 3697.7 0.0 2644.5 1406.1 29.5 0.0 0.0 0.0 2911.5 11080.5 41796.1 158559.1 55140.1 362.4 595.6 256453.2 245372.71099.6 5180.5 2485.1 2278.8 0.0 0.0 170.0 230.6 737.6 12182.2
Residual value, rolling stock - init pu 225.1(assumed life: 15 years) NPV (L.E.mill) 6,751.4
EIRR 17.10%Residual value, rolling stock - refurb 248.1 BCR 1.96(assumed life: 15 years)
Residual value, rolling stock - replac 497.9595 Cost flows disc.at 12% (L.E.mill.) 7057.7(assumed life: 15 years) Benefit flows disc.at 12% (L.E.mill. 13809.1
Residual value, tunnel 708.3(assumed life: 100 years)
Residual value, civil works excluding 1482.8tunnel (assumed life: 50 years)
E&M equipment 4970.2
Benefit Flows (L.E. million)Cost Flows (L.E.Million)
Indicators of economic worth
Environmental savings

JICA
PR
EP
AR
AT
OR
Y S
UR
VE
Y O
N
GR
EA
TE
R C
AIR
O M
ET
RO
LIN
E N
O.4
Fin
al R
epo
rt - Vo
lum
e 3
1
3-3
0
Table 13-27 Analysis of Net Economic Benefits – Combined Phase 1 and 2 Routes
Source: JICA Study Team
YearTunnel Civil Works E&M Rolling Rolling Rolling Land Utility Construction O&M Total VOC VOT savings VOT savings Total Net
(except tunnel) Stock Stock Stock Acquisition Relocation Supervision Costs Costs Savings - motorists - metro pax. GHG Noxious gases Benefits Benefit-initial inv. -refurb. -replace & Resett. & PM
2011 0.0 0.0 0.0 0.0 0.0 0.0 113.9 115.3 0.0 229.2 0.0 -229.22012 14.6 357.0 0.0 0.0 0.0 0.0 56.1 115.3 26.0 569.0 0.0 -569.02013 197.9 1113.1 0.0 0.0 0.0 0.0 0.0 0.0 91.8 1402.8 0.0 -1402.82014 366.6 1428.5 214.1 0.0 0.0 0.0 0.0 0.0 140.6 2149.9 0.0 -2149.92015 351.9 1387.0 472.2 0.0 0.0 0.0 47.5 0.0 154.8 2413.4 0.0 -2413.42016 168.6 631.4 704.1 443.1 0.0 0.0 95.0 69.3 136.3 2247.7 0.0 -2247.72017 0.0 593.9 723.3 443.1 0.0 0.0 47.5 69.3 123.2 2000.3 0.0 -2000.32018 61.1 1074.1 371.3 443.1 0.0 0.0 0.0 0.0 136.5 2086.2 0.0 -2086.22019 339.0 1361.3 70.1 1434.8 0.0 0.0 0.0 0.0 224.4 3429.6 0.0 -3429.62020 370.5 1136.7 690.5 991.7 0.0 0.0 0.0 0.0 223.3 98.9 3511.6 569.3 1144.5 308.9 5.3 8.8 2036.8 -1474.82021 155.6 710.9 859.5 991.7 0.0 0.0 0.0 0.0 190.2 92.8 3000.7 593.6 1244.8 348.7 5.6 9.2 2201.9 -798.82022 0.0 0.0 659.0 991.7 0.0 0.0 0.0 0.0 115.5 94.3 1860.5 618.0 1349.2 390.9 5.9 9.6 2373.6 513.12023 0.0 0.0 0.0 0.0 218.9 218.9 1056.0 2323.5 811.5 12.9 21.3 4225.3 4006.42024 168.8 0.0 0.0 213.7 382.5 1075.8 2498.9 895.2 13.1 21.5 4504.5 4122.12025 0.0 0.0 0.0 203.4 203.4 1095.6 2679.4 982.4 13.2 21.7 4792.4 4589.02026 0.0 0.0 0.0 203.4 203.4 1115.3 2865.1 1073.2 13.4 22.0 5089.0 4885.62027 0.0 0.0 0.0 203.4 203.4 1135.1 3055.8 1167.6 13.5 22.2 5394.2 5190.92028 0.0 0.0 0.0 203.5 203.5 1172.0 3301.2 1288.2 13.8 22.8 5797.9 5594.42029 0.0 0.0 0.0 203.5 203.5 1208.9 3555.8 1413.3 14.2 23.3 6215.4 6012.02030 0.0 0.0 0.0 203.5 203.5 1245.7 3819.8 1543.0 14.5 23.8 6646.8 6443.42031 0.0 0.0 0.0 203.5 203.5 1282.6 4132.8 1677.2 14.8 24.3 7131.7 6928.22032 168.8 0.0 0.0 203.8 372.6 1319.5 4457.4 1815.9 15.1 24.9 7632.8 7260.32033 0.0 0.0 0.0 207.1 207.1 1356.4 4793.8 1959.2 15.5 25.4 8150.2 7943.22034 0.0 1181.6 0.0 207.1 1388.7 1393.3 5141.9 2107.0 15.8 25.9 8683.8 7295.22035 0.0 59.1 0.0 207.1 266.1 1430.1 5501.7 2259.4 16.1 26.4 9233.7 8967.62036 0.0 0.0 0.0 207.1 207.1 1467.0 5873.2 2416.2 16.4 27.0 9799.9 9592.82037 0.0 2658.6 0.0 207.1 2865.7 1503.9 6256.4 2577.7 16.7 27.5 10382.2 7516.62038 0.0 0.0 0.0 207.1 207.1 1540.8 6651.3 2743.6 17.1 28.0 10980.9 10773.82039 0.0 118.2 0.0 207.1 325.2 1577.7 7058.0 2914.1 17.4 28.6 11595.7 11270.52040 0.0 0.0 0.0 207.1 207.1 1614.6 7476.4 3089.2 17.7 29.1 12226.9 12019.82041 0.0 0.0 0.0 207.1 207.1 1651.4 7975.4 3268.8 18.0 29.6 12943.3 12736.22042 0.0 0.0 0.0 207.1 207.1 1688.3 8489.4 3452.9 18.3 30.1 13679.1 13472.02043 0.0 0.0 0.0 207.1 207.1 1725.2 9018.3 3641.5 18.7 30.7 14434.4 14227.32044 214.1 0.0 0.0 0.0 207.1 421.1 1762.1 9562.1 3834.7 19.0 31.2 15209.1 14788.02045 472.2 0.0 0.0 0.0 207.1 679.3 1799.0 10120.9 4032.4 19.3 31.7 16003.3 15324.02046 704.1 0.0 0.0 0.0 207.1 911.2 1835.8 10694.5 4234.7 19.6 32.3 16816.9 15905.72047 723.3 0.0 118.2 0.0 207.1 1048.5 1872.7 11283.0 4441.5 19.9 32.8 17650.0 16601.42048 371.3 0.0 0.0 0.0 207.1 578.4 1909.6 11886.5 4652.8 20.3 33.3 18502.5 17924.12049 70.1 0.0 0.0 1434.8 207.1 1712.0 1946.5 12504.9 4868.7 20.6 33.8 19374.5 17662.52050 -1353.7 -3252.4 -7319.3 0.0 -480.5 -1339.1 -360.0 -369.2 -1562.6 207.1 -15829.8 1983.4 13138.2 5089.1 20.9 34.4 20265.9 36095.7
Totals 672.2 6541.5 0.0 6076.8 3655.1 95.7 0.0 0.0 0.0 6073.5 23114.8 43545.2 189854.2 75299.5 482.7 793.2 309974.8 286860.12025.9 9793.9 4764.1 6076.8 0.0 0.0 360.0 369.2 1562.6 24952.5
Residual value, rolling stock - init purch 0.0(assumed life: 15 years) NPV (L.E.mill) 5,165.5
EIRR 15.04%Residual value, rolling stock - refurb. 480.5 BCR 1.45(assumed life: 15 years)
Residual value, rolling stock - replace 2330.8396 Cost flows disc.at 12% (L.E.mill.) 11558.7(assumed life: 15 years) Benefit flows disc.at 12% (L.E.mill.) 16724.2
Residual value, tunnel 1353.7(assumed life: 100 years)
Residual value, civil works excluding 3252.4tunnel (assumed life: 50 years)
E&M equipment 8009.8(assumed life: 30 years)
Cost Flows (L.E.Million)
Indicators of economic worth
Environmental savingsBenefit Flows (L.E. million)

JICA PREPARATORY SURVEY ON GREATER CAIRO METRO LINE NO.4
Final Report - Volume 3 13-31
13.3.4 Sensitivity Analysis
Table 13-28 and Table 13-29 present results of the sensitivity testing of the project
economic results to changes in key cost and benefit variables for both project cases
considered.
Five sensitivity tests were carried out for both cases, involving, respectively, an increase of
20 % in project capital costs; a decrease of 20 % in project benefits; a combined increase
of 20 % in capital costs and a 20 % reduction in benefits; a variation in the discount rate
from 12% to 8%; and a doubling of fuel prices.
Table 13-28 Sensitivity Analysis of Economic Results for Phase 1 only
Item Base factor New Factor Change NPV (L.E. Mill.) EIRR (%) Sensitivity Indicator Switching Value (%) RemarksNPV EIRR NPV EIRR
Base case 6,751.4 17.10%
ST1: Investment cost + 20% 12,182.2 14,618.6 20% 5,393.7 15.65% 1.01 1.42 99% 70% Increased investment costST2: Benefits - 20% 256,453.2 205162.6 -20% 3,989.5 15.29% 2.05 1.77 49% 56% Reduced total benefit streamST3: Investment cost + 20% AND Benefits - 20% 245,372.7 192,448.3 -22% 2,631.8 13.94% 2.83 2.87 35% 35% Reduced net benefit streamST4: Discount rate of 8% 12.00% 8.00% -33% 23,284.0 17.11% 7.35 14% Reduced discount factorST5: Doubling of fuel prices 41,796.1 43,659.6 4% 6,877.8 17.19% 0.42 0.37 238% 270% Increased VOC stream
Cut-off EIRR 12.00%
Source: JICA Study Team’s estimate
Table 13-29 Sensitivity Analysis of Economic Results for Phases 1 and 2 Combined
Item Base factor New Factor Change NPV (L.E.Mill.) EIRR (%) Sensitivity Indicator Switching Value (%) RemarksNPV EIRR NPV EIRR
Base case 5,165.5 15.04%
ST1: Investment cost + 20% 24,952.5 29,943.0 20% 2,955.2 13.54% 2.14 2.46 47% 41% Increased investment costST2: Benefits - 20% 309,974.8 247979.9 -20% 1,820.6 13.16% 3.24 3.09 31% 32% Reduced total benefit streamST3: Investment cost + 20% AND Benefits - 20% 286,860.1 221,456.8 -23% -389.6 11.78% 4.72 4.70 21% 21% Reduced net benefit streamST4: Discount rate of 8% 12.00% 8.00% -33% 23,477.8 15.04% 10.64 9% Increased NPV, BCRST5: Doubling of fuel prices 43,545.2 46,027.1 6% 5,345.2 15.13% 0.61 0.57 164% 175% Increased VOC stream
Cut-off EIRR 12.00%
Source: JICA Study Team Both Sensitivity Indicators (SIs) and Switching Values (SVs) were used to indicate the
sensitivity of the Base Case results to changes in the key variables.
In relation to the ENPV, SIs compare the percentage change in the ENPV with the
percentage change in the relevant variable. SIs compare the percentage change in the
EIRR, above the cut-off rate, with the percentage change in the relevant variable. The
smaller the SI, the less the sensitivity of the indicator to changes in the relevant variable.
In relation to the ENPV, the SVs indicate the change required in the relevant variable to
reduce the ENPV to zero (0). SVs indicate the percentage change required in the relevant

JICA PREPARATORY SURVEY ON GREATER CAIRO METRO LINE NO.4
Final Report - Volume 3 13-32
variable to equate EIRR with the cut-off rate (or discount rate). By contrast with SI, the
higher the SV, the less the sensitivity of the indicator to changes in the relevant variable.
By definition, SV is the reciprocal of the SI. SIs and SVs calculated in relation to EIRR yield
slightly different results when compared with SIs and SVs calculated in relation to the ENPV.
This is because the IRR approach discounts all future net benefits at the IRR value and the
NPV approach at the chosen discount rate.
Several significant observations may be made about the results of the sensitivity analysis:
(i) In both cases, sensitivity tests revealed that EIRR results in particular were quite
robust – in other words, the EIRR does not change significantly even when there are large changes in the key variables.
(ii) For Case 1 (construction of the Phase 1 section only), no sensitivity test resulted in EIRR dropping below the assumed cut-off rate of 12%. Only the third test (ST3) was the EIRR moderately sensitive to changes in the key variables.
(iii) For Case 2 (construction of the entire Phase 1 and 2 route), only the combined variation of project costs and benefits (in ST3) resulted in the EIRR falling below the cut-off rate of 12% and the ENPV negative. This represents an extreme case which would have a small probability of occurrence.
(iv) In both cases, the ENPV proved quite sensitive to reducing discount rate. (v) In neither case was the EIRR sensitive to a doubling of fuel prices (and an
associated increase in vehicle operating costs). This result was expected given the cheap fuel prices in Egypt (with fuel currently accounting for less than 20% of VOC).
13.4 Financial Appraisal
This section describes the methodology, assumptions and results of financial appraisals
undertaken in the case of the Phase 1 only section and of the entire route (incorporating
both the Phase 1 and Phase 2 sections).
13.4.1 Methodology
A full financial appraisal of the Cairo Metro Line 4 project has been carried out. This
appraisal comprises:
A detailed Discounted Cash Flow (DCF) analysis of the two project cases, where Case 1 involves the construction of the Phase 1 route section only; and Case 2 covers the construction of the combined Phase 1 and Phase 2 sections. The DCF analysis involves a comparison between expected cash inflows (revenues) and cash outflows (costs) for both projects over the evaluation period from 2011-205011, to compute indicators of its financial worth. These indicators include the Financial Internal Rate of Return (FIRR), Net Present Value (NPV), and Return on Equity (ROE), otherwise known as Return on Investment.
Sensitivity tests to assess the sensitivity of the project financial indicators to changes in the key cost and income variables, including (a) changes in the structure and level of fares; (b) addition of non-fare revenue; and (c) variations in project capital and O&M costs.
11 2013-2050 in the case where the project is financed by a Normal ODA Loan

JICA PREPARATORY SURVEY ON GREATER CAIRO METRO LINE NO.4
Final Report - Volume 3 13-33
The base DCF analysis undertaken for both project cases assumes that fares for Line 4 will
be set at the current level of fares in force on the Cairo Metro and that the project would be
financed by an ODA STEP Loan. These assumptions are relaxed to consider alternatives in
the Sensitivity Analysis. In particular, comparative DCF analyses were undertaken of the
Phase 1 project financed respectively by a STEP Loan and by an ODA General Loan, to
determine which financing alternative will produce the most favourable results.
The positive cash flows of the project comprise fare box revenue (and for sensitivity testing
purposes) income from alternative sources, such as property leasing and advertising.
The negative cash flows of the project comprise its capital, financing and O&M costs. The
project’s capital costs were estimated by the engineering specialists of JST following
finalization of the route alignment, project specifications and construction schedule. The
project’s O&M costs were estimated as an output of the Train Operating Plan, which was
prepared by the JST’s operations specialist on the basis of transport demand forecast.
13.4.2 Assumptions Underlying the DCF Analysis
The principal assumptions underlying the DCF analysis include those related to the
escalation of costs and revenues.
All project costs and revenues were initially estimated in November 2009 values and, for
the purposes of the DCF analysis. were escalated over the project evaluation period at the
rates shown in Table 13-30 below.
Table 13-30 Escalation Rates Assumed for DCF Analysis
Item Applicable period Assumed rate Land value Entire period (2011-2050) 5% p.a. Capital cost (not including land) First 5 years 5% p.a. Next 7 years 4% p.a. Thereafter 3% p.a. O&M costs First 2 years 10% p.a. Next 4 years 7% p.a. Next 9 years 5% p.a. Thereafter 4% p.a. Exchange rate variation First 3 years 3% p.a. Next 5 years 2% p.a. Next 2 years 1% p.a. Thereafter 0% p.a. Revenue Entire period (2011-2050) 12.5% every 3
years Source: JICA Study Team The level of domestic inflation provides a starting indicator of the rate of price escalation of
the local cost component. In Egypt, domestic inflation rates have recently been very high,
of the order of 10% per annum. High rates of domestic inflation are not consistent with a
sustained high rate of economic growth. For this reason, it is considered that inflation rates
will fall to around 5% per annum by the time construction starts (in 2012), and will further
decline to 4% over the construction period. For the foreign cost component, rates of
inflation in the exporting countries were assumed to provide indicators of cost escalation.
Little information is available on these, but typically, they have been considerably lower
than in Egypt (e.g. recently Japan has been experiencing domestic deflation, although this

JICA PREPARATORY SURVEY ON GREATER CAIRO METRO LINE NO.4
Final Report - Volume 3 13-34
is not reflected in the average value of its exports). Initially foreign price escalation was
assumed to be about 5%, falling to 4% by 2023, and 3% thereafter.
In calculating the after tax cash flow from operations, a Business (or Corporate Profits) tax
rate of 20% was used.12
13.4.3 Passenger Demand Forecasts used as Basis for Cost and Revenue Estimation
The passenger demand forecasts used as basis for cost and revenue estimation in this F/S
have been described in detail in Chapter 2 of this report and are summarized respectively
for the and combined Phase 1 and 2 projects in Table 13-31 and Table 13-32 below.
Table 13-31 Passenger Demand Forecasts for Phase 1 Only
Forecast reference year
Passenger no. per day Passenger-km per day
Average trip distance (Km)
Max PPHPD*
2020 1,377,600 3,230,766 4.69 29,940 2023 1,402,800 3,308,806 4.72 30,350 2027 1,717,000 4,547,569 5.30 36,600 2050 2,151,500 6,504,522 6.05 52,560
Source: JICA Study Team * Maximum Passengers Per Hour Per Direction
Table 13-32 Passenger Demand Forecasts for Phases 1 and 2 Combined
Forecast reference year
Passenger no.per day Passenger-km per day
Average trip distance (Km)
Max PPHPD*
2020 1,377,600 3,230,766 4.69 29,940 2023 3,077,200 10,379,397 6.75 50,760 2027 3,501,600 15,256,998 8.71 53,470 2050 4,085,400 18,731,775 9.17 55,750
Source: JICA Study Team * Maximum Passengers Per Hour Per Direction
13.4.4 Project Capital and O&M Cost Estimates
The capital and O&M costs forming the cash outflows of the project are summarized in
Section 13.2.1 of this chapter. These outflows were assumed to apply in 2011, which is the
first year of cost disbursement.
13.4.5 Project Revenue Estimates
For the base DCF analysis, cash inflows, representing only revenue from fares, were
assumed to be generated by the project starting in 2020, which is the first year of operation.
It was assumed that fares would be set at the current level for the Cairo metro, i.e. a flat
fare of LE1.00 per passenger. Three other revenue alternatives were included in the
sensitivity analysis of the project’s financial results. These were: (a) application of a
distance based fare; (b) addition of non-fare revenue; and (c) a combination of (a) and (b).
The following sections describe the approach used for the estimation of revenue for the
base and sensitivity cases:
12 The new Tax Law 91/2005 sets the annual tax rate payable by normal companies on net profits at 20%. Exceptions are the Suez Canal Authority, the Public Petroleum Company and the Central Bank of Egypt which are required to pay profits tax at higher rates and a list of specified organizations, including government ministries and authorities, which are exempted.

JICA PREPARATORY SURVEY ON GREATER CAIRO METRO LINE NO.4
Final Report - Volume 3 13-35
(i) Structure and Level of Existing Metro Fares The starting point for the analysis of fare alternatives is the current level of average fare revenue and the current structure and level of fares. Revenue data provided to JST by the Egyptian Company for Metro (ECM) for the 2007/08 financial year are given in Table 13-33.
Table 13-33 Cairo Metro – Number of Passengers and Revenue for 2007/08
Item Amount Total revenue from daily ticket sales (million LE) 323.64 Revenue from quarterly ticket sales (million LE) 47.58 Revenue from yearly ticket sales (million LE) 10.32 Penalty revenue (million LE) 4.91 Total revenue (million LE) 386.45 Number of non-concessional passengers (Millions) 325.67 (45%) Number of concessional passengers (Millions) 391.16 (55%) Total number of passengers (Millions) 716.83 Average ticket value (normal), LE 0.994 Average ticket value (concessional), LE 0.148 Source: ECM The key point for the distribution of total ticket sales by type of customer is that purchasers
of normal (i.e. non-concessional) daily tickets represent only 45% of the total number of
passengers. The remaining 55% travels at concessional fare levels. While the average fare
revenue from normal ticket holders is just below one Egyptian pound, the average revenue
from concessional ticket holders is less than 15 pilasters. Therefore, overall, the operating
company collects average revenue of only 54 (53.77) pilasters per ticket.
Metro fares are varied infrequently. The last major variation was implemented on 14 July
2006, when normal daily ticket prices were increased by 33% from 75 to 100 pilasters. At
the time of writing, current fares have been in force for more than three years.
Concessional fares are available to three separate commuter categories: public sector
employees; Metro employees; and students, police, blind and other physically handicapped
persons. These fares apply to the purchase of quarterly tickets at the current rates as
indicated in Table 13-34.
Table 13-34 Cairo Metro – Quarterly Ticket Fare Concessions
Concessional ticket holder categories Normal price Public sector
employees Metro employees Students, police,
blind/handicappedNo. of stations
LE LE LE LE 25 107 64 30 22 34 140 84 36 27
Source: ECM Note: Fares implemented by Decree No 4480 – 315 – 2006 on 14 July 2006. Weekly and annual fares are also offered for annual tickets. Annual tickets are sold at
concessional fare rates to four categories of commuter: private sector employees; public
sector employees; press workers/military personnel/police personnel; and persons over 60
years of age. Fares range from LE160 (equivalent to 44 pilasters per day) for press

JICA PREPARATORY SURVEY ON GREATER CAIRO METRO LINE NO.4
Final Report - Volume 3 13-36
workers/military personnel/police personnel to LE386 (equivalent to LE1.06 per day) for
private sector employees.
It is estimated that the current operating ratio, or the ratio of operating costs to revenue, of
the Cairo Metro is approximately 60%13. However, while revenue is sufficient to cover O&M
costs by a healthy margin, it is understood that it is not sufficient to cover both O&M and
asset replacement costs.
For the base DCF analysis, it was assumed that the initial average fare revenue per
passenger would be set at the present normal fare level of LE1.00 per passenger trip, to
minimize the extent of government subsidy required to provide asset replacement.
Nevertheless, if the government intends to maintain the present fare structure, it will be
necessary to make up the shortfall between the normal fare level and present average fare
of 54 pilasters per trip. This could do by providing a revenue supplement of 46 pilasters per
trip.
(ii) Revenue Alternatives The application of a distance based fare structure and the addition of non-fare revenue
were assessed for the purpose of testing the sensitivity of financial results to revenue
variations.
Distance-based fares were assumed to be set initially at a level which would equate to an
average fare revenue of LE1.00 per passenger. For both project cases, a flat rate, or
flag-all, of 50 pilasters per passenger and a distance rate of 21 pilasters per passenger-km
would be required to achieve this result. However, with a distance based fare structure, the
combined Phase 1 and 2 project has greater potential revenue over the evaluation period
than the Phase 1 only project. This is due to the longer trip lengths achieved on average
when Phase 2 enters service.
The metro has the potential to generate non-fare income through the leasing of properties
near stations for retail activities and through granting advertising rights, as well as in metro
cars. Recently, it was reported that a contract had been signed with an advertising agency
for the use of metro facilities for advertising space.14 The contract valued at LE256 million
for 10 years, would yield additional revenue equivalent to about 6% of fare revenue. For the
purposes of the Sensitivity Analysis ,it was assumed that additional revenue equivalent to
5% of fare revenue would be earned over the operating period from 2020 to 2050.
Table 13-35 and Table 13-36 summarize the annual revenue projections for the base and
sensitivity cases in the forecast reference years.
Table 13-35 Revenue Projections – Phase 1 Only Project
Base case fare revenue (flat fare of LE1.00 pax)
Sensitivity case fare revenue (distance based
fare of LE0.50/0.21)
Sensitivity case, additional non-fare revenue Year
LE million LE million LE million 2020 468.3 468.3 23.4
13 O&M costs as advised by ECM for 2008/09 amounted to L.E. 230.590 million, which when offset against income of about L.E. 387 million would result in an operating ratio of 59%. 14 Daily News Egypt: On the right track: Cairo Metro developing under new management, December 5-6, 2009.

JICA PREPARATORY SURVEY ON GREATER CAIRO METRO LINE NO.4
Final Report - Volume 3 13-37
2023 476.9 478.3 23.8 2027 583.7 621.4 29.2 2050 731.4 837.1 36.6 Source: JICA Study Team
Table 13-36 Revenue Projections – Combined Phases 1 and 2 Project
Base case fare revenue (flat fare of LE1.00 pax)
Sensitivity case fare revenue (distance based
fare of LE0.50/0.21)
Sensitivity case, additional non-fare revenue Year
LE million LE million LE million 2020 468.3 468.3 23.4 2023 1,046.1 1,275.3 52.3 2027 1,190.4 1,701.0 59.5 2050 1,388.8 2,052.0 69.4 Source: JICA Study Team
13.4.6 Project Financing Alternatives
The financial appraisal of Cairo Metro Line 4 project includes consideration of alternatives
for the financing of the project.
The benchmark for establishing financing alternatives for this project was the terms and
conditions applying to Line 3. Details of the project financing terms and conditions applying
to Line 3 were obtained from the Finance and Administration Department of the National
Authority for Tunnels. These terms and conditions were compared with those likely to be
applied to financing through Yen loans provided by the Government of Japan and to other
loan instruments available from the African Development Bank and the International Bank
for Reconstruction and Development (IBRD).
The terms and conditions applying to loan from these four sources are summarized in Table
13-37 and are described in greater detail in the following sections.

JICA PREPARATORY SURVEY ON GREATER CAIRO METRO LINE NO.4
Final Report - Volume 3 13-38
Table 13-37 Terms and Conditions of Loans for Cairo Metro Development
Type/category of loan
Allowable coverage of total project
cost
Interest rate Grace period(years)
Repay-ment
period (years)
Conditions for
procurement
Loans from France for Phase 1 of Line 3 project
Low interest government-to-government
Up to €200 million (approx. 37% of project cost)
0.2% 6 18 Tied
Commercial Bank 5.1% 4 10
Loans from France for Phase 2 of Line 3 project
Low interest government-to-government
Up to €200 million
0.15% 5 20 Tied
Commercial Bank Not yet finalized 4 10
ODA loans from the Government of Japan
General terms: Standard Up to 85% 1.40% 10 30 Untied Option 1 Up to 85% 0.80% 6 20 Untied Option 2 Up to 85% 0.70% 5 15 Untied STEP Standard Up to 100% 0.20% 10 40 Tied Option Up to 100% 0.10% 10 30 Tied
African Development Bank
Sovereign Guaranteed Loan for Public Sector – Variable Spread Loans
Not specified
USD: 0.961% EUR: 1.359% YEN: 0.916%
5 15 Untied
IBRD Flexible Loan - Fixed Spread (1)(2)
Not specified
USD: LIBOR + 1.05%EUR: LIBOR + 1.05%YEN: LIBOR + 0.95%
11.5
12.0
Untied
Sources: Finance and Administration Department of NAT; JICA, African Development Bank and IBRD websites.
Notes: (1) LIBOR = London Interbank Offered Rate. This is the floating interest rate at which banks can borrow
unsecured funds from other banks in the London wholesale money market. The LIBOR 6 month rate as at 27 November 2009 was 0.484%. IBRD rates shown apply to loans with a maturity of more than 14 years. Lower rates apply to loans with shorter maturity periods.
(2) The Grace period and Repayment periods shown for the IBRD Flexible Loan are those which have recently been applied to a Loan for the Integrated Mass Transit System Development project in Colombia, but the nature of this type of loan is such these conditions may be varied by borrowers, provided that their loans meet the requirement for a weighted average maturity of 18 years.
(i) Conditions for Financing Line 3 Project by the Government of France Finance for the construction of Line 3 is being provided by France through a low interest
government-to-government loan and through commercial bank loans. The
government-to-government loan is to be executed through protocols signed by the
governments of Egypt and France for the allocation of loans in the amount of €200 million

JICA PREPARATORY SURVEY ON GREATER CAIRO METRO LINE NO.4
Final Report - Volume 3 13-39
to each of Phases 1 and 2 of the project. The loans will be applied to the funding of all
project components, except rolling stock, which will be financed through an agreement with
the Government of Japan, which is currently under negotiation.
Finance from French sources will cover about 54% of the total project cost of Phase 115,
with the balance being provided by Japanese Yen Loan (for rolling stock procurement) and
through equity funding by the Egyptian Government. Financing arrangements for Phase 2
of Line 3 are currently being finalized.
(ii) Terms and Conditions for Japanese ODA Loans Details of the terms and conditions of potential Japanese Yen Loans are available from the
JICA website.16 Different terms and conditions are applied to different countries depending
on the level of their Gross National Income per capita. Egypt falls within the category of
“Lower–Middle Income Countries”, with a GNI per capita in the range of US$ 936–1,785.
Among the ODA Loans, the categories that are relevant to the Metro Line 4 project are the
General Loan with Standard Conditions and the STEP Loan.
General Loans incorporating Standard Conditions have an interest rate of 1.4% per annum,
a grace period of 10 years and a loan repayment period of 30 years. In the case of loans of
this type, there are no requirements for the project to utilize Japanese technology. .
Projects that are eligible for STEP Loans include projects within specified sectors and fields
and for which Japanese technologies and equipment are substantially utilized. The
specified sectors and fields include bridges, tunnels and urban mass transit systems. The
standard form of loans for this type provides an interest rate of 0.2% per annum, a grace
period of 10 years, and a repayment period of 40 years.
(iii) Terms and Conditions for Loans by the African Development Bank (AfDB) The terms and conditions applying to loans by AfDB are available from its website.17
The principal loan instrument offered by AfDB relevant to the Cairo Metro Line 4 project is
the Public Sector Sovereign Guaranteed Loan. Loans will qualify for this category if:
They are made to a Regional Member Country; or They are supported by full faith and credit of the Member Country in whose
territory the Borrower is domiciled; or In the case of loans to multinational institutions, they are guaranteed by a Member
Country or by Member Countries in whose territory(ies) the Borrower will execute the project.
Egypt is currently one of fifteen regional member countries that are eligible for Public Sector
Sovereign Guaranteed Loans. To date, however, it appears that Egypt has received AfDB
15 Estimated at about L.E. 4,000 million 16 Terms and conditions pertaining to ODA loans can be found at:
http://www.jica.go.jp/english/operations/schemes/oda_loans/standard/ 17 http://www.afdb.org/en/projects-operations/financial products/

JICA PREPARATORY SURVEY ON GREATER CAIRO METRO LINE NO.4
Final Report - Volume 3 13-40
financing mainly in the fields of water supply and sanitation, energy and power supply, and
agricultural irrigation and drainage. In the field of transport, AfDB resources seem to have
been concentrated on loans for rural road development.
After 21 January 2009, when certain changes were made to its offering of financial products,
AfDB’s standard product is a Variable Spread Loan, made up of cost of borrowing relative
to the London Interbank Offered Rate (LIBOR) and a lending margin or spread. The lending
rates shown for the AfDB in Table 13-37 reflect the floating LIBOR base rates as of 13
November 2009.
The AfDB website indicates that maturities on sovereign and non-sovereign guaranteed loans are 20 and 15 years, respectively, including a grace period of up to 5 years. There is no indication on this website on the limitations applicable to AfDB coverage of a project’s total cost. (iv) Terms and Conditions for Loans by the International Bank for Reconstruction and Development (IBRD) The World Bank Treasury, through its IBRD subsidiary, offers a Flexible Loan, which is
claimed to be more competitive and flexible for most public sector borrowers than other
financing options available in international financial markets. The terms and conditions of
the IBRD are given in the World Bank Treasury website.18
The Flexible Loan allows borrowers to customize their repayment terms, including grace
period, repayment period, and amortization profile, to meet individual debt management
needs. Final repayment can be received up to 30 years from loan commencement, as long
as the weighted average repayment period does not exceed 18 years.
As is the case with AfDB finance, Flexible Loan interest rates are based on six month
LIBOR rates for major currencies, plus a fixed or variable spread. However, unlike AfDB
loans, IBRD Flexible Loans apply a different level of fixed spread above LIBOR depending
on the length of maturity period. For example, for a loan in USD, spreads of 0.60%, 0.80%
and 1.05% are applied respectively in the case of loan maturities of 10 years and less,
greater than 10 years and up to 14 years, and greater than 14 years, respectively. In
addition, a front end fee of 0.25% of the loan amount is applied at the beginning of the
project.
The website provides no indication of the limitations which might apply to IBRD coverage of
a project’s total cost. The IBRD had wide experience in establishing loans for urban public
transport projects, but it appears there were limitations on the extent of funds provided
under Flexible Loan arrangement. Recently it provided a Fixed Spread loan for the second
phase of the Integrated Mass Transit Sytems Project in Colombia, but its total commitment
of funds for this project represented US$300 million, or 70% of the total project cost of
US$429 million. 19
(v) Evaluation and Selection of Financing Alternatives for Cairo Metro Line 4
18 http://treasury.worldbank-org/bdm/htm/ibrd.html 19 This project involves the development of Bus Rapid Transit systems in several Colombian cities.
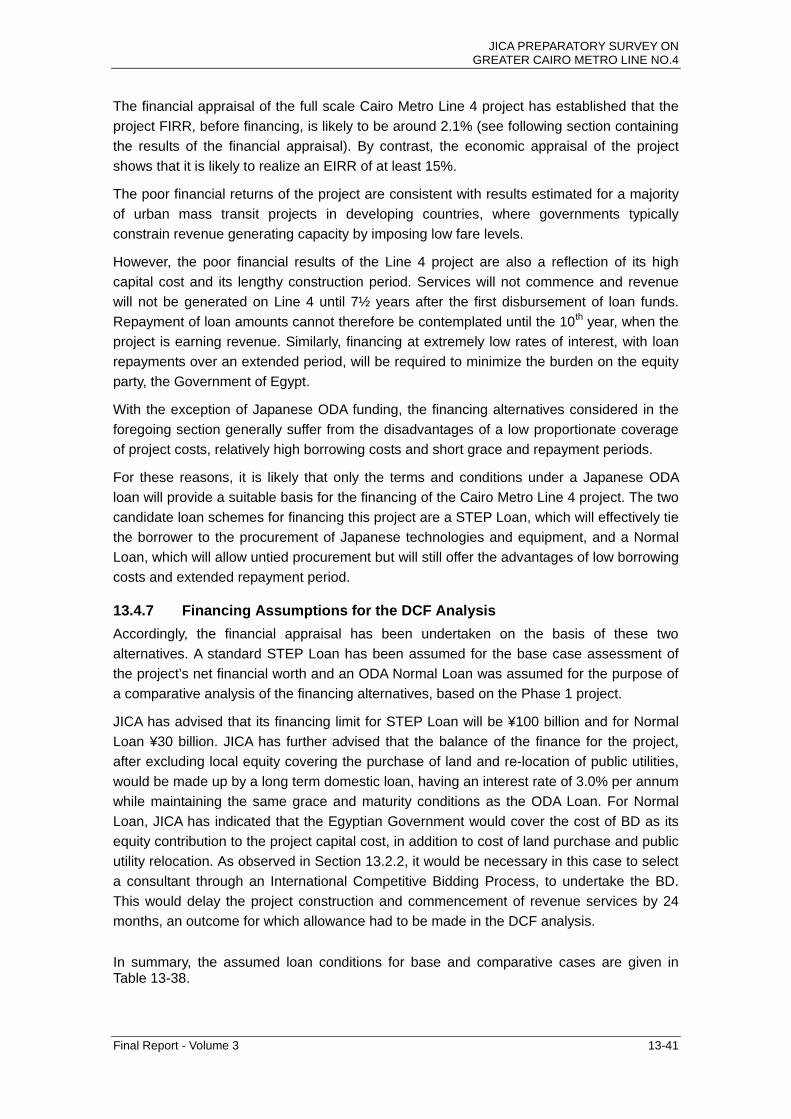
JICA PREPARATORY SURVEY ON GREATER CAIRO METRO LINE NO.4
Final Report - Volume 3 13-41
The financial appraisal of the full scale Cairo Metro Line 4 project has established that the
project FIRR, before financing, is likely to be around 2.1% (see following section containing
the results of the financial appraisal). By contrast, the economic appraisal of the project
shows that it is likely to realize an EIRR of at least 15%.
The poor financial returns of the project are consistent with results estimated for a majority
of urban mass transit projects in developing countries, where governments typically
constrain revenue generating capacity by imposing low fare levels.
However, the poor financial results of the Line 4 project are also a reflection of its high
capital cost and its lengthy construction period. Services will not commence and revenue
will not be generated on Line 4 until 7½ years after the first disbursement of loan funds.
Repayment of loan amounts cannot therefore be contemplated until the 10th year, when the
project is earning revenue. Similarly, financing at extremely low rates of interest, with loan
repayments over an extended period, will be required to minimize the burden on the equity
party, the Government of Egypt.
With the exception of Japanese ODA funding, the financing alternatives considered in the
foregoing section generally suffer from the disadvantages of a low proportionate coverage
of project costs, relatively high borrowing costs and short grace and repayment periods.
For these reasons, it is likely that only the terms and conditions under a Japanese ODA
loan will provide a suitable basis for the financing of the Cairo Metro Line 4 project. The two
candidate loan schemes for financing this project are a STEP Loan, which will effectively tie
the borrower to the procurement of Japanese technologies and equipment, and a Normal
Loan, which will allow untied procurement but will still offer the advantages of low borrowing
costs and extended repayment period.
13.4.7 Financing Assumptions for the DCF Analysis
Accordingly, the financial appraisal has been undertaken on the basis of these two
alternatives. A standard STEP Loan has been assumed for the base case assessment of
the project’s net financial worth and an ODA Normal Loan was assumed for the purpose of
a comparative analysis of the financing alternatives, based on the Phase 1 project.
JICA has advised that its financing limit for STEP Loan will be ¥100 billion and for Normal
Loan ¥30 billion. JICA has further advised that the balance of the finance for the project,
after excluding local equity covering the purchase of land and re-location of public utilities,
would be made up by a long term domestic loan, having an interest rate of 3.0% per annum
while maintaining the same grace and maturity conditions as the ODA Loan. For Normal
Loan, JICA has indicated that the Egyptian Government would cover the cost of BD as its
equity contribution to the project capital cost, in addition to cost of land purchase and public
utility relocation. As observed in Section 13.2.2, it would be necessary in this case to select
a consultant through an International Competitive Bidding Process, to undertake the BD.
This would delay the project construction and commencement of revenue services by 24
months, an outcome for which allowance had to be made in the DCF analysis.
In summary, the assumed loan conditions for base and comparative cases are given in Table 13-38.

JICA PREPARATORY SURVEY ON GREATER CAIRO METRO LINE NO.4
Final Report - Volume 3 13-42
Table 13-38 Assumed Loan Conditions for Cairo Metro Line 4 Project
Assumed Loan Conditions
Evaluated case
Financing source
Cost coverage %
Interest rate %
Grace period (years)
Repayment period (years)
Procurementconditions
Phase 1 project
Standard STEP Loan
30.4(Financing Limit ¥100 billion)
0.2 10 40 Tied
Long Term Domestic Loan
67.4 3.0 10 40 Not applicable Base case
Egyptian Government Equity
2.2Not applicable
Not applicable
Not applicable
Not applicable
Normal Loan, Standard Conditions
8.1(Financing Limit, ¥30 billion)
1.4 10 30 Untied
Long Term Domestic Loan
89.2 3.0 10 30 Not ApplicableComparative case
Egyptian Government Equity
2.7Not applicable
Not applicable
Not applicable
Not applicable
Combined Phases 1 and 2 project
Standard STEP Loan
37.5(Financing Limit ¥200 billion)
0.2 10 40 Tied
Long Term Domestic Loan
59.8 3.0 10 40 Not applicable Base case
Egyptian Government Equity
2.7Not applicable
Not applicable
Not applicable
Not applicable
Sources: JICA Head Office and JICA Study Team
In accordance with JICA requirements, it was assumed that interest incurred during the construction phase would be paid during the grace period for all cases.
13.4.8 Results of Financial Appraisal
The net financial worth of the project was measured by the following six indicators, which
were estimated both for the Phase 1 only and the combined Phases 1 and 2 projects:
Project FIRR, before financing Project FIRR, after financing Return on Equity (ROE) NPV at 12% rate of discount, before financing NPV at 12% rate of discount, after financing NPV to Equity at 12% rate of discount

JICA PREPARATORY SURVEY ON GREATER CAIRO METRO LINE NO.4
Final Report - Volume 3 13-43
The project FIRR and NPV before financing measure the overall viability of the project
before payment of interest during the construction period. The project FIRR and NPV after
financing, on the other hand, measure of the overall viability of the project after payment of
interest during the construction period. The ROE and NPV to Equity are measures of net
returns to equity investment in the project and are computed from the net cash flow of the
project after payment of interest and repayment of loan principal.
(i) Comparative DCF Results for Financing of Phase 1 Project (STEP vs.Normal) The financial results of the comparison of the two project financing alternatives are given in Table 13-39.
Table 13-39 Comparison of Financial Results for STEP Loan vs. Normal Loan with Standard Conditions - Financing of Phase 1 project
Loan Type Project FIRR Project NPV (LE million)
ROE NPV to Equity (mille million)
STEP Loan 2.85 -7,400 13.89% 163Normal Loan 1.96 -8,502 Negative 9Source: DCF Model of JICA Study Team The results indicate a significant advantage of STEP Loan over Normal Loan for the
financing of Phase 1 of the Cairo Metro Line 4 project. This advantage is particularly
pronounced in terms of the return on equity (ROE and NPV to Equity).
For Normal Loan, the stream of the net cash flow to equity is heavily negative between the
middle and end of the evaluation period, reflecting a net commitment of external funds to
repay the loan within the specified period of 30 years. The project will not generate
sufficient revenue to repay the loan within this period, so that the necessary funds must be
provided by the Egyptian Government, which would be required to guarantee repayment of
loan. This flow of funds represents a cash outflow to equity.
For STEP Loan, the project will generate sufficient revenue to repay the loan within the
longer 40 year period specified for loan repayment.
(ii) DCF Results for the Phase 1 Only and Combined Phases 1 and 2 Projects The results of the financial evaluation of the Base Case in the two project cases are given in Source: JICA
Study Team Figure 13-5 and Source: JICA Study Team
Figure 13-6 below. This evaluation is based on the STEP Loan as the main financing
instrument, with co-financing by a long term domestic loan.

JICA PREPARATORY SURVEY ON GREATER CAIRO METRO LINE NO.4
Final Report - Volume 3 13-44
2.94%2.12%
2.87%2.07%
11.33%
3.00%
0.00%
2.00%
4.00%
6.00%
8.00%
10.00%
12.00%
Project FIRRbefore financing
Project FIRR afterfinancing
Return on Equity(ROE)
Phase 1 only
Combined Phase 1+2
Source: JICA Study Team
Figure 13-5 FIRR and ROE Results for Cairo Metro Line 4 Project
-15,000
-10,000
-5,000
0
L.E. million
Phase 1 only -7,198 -7,359 -41
Combined Phase 1+2 -13,975 -14,172 -433
NPV (12% disc.) before financing
NPV (12% disc) after financing
NPV (12% disc) to Equity
Source: JICA Study Team
Figure 13-6 NPV Results for CML-4 Project
The financial appraisal shows that:
Low FIRR results are likely to be achieved for both project cases, mainly as a result of high capital costs of the project and long time interval between first cost disbursement and receipt of revenue;
Better FIRR, ROE and NPV results are likely to be achieved for the Phase 1 only project than the combined Phases 1 and 2. This is explained by the stronger ridership potential of the Phase 1 section as compared with the Phase 2 section, where commuters are presented with more choices for public transport;
Stronger results for the Phase 1 only project raise the possibility that construction and operation of Phase 2 could be further delayed (i.e. beyond the proposed in-service date of 2023), to contain the initial investment in the project to a more manageable level.
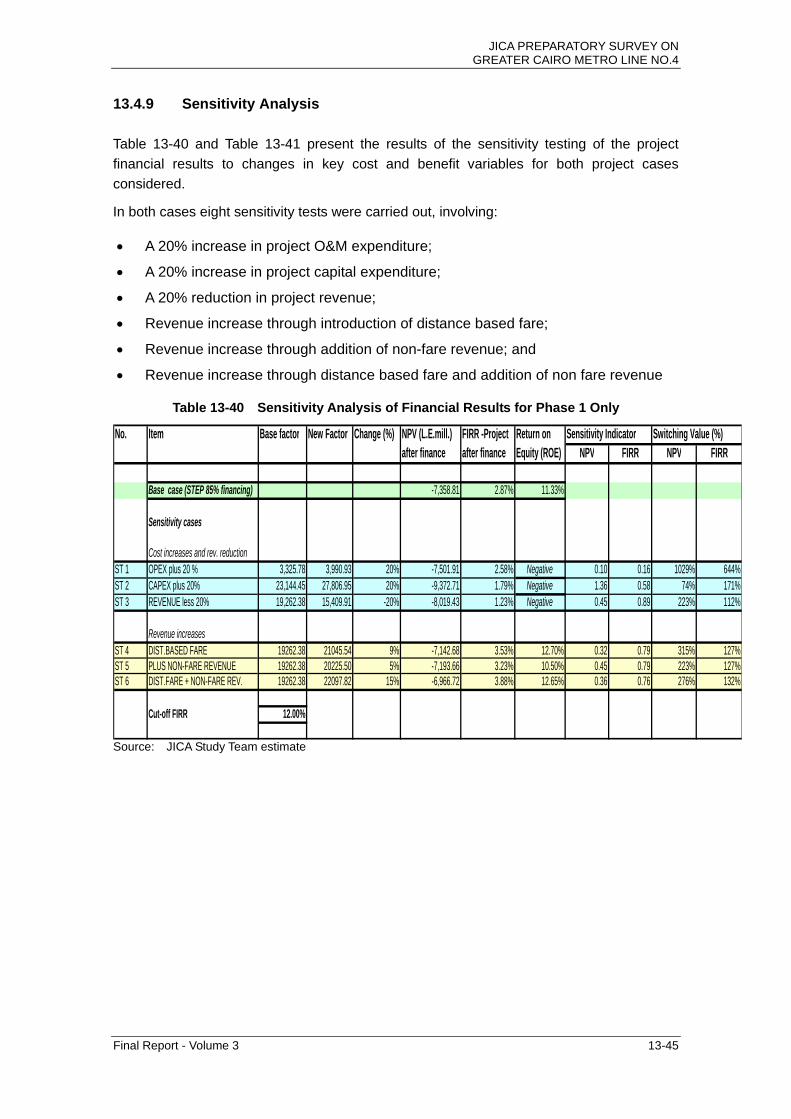
JICA PREPARATORY SURVEY ON GREATER CAIRO METRO LINE NO.4
Final Report - Volume 3 13-45
13.4.9 Sensitivity Analysis
Table 13-40 and Table 13-41 present the results of the sensitivity testing of the project
financial results to changes in key cost and benefit variables for both project cases
considered.
In both cases eight sensitivity tests were carried out, involving:
A 20% increase in project O&M expenditure;
A 20% increase in project capital expenditure;
A 20% reduction in project revenue;
Revenue increase through introduction of distance based fare;
Revenue increase through addition of non-fare revenue; and
Revenue increase through distance based fare and addition of non fare revenue
Table 13-40 Sensitivity Analysis of Financial Results for Phase 1 Only
No. Item Base factor New Factor Change (%) NPV (L.E.mill.) FIRR -Project Return on Sensitivity Indicator Switching Value (%)after finance after finance Equity (ROE) NPV FIRR NPV FIRR
Base case (STEP 85% financing) -7,358.81 2.87% 11.33%
Sensitivity cases
Cost increases and rev. reductionST 1 OPEX plus 20 % 3,325.78 3,990.93 20% -7,501.91 2.58% Negative 0.10 0.16 1029% 644%ST 2 CAPEX plus 20% 23,144.45 27,806.95 20% -9,372.71 1.79% Negative 1.36 0.58 74% 171%ST 3 REVENUE less 20% 19,262.38 15,409.91 -20% -8,019.43 1.23% Negative 0.45 0.89 223% 112%
Revenue increasesST 4 DIST.BASED FARE 19262.38 21045.54 9% -7,142.68 3.53% 12.70% 0.32 0.79 315% 127%ST 5 PLUS NON-FARE REVENUE 19262.38 20225.50 5% -7,193.66 3.23% 10.50% 0.45 0.79 223% 127%ST 6 DIST.FARE + NON-FARE REV. 19262.38 22097.82 15% -6,966.72 3.88% 12.65% 0.36 0.76 276% 132%
Cut-off FIRR 12.00%
Source: JICA Study Team estimate
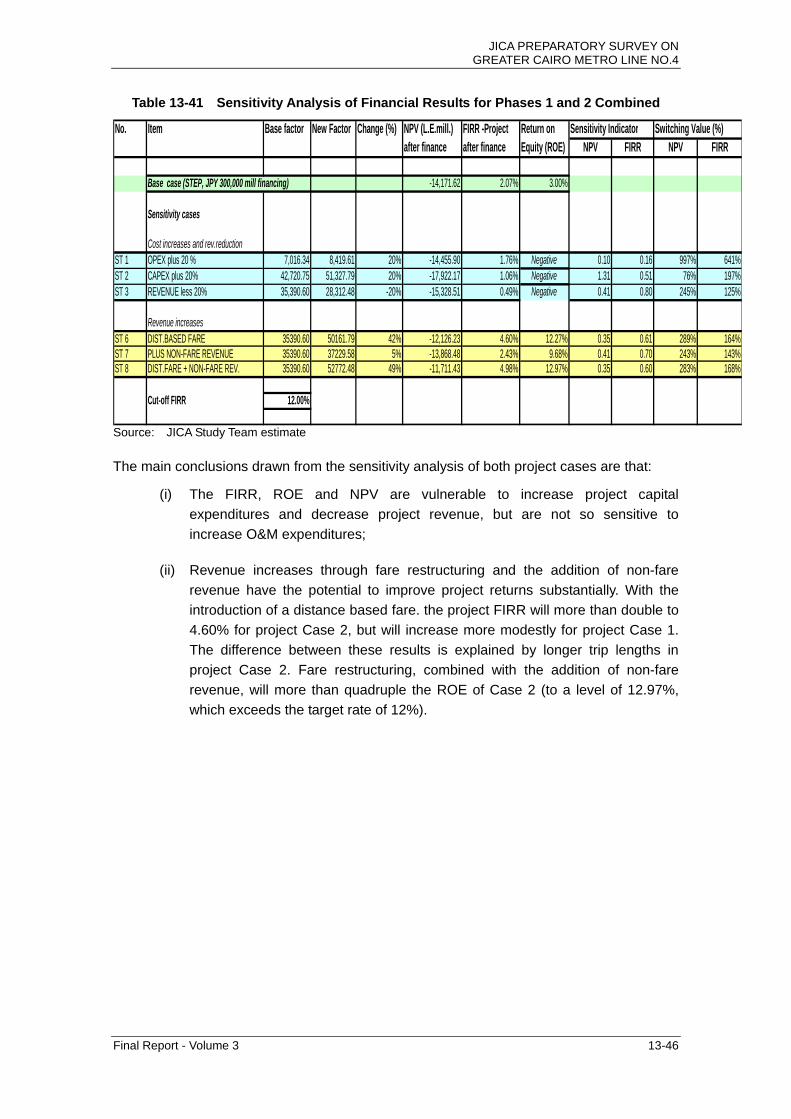
JICA PREPARATORY SURVEY ON GREATER CAIRO METRO LINE NO.4
Final Report - Volume 3 13-46
Table 13-41 Sensitivity Analysis of Financial Results for Phases 1 and 2 Combined
No. Item Base factor New Factor Change (%) NPV (L.E.mill.) FIRR -Project Return on Sensitivity Indicator Switching Value (%)after finance after finance Equity (ROE) NPV FIRR NPV FIRR
Base case (STEP, JPY 300,000 mill financing) -14,171.62 2.07% 3.00%
Sensitivity cases
Cost increases and rev.reductionST 1 OPEX plus 20 % 7,016.34 8,419.61 20% -14,455.90 1.76% Negative 0.10 0.16 997% 641%ST 2 CAPEX plus 20% 42,720.75 51,327.79 20% -17,922.17 1.06% Negative 1.31 0.51 76% 197%ST 3 REVENUE less 20% 35,390.60 28,312.48 -20% -15,328.51 0.49% Negative 0.41 0.80 245% 125%
Revenue increasesST 6 DIST.BASED FARE 35390.60 50161.79 42% -12,126.23 4.60% 12.27% 0.35 0.61 289% 164%ST 7 PLUS NON-FARE REVENUE 35390.60 37229.58 5% -13,868.48 2.43% 9.68% 0.41 0.70 243% 143%ST 8 DIST.FARE + NON-FARE REV. 35390.60 52772.48 49% -11,711.43 4.98% 12.97% 0.35 0.60 283% 168%
Cut-off FIRR 12.00%
Source: JICA Study Team estimate The main conclusions drawn from the sensitivity analysis of both project cases are that:
(i) The FIRR, ROE and NPV are vulnerable to increase project capital
expenditures and decrease project revenue, but are not so sensitive to
increase O&M expenditures;
(ii) Revenue increases through fare restructuring and the addition of non-fare
revenue have the potential to improve project returns substantially. With the
introduction of a distance based fare. the project FIRR will more than double to
4.60% for project Case 2, but will increase more modestly for project Case 1.
The difference between these results is explained by longer trip lengths in
project Case 2. Fare restructuring, combined with the addition of non-fare
revenue, will more than quadruple the ROE of Case 2 (to a level of 12.97%,
which exceeds the target rate of 12%).