chapter 10 respiration during exercise exercise physiology theory and application to fitness and...
TRANSCRIPT

Chapter 10
Respiration During Exercise
EXERCISE PHYSIOLOGYTheory and Application to Fitness and Performance,
6th edition
Scott K. Powers & Edward T. Howley

Introduction
• Pulmonary respiration– Ventilation
– Exchange of O2 and CO2 in the lungs
• Cellular respiration– O2 utilization and CO2 production by the tissues
• Purposes of the respiratory system during exercise– Gas exchange between the environment and the body– Regulation of acid-base balance during exercise
Function of the Lung
• Means of gas exchange between the external environment and the body
• Ventilation – Mechanical process of moving air into and out of
lungs
• Diffusion – Random movement of molecules from an area of
high concentration to an area of lower concentration

Major Organs of the Respiratory System
Figure 10.1

Position of the Lungs, Diaphragm, and Pleura
Figure 10.2

Conducting and Respiratory Zones
Conducting zone
• Conducts air to respiratory zone
• Humidifies, warms, and filters air
• Components:– Trachea– Bronchial tree– Bronchioles
Respiratory zone• Exchange of gases
between air and blood
• Components:– Respiratory
bronchioles– Alveolar sacs
• Surfactant prevents alveolar collapse

Conducting and Respiratory Zones
Figure 10.3

The Bronchial Tree
Figure 10.4

Type II Alveolar Cells
Figure 10.5

Mechanics of Breathing
• Movement of air occurs via bulk flow– Movement of molecules due to pressure
difference
• Inspiration– Intrapulmonary pressure lowered– Diaphragm pushes downward, ribs lift
outward
• Expiration– Intrapulmonary pressure raised– Diaphragm relaxes, ribs pulled downward

The Mechanics of Inspiration and Expiration
Figure 10.6

The Muscles of Respiration
Figure 10.7

Airway Resistance
• Airflow depends on:– Pressure difference between two ends of airway– Resistance of airways
• Airway resistance depends on diameter– Chronic obstructive lung disease– Asthma and exercise-induced asthma
Airflow = P1 - P2
Resistance

• The amount of air moved in or out of the lungs per minute (V) – Tidal volume (VT)
• Amount of air moved per breath– Breathing frequency (f)
• Number of breaths per minute
– Alveolar ventilation (VA)• Volume of air the reaches the respiratory zone
– Dead space ventilation (VD)• Volume of air remaining in conducting airways
V = VT x f
Pulmonary Ventilation
V = VA + VD

Definitions of Pulmonary Volumes and Capacities
Term Definitions
Lung Volumes
Tidal Volume The volume of gas inspired or expired during an unforced respiratory cycle
Inspiratory reserve The volume of gas that can be inspired at the end of a tidal inspiration
Expiratory reserve The volume of gas that can be expired at the end of a tidal expiration
Residual volume The volume of gas left in the lungs after a maximal expiration
Lung Capacities
Total lung capacity The total amount of gas in the lungs at the end of a maximal inspiration
Vital capacity The maximum amount of gas that can be expired after a maximum inspiration
Inspiratory capacity The maximum amount of gas that can be inspired at the end of a tidal expiration
Functional residual
capacity The amount of gas remaining in the lungs after a normal quiet tidal expiration
Table 10.1

Lung Volumes and Capacities
Figure 10.9

Spirometry
• Measurement of pulmonary volumes and rate of expired airflow
• Useful for diagnosing lung diseases– Chronic obstructive lung disease (COPD)
• Spirometric tests– Vital capacity (VC)
• Maximal volume of air that can be expired after after maximal inspiration
– Forced expiratory volume (FEV1)
• Volume of air expired in 1 s during maximal expiration
– FEV1/VC ratio
• ≥80% is normal

A Computerized Spirometer
Figure 10.8

Forced Expiratory Airflow Used to Diagnose Airway Obstruction
Figure 10.10

Partial Pressure of Gases
• Dalton’s law– The total pressure of a gas mixture is equal to the sum of
the pressure that each gas would exert independently
• Calculation of partial pressure
Pair = PO2 + PCO2 + PN2
Gas % in air Fraction
Barometric P
Partial P
O2 20.93 0.2093 x 760 mmHg = 159 mmHg
CO2 0.03 0.0003 x 760 mmHg = 0.3 mmHg
N2 79.04 0.7904 x 760 mmHg = 600.7 mmHg
Total 100 760 mmHg

• Fick’s law of diffusion– The rate of gas transfer (V gas) is proportional to
the tissue area, the diffusion coefficient of the gas, and the difference in the partial pressure of the gas on the two sides of the tissue, and inversely proportional the the thickness.
V gas = rate of diffusionA = tissue areaT = tissue thicknessD = diffusion coefficient of gasP1 - P2 = difference in partial pressure
V gas = AT
x D x (P1 - P2)
Diffusion of Gases

Partial Pressures of O2 and CO2 and Gas Exchange
Figure 10.11

Blood Flow to the Lung
• Pulmonary circuit– Same rate of flow as systemic circuit– Lower pressure
• When standing, most of the blood flow is to the base of the lung– Due to gravitational force

The Pulmonary and Systemic
Circulation
Figure 10.12

Regional Blood Flow Within the Lung
Figure 10.13

Ventilation-Perfusion Relationships
• Ventilation/perfusion ratio (V/Q)– Indicates matching of blood flow to ventilation– Ideal: ~1.0
• Apex of lung– Underperfused (ratio <1.0)
• Base of lung– Overperfused (ratio >1.0)
• During exercise– Light exercise improves V/Q ratio– Heavy exercise results in V/Q inequality

Ventilation/Perfusion Ratios
Figure 10.14
• 99% of O2 is transported bound to hemoglobin (Hb)
– Oxyhemoglobin: Hb bound to O2
– Deoxyhemoglobin: Hb not bound to O2
• Amount of O2 that can be transported per unit volume of blood is dependent on the Hb concentration
– Each gram of Hb can transport 1.34 ml O2
• Oxygen content of blood (100% Hb saturation)– Males:
– Females:
O2 Transport in the Blood
150 g Hb/L blood x 1.34 ml O2/g Hb = 200 ml O2/L blood
130 g Hb/L blood x 1.34 ml O2/g Hb = 174 ml O2/L blood

• Deoxyhemoglobin + O2 Oxyhemoglobin
• Direction of reaction depends on:– PO2 of the blood
– Affinity between Hb and O2
• At the lung– High PO2 = formation of oxyhemoglobin
• At the tissues– Low PO2 = release of O2 to tissues
Oxyhemoglobin Dissociation Curve

Oxygen-Hemoglobin Dissociation Curve
Figure 10.15

Effect of pH, Temperature, and 2-3 DPG on the O2-Hb Dissociation Curve
• pH– Decreased pH lowers Hb-O2 affinity– Results in a “rightward” shift of the curve
• Favors “offloading” of O2 to the tissues• Temperature
– Increased blood temperature lowers Hb-O2 affinity – Results in a “rightward” shift of the curve
• 2-3 DPG– Byproduct of RBC glycolysis– May result in a “rightward” shift of the curve
• During altitude exposure• Not a major cause of rightward shift during exercise
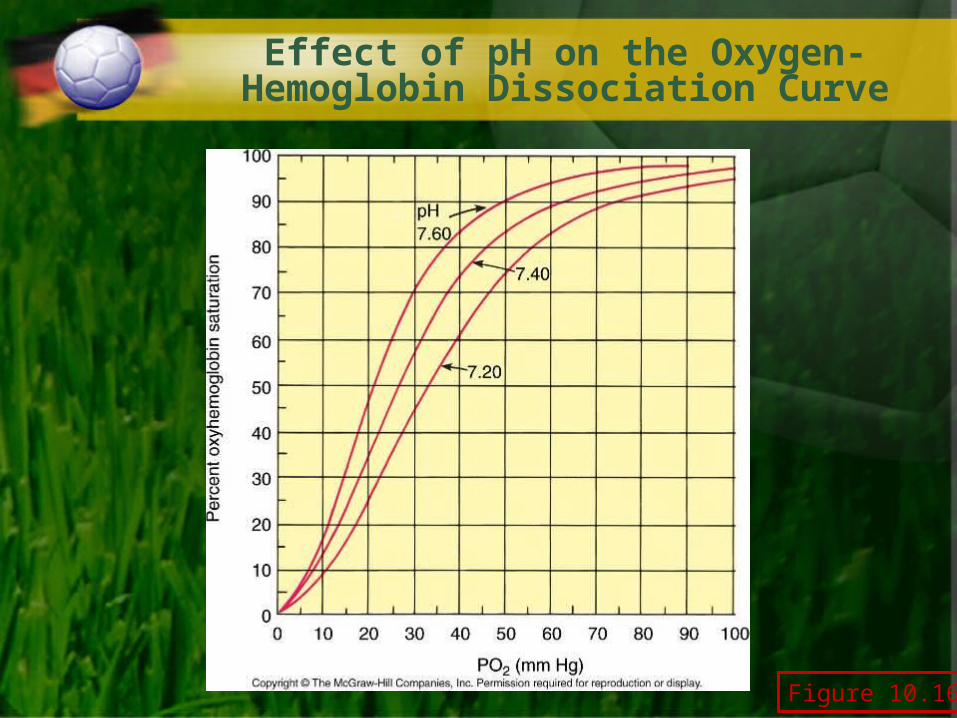
Figure 10.16
Effect of pH on the Oxygen-Hemoglobin Dissociation Curve

Effect of Temperature on the Oxygen-Hemoglobin Dissociation Curve
Figure 10.17

O2 Transport in Muscle
• Myoglobin (Mb) – Shuttles O2 from the cell membrane to the
mitochondria
• Mb has a higher affinity for O2 than hemoglobin– Even at low PO2
– Allows Mb to store O2
• O2 reserve for muscle

Dissociation Curves for Myoglobin and Hemoglobin
Figure 10.18

CO2 Transport in Blood
• Dissolved in plasma (10%)• Bound to Hb (20%)• Bicarbonate (70%)
– At the tissue:• H+ binds to Hb• HCO3
- diffuses out of RBC into plasma• Cl- diffuses into RBC (chloride shift)
– At the lung:• O2 binds to Hb (drives off H+)• Reaction reverses to release CO2
CO2 + H2OCarbonic anhydrase
H2CO3 H+ + HCO3-

CO2 Transport in the Blood at the Tissue
Figure 10.19
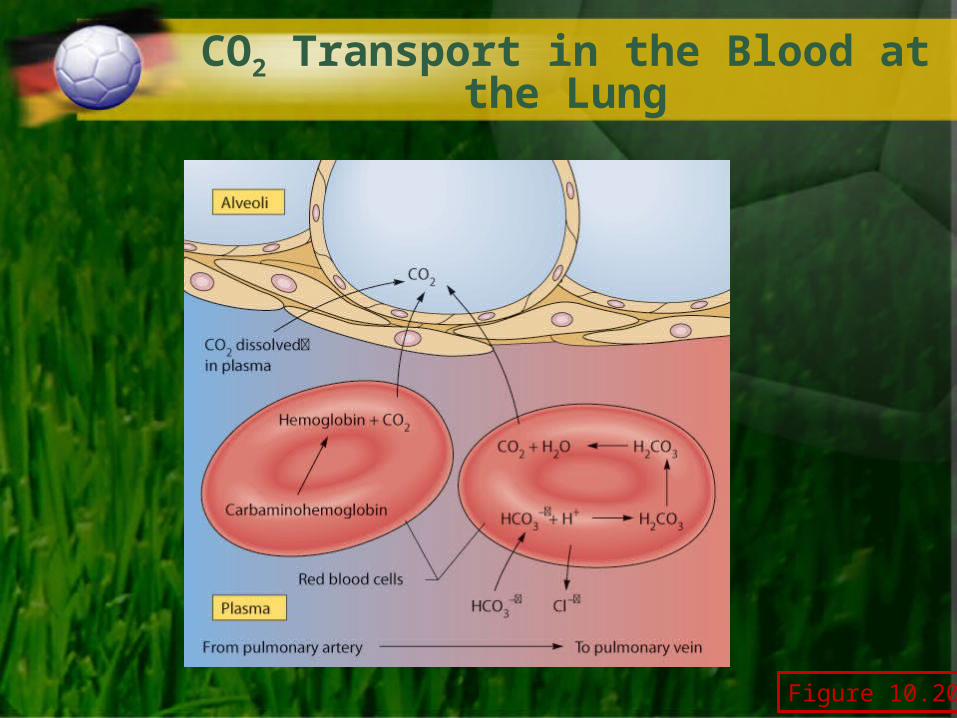
CO2 Transport in the Blood at the Lung
Figure 10.20

Ventilation and Acid-Base Balance
• Pulmonary ventilation removes H+ from blood by the HCO3
- reaction
– Increased ventilation results in CO2 exhalation
• Reduces PCO2 and H+ concentration (pH increase)
– Decreased ventilation results in buildup of CO2
• Increases PCO2 and H+ concentration (pH decrease)
CO2 + H2OCarbonic anhydrase
H2CO3 H+ + HCO3-

Rest-to-Work Transitions
• At the onset of constant-load submaximal exercise:– Initially, ventilation increases rapidly
• Then, a slower rise toward steady-state
– PO2 and PCO2 are maintained
• Slight decrease in PO2 and increase in PCO2

The Transition From Rest to Exercise
Figure 10.21

Prolonged Exercise in a Hot Environment
• During prolonged submaximal exercise in a hot/humid environment:– Ventilation tends to drift upward
• Increased blood temperature affects respiratory control center
– Little change in PCO2
• Higher ventilation not due to increased PCO2

Exercise in a Hot/Humid Environment
Figure 10.22

Incremental Exercise in an Untrained Subject
• Ventilation– Linear increase up to ~50-75% VO2max
– Exponential increase beyond this point– Ventilatory threshold (Tvent)
• Inflection point where VE increases exponentially
• PO2
– Maintained within 10–12 mmHg of resting value

Incremental Exercise in an Elite Athlete
• Ventilation– Tvent occurs at higher % VO2max
• PO2
– Decrease of 30–40 mmHg at near-maximal work• Hypoxemia
– Due to:• Ventilation/perfusion mismatch• Short RBC transit time in pulmonary capillary due to
high cardiac output

Ventilatory Response to Incremental Exercise
Figure 10.23

Control of Ventilation at Rest
• Respiratory control center in medulla– Regulates respiratory rate– Receives neural and humoral input
• Humoral chemoreceptors– Central chemoreceptors
• Located in the medulla• PCO2 and H+ concentration in cerebrospinal fluid
– Peripheral chemoreceptors• Aortic and carotid bodies• PO2, PCO2, H+, and K+ in blood
• Neural input– From motor cortex and skeletal muscle
mechanoreceptors

The Brain Stem Respiratory Control Centers
Figure 10.24
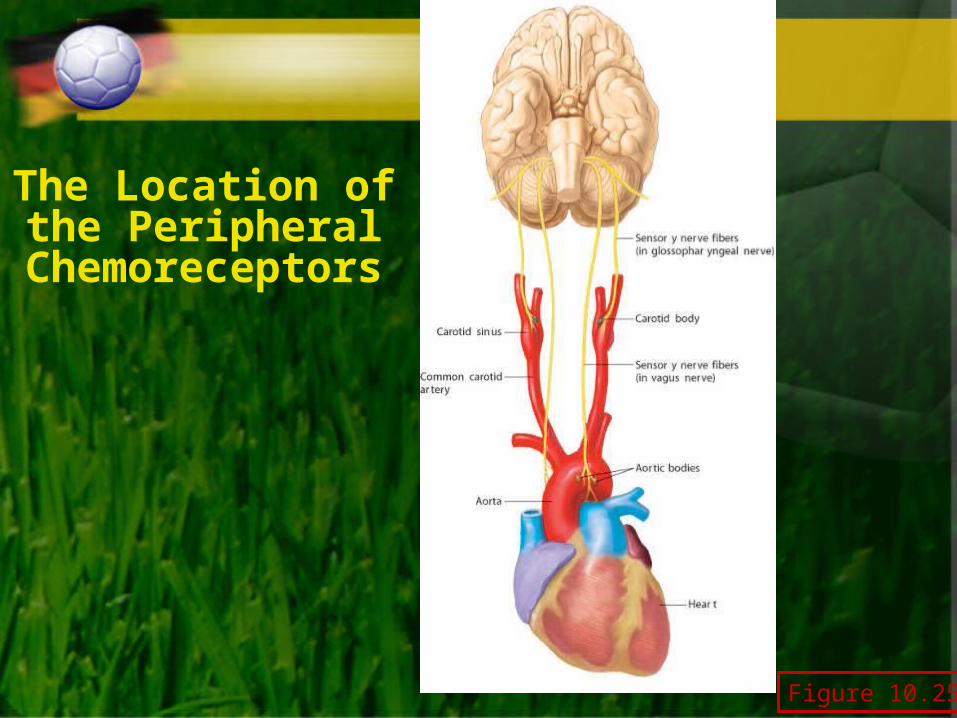
The Location of the Peripheral
Chemoreceptors
Figure 10.25

Effect of Arterial PCO2 on Ventilation
Figure 10.26

Effect of Arterial PO2 on Ventilation
Figure 10.27

Ventilatory Control During Exercise
• Submaximal exercise– Primary drive:
• Higher brain centers (central command)
– “Fine tuned” by:• Humoral chemoreceptors
• Neural feedback from muscle
• Heavy exercise– Alinear rise in VE
• Increasing blood H+ (from lactic acid) stimulates carotid bodies
• Also K+, body temperature, and blood catecholamines

A Summary of Respiratory Control During
Submaximal Exercise
Figure 10.28

Effect of Training on Ventilation
• No effect on lung structure and function at rest– Normal lung exceeds demand for gas exchange
• Ventilation is lower at same work rate following training– May be due to lower blood lactic acid levels– Results in less feedback to stimulate breathing

Effects of Endurance Training on Ventilation During Exercise
Figure 10.29

Does the Pulmonary System Limit Exercise Performance?
• Low-to-moderate intensity exercise– Pulmonary system not seen as a limitation
• Maximal exercise– Historically not thought to be a limitation in
healthy individuals at sea level• New evidence that respiratory muscle fatigue does
occur during high intensity exercise (>90% VO2max)
– May be limiting in elite endurance athletes• 40–50% experience hypoxemia