chapter 10 travel demand forecasting · projected as over-capacity were assessed to ... cutoff...
TRANSCRIPT

Chapter 10 Travel Demand Forecasting
CHAPTER 10
Travel Demand Forecasting
TABLE OF CONTENTS
Overview / Summary PAGE:
Urban Area Travel Demand Model Forecasts & Analysis 10 - 2
Base Year and Horizon Year 10 - 3
Urban Travel Demand Forecasts 10 - 4
Urban Area: LANE NEEDS & CAPACITY ANALYSIS 10 - 8
Urban Area: Congestion Analysis 10 - 11
Urban Area: SIGNAL COORDINATION and INTERSECTION
IMPROVEMENT NEEDS
10 - 13
Regional Traffic Forecasts & Analysis 10 - 15
Regional Study Area: Corridor Management Analysis 10 - 16
Regional Study Area: Lane Needs & Capacity Analysis 10 - 17
Regional Study Area: Intersection Needs Analysis 10 - 19
Overview / Summary A key study tool used by MPOs is the travel demand computer model. The model’s main function is to produce long range traffic forecasts which are then use in a variety of ways including to support the Plan analysis of urban area and regional capacity needs and congestion issues. The results of these analysis are important in not only identifying potential highway network needs but also, as described in Chapter 8, provide the basis for identifying potential corridors where high capacity transit may need to be a consideration in the future.
10- 1 | P a g e R e a f f i r m a t i o n o f 2 0 4 0 L o n g R a n g e P l a n
Chapter 10 Travel Demand Forecasting
Updated traffic forecasts were developed to support preparation of the original 2040 Long Range Plan. Tasks accomplished in updating the urban traffic demand model for the urban area of Rochester included refining the Traffic Analysis Zone network to provide greater specificity in areas on the fringe of the Rochester, incorporating the results of updated 2040 population and employment forecasts in the model, refinement of trip generation categories, and revisions to highway network capacities and speed assignments. Preparation of the regional traffic forecasts is based primarily on study of historic traffic volume trends for county and state roads along with review and incorporation of information from MNDOT’s 2008 trunk highway forecasts. In the regional study area, the focus is on the state and county highway network, since these roads carry the vast majority of regional intercity traffic and there is a sufficient database of historic traffic counts and road characteristics on which future forecasts can be built.
^^^^^^^^^^^^^^^^^^^^^^^^^^^^^
Note: Parts of this Chapter will be re-visited with rewrites later in 2014 after forecasting and area road system analysis is completed as part of the transportation consultant and staff’s work for the Rochester Comp Plan Update and the DMC Plan development work.
Urban Area Travel Demand Model & Forecasts Traffic forecasting for the ROCOG Urbanized area focuses on roadways where the function is anticipated to be broader than solely servicing abutting property access needs. All non-local State, county and municipal freeways, expressways and other arterial and collector roads are included on the model networks, along with complementary facilities such as frontage roads. In developing the urban area travel demand model, a series of steps are completed to generate the input information needed to update the model for new long range forecasts. Table 10-1 below shows steps normally done, including for this Plan:
Table 10 - 1 • Update Traffic Analysis Zone
(TAZ) Boundaries • Refine Trip Generation categories and
trip rates if needed
• Update Land Use Forecasts
• Refine as needed traffic model highway network, including adding or deleting links and confirming capacity and typical operating speeds of links in the network
• Assign Forecasted Land Use to Traffic Analysis Zones
• Calibrate the base year traffic model
10- 2 | P a g e R e a f f i r m a t i o n o f 2 0 4 0 L o n g R a n g e P l a n

Chapter 10 Travel Demand Forecasting
Base Year and Horizon Year
The Current Base year has been advanced from the former 2006 to the year 2010 since the original 2040 Plan was completed. The Horizon Year remains the same at 2040. The base model network has been re-calibrated to match MnDOT year 2010 Average Annual Daily Traffic (AADT) ground counts.
Overall differences between the 2006 and 2010 base years and the horizon years are shown in table 10-2 below:
Table 10 - 2 Vehicle miles of travel: Percent Change
Former Base Yr 2006 2,595,133
New Base Yr 2010 2,796,912 7.7%
Former Horizon Yr 2040 5,222,911
New Horizon Yr 2040 5,234,561 0.2%
Table 10-2 shows that overall changes in the 2040 Horizon year data are low enough to add additional support for a reaffirmation of the 2040 Plan. Nonetheless, as is always the case, since the previous development of the 2040 Plan, some minor changes to the 2040 Horizon Year model network have occurred as shown in the following two figures.
Figure 10-1 depicts the 2040 model network links in the NW part of Rochester where a relatively large area mixed land use development has been approved causing the need for reworking of the network for the initial development analysis, and to permanently adjust the 2040 network.
Figure 10- 1:
10- 3 | P a g e R e a f f i r m a t i o n o f 2 0 4 0 L o n g R a n g e P l a n
Chapter 10 Travel Demand Forecasting
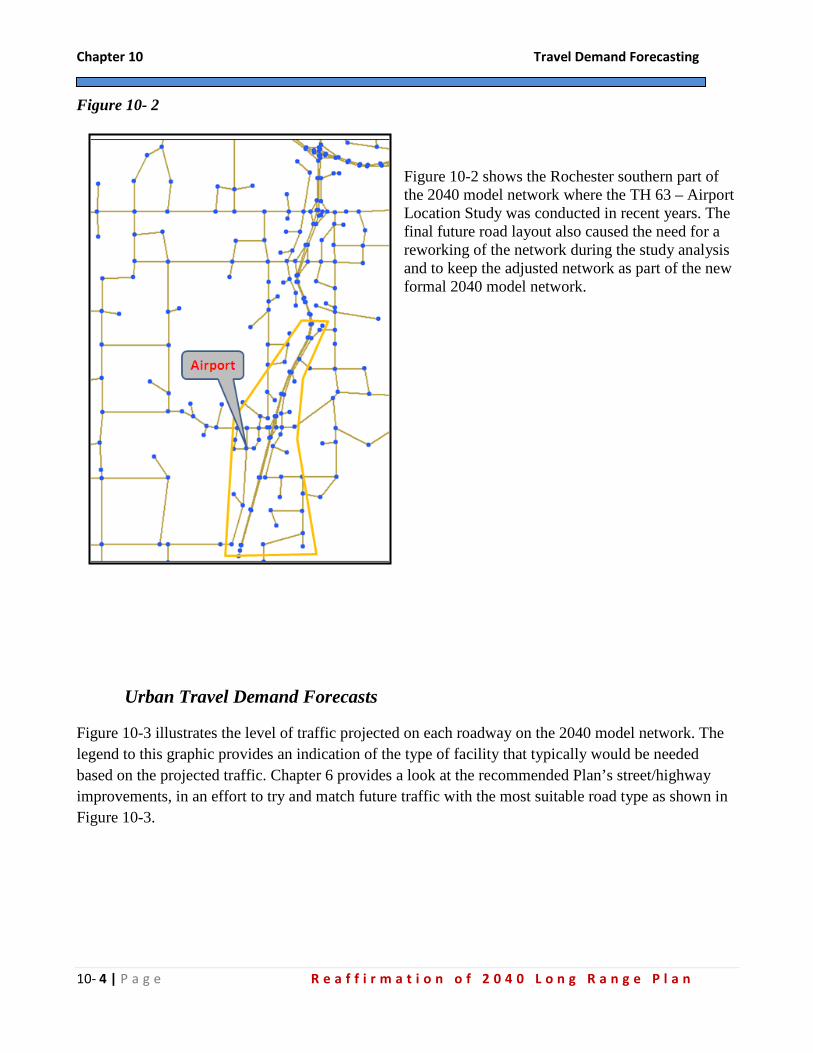
Figure 10- 2
Figure 10-2 shows the Rochester southern part of the 2040 model network where the TH 63 – Airport Location Study was conducted in recent years. The final future road layout also caused the need for a reworking of the network during the study analysis and to keep the adjusted network as part of the new formal 2040 model network.
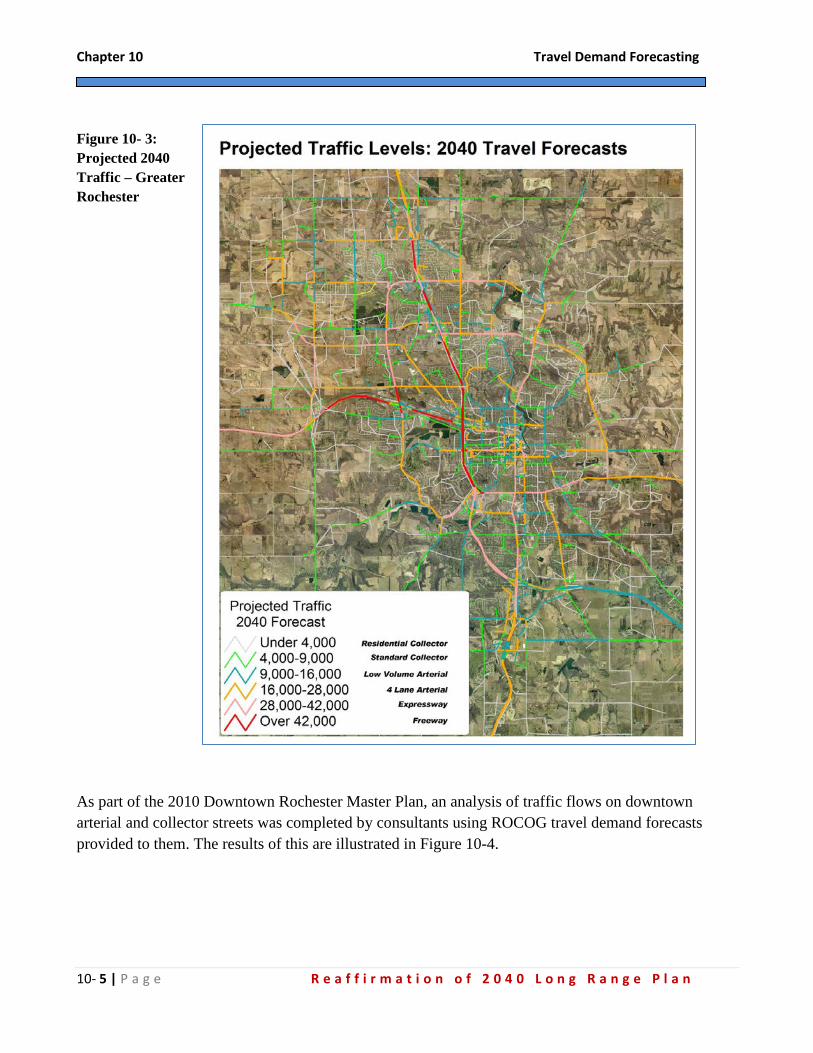
Urban Travel Demand Forecasts Figure 10-3 illustrates the level of traffic projected on each roadway on the 2040 model network. The legend to this graphic provides an indication of the type of facility that typically would be needed based on the projected traffic. Chapter 6 provides a look at the recommended Plan’s street/highway improvements, in an effort to try and match future traffic with the most suitable road type as shown in Figure 10-3.
10- 4 | P a g e R e a f f i r m a t i o n o f 2 0 4 0 L o n g R a n g e P l a n
Chapter 10 Travel Demand Forecasting
Figure 10- 3: Projected 2040 Traffic – Greater Rochester
As part of the 2010 Downtown Rochester Master Plan, an analysis of traffic flows on downtown arterial and collector streets was completed by consultants using ROCOG travel demand forecasts provided to them. The results of this are illustrated in Figure 10-4.
10- 5 | P a g e R e a f f i r m a t i o n o f 2 0 4 0 L o n g R a n g e P l a n

Chapter 10 Travel Demand Forecasting
Figure 10- 4: Projected 2040 Traffic – Downtown Rochester
Figure 10-5 reports sets of projected 2040 volumes for major arterial roadways in the various quadrants of the Rochester urban area. These volume numbers are utilized in variety of ways: a) corridor studies or at the project development level, b) can form the foundation of decisions regarding lane needs, c) are used in the development of peak hour traffic projections for operations analysis, d) and as an input into certain types of environmental analysis studies such as noise or air quality analysis.
10- 6 | P a g e R e a f f i r m a t i o n o f 2 0 4 0 L o n g R a n g e P l a n

Chapter 10 Travel Demand Forecasting
NW Rochester NE Rochester
SE RochesterSW Rochester
Figure 10-5: Projected 2040 Corridor Traffic Volumes
10- 7 | P a g e R e a f f i r m a t i o n o f 2 0 4 0 L o n g R a n g e P l a n

Chapter 10 Travel Demand Forecasting
Roadway Type Capacity Threshold
Residential Collector 5,600 Urban 2 lane Collector 11,500 Suburban 2 Lane Collector 9,500 Urban 2 Lane Parkway 10,500
Urban 3 Lane 16,500 Urban Frontage Road 14,500
Interchange Ramp ( 1 lane) 10,000 Interchange Ramp ( 2 lane) 17,500
Rural / Suburban 4 Lane Undivided 21,000 Rural / Suburban 4 Lane Divided 24,000 Urban Arterial - 4 Lane Undivided 26,000 Urban Arterial - 4 Lane Divided 32,000 Urban 5 Lane Arterial 36,000 Urban 6 Lane Arterial 38,000
Rural/Suburban Expressway -2 Lane 12,000 Urban Expressway - 4 Lane Divided 38,000 Rural/ Suburban Expressway - 4 Lane Undivided 27,000 Rural / Suburban Expressway - 4 lane Divided 30,000 Urban 6 Lane Expressway 42,000 Rural / Suburban 6 Lane Expressway 48,000
Freeway 4 Lane 70,000 Freeway 6 Lane Suburban 105,000 Freeway 6 Lane Urban 135,000
Urban Study Area: Lane Needs & Capacity Analysis The urban area traffic forecasts are analyzed to determine where 1) added capacity may be needed on existing major streets and highways, 2) where high levels of congestion can be anticipated on various corridors, 3) how many lanes may be needed on arterials or collector streets in new development areas, and 4) intersections that may need geometric or operational improvements in the future. o A lane needs / capacity analysis was conducted to
identify urban area roadway corridors that may experience traffic volume conditions exceeding an acceptable level of capacity. The defined capacity threshold is set to a level where the resultant congestion would be considered tolerable by most motorists. Projected 2040 volumes were tested using these thresholds to identify corridors where improvements may be warranted.
o The capacity thresholds are shown in Table 10-3.
The thresholds are shown in traffic volume combined in both directions. All modeled road segments are assigned a roadway type class based on geometric and operational characteristics of the corridor.
o The conclusions of the analysis are utilized in the needs assessment which forms the basis of the financial assessment in Chapter 15. Corridors projected as over-capacity were assessed to determine whether actual expansion was a realistic option, or whether traffic management actions such as stricter access management, signal coordination, geometric improvements or alternative travel modes such as higher capacity transit should be considered as an alternative to expansion.
Table 10- 3
10- 8 | P a g e R e a f f i r m a t i o n o f 2 0 4 0 L o n g R a n g e P l a n

Chapter 10 Travel Demand Forecasting
Figure 10-6 highlights the road segments identified as potentially at-risk for 2040 over-capacity conditions for the urban area.
Figure 10-6: Volume to Capacity Ratio for links on the improved 2040 network
10- 9 | P a g e R e a f f i r m a t i o n o f 2 0 4 0 L o n g R a n g e P l a n

Chapter 10 Travel Demand Forecasting
Figure 10-7 is from the Downtown Rochester Mobility Study which assessed capacity limitations of downtown arterials based a greater level of technical detail than in the regional travel model.
Figure 10-7: Note: from Rochester Downtown Mobility Study, 2010
Capacity at Portals rather than intersections:
Portals are excellent meters of auto travel into a downtown CBD area.
Acting as congestion gateways, portals can force mode shift over time.
10- 10 | P a g e R e a f f i r m a t i o n o f 2 0 4 0 L o n g R a n g e P l a n

Chapter 10 Travel Demand Forecasting
Urban Study Area: Congestion Analysis o The congestion analysis provides a different perspective on projected traffic conditions than the
lane needs / capacity analysis of the previous section. While the lane needs analysis focused solely on identifying whether corridors are projected to be over or under-capacity based on threshold cutoff value, the congestion analysis provides results that suggest how severe on a qualitative scale future congestion may be. This analysis better helps to identify where there may be corridors as opposed to individual segments or intersections that may warrant consideration for future improvement.
o The measure of congestion used is traffic density per lane, and it is taken from the methodology
used by the Texas Transportation Institute in their annual Urban Mobility Report on congestion in major cities across the country. The thresholds are straight-forward and are reported in terms of Extreme, Severe, Heavy and Moderate congestion levels, based on the traffic density shown in Table 10-4:
Table 10-4: Urban Traffic Congestion Thresholds
Facility Type
Conditions not Congested
Moderate Congestion
Heavy Congestion
Severe Congestion
Extreme Congestion
Freeway <15,000 vpdpl
15,000-17,500 vpdpl
17,500-20,000 vpdpl
20,000-25,000 vpdpl >25,000 vpdpl
Arterial < 5,500 vpdpl
5,500-7,000 vpdpl
7,000-8,500 vpdpl
8,500-10,000 vpdpl >10,000 vpdpl
“vpdpl” stands for vehicles per day per lane
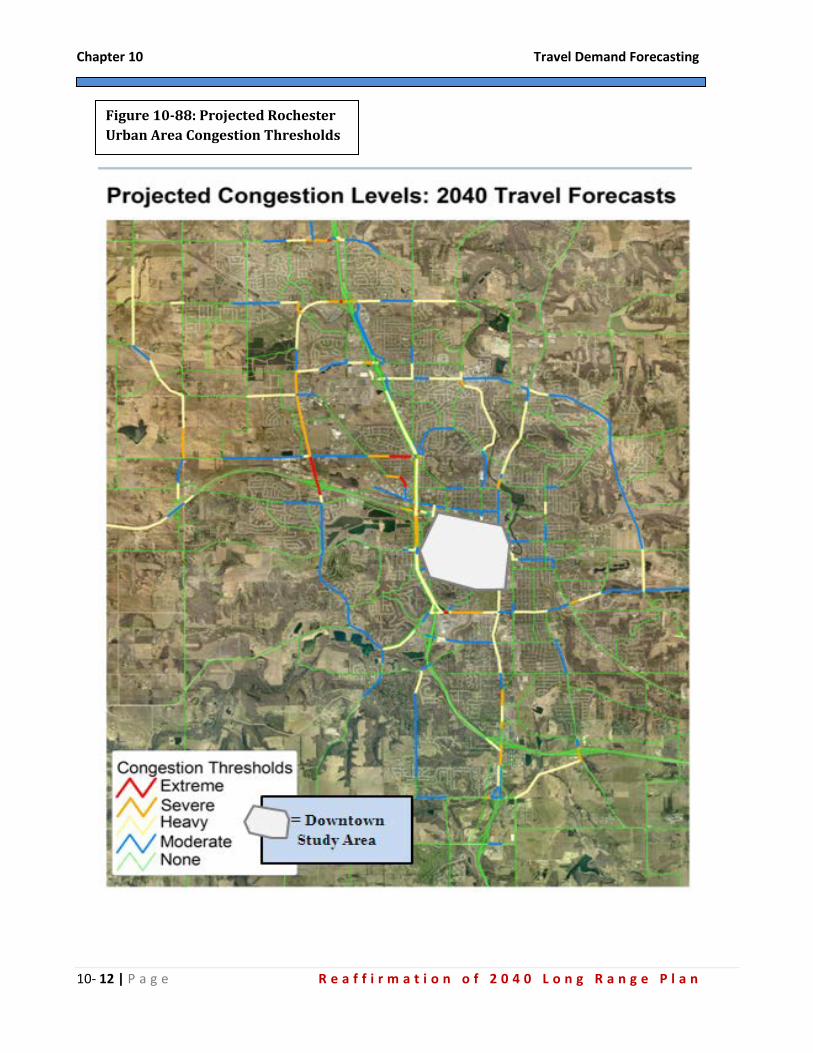
o This analysis was applied to projected 2040 traffic forecasts. Figure 10-8 on the next page highlights the projected level of congestion identified for street corridors in the urban area.
10- 11 | P a g e R e a f f i r m a t i o n o f 2 0 4 0 L o n g R a n g e P l a n
Chapter 10 Travel Demand Forecasting
Figure 10-88: Projected Rochester Urban Area Congestion Thresholds
10- 12 | P a g e R e a f f i r m a t i o n o f 2 0 4 0 L o n g R a n g e P l a n

Chapter 10 Travel Demand Forecasting
Urban Study Area: Signal Coordination and Intersection Improvement Needs
o Given that funding limitations and constraints will extent in the foreseeable future, efforts were made to look at options for more efficiently using the capacity of existing roadway corridors in order to extend the useful life of current facilities from an operational standpoint. One of the most promising options for squeezing additional capacity out of certain corridors is through the use of coordinated signal systems. With continued improvements in systems technology for improving traffic flow, consideration needs to be given to the future deployment and utilization of signal coordination systems.
o In order to assess whether major expressway and arterial traffic corridors could potentially benefit from the future deployment of coordinated signal systems, a first order evaluation referred to as a “coupling analysis” was completed to determine which corridors could potentially see benefits from installation and management of a coordinated signal system. The deployment of the necessary hardware for signal coordination also implies an ongoing periodic investment in developing and implementing synchronized timing plans along segments of major corridors in order to realize the benefits of reduced congestion and delay.
o Analysis was also completed, based on projected daily volumes at roadways crossings in the model network, of future turn lane and / or signalization improvements that may be needed. This evaluation looked at the following items:
– Major Turn Lane Needs: Locations where a heavy demand for left turns suggests that
the construction of dual left turn lanes will be needed to handle traffic flows. Additional right-of-way costs should be considered as part of the package of costs involved in constructing dual turn lane locations.
– Other Intersection Improvement Needs: These are locations where, based on analysis of projected daily volumes, there is an expectation that installation of standard turn lanes and/or signalization are expected to be warranted at some point within the time horizon of this plan.
o There are also a limited number of locations where for reasons of enhancing the overall operation
of the major highway system, additional interchanges or grade separations should be considered. These locations are also identified, along with the results of the signal coordination and intersection needs analysis, in Figure 10-9 on the next page.
10- 13 | P a g e R e a f f i r m a t i o n o f 2 0 4 0 L o n g R a n g e P l a n

Chapter 10 Travel Demand Forecasting
FIGURE 10-9: SIGNAL COORDINATION ANALYSIS RESULTS
10- 14 | P a g e R e a f f i r m a t i o n o f 2 0 4 0 L o n g R a n g e P l a n

Chapter 10 Travel Demand Forecasting
Regional Area Traffic Forecasts
Preparation of traffic projections for the Regional Study Area relies primarily on historic traffic growth trends to estimate future traffic flows. This process involved looking at growth rates over different time frames (5, 10 and 15 years), with a bias given towards using more recent growth rate trends as a guide to future growth in areas where additional development is anticipated, while using the longer term growth rates in areas of more stable land use. The analysis looks at growth both in absolute terms as well as on a percentage basis; however, the forecast process relies generally on using absolute growth trends since the application of percentage growth trends can lead to illogical results due to the fact that relatively small changes in historic traffic levels on low volume roads can result in high percentage growth rates, which if applied over a planning horizon of 30 years going forward can lead to unrealistically high projected volumes.
For the state trunk highway network, forecasts prepared by the Traffic Forecasting Unit in the MNDOT Central Office are relied on as the primary source of data for future traffic forecasts. This information was reviewed in light of existing and future land use plans for the small communities in Greater Olmsted County to identify areas where historic traffic growth trends may not be a good indicator of future traffic growth due to planned development that is not reflective of historic growth patterns. An example of one such area is the future growth plan for Pine Island in northwest Olmsted County, where the proposed Elk Run development suggests development well beyond historic levels will cause traffic growth to significantly exceed historic rates.
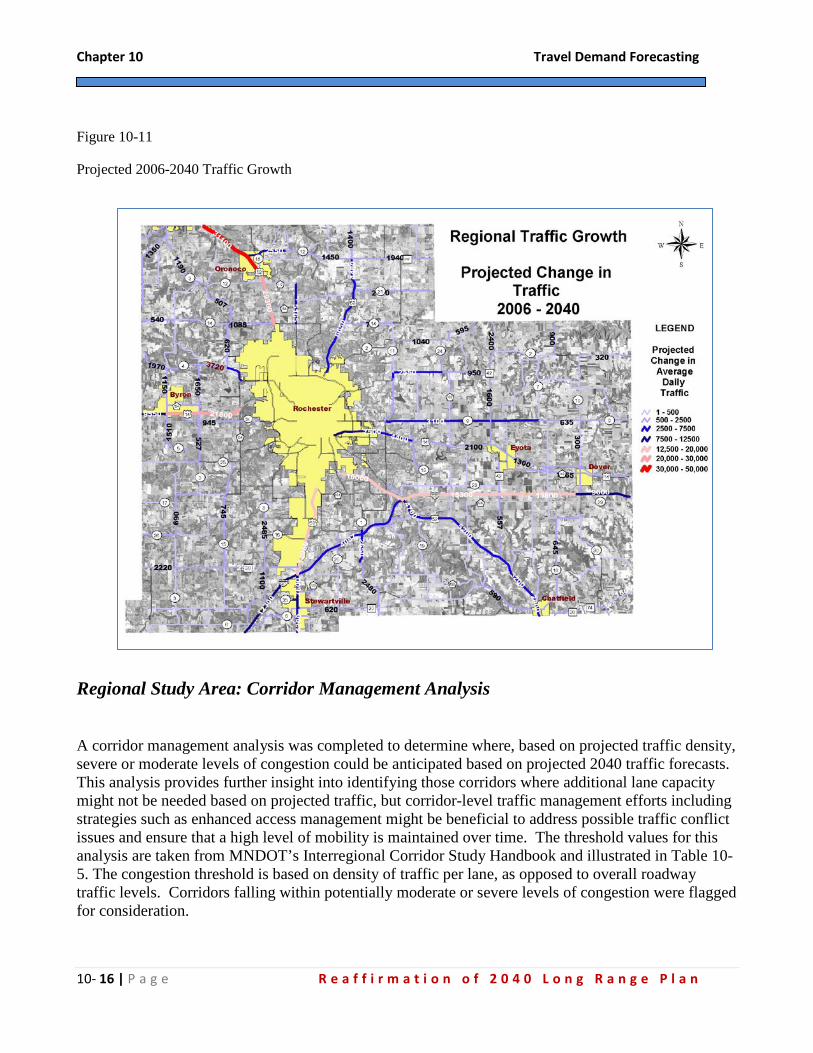
Figures 10-10 and 10-11 illustrate the results of the regional traffic forecasting work.
Figure 10-10
Projected 2040 Regional Traffic Volumes
10- 15 | P a g e R e a f f i r m a t i o n o f 2 0 4 0 L o n g R a n g e P l a n
Chapter 10 Travel Demand Forecasting
Figure 10-11
Projected 2006-2040 Traffic Growth
Regional Study Area: Corridor Management Analysis A corridor management analysis was completed to determine where, based on projected traffic density, severe or moderate levels of congestion could be anticipated based on projected 2040 traffic forecasts. This analysis provides further insight into identifying those corridors where additional lane capacity might not be needed based on projected traffic, but corridor-level traffic management efforts including strategies such as enhanced access management might be beneficial to address possible traffic conflict issues and ensure that a high level of mobility is maintained over time. The threshold values for this analysis are taken from MNDOT’s Interregional Corridor Study Handbook and illustrated in Table 10-5. The congestion threshold is based on density of traffic per lane, as opposed to overall roadway traffic levels. Corridors falling within potentially moderate or severe levels of congestion were flagged for consideration.
10- 16 | P a g e R e a f f i r m a t i o n o f 2 0 4 0 L o n g R a n g e P l a n

Chapter 10 Travel Demand Forecasting
Corridors identified as at-risk for moderate or severe congestion include:
TH 52 North of CSAH 12 – Severe Risk as an Rural Expressway
TH 14 West of CR 104 – Moderate to Severe Risk as an Rural Expressway
TH 63 from I-90 south to Root River – Moderate Risk as Urban Expressway
TH 52 South of I-90 to Chatfield – Moderate Risk as 2 Lane Highway
TH 14 East from CSAH 11 to MN 42 – Moderate Risk as 2 Lane Highway
TH 14 East of MN 42 – Low to Moderate Risk as 2 Lane Highway
TH 63 North of CSAH 14 – Low to Moderate Risk as 2 Lane Highway
Regional Study Area: Lane Needs & Capacity Analysis
The regional traffic forecasts are also analyzed to determine where 1) added capacity may be needed on existing major roads and highways, 2) higher levels of traffic can be anticipated on various corridors, 3) how many lanes may be needed on arterials or collector roads, and 4) intersections that may need geometric or operational improvements in the future. The various methods of analysis are completed at a generalized planning level since the travel demand model is only used in the Rochester urban area. The basic use of daily traffic thresholds for capacity or congestion is still used regardless of the forecasting method. The need for additional lane capacity in the regional study area was determined by comparing
projected 2040 traffic forecasts to typical capacity thresholds for existing roadway configurations. Each roadway is assigned a classification type based on design and operational characteristics. Capacity thresholds, illustrated in Table 10-6, are set at a level that would provide an acceptable level of service, which means that the level of congestion and delay would be at a level tolerable for most motorists. Forecasted traffic exceeding capacity thresholds identified those corridors where needs for additional capacity were identified.
Table 10- 5
10- 17 | P a g e R e a f f i r m a t i o n o f 2 0 4 0 L o n g R a n g e P l a n

Chapter 10 Travel Demand Forecasting
Corridors where projected volumes exceed capacity thresholds are highlighted on Figure 10-12 and the improvement needs in these corridors were considered in the financial needs assessment discussed in Chapter 15.
Figure 10-12: Lane Needs / Regional Highways
Roadway Type
Capacity Threshold (in Vehicles per
Day)4 Lane Rural / Suburban Freeway 65,000-75,0006 Lane Rural / Suburban Freeway 95,000-110,000
Rural 2 Lane Expressway 8,500-10,000Rural 3 Lane (Super Two) 15,000-17,500Rural 4 Lane Expressway 33,000-35,000
Small Urban 2 Lane Arterial/Collector 10,000-11,000Small Urban 3 Lane Arterial/Collector 15,000-17,500Small Urban 4 Lane Arterial/Collector 24,000-26,000
Suburban 2 Lane Narrow Roadway 6,500-7,500Suburban 2 Lane Wide Roadway 8,500-9,500Suburban 2 Lane Isolated Signals 15,000-17,500Suburban 4 Lane Isolated Signals 28,000-30,000
Table 10- 6
10- 18 | P a g e R e a f f i r m a t i o n o f 2 0 4 0 L o n g R a n g e P l a n

Chapter 10 Travel Demand Forecasting
Regional Study Area: Intersection Needs Analysis Intersection improvement needs are evaluated based on forecasted 2040 traffic volumes using
thresholds found in the MNDOT Access Management Policy on Highway Classification and Spacing. This policy handbook provides Risk Conflict graphs for different types of roadway facilities which can be used to identify where side street traffic can be expected to have great difficulty finding suitable gaps for crossing or entering a mainline highway traffic stream. These graphs provide an indication where future improvements may be warranted. An example of the graph for two lane highways is shown in Figure 10-13.
Intersections where moderate to high risk conditions were identified when considering projected
traffic volumes are shown in Figure 10-14 on the next page. Improvements that could be warranted at such locations could include construction of turn lanes where they currently do not exist, additional intersection lighting, an enhanced level of intersection marking and signage, or, in the most severe cases, signalization. The purpose of the analysis is not to identify the specific level of improvement; that determination should be made based on a site specific study. However, for the purposes of needs assessment, analysis indicative of a future need were flagged and included in the financial needs assessment at a standardized cost of improvement of $150,000 to $250,000 per location depending on the level of conflict anticipated and type of roadway involved.
Figure 10- 13: Mn/DOT Risk Assessment Graph
10- 19 | P a g e R e a f f i r m a t i o n o f 2 0 4 0 L o n g R a n g e P l a n

Chapter 10 Travel Demand Forecasting
Figure 10-14: Intersection Risk Analysis-Regional Highways
10- 20 | P a g e R e a f f i r m a t i o n o f 2 0 4 0 L o n g R a n g e P l a n