chapter 11 regulated cell death - elsevier
TRANSCRIPT

© 2020 Elsevier Inc. All rights reserved.
Chapter 11Regulated Cell Death

© 2020 Elsevier Inc. All rights reserved. 2
Figure 11–1. Programmed cell death during animal development. Programmed cell death serves a number of different functions
during development including (A,B) the sculpting of organs and tissues, (C,D) the deletion of unwanted structures during development,
(E,F) the elimination of injured or harmful cells, including those that are transformed, damaged, or infected, and (G) the adjustment of
proper cell numbers.

© 2020 Elsevier Inc. All rights reserved. 3
Figure 11–2. Different forms of cell death. (A) Schematic illustration of morphological changes that characterize cell death by necrosis,
apoptosis, and autophagic cell death. While necrotic cell death culminates in cell lysis and provokes inflammation, apoptotic cells are
packaged into apoptotic bodies that are then engulfed by adjacent cells without an inflammatory response. Autophagic cell death is
characterized by the appearance of cytoplasmic vesicles engulfing bulk cytoplasm and organelles. The contents of the vesicles are
digested by the lysosomal system of the same cell after the fusion of the autophagic vesicles with lysosomes. (B–D) Ultrastructural
features of cells undergoing apoptotic and autophagic cell death. (B) A normal cell, (C) an apoptotic cell, and (D) a cell undergoing
autophagic cell death are shown. Polyribosomes (arrowhead), mitochondria (arrow), and autophagic vacuoles (double arrows) are
indicated. While autophagic vacuoles can be seen in healthy cells and apoptotic cells, they are much more abundant during autophagic
cell death. (From Bursch et al. J Cell Sci 2000;113:1189–1198.)

© 2020 Elsevier Inc. All rights reserved. 4
Figure 11–3. The basic genetic pathway of programmed cell death in C. elegans . Activation of CED-3 and CED-4 lead to cell death
in the nematode. CED-9 can inhibit cell death by preventing CED-4 from activating CED-3. EGL-1 can promote cell death by binding to
CED-9, thus displacing it from CED-4.

© 2020 Elsevier Inc. All rights reserved. 5
Figure 11–4. Structure and activation of caspases. (A) Activation of caspases. Caspases are synthesized in their zymogen form
requiring proteolytic processing for activation. Processing of the proenzyme at specific aspartate residues removes the N-terminal
prodomain. Cleavage between the large and short subunits and association of two heterodimers to form a tetramer results in the
generation of active caspase. (B) Members of the vertebrate caspase family. Caspases include families of initiator caspases and
executioner or effector caspases that mediate apoptotic cell death. Other caspases have different functions, including inflammation and
differentiation. Many caspases have CARD or DED through which homotypic interactions occur.

© 2020 Elsevier Inc. All rights reserved. 6
Figure 11–5. Homotypic DED-DED or CARD-CARD interactions bring initiator caspases in close proximity. (A) Linking TNF family
death receptors to DED family caspases through the bipartite adapter FADD. The DD of FADD binds either directly to the DD in the
cytosolic tails of TNF family receptors or indirectly through other DD-containing adapter proteins (not shown). The DED of FADD binds the
DEDs of procaspases-8 (and 10), bringing procaspase-8 molecules in close proximity. (B) The CARD of Apaf-1, which oligomerizes into a
heptamer, binds to the CARD of procaspase-9 forming a heptameric complex in which procaspase-9 molecules are in close proximity.

© 2020 Elsevier Inc. All rights reserved. 7
Figure 11–6. Caspase activation by the extrinsic and intrinsic pathways. The extrinsic or death receptor pathway (left half of the
figure) is activated by the binding of a ligand such as FasL to its receptor Fas followed by the sequential binding of the adaptor protein
FADD and procaspase-8, resulting in the formation of a protein complex referred to as a death-inducing signaling complex (DISC). The
formation of the DISC permits the activation of procaspase-8, which then proteolyzes and activates caspase-8. The mitochondrial
pathway (right half of the figure) also leads to the activation of caspase-3. This pathway involves the release of cytochrome c from the
mitochondria. Once in the cytoplasm, cytochrome c promotes the assembly of Apaf-1 and procaspase-9 into a large complex containing
seven molecules each of Apaf-1 and procaspase-9. This complex containing Apaf1, procaspase-9, cytochrome c, and ATP is referred to
as an apoptosome. Active caspase-9 within the apoptosome can cleave caspase-9. In addition to cytochrome c, other proapoptotic
proteins such as Smac/Diablo are released. Smac/Diablo acts by sequestering IAPs away from caspases, thus permitting cell death to
occur. One of the many targets of caspase-3 is a cytoplasmic protein called ICAD (inhibitor of CAD) which binds to CAD (caspase-
activated DNAse) sequestering it. Cleavage of ICAD by caspase-3 liberates CAD to translocate to the nucleus where it cleaves DNA into
fragments.

© 2020 Elsevier Inc. All rights reserved. 8
Figure 11–7. Inhibition of caspases protects neurons from death. Sympathetic neurons cultured from the superior cervical ganglion
of rats or mice will survive in tissue culture medium supplemented with NGF (Nerve Growth Factor). Removal of NGF from the medium
leads to apoptosis. Panels (A)–(C) show images from phase contrast microscopy. When maintained in the presence of NGF (Panel A),
the neurons appear bright, and their processes are smooth and abundant. When deprived of NGF (Panel B), the cell bodies and the
processes of the neurons degenerate. Neuronal cell death induced by NGF deprivation is prevented if a pan-caspase peptide inhibitor, z-
VAD-fmk, is added to the culture medium (Panel C). Panels (D)–(F) show images on nuclei stained with a fluorescent DNA-binding dye.
Whereas chromatin staining is diffuse within the nuclei of neurons receiving NGF (Panel D), chromatin within the nuclei of cultures
deprived of NGF is condensed and fragmented (Panel E), hallmarks of apoptotic cell death. Inhibition of caspases by the addition of z-
VAD-fmk (Panel F) prevents the condensation and fragmentation of chromatic even in the absence of NGF. (From Deshmukh et al. J Cell
Biol 1996;135:1341–1354.)

© 2020 Elsevier Inc. All rights reserved. 9
Figure 11–8. The Bcl-2 family of proteins. On the basis of functional and structural criteria, the Bcl-2 family has been divided into three
groups. Members of the Group 1 family are antiapoptotic and possess all four BH domains (BH1–BH4). Group II Bcl-2 proteins, also
referred to as multidomain Bcl2 proteins, also contain four BH domains. In contrast, Group III consists of a large group of proapoptotic
proteins that contain the BH3 domain only and are therefore referred to as BH3-only Bcl2 proteins. Many Bcl-2 proteins also have a C-
terminal transmembrane domain (TMD) with which they attach to various intracellular membranes such as the mitochondrial membrane.
The figure also lists representative members of each subfamily.

© 2020 Elsevier Inc. All rights reserved. 10
Figure 11–9. The apoptosis pathway in C. elegans, Drosophila, and vertebrates. In vertebrates, antiapoptotic proteins, such as Bcl-
2, preserve the integrity of the mitochondria and prevent release of cytochrome c (Cyt c). Activation of proapoptotic Bcl-2 proteins, such
as Bax, promotes Cyt c release as well as the release of other apoptotic proteins, such as Smac. While Cyt c promotes Apaf-1
oligomerization and the recruitment of the initiator caspase, caspase-9, Smac promotes apoptosis by inhibiting IAPs. Following its
activation, caspase-9 cleaves and activates effector caspases, such as caspase-3 and caspase-7, which induce cell death through the
cleavage of multiple cellular proteins. In C. elegans, apoptosis is initiated by the inhibition of the Bcl-2-like protein, CED-9, by the BH3-
only-like protein, EGL-1, through direct interaction. This liberates the Apaf-1-like protein, CED-4, which oligomerizes and activates the
caspase-9-like protein, CED-3, leading to cell death. There is effector caspase or Cyt c release in C. elegans. In Drosophila, also Cyt c is
not released, but apoptosis is triggered by the increased expression of the RHG proteins, Reaper, Hid, and Grim, which inactivate the
IAP, DIAP1. This permits the Apaf-1-like protein, ARK, to activate the caspase-9-like protein, DRONC. Activated DRONC activates
effector caspases like DRICE, to kill the cell.

© 2020 Elsevier Inc. All rights reserved. 11
Figure 11–10. Changes at the surface of the apoptotic cell. (A) During apoptosis the structure of the cell surface changes because of the
translocation of some molecules that are normally intracellular to the outside surface of the plasma membrane and the modification of
existing molecules. (B) Engulfment receptors on the phagocytic cell bind to “eat me” signals either directly or indirectly. The figure shows
that phosphatidylserine (PS) is translocated from the inner layer of the plasma membrane lipid bilayer to the outer layer through the action
of a flippase, a lipid translocating enzyme. PS is recognized by phagocytic receptors either directly or indirectly through the binding of
bridging molecules to PS.

© 2020 Elsevier Inc. All rights reserved. 12
Figure 11–11. Exposure of phosphatidylserine (PS) is a key “eat me” signal in apoptotic cells. In healthy cells, flippase is active,
and scramblase is inactive causing PS to localize to the inner leaflet of the plasma membrane. In apoptotic cells, effector caspases cleave
and inactivate flippase while activating scramblase causing the translocation of PS to the outer leaflet of the plasma membrane. PS is
recognized and bound by PS receptors on phagocytic cells that leads to the engulfment of the apoptotic cell.

© 2020 Elsevier Inc. All rights reserved. 13
Figure 11–12. Schematic of major steps in autophagy. Expansion of a membrane derived from the ER membrane, or possibly other
sources, leads to the formation of a cuplike structure that engulfs cytoplasmic material, including organelles such as mitochondria. This
extends further to form a double-membrane vesicle called the autophagosome, which fuses with the lysosome. The cargo of the
autophagosome is digested by lysosomal enzymes.

© 2020 Elsevier Inc. All rights reserved. 14
Figure 11–13. Mitophagy involves the function of PINK1 and Parkin. Under normal circumstances and when mitochondria are
healthy, PINK1 is transported into the mitochondria through the TOM/TIM complex and degraded. However, when the mitochondria are
dysfunctional, PINK1 accumulates at the surface of the outer mitochondrial membrane (OMM). PINK1 phosphorylates the E3 ligase,
Parkin, and ubiquitin in OMM proteins. This causes the recruitment of Parkin to the OMM where is polyubiquitinated membrane proteins,
which is recognized by autophagy receptors. The dysfunctional mitochondria are enclosed in autophagosomes and transported to
lysosomes where they are degraded.

© 2020 Elsevier Inc. All rights reserved. 15
Figure 11–14. Signaling pathways promoting necroptosis. Cytokines such as TNF and Fas ligand bind to their receptors causing
their trimerization and recruitment of adaptor proteins, procaspase-8, RIP1, and other proteins. This can result in the activation of
caspase-8, which proteolyzes RIP1 and other substrates to promote apoptosis. However, if caspase-8 is not activated, RIP1 is activated
by phosphorylation. Through its RHEM domain, activated RIP1 recruits RIP3, which also has a RHIM domain. RIP1 phosphorylates RIP3,
which leads to its activation, causing the recruitment of MKLK, which is then phosphorylated by RIP3. This leads to the oligomerization of
MKLK, which binds to phosphoinositides in the plasma membrane to form pore through which Na+ comes into the cell followed by water.
This causes swelling of the cell and membrane rupture. The leakage of cellular contents stimulates inflammation. Necroptosis can also
result from the activation of Toll-like receptors (TLR), like TLR3 and TLR4. In this case, RIP3 is activated through the binding of an
adapter protein to the TLR. In this RIP1-independent mechanism, RIP3 activates MLKL, which then oligomerizes and forms pores leading
to membrane rupture.
© 2020 Elsevier Inc. All rights reserved. 16
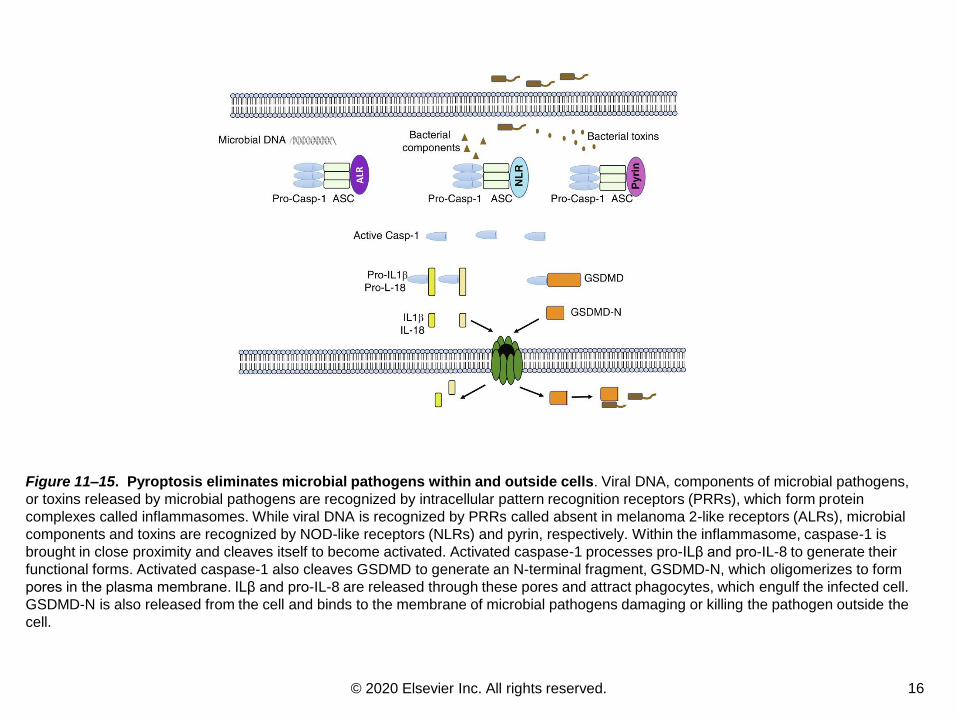
Figure 11–15. Pyroptosis eliminates microbial pathogens within and outside cells. Viral DNA, components of microbial pathogens,
or toxins released by microbial pathogens are recognized by intracellular pattern recognition receptors (PRRs), which form protein
complexes called inflammasomes. While viral DNA is recognized by PRRs called absent in melanoma 2-like receptors (ALRs), microbial
components and toxins are recognized by NOD-like receptors (NLRs) and pyrin, respectively. Within the inflammasome, caspase-1 is
brought in close proximity and cleaves itself to become activated. Activated caspase-1 processes pro-ILβ and pro-IL-8 to generate their
functional forms. Activated caspase-1 also cleaves GSDMD to generate an N-terminal fragment, GSDMD-N, which oligomerizes to form
pores in the plasma membrane. ILβ and pro-IL-8 are released through these pores and attract phagocytes, which engulf the infected cell.
GSDMD-N is also released from the cell and binds to the membrane of microbial pathogens damaging or killing the pathogen outside the
cell.

© 2020 Elsevier Inc. All rights reserved. 17
Figure 11–16. Lipid peroxidation triggers ferroptosis. System Xc− imports cystine, which is reduced to cysteine within the cell, and used in
biosynthesis of glutathione (GSH), a necessary substrate of glutathione peroxidase (GPX4). Toxic lipid hydroperoxides, derived from
membrane lipids through the action of lipoxygenases (LOXs), care converted by GPX4 to their corresponding nontoxic alcohols, thus
protecting the cell. Uncleared lipid hydroperoxides triggers the formation of lipid reactive oxygen species (ROS) that induces ferroptosis.
Ferroptosis can therefore result from decreased levels of GSH or from reduced activity or the inhibition of system Xc− or GPX4. Also
necessary for the induction of ferroptosis is disruption in iron homeostasis. Ferric iron (Fe3 +), imported through the transferrin receptor
following binding with transferrin, is reduced to ferrous iron (Fe2 +). Accumulation of Fe2 + not only produces lipid ROS through the Fenton
reaction but also can catalyze lipid peroxidation by combining with cytosolic LOXs, which then leads to the production of lipid ROS and
ferroptosis.