chapter 12.1 radionuclides in sediments · “approximately 1000 boring samples were analyzed,”...
TRANSCRIPT

CHAPTER 12.1
RADIONUCLIDES IN SEDIMENTS
ABSTRACT This chapter discusses radionuclide concentrations measured in sediment samples collected on or in the vicinity of the Savannah River Site (SRS). We reviewed the history of sediment monitoring at the SRS and evaluated these data with regard to their potential usefulness for dose reconstruction. We compiled and examined sediment data to determine their potential value in source term verification, model validation, and direct exposure assessment. Uranium data collected from Steed’s Pond, which received liquid effluents from the M-Area via Tim’s Branch, may be useful for source term verification and model validation of uranium releases from the M-Area. However, the potential usefulness of the Steed’s Pond data, which are limited in number, is bounded by spatial resolution. Results of measurements of long-lived radionuclides (uranium, plutonium, and 137Cs) in streambeds do not appear useful because samples do not represent the entire streambed and demonstrate no spatial trends because of the complex sediment deposition processes involved. Appendix K further discusses potential uses for environmental monitoring data.
INTRODUCTION
Long-lived contaminants, deposited by releases to air and SRS streams, tend to accumulate in bottom sediments. Deposits may be in distinct layers, for example, after discrete release events; thus, they preserve the temporal history of liquid releases to a stream, pond, or river. Deposition patterns often show concentrations decreasing as a function of distance from the source of contamination, thus, revealing spatial trends and defining the extent of contamination. This chapter summarizes reported information regarding radionuclide concentrations in sediments on or in the vicinity of the SRS. We examined several sets of routine semiannual and annual environmental monitoring reports, prepared by the SRS contractor and spanning the years 1953 through 1992. See Chapter 7, Table 7-1 for a complete description of the various monitoring report series. Data usefulness was considered in terms of the following:
• The contaminant is a key contaminant (i.e., screened in Task 3 of Phase I of the dose reconstruction to potentially contribute significantly to dose)
• The contaminant was monitored during the period of interest (i.e., 1951 through 1990) • Contaminant concentrations were above detection limits • The results demonstrate expected trends (spatially and temporally)
− Concentrations were generally higher close to the source − Concentrations in sediment cores are often present in discrete layers.
Data that are available for sediments include gross alpha activity; nonvolatile beta activity;
and concentrations of gamma-emitting radionuclides, uranium and plutonium. Appendix A details analytical and counting procedures for sediment samples. We provide the summary results for the onsite streams and Savannah River locations in this chapter.
Risk Assessment Corporation “Setting the standard in environmental health”

12.1-2 The Savannah River Site Dose Reconstruction ProjectPhase II: Source Term Calculation and Ingestion Pathway Data Retrieval
MEASUREMENT OF CONTAMINANTS IN SEDIMENTS
Routine sediment monitoring began in 1951 with the collection of stream sediments for use in establishing background levels of radioactivity at 13 locations along the inner perimeter and 17 locations along the outer perimeter of the SRS (Reinig et al. 1953; Reinig 1952). The sampling locations included stations on the Upper Three Runs Effluent System (including Tim’s Branch), Four Mile Creek, Steel Creek, Pen Branch, Indian Graves Branch, Lower Three Runs, and the Savannah River. Sample collection methods are not detailed, although Reinig (1952) states that “approximately 1000 boring samples were analyzed,” implying that a soil-coring device of unspecified diameter was used. Samples from the 1951 survey varied in weight from 0.7 to 2.5 grams (g). The samples were analyzed for gross alpha and gross beta activity and plotted as activity versus location. This sampling, analysis, and reporting regime continued in 1953 following the start up of the plant (Albenesius 1954). Table 12.1-1 summarizes general features about the sediment sampling program at the SRS through 1991, including the cessation of a routine sediment sampling program from 1963 through 1977.
Table 12.1-1. Sediment Sampling Summary at SRSa
Years
Site monitoring areas
No. of samples
Measured
1951-1953 At mouth of Upper Three Runs, Four Mile Creek, Steel Creek, Pen Branch, Indian Grove Branch. Lower Three Runs
30 Gross alpha; gross beta
1954 Same as above but sampling along stream length
46 Alpha (U+Pu); nonvolatile beta
1955-1961 TNX effluent ditch added to above; Table 12.1-2 and Figures 12.1-1, 12.1-2, 12.1-3 summarize locations and data
48 Alpha (U+Pu); nonvolatile beta
1963-1977 No routine sediment monitoring program; resumed in 1977 1977-1991 Routine sediment monitoring
resumed in site streams and in Savannah River
15 Gamma-emitting radionuclides, 238Pu, 239Pu, 90Sr
1967, 1981, 1984
Special study: Steed’s Pond receiving M-Area effluent
6-15 Uranium
1974-1976 Special study: Savannah River swamp
137Cs, 238Pu, 239Pu, 90Sr
a From annual environmental monitoring reports (see Table 7-1).
In 1954, the number of locations sampled for sediment increased to 46 along the five major stream systems that carry waste into the Savannah River (Upper Three Runs, Four Mile Creek, Steel Creek, Pen Branch, and Lower Three Runs); Tim’s Branch (which carries plant waste into Upper Three Runs); and the Savannah River. The sampling design was changed from perimeter sampling to sampling along the length of each stream system (Horton 1954, 1955). Approximately 80% of the weekly samples were analyzed for alpha activity (uranium and plutonium) using tri-n-butyl phosphate (TBP) extraction and scintillation counting (see

Evaluation of Materials Released from SRS Radionuclides in Sediments
12.1-3
Appendix A). All of the samples were analyzed for nonvolatile beta activity. The maximum and average uranium or plutonium activity for each 6-month period and stream location was reported in the semiannual environmental monitoring reports as disintegrations per minute per gram.
In 1955, the sampling network was changed to include the TNX effluent ditch, which empties effluent directly into the Savannah River (Alexander and Horton 1956; Horton and Mealing 1956). Approximately 70% of the weekly samples were analyzed for uranium or plutonium activity. All were analyzed for nonvolatile gross beta activity. A similar sampling strategy continued through 1960 (Mealing et al. 1958, Harvey et al. 1959a, 1959b, and Du Pont 1959, 1960), but results of TBP extraction and scintillation counting were reported as gross alpha activity (curies per gram) instead of uranium and plutonium activity. The sampling designs for 1955 through 1960 are outlined in Table 12.1-2, Figures 12.1-1 and 12.1-2 show water and sediment sampling locations from 1954 to 1958 and from 1959 to 1960, respectively.
Marter and Boulogne (1961) provide some information on sediment sample collection methods. This document states that stream mud samples, taken at all river and stream locations, were generally collected close to the bank and “bear no relation to localized ‘silt out’.”
In 1961, the sediment sampling program consisted of weekly samples collected from 16 stream locations and weekly and monthly samples collected from 7 river locations (as shown in Figure 12.1-3). Monthly sediment samples from five river locations (2, 3, 5, 8, and 9) and weekly samples from two river locations (10 and 11) and two stream locations (3 and 4) were analyzed for TBP extractable alpha activity.
Table 12.1-2. Sediment Sampling Design (1955–1960)
Sampling area Number of sampling locations 1955 1956 1957 1958 1959 1960Tim’s Branch 5 4 3 4 4 3 Upper Three Runs 4 4 4 4 4 4 Four Mile Creek 7 7 7 7 5 5 Pen Branch 3 3 3 3 2 2 Steel Creek 5 4 4 4 3 3 Lower Three Runs 3 3 3 4 5 c 5c TNX Effluent 1 1 1 – – – Savannah River 10 10 10 11 11 11 Collection frequency Weeklya Weekly Monthlyb Monthlyb Monthlyb Weeklyd Total number of samples analyzed
for nonvolatile beta
2209
1350
475
520
520
1166 Total number of samples analyzed
for uranium and plutonium
1446
1036
339
454
454
1166 a Sediments collected biweekly at 8 of 10 locations along the Savannah River beginning in July 1955. b Sediments collected monthly, except samples were collected weekly at one location on the Savannah River,
where it intersects Highway 301. c Includes three sample locations at Par Pond. d Sediments collected monthly on the Savannah River, except at two locations, where samples collected weekly.
Risk Assessment Corporation “Setting the standard in environmental health”

12.1-4 The Savannah River Site Dose Reconstruction ProjectPhase II: Source Term Calculation and Ingestion Pathway Data Retrieval
Figure 12.1-1. Map of SRS routine stream and river sampling locations used in the sediment sampling programs from 1954 through 1958.

Evaluation of Materials Released from SRS Radionuclides in Sediments
12.1-5
Figure 12.1-2. Map of SRS routine stream and river sampling locations used in 1959 and 1960 sediment sampling programs.
Risk Assessment Corporation “Setting the standard in environmental health”

12.1-6 The Savannah River Site Dose Reconstruction ProjectPhase II: Source Term Calculation and Ingestion Pathway Data Retrieval
Figure 12.1-3. Map of SRS routine stream and river sampling locations used in 1961 and 1962 sediment sampling programs.
In 1963, it was proposed that all routine sediment sampling be eliminated on the basis that “the information gained with present methods is meaningless” (Johnson 1963). Routine sediment sampling was discontinued from 1963 through the mid-1970s. Collection of sediments was resumed in 1974 (Ashley and Zeigler 1976). Ten sediments cores, 25 cm deep, were collected from each of 10 trails transecting the Savannah River swamp, where radioactive materials from

Evaluation of Materials Released from SRS Radionuclides in Sediments
12.1-7
Savannah River Plant (SRP) releases in 1960s were deposited in about 1.7 mi2 of offsite swamp downstream from the SRP. The cores were divided into two increments (from 0 to 7.6 cm and from 7.6 to 25 cm), which were composited by increment from each location (trail) for plutonium analysis. In addition, 12 sediment samples were collected in the Savannah River, starting above the Site and continuing to the Savannah, Georgia harbor. Samples were analyzed for gamma-emitting radionuclides (137Cs in particular), 238Pu, and 239Pu. In 1976, samples were also analyzed for 90Sr (Ashley and Zeigler 1977).
Sediment collections in the Site streams resumed in 1977 to obtain an estimate of the maximum accumulation of radioactivity released from the Site (Ashley and Zeigler 1978). The 1977 and subsequent annual reports state that stream sediment sampling locations were designed to obtain an estimate of the maximum accumulation and are, therefore, not representative of the entire stream bed. The sampling approach called for collecting approximately the top 8 cm of sediment in areas where fine sediment accumulates. The sediments in the Savannah River continued to be sampled, although sediment sampling in the Savannah River swamp was reduced in frequency in 1978 because the results of these surveys showed no significant changes in radiological conditions. At that time it was decided to conduct comprehensive surveys of the swamp every 5 years, including sediment, vegetation, animals, fish, and thermoluminescent dosimeter (TLD) measurements unless additional surveys were warranted by changes in the annual TLD radiation measurements (Ashley and Zeigler 1979).
Several nonroutine sediment sampling studies have been conducted over the years. Three studies that may be of particular importance to the dose reconstruction are the surveys of Steed’s Pond sediments for uranium conducted in 1967, 1981, and 1984 (Ashley and Zeigler 1982, Zeigler et al. 1986). Before 1985, when an advanced liquid waste treatment facility was put into operation, untreated liquid effluents containing uranium were released to Tim’s Branch via a drainage ditch. Tim’s Branch flowed into Steed’s Pond, which acted as a settling basin and accumulated uranium in the sediments. Steed’s Pond originally had an area of approximately 14 acres and had a spillway that partially collapsed in the early 1960s. The spillway was only partially removed, as evidenced by the retention of a few acres of water. The first survey was conducted on the sediments that were exposed. At that time, six 18-in. sediment cores were collected, separated into 6-in. segments, and analyzed for uranium. In the early 1970s the spillway was repaired and the pond returned to a surface area of about 11 acres.
The spillway was opened in January 1981, and the pond was drained for turtle studies. While the pond was drained, six 6-in. sediment cores were collected and analyzed for uranium. In August 1984, the spillway collapsed and the pond was drained completely. Fifteen 24-in. sediment cores were collected. In addition, 15 samples were taken between Steed Pond and the M-Area effluent ditch. The samples were divided into increments of 0–6 in., 6–12 in., and 12–24 in., and they were analyzed for uranium as well as for chromium, copper, lead, nickel, sodium, aluminum, ammonia, chlorine, nitrate, and thorium. The uranium concentrations in the 1985 sediment samples were analyzed using more sophisticated radiochemical techniques than TBP extraction.
The Savannah River Environmental Laboratory (SREL) did extensive research on the behavior of 137Cs within the Steel Creek flood plain. This research, which is summarized in Carlton et al. (1992), addresses the availability of cesium in the sediments for plant uptake and its subsequent transfer through the food chain.
Risk Assessment Corporation “Setting the standard in environmental health”
12.1-8 The Savannah River Site Dose Reconstruction ProjectPhase II: Source Term Calculation and Ingestion Pathway Data Retrieval
Measurements of Uranium in Sediments
Greater than 97% of the gross alpha activity released from SRS facilities occurred from the
M-Area (Evans et al. 1992). Essentially all of the alpha activity in the process effluent in the M-Area has been identified as depleted uranium. Most of this activity was released between 1966 and 1969 during the development of a new uranium/aluminum bonding process for fuel and target assemblies. Because the effluent from the M-Area was released into Tim’s Branch, the dose reconstruction should focus on uranium data collected from sediments of this stream.
Steed’s Pond acted as a settling basin for Tim’s Branch, as evidenced by the accumulation of sediment of about 3 ft of sediment in the vicinity of the Steed’s Pond spillway. Water entering the pond had a residence time of about 3 days (Evans et al. 1992). The first survey for uranium, conducted in February 1967, indicated that the top 6 in. of sediment contained greater than 90% of the uranium activity detected in the cores (Ashley and Zeigler 1982). The uranium concentrations in the upper 6 in. ranged from 20 to 531 pCi g−1. Concentrations in the second 6-in. increment had decreased to about one-eighth the surface value. The uranium concentration was near background concentrations (approximately 5 pCi g−1) between 12 and 24 in.
In 1981, the six 6-in. cores collected from Steed’s Pond had an average uranium concentration of 170 to 700 pCi g−1, about twice as great as the 1967 results. Evans et al. (1992) attributes this increase to additional uranium released to the effluent since 1966. Approximately 10 Ci of uranium was released to Tim’s Branch from 1954 through 1966. An additional 15 Ci was released from 1966 through 1981.
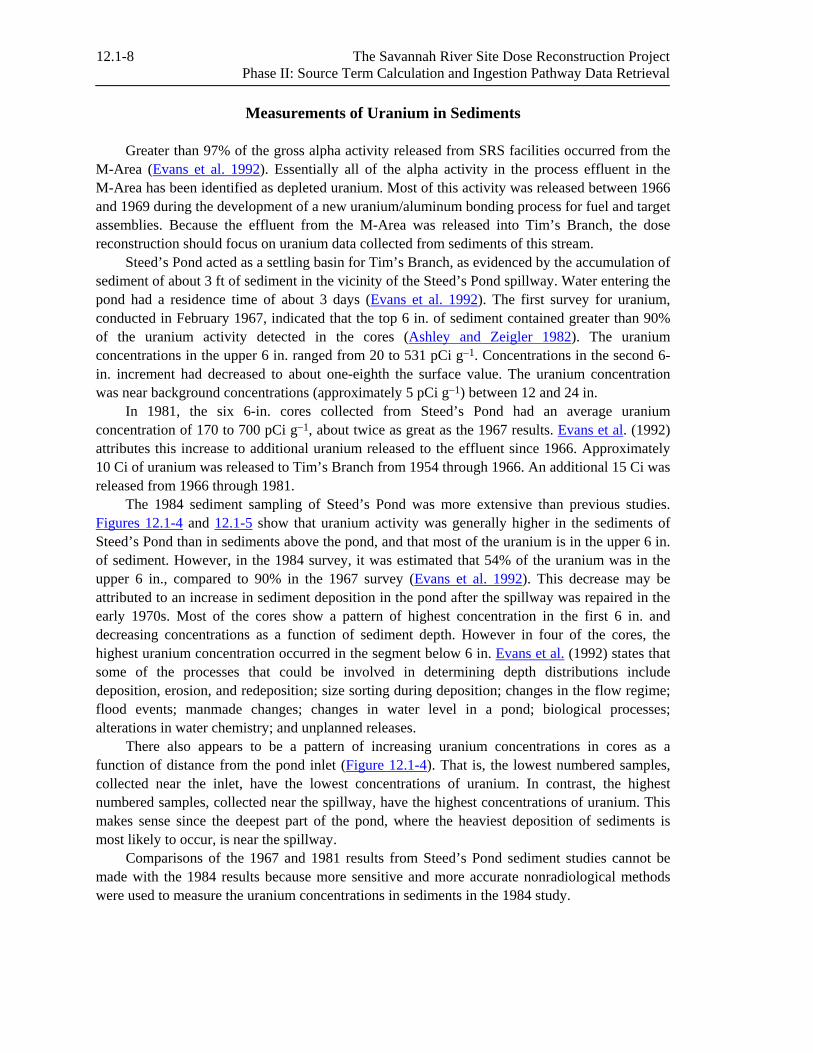
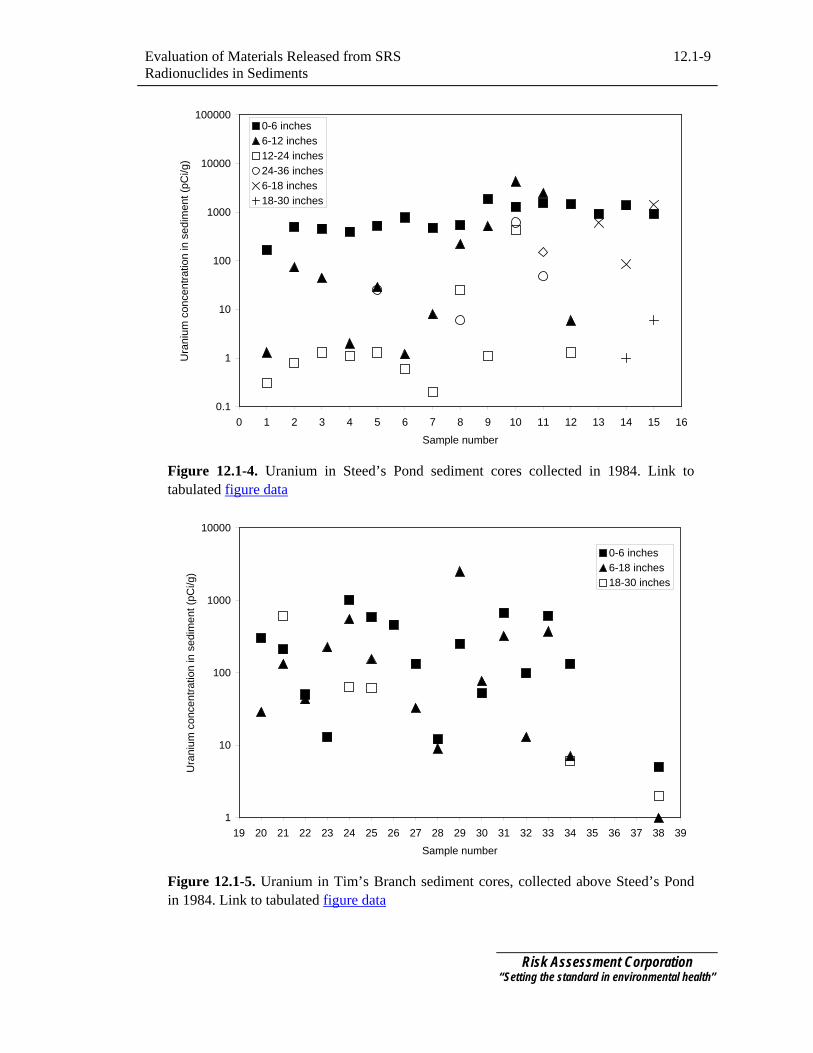
The 1984 sediment sampling of Steed’s Pond was more extensive than previous studies. Figures 12.1-4 and 12.1-5 show that uranium activity was generally higher in the sediments of Steed’s Pond than in sediments above the pond, and that most of the uranium is in the upper 6 in. of sediment. However, in the 1984 survey, it was estimated that 54% of the uranium was in the upper 6 in., compared to 90% in the 1967 survey (Evans et al. 1992). This decrease may be attributed to an increase in sediment deposition in the pond after the spillway was repaired in the early 1970s. Most of the cores show a pattern of highest concentration in the first 6 in. and decreasing concentrations as a function of sediment depth. However in four of the cores, the highest uranium concentration occurred in the segment below 6 in. Evans et al. (1992) states that some of the processes that could be involved in determining depth distributions include deposition, erosion, and redeposition; size sorting during deposition; changes in the flow regime; flood events; manmade changes; changes in water level in a pond; biological processes; alterations in water chemistry; and unplanned releases.
There also appears to be a pattern of increasing uranium concentrations in cores as a function of distance from the pond inlet (Figure 12.1-4). That is, the lowest numbered samples, collected near the inlet, have the lowest concentrations of uranium. In contrast, the highest numbered samples, collected near the spillway, have the highest concentrations of uranium. This makes sense since the deepest part of the pond, where the heaviest deposition of sediments is most likely to occur, is near the spillway.
Comparisons of the 1967 and 1981 results from Steed’s Pond sediment studies cannot be made with the 1984 results because more sensitive and more accurate nonradiological methods were used to measure the uranium concentrations in sediments in the 1984 study.
Evaluation of Materials Released from SRS Radionuclides in Sediments
12.1-9
0.1
1
10
100
1000
10000
100000
0 1 2 3 4 5 6 7 8 9 10 11 12 13 14 15 16Sample number
Ura
nium
con
cent
ratio
n in
sed
imen
t (pC
i/g)
0-6 inches6-12 inches12-24 inches24-36 inches6-18 inches18-30 inches
Figure 12.1-4. Uranium in Steed’s Pond sediment cores collected in 1984. Link to tabulated figure data
1
10
100
1000
10000
19 20 21 22 23 24 25 26 27 28 29 30 31 32 33 34 35 36 37 38 39Sample number
Ura
nium
con
cent
ratio
n in
sed
imen
t (pC
i/g)
0-6 inches6-18 inches18-30 inches
Figure 12.1-5. Uranium in Tim’s Branch sediment cores, collected above Steed’s Pond in 1984. Link to tabulated figure data
Risk Assessment Corporation “Setting the standard in environmental health”

12.1-10 The Savannah River Site Dose Reconstruction ProjectPhase II: Source Term Calculation and Ingestion Pathway Data Retrieval
Measurements of Plutonium in Sediments
Carlton et al. (1992) states that fallout deposited on the Savannah River watershed has been
estimated at 55 Ci with a 238Pu/239,240Pu ratio of 0.04 to 0.18. Approximately 1.5 Ci was deposited directly on water impoundments and 1.2 Ci was deposited within the boundaries of the SRS. Atmospheric plutonium releases from SRS operations, including unidentified alpha, have totaled about 3.8 Ci, and direct releases to streams have totaled 0.6 Ci. About 90% of the liquid releases containing plutonium and unidentified alpha has been released from F-Area and H-Areas into the Four Mile Creek watershed. For this reason, this stream has received more study. An examination of 238Pu/239,240Pu ratios in sediments (Table 12.1-3) collected from Site streams shows that Four Mile Creek has an elevated ratio, indicating that the source of plutonium in this stream is plutonium effluent from Site operations (Alberts et al. 1986). Steel Creek, which received cooling water from L- and P-Reactors, and Pen Branch, which received cooling water from K-Reactor, also showed elevated 238Pu/239,240Pu ratios in sediments. Upper Three Runs and Lower Three Runs show ratios similar to that of the Savannah River upstream of the SRS, indicating little contribution from Site operations. The isotopic ratios do not indicate whether the source of the plutonium is from atmospheric or liquid releases; however, it is most likely that the source of plutonium in Four Mile Creek is liquid effluent.
Table 12.1-3. Sediment Sample Plutonium Isotopic Ratiosa
Sampling location 238Pu/239,240Pu Upper Three Runs (Treadway Bridge) 0.141 Four Mile Creek (Road A) 3.29 Steel Creek (Road A) 2.64 Pen Branch (Road A) 1.84 Lower Three Runs (Road S-3-17 0.167 Savannah River (Jackson) 0.189 a Source: Alberts et al. (1986).
Tables 12.1-4 and 12.1-5 present a summary of routine monitoring for plutonium in stream
sediments from 1977 through 1986. Previous data (1955 through 1962) are not presented because the sampling and analysis design for that period is not comparable to the design used since 1977. The swamp locations represent discharge areas for the streams. The data shown indicate no spatial or temporal trends. Many of the results are near or below the detection limit. Only concentrations measured at Four Mile Creek at Road A are consistently above the detection limit. Thus, it appears from routine measurements that, in general, plutonium releases from the SRS were small, are subject to various deposition processes, and result in concentrations in sediments that are, with a few exceptions, indistinguishable from background concentrations. In addition, the samples collected are probably not representative of the entire streambed making temporal and spatial trend analysis improbable. Concentrations in sediment of the Savannah River collected above the SRS during the same time period ranged from 0.0001 to 0.008 pCi g−1.

Evaluation of Materials Released from SRS Radionuclides in Sediments
12.1-11
Table 12.1-4. Concentration of Plutonium (pCi g−1) in Sediments
at Stream Locations at the SRS (1977 through 1991)
Year Four Mile Creek at
Road A7 Steel Creek at
Road B Steel Creek-Pen Branch Mouth
238Pu 1977 1.17 0.016 <0.001 1978 0.39 0.04 <0.003 1979 0.2 0.053 0.002 1980 0.31 0.017 <.001 1981 .008 0.043 0.002 1982 NAa NA NA 1983 0.3 0.05 0.003 1984 0.2 0.006 0.0006 1985 1.3 0.006 0.0004 1986 0.36 0.0008 0.0008 1987 0.074 0.043 0.05 1988 0.4 0.009 0.035 1989 0.02 0.021 0.049 1990 0.78 0.09 0.05 1991 0.078 0.0015 0.013
239,240Pu 1977 0.97 0.007 0.001 1978 0.29 0.03 <0.003 1979 0.074 0.044 0.004 1980 0.092 0.001 <0.001 1981 0.004 0.039 0.001 1982 NA NA NA 1983 0.11 0.15 0.002 1984 0.07 0.007 0.003 1985 0.38 0.008 0.0008 1986 0.016 0.004 0.002 1987 0.046 0.046 0.04 1988 0.15 0.012 0.036 1989 0.054 0.093 0.014 1990 0.23 0.007 0.004 1991 0.032 0.0043 0.026 a NA = No analysis.
Risk Assessment Corporation “Setting the standard in environmental health”

12.1-12 The Savannah River Site Dose Reconstruction ProjectPhase II: Source Term Calculation and Ingestion Pathway Data Retrieval
Table 12.1-5. Concentration of Plutonium (pCi g−1) in Sediments at Stream
Discharge Locations at the SRS (1977 through 1991)
Year Upper Three Runs Mouth
Four Mile Creek Swamp
Pen Branch Swamp
Steel Creek Swamp
Lower Three Runs Mouth
238Pu 1977 0.003 0.24 0.003 0.132 0.007 1978 0.006 0.12 0.02 0.09 0.04 1979 <0.001 0.02 0.022 0.006 0.001 1980 0.004 0.085 0.02 0.004 0.002 1981 0.001 0.003 <0.001 NAa 0.001 1982 NA NA NA NA NA 1983 0.002 0.08 0.003 0.03 0.005 1984 0.004 0.003 0.005 0.01 0.0005 1985 0.0003 0.006 0.019 0.2 0.0007 1986 0.003 0.002 0.0002 0.022 0.0005 1987 <0.003 0.003 0.024 0.012 0.02 1988 0.034 0.007 0.021 0.079 0.264 1989 0.061 0.015 0.07 0.005 <MDb 1990 0.006 0.007 0.02 0.002 0.04 1991 0.0052 0.0019 0.01 0.0029 0.0011
239,240Pu 1977 0.014 0.092 0.004 0.04 0.011 1978 0.02 0.07 0.04 0.05 0.04 1979 <0.001 0.012 0.021 0.046 0.003 1980 0.029 0.035 0.044 <0.001 0.008 1981 0.004 0.002 <0.001 NA 0.003 1982 NA NA NA NA NA 1983 0.007 0.11 0.02 0.04 0.001 1984 0.002 0.002 0.008 0.01 0.002 1985 0.001 0.006 0.032 0.12 0.001 1986 0.009 0.001 0.0004 0.015 0.0012 1987 0.012 0.002 0.018 0.01 0.02 1988 0.052 0.007 0.024 0.18 0.014 1989 0.02 0.006 0.019 0.003 <MDb 1990 0.007 0.003 0.002 0.0002 0.001 1991 0.0065 0.003 0.028 0.0071 0.0017 a NA = No analysis. b <MD = Less than minimum detectable concentration.

Evaluation of Materials Released from SRS Radionuclides in Sediments
12.1-13
Measurements of Gamma-Emitting and Other Radionuclides in Sediments
Stream and river samples collected routinely after 1975 were analyzed for gamma-emitting radionuclides and 90Sr. Concentrations in river sediments were within the range typically detected from worldwide fallout. However, concentrations of 137Cs often reflected contributions from Site releases, particularly along Four Mile Creek. However, no temporal or spatial trends were observed because of the complex sediment deposition processes involved and the fact that samples are probably not representative of the entire streambed.
ELECTRONICALLY COMPILED SEDIMENT DATA
Sediment sampling data were reported beginning in 1951 for at the inner and outer perimeter
of the SRS along streams and the Savannah River. Samples were analyzed for gross alpha and gross beta activities. Later, samples were analyzed for specific radionuclides. The long-lived radionuclides, especially uranium and plutonium, are of particular interest to the dose reconstruction because they persist in sediments over long periods of time.
The various data summarized in this chapter are electronically compiled in a Microsoft Excel workbook. This workbook contains the figures depicted in this chapter as well as the tabulated data that were used to produce the figures. In the workbook, each figure is represented in a chart. There is a separate worksheet that contains the tabulated data for each chart, or in some cases, for each group of charts. The following hyperlink allows readers of the electronic version of this document to directly access the workbook described above if the source application (Microsoft Excel) is installed on the reader’s computer: Ch12-Figure_data.xls.
USEFULNESS AND LIMITATIONS OF THE SEDIMENT DATA FOR DOSE
RECONSTRUCTION There are a number of factors that impact how the sediment data may be used during subsequent phases of the dose reconstruction project. These factors include the availability of sufficient original monitoring data sets to verify reported summary data and to evaluate spatial and temporal trends, as well as the ability to distinguish between Site releases of contaminants and other sources of the same contaminants in the environment (i.e., establish appropriate background concentrations). Based on the information provided in the semiannual monitoring reports, it appears that surface water and sediment monitoring before 1958 was limited primarily to gross analyses. Because fallout was relatively high during this time period, nonvolatile beta data, especially for the Savannah River where concentrations were low, may be of limited value (i.e., SRS contributions may be masked by the presence of fallout). The majority of alpha activity released via surface water effluents from the Site occurred from the M-Area. Essentially all of the alpha activity in the process effluent in the M-Area has been identified as depleted uranium. Steed’s Pond received surface water from Tim’s Branch, which received effluent from the M-Area. Thus, the sediment cores collected from Steed’s Pond in 1967, 1981, and 1984 may provide uranium data useful for source term verification or model
Risk Assessment Corporation “Setting the standard in environmental health”

12.1-14 The Savannah River Site Dose Reconstruction ProjectPhase II: Source Term Calculation and Ingestion Pathway Data Retrieval
validation. The small number of samples collected limits the usefulness of the data and may be insufficient to estimate the total activity of uranium in the pond. Plutonium is a radioactive material that is typically of great concern to the public. However, the SRS did not conduct routine plutonium monitoring in surface water in the 1950s, 1960s, or 1970s. Uranium or plutonium alpha measurements were made in surface water from roughly 1954 to 1957. Also in the 1950s and 1960s, sediments from some of the Site streams and the river were analyzed for uranium/plutonium alpha. Routine plutonium measurements were initiated in Savannah River sediments in 1975. However, the sampling method as explained in Ashley and Zeigler (1978) and described above would not provide insight into historical releases of plutonium. As noted previously, routine sediment samples are probably unrepresentative of the entire streambed. The data may only be useful in that they confirm the sources of plutonium in specific streambeds. Routine 137Cs measurements are, like those of plutonium, probably only useful for confirming the sources of the 137Cs in specific streambeds. In general, sediment sampling variability arises from the nature of the sample, the adequacy of the sampling population in representing the total population, and the bias resulting from the methods of sampling and analysis. The variations because of the heterogeneity of the sampled material (e.g., differing amounts of solid and suspended materials) frequently exceed the deviations that result from the analytical method. Characterizing variability because of sample heterogeneity and sampling methodology is extremely difficult, and it was not assessed as part of the historical SRS environmental monitoring program. Statistically speaking, increasing the number of samples collected can serve to increase the confidence that one has in the data, as the mean and range of values are generally better defined. As discussed previously, the number and locations of samples collected do not provide enough information to adequately characterize the streambeds at the SRS. At best, the data can serve to confirm that specific radionuclides were released into the streams and the Savannah River.
Evaluation of Materials Released from SRS Radionuclides in Sediments
12.1-15
REFERENCES
Albenesius, E.L. 1954. Health Physics Site Survey Data, January to July 1953. DPSPU-54-11-12. Works Technical Department Data Record. SRS Phase II Database MJC199312103. April.
Alberts, J.J., J.E. Halverson, and K.A. Orlandini. 1986. “The Distribution of Plutonium, Americium and Curium Isotopes in Pond and Stream Sediments of the Savannah River Plant, South Carolina, USA.” Journal of Environmental Radioactivity 3: 249–271.
Alexander, J.M. and J.H. Horton. 1956. Semiannual Progress Report, January through June 1955. DPSP-56-25-13. SRS Phase II Database MJC199312106. April 5.
Ashley, C. and C.C. Zeigler. 1976. Environmental Monitoring at the Savannah River Plant Annual Report-1975. DPSPU-76-302. SRS Phase II Database LWB1994021824.
Ashley, C. and C.C. Zeigler. 1977. Environmental Monitoring at the Savannah River Plant Annual Report-1976. DPSPU-77-302. SRS Phase II Database LWB199403212.
Ashley, C. and C.C. Zeigler. 1978. Environmental Monitoring at the Savannah River Plant Annual Report-1977. DPSPU-78-302. SRS Phase II Database LWB199403211.
Ashley, C. and C.C. Zeigler. 1979. Environmental Monitoring at the Savannah River Plant Annual Report-1978. DPSPU-79-302. SRS Phase II Database MJC1994051717.
Ashley, C. and C.C. Zeigler. 1982. Environmental Monitoring in the Vicinity of the Savannah River Plant. Annual Report, 1981. DPSPU-82-30-1. SRS Phase II Database MJC199405179.
Carlton, W.H., A.G. Evans, L.A. Geary, C.E. Murphy, Jr., J.E. Pinder, and R.N. Strom. 1992. Assessment of Plutonium in the Savannah River Site Environment. WSRC-RP-92-879 (Rev 1). SRS Phase II Database MJC199405138. December 1.
Du Pont. 1959. Health Physics Regional Monitoring Semiannual Report, January through June 1959. DPSPU-59-11-30. SRS Phase II Database MJC1993121014. November.
Du Pont. 1960. Health Physics Regional Monitoring Semiannual Report, July through December 1959. DPSP-60-11-9. SRS Phase II Database MJC1993121015. June.
Evans, A.G., L.R. Bauer, J.S. Haselow, D.W. Hayes, H.L. Martin, W.L. McDowell, and J.B. Pickett. 1992. Uranium in the Savannah River Site Environment. WSRC-RP-92-315. SRS Phase II Database MJC199405137. December 1.
Harvey, R.S., J.H. Horton, and H.G. Mealing, Jr. 1959a. Health Physics Regional Monitoring Semiannual Report, January through June 1958. DPSP-58-25-38. SRS Phase II Database MJC1993121012. January 9.
Risk Assessment Corporation “Setting the standard in environmental health”
Harvey, R.S., J.H. Horton, and H.G. Mealing, Jr. 1959b. Health Physics Regional Monitoring Semiannual Report, July through December 1958. DPSPU-59-11-23. SRS Phase II Database MJC1993121013. August.

12.1-16 The Savannah River Site Dose Reconstruction ProjectPhase II: Source Term Calculation and Ingestion Pathway Data Retrieval
Horton, J.H. 1954. Radioactivity in the Environs of the Savannah River Plant, January to July
1954. DP-92. SRS Phase II Database MJC199312104. November.
Horton, J.H. 1955. Semi-Annual Progress Report, July through December 1954. DPSP-55-25-34. SRS Phase II Database MJC199312105. September.
Horton, J.H. and H.G. Mealing, Jr. 1956. Health Physics Regional Monitoring Semi-Annual Report, July through December 1955. DPSP-56-25-54. SRS Phase II Database MJC199312107. October 26.
Johnson, J.E. 1963. Memo to W.L. Marter. Subject: Regional Monitoring Program Review. SRS Phase II Database SKR199402021. December 13.
Marter, W.L. and A.R. Boulogne. 1961. Memo to W.C. Reinig. Subject: A Review of the Environmental Monitoring Program, Part I. SRS Phase II Database SKR1994020138. July 14.
Mealing, H.G., Jr., R.S. Harvey, and J.H. Horton. 1958. Health Physics Regional Monitoring Semiannual Report, July through December 1957. DPSP-58-25-17. SRS Phase II Database MJC1993121011. July 15.
Reinig, W.C. 1952. Health Physics Department Site Survey Report for 1951. HP-521. SRS Phase II Database MJC199312102. August 18.
Reinig, W.C., R.E. Gosline, E.L. Albenesius, and R.C. Williams. 1953. Natural Radioactive Contents of the Savannah River. DP-27. Health Physics Section, Savannah River Plant. SRS Phase II Database MJC199312101. May 1.
Zeigler, C.C., I.B. Lawrimore, E.M. Heath, and J.E. Till. 1986. Savannah River Plant Environmental Report for 1985. DPSPU-86-30-1. SRS Phase II Database EIW1993082022.