chapter 13: mining electronic health records in the...
TRANSCRIPT

Education
Chapter 13: Mining Electronic Health Records in theGenomics EraJoshua C. Denny*
Departments of Biomedical Informatics and Medicine, Vanderbilt University School of Medicine, Nashville, Tennessee, United States of America
Abstract: The combination of im-proved genomic analysis methods,decreasing genotyping costs, andincreasing computing resources hasled to an explosion of clinical geno-mic knowledge in the last decade.Similarly, healthcare systems are in-creasingly adopting robust electronichealth record (EHR) systems that notonly can improve health care, but alsocontain a vast repository of diseaseand treatment data that could bemined for genomic research. Indeed,institutions are creating EHR-linkedDNA biobanks to enable genomicand pharmacogenomic research, us-ing EHR data for phenotypic informa-tion. However, EHRs are designedprimarily for clinical care, not research,so reuse of clinical EHR data forresearch purposes can be challeng-ing. Difficulties in use of EHR datainclude: data availability, missing data,incorrect data, and vast quantities ofunstructured narrative text data.Structured information includes bill-ing codes, most laboratory reports,and other variables such as physio-logic measurements and demograph-ic information. Significant informa-tion, however, remains locked withinEHR narrative text documents, includ-ing clinical notes and certain catego-ries of test results, such as pathologyand radiology reports. For relativelyrare observations, combinations ofsimple free-text searches and billingcodes may prove adequate whenfollowed by manual chart review.However, to extract the large cohortsnecessary for genome-wide associa-tion studies, natural language pro-cessing methods to process narrativetext data may be needed. Combina-tions of structured and unstructuredtextual data can be mined to gener-ate high-validity collections of casesand controls for a given condition.Once high-quality cases and controlsare identified, EHR-derived cases canbe used for genomic discovery andvalidation. Since EHR data includes abroad sampling of clinically-rele-vant phenotypic information, it may
enable multiple genomic investiga-tions upon a single set of genotypedindividuals. This chapter reviews sev-eral examples of phenotype extrac-tion and their application to geneticresearch, demonstrating a viable fu-ture for genomic discovery usingEHR-linked data.
This article is part of the ‘‘Transla-
tional Bioinformatics’’ collection for
PLOS Computational Biology.
1. Introduction and Motivation
Typical genetic research studies have
used purpose-built cohorts or observation-
al studies for genetic research. As of 2012,
more than 1000 genome-wide association
analyses have been performed, not to
mention a vast quantity of candidate gene
studies [1]. Many of these studies have
investigated multiple disease and pheno-
typic traits within a single patient cohort,
such as the Wellcome Trust [2] and
Framingham research cohorts [3–5]. Typ-
ically, patient questionnaires and/or re-
search staff are used to ascertain pheno-
typic traits for a patient. While these study
designs may offer high validity and
repeatability in their assessment of a given
trait, these models are typically very costly
and often represent only a cross-section of
time. In addition, rare diseases may take a
significant time to accrue in these datasets.
Another model that is gaining accep-
tance is genetic discovery based solely or
partially from phenotype information de-
rived solely from the electronic health
record (EHR) [6]. In these models, a
hospital collects DNA for research, and
maintains a linkage between the DNA
sample and the EHR data for that patient.
The primary source of phenotypic infor-
mation, therefore, is the EHR. Depending
on the design of the biobank model, some
EHR-linked biobanks have the ability to
supplement EHR-accrued data with pur-
pose-collected research data.
The EHR model for genetic research
offers several key advantages, but also faces
prominent challenges to successful imple-
mentation. A primary advantage is cost.
EHRs contain a longitudinal record of robust
clinical data that is produced as a byproduct
of routine clinical care. Thus, it is a rich, real-
world dataset that requires little additional
funding to obtain. Both study designs share
costs for obtaining and storing DNA.
Another advantage of EHR-linked
DNA databanks is the potential to reuse
genetic information to investigate a broad
range of additional phenotypes beyond the
original study. This is particularly true for
dense genetic data such as generated
through genome-wide association studies
or large-scale sequencing data. For in-
stance, a patient may be genotyped once
as part of a study on diabetes, and then
later participate in another analysis for
cardiovascular disease.
Major efforts in EHR DNA biobanking
are underway at a number of institutions.
One of the major driving forces has been
the National Human Genome Research
Institute (NHGRI)-sponsored Electronic
Medical Records and Genomics
(eMERGE) network [7], which began in
Citation: Denny JC (2012) Chapter 13: Mining Electronic Health Records in the Genomics Era. PLoS ComputBiol 8(12): e1002823. doi:10.1371/journal.pcbi.1002823
Editors: Fran Lewitter, Whitehead Institute, United States of America and Maricel Kann, University of Maryland,Baltimore County, United States of America
Published December , 2012
Copyright: � 2012 Joshua C. Denny. This is an open-access article distributed under the terms of theCreative Commons Attribution License, which permits unrestricted use, distribution, and reproduction in anymedium, provided the original author and source are credited.
Funding: This article was supported in part by grants from the National Library of Medicine R01 LM 010685and the National Human Genome Research Institute U01 HG004603. The funders had no role in the preparationof the manuscript.
Competing Interests: The author has declared that no competing interests exist.
* E-mail: [email protected]
PLOS Computational Biology | www.ploscompbiol.org 1 December 2012 | Volume 8 | Issue 12 | e1002823
27

2007 and, as of 2012, consists of nine sites
that are performing genome-wide association
studies using phenotypic data derived from
EHR. The National Institutes of Health
(NIH)-sponsored Pharmacogenomics Re-
search Network (PGRN) also include sites
performing genetic research using EHR data
as their source of phenotypic data. Another
example is the Kaiser Permanente Research
Program on Genes, Environment and
Health, which has genotyped 100,000 mem-
bers with linked EHR data [8].
2. Classes of Data Available inEHRs
EHRs are designed primarily to support
clinical care, billing, and, increasingly,
other functions such as quality improve-
ment initiatives aimed at improving the
health of a population. Thus, the types of
data and their methods of storing this data
are optimized to support these missions.
The primary types of information avail-
able from EHRs are: billing data, labora-
tory results and vital signs, provider
documentation, documentation from re-
ports and tests, and medication records.
Billing data and many laboratory results
are available in most systems as structured
‘‘name-value pair’’ data. Clinical docu-
mentation, many test results (such as
echocardiograms and radiology testing),
and medication records are often found in
narrative or semi-narrative text formats.
Researchers creating ‘‘electronic pheno-
type algorithms’’ (discussed in Section 6.2)
typically utilize multiple types of informat-
ics (e.g., billing codes, laboratory results,
medication data, and/or NLP) to achieve
high accuracy when identifying cases and
controls from the EHR.
Table 1 summarizes the types of data
available in the EHR and their strengths
and weaknesses.
2.1 Billing DataBilling data typically consists of codes
derived from the International Classifica-
tion of Diseases (ICD) and Current
Procedural Terminology (CPT). ICD is a
hierarchical terminology of diseases, signs,
symptoms, and procedure codes main-
tained by the World Health Organization
(WHO). While the majority of the world
uses ICD version 10, the United States (as
of 2012) uses ICD version 9-CM; the
current Center for Medicare and Medi-
caid Services guidelines mandate a transi-
tion to ICD-10-CM in the United States
by October 1, 2014. Because of their
widespread use as required components
for billing, and due to their ubiquity within
EHR systems, billing codes are frequently
used for research purposes [9–14]. Prior
research has demonstrated that such
administrative data can have poor sensi-
tivity and specificity [15,16]. Despite this,
they remain an important part of more
complex phenotype algorithms that
achieve high performance [17–19].
CPT codes are created and maintained
by the American Medical Association.
They serve as the chief coding system
providers use to bill for clinical services.
Typically, CPTs are paired with ICD
codes, the latter providing the reason
(e.g., a disease or symptom) for a clinical
encounter or procedure. This satisfies the
requirements of insurers, who require
certain allowable diagnoses and symptoms
to pay for a given procedure. For example,
insurance companies will pay for a brain
magnetic resonance imaging (MRI) scan
that is ordered for a number of complaints
(such as known cancers or symptoms such
as headache), but not for unrelated
symptoms such as chest pain.
Within the context of establishing a
particular diagnosis from EHR data, CPT
codes tend to have high specificity but low
sensitivity, while ICD9 codes have com-
paratively lower specificity but higher
sensitivity. For instance, to establish the
diagnosis of coronary artery disease, one
could look for a CPT code for ‘‘coronary
artery bypass surgery’’ or ‘‘percutaneous
coronary angioplasty’’ disease, or for one
of several ICD9 codes. If the CPT code is
present, there is a high probability that the
patient has corresponding diagnosis of
coronary disease. However, many patients
without these CPT codes also have
coronary disease, but either have not
received these interventions or received
them at a different hospital. In contrast, a
clinician may bill an ICD9 code for
coronary disease based on clinical suspi-
cion without a firm diagnosis. Figure 1
shows the results of a study that compared
the use of natural language processing
(NLP) and CPT codes to detect patients
who have received colorectal cancer
screening, via a colonoscopy within the
last ten years, at one institution. In this
study, only 61% (106 out of 174 total) of
the documented completed colonoscopies
were found via CPT codes [20]. The most
common cause of false negatives was a
colonoscopy completed at another hospi-
tal. CPT codes, however, had a very high
precision (i.e., positive predictive value; see
Box 1), with only one false positive.
2.2 Laboratory and Vital SignsLaboratory data and vital signs form a
longitudinal record of mostly structured
data in the medical record. In addition to
being stored as name-value pair data,
these fields and values can be encoded
using standard terminologies. The most
common controlled vocabulary used to
represent laboratory tests and vital signs is
the Logical Observation Identifiers Names
and Codes (LOINCH), which is a Consol-
idated Health Informatics standard for
representation of laboratory and test
names and is part of Health Language 7
(HL7) [21,22]. Despite the growing use of
LOINC, many (perhaps most) hospital lab
systems still use local dictionaries to
encode laboratory results internally. Hos-
pital laboratory systems or testing compa-
nies may change over time, resulting in
different internal codes for the same test
result. Thus, care is needed to implement
selection logic based on laboratory results.
Indeed, a 2009–2010 data standardization
effort at Vanderbilt University Medical
Center found that the concept of ‘‘weight’’
and ‘‘height’’ each had more than five
internal representations. Weights and
heights were also recorded by different
systems using different field names and
stored internally with different units (e.g.,
kilograms, grams, and pounds for weight;
What to Learn in This Chapter
N Describe the types of information available in Electronic Health Records (EHRs),and the relative sensitivity and positive predictive value of each
N Describe the difference between unstructured and structured information inthe EHR
N Describe methods for developing accurate phenotype algorithms that integratestructured and unstructured EHR information, and the roles played by billingcodes, laboratory values, medication data, and natural language processing
N Describe recent uses of EHR-derived phenotypes to study genome-phenomerelationships
N Describe the cost advantages unique to EHR-linked biobanks, and the ability toreuse genetic data for many studies
N Understand the role of EHRs to enable phenome-wide association studies ofgenetic variants
PLOS Computational Biology | www.ploscompbiol.org 2 December 2012 | Volume 8 | Issue 12 | e1002823

Table 1. Strengths and weakness of data classes within EHRs.
ICD codes CPT codes Laboratory Data Medication records Clinical Documentation
Availability in EHRsystems
Near-universal Near-universal Near-universal Variable Variable
Recall Medium Poor Medium Inpatient: HighOutpatient: Variable
Medium
Precision Medium High High Inpatient: HighOutpatient: Variable
Medium-High
Fragmentation effect Medium High Medium-High Medium Low-Medium
Query method Structured Structured Mostly structured Structured, textqueries, and NLP
NLP, text queries, andrarely structured
Strengths -Easy to query-Serves as a good firstpass of disease status
-Easy to query-High precision
-Value depends ontest-High data validity
Can have high validity Best record of whatproviders thought
Weaknesses -Disease codes oftenused for screeningwhen disease not actually present-Accuracy hindered bybilling realities and clinicworkflow
-Most susceptible tomissing data errors(e.g., performed atanother hospital)-Procedure receiptinfluenced by patientand payer factorsexternal to diseaseprocess
-May need toaggregate differentvariations of thesame data elements-Normal ranges andunits may changeover time
-Often need to interfaceinpatient and outpatientrecords-Medication records fromoutside providers notpresent-Medications prescribednot necessary taken
-Difficult to processautomatically-Interpretation accuracydepends on assessmentmethod-May suffer fromsignificant‘‘cut and paste’’-Not universallyavailable in EHRs-May beself-contradictory
Summary Essential first element forelectronic phenotyping
Helpful addition ifrelevant
Helpful addition ifrelevant
Useful for confirmationand a marker of severity
Useful for confirmingcommon diagnosesor for finding rare ones
doi:10.1371/journal.pcbi.1002823.t001
Figure 1. Comparison of natural language processing (NLP) and CPT codes to detect completed colonoscopies in 200 patients. Inthis study, more completed colonoscopies were found via NLP than with billing codes alone, and only one colonoscopy was found with billing codesthat was not found with NLP. NLP examples were reviewed for accuracy.doi:10.1371/journal.pcbi.1002823.g001
PLOS Computational Biology | www.ploscompbiol.org 3 December 2012 | Volume 8 | Issue 12 | e1002823

centimeters, meters, inches, and feet for
height).
Structured laboratory results are often
a very important component of pheno-
type algorithms, and can represent tar-
gets for genomic investigation [3,4,23].
An algorithm to identify type 2 diabetes
(T2D) cases and controls, for instance,
used laboratory values (e.g., hemoglobin
A1c and glucose values) combined with
billing codes and medication mentions
[17]. Similarly, an algorithm to deter-
mine genomic determinants of normal
cardiac conduction required normal
electrolyte (potassium, calcium, and
magnesium) values [16]. In these set-
tings, investigation of the determinants of
the values requires careful selection of
the value to be investigated. For instance,
an analysis of determinants of uric acid
or red blood cell indices would exclude
patients treated with certain antineoplas-
tic agents (which can increase uric acid
or suppression of erythrocyte produc-
tion), and, similarly, an analysis of white
blood cell indices also excludes patients
with active infections and certain medi-
cations at the time of the laboratory
measurement.
2.3 Provider DocumentationClinical documentation represents per-
haps the richest and most diverse source of
phenotype information. Provider docu-
mentation is required for nearly all billing
of tests and clinical visits, and is frequently
found in EHR systems. To be useful for
phenotyping efforts, clinical documenta-
tion must be in the form of electronically-
available text that can be used for
subsequent manual review, text searches,
or NLP. They can be created via
computer-based documentation (CBD)
systems or dictated and transcribed. The
most common form of computable text is
in unstructured narrative text documents,
although a number of developers have
also created structured documentation
tools [24]. Narrative text documents can
be processed by text queries or by NLP
systems, as discussed in the following
section.
For some phenotypes, crucial docu-
ments may only be available as hand-
written documents, and thus not amenable
to text searching or NLP. Unavailability
may result from clinics that are slow
adopters, have very high patient volumes,
or have specific workflows not well ac-
commodated by the EHR system [25].
However, these hand-written documents
may be available electronically as scanned
copies. Recent efforts have shown that
intelligent character recognition (ICR)
software may be useful for processing
scanned documents containing hand-writ-
ten fields (Figure 2) [26,27]. This task can
be challenging, however, and works best
when the providers are completing pre-
formatted forms.
2.4 Documentation from Reportsand Tests
Provider-generated reports and test
results include radiology and pathology
reports and some procedure results such as
echocardiograms. They are often in the
form of narrative text results. Many of
these contain a mixture of structured and
unstructured results. Examples include an
electrocardiogram report, which typically
has structured interval durations and may
contain a structured field indicating
whether the test was abnormal or not.
However, most electrocardiogram (ECG)
reports also contain a narrative text
‘‘impression’’ representing the cardiolo-
gist’s interpretation of the result (e.g.,
‘‘consider anterolateral myocardial ische-
mia’’ or ‘‘Since last ECG, patient has
developed atrial fibrillation’’) [28]. For
ECGs, the structured content (e.g., the
intervals measured on the ECG) are
generated using automated algorithms
and have varying accuracy [29].
2.5 Medication RecordsMedication records serve an important
role in accurate phenotype characteriza-
tion. They can be used to increase the
precision of case identification, and to help
ensure that patients believed to be controls
do not actually have the disease. Medica-
tions received by a patient serve as
confirmation that the treating physician
believed the disease was present to a
sufficient degree that they prescribed a
treating medication. It is particularly
helpful to find presence or absence of
medications highly specific or sensitive for
the disease. For instance, a patient with
diabetes will receive either oral or inject-
able hypoglycemic agents; these medica-
tions are both highly sensitive and specific
for treating diabetes, and can also be used
to help differentiate type I diabetes
(treated almost exclusively with insulin)
from T2D (which is typically a disease of
insulin resistance and thus can be treated
with a combination of oral and injectable
hypoglycemic agents).
Medication records can be in varying
forms within an electronic record. With
the increased use of computerized provid-
er order entry (CPOE) systems to manage
hospital stays, inpatient medication rec-
ords are often available in highly struc-
tured records that may be mapped to
controlled vocabularies. In addition, many
hospital systems are installing automated
bar-code medication administration rec-
ords by which hospital staff record each
individual drug administration for each
patient [30]. With this information, accu-
rate drug exposures and their times can be
Box 1. Metrics Commonly Used to Evaluate Phenotype SelectionAlgorithms
Sensitivity Recallð Þ~ True Positives
Gold standard positives
Specificity~True Negatives
Gold standard negatives
Positive Predictive Value PPV ,Precisionð Þ~ True Positives
True PositiveszFalse Positives
Negative Predictive Value NPVð Þ~ True Negatives
True NegativeszFalse Negatives
F{measure~2|Recall|Precision
RecallzPrecision
PLOS Computational Biology | www.ploscompbiol.org 4 December 2012 | Volume 8 | Issue 12 | e1002823

constructed for each inpatient. Even
without electronic medication administra-
tion records (such as bar-code systems),
research has shown that CPOE-ordered
medications are given with fairly high
reliability [31].
Outpatient medication records are often
recorded via narrative text entries within
clinical documentation, patient problem
lists, or communications with patients
through telephone calls or patient portals.
Many EHR systems have incorporated
outpatient prescribing systems, which cre-
ate structured medical records during
generation of new prescriptions and
refills. However, within many EHR
systems, electronic prescribing tools are
optional, not yet widely adopted, or have
only been used within recent history.
Thus, accurate construction of a patient’s
medication exposure history often re-
quires NLP techniques. For specific algo-
rithms, focused free-text searching for a
set of medications can be efficient and
effective [17]. This approach requires the
researcher to generate the list of brand
names, generics, combination medica-
tions, and abbreviations that would be
used, but has the advantage that it can be
easily accomplished using relational data-
base queries. The downside is that this
approach requires re-engineering for each
medication or set of medications to be
searched, and does not allow for the
retrieval of other medication data, such as
dose, frequency, and duration. A more
general-purpose approach can be
achieved with NLP, which is discussed
in greater detail in Section 3 below.
3. Natural Language Processingto Support Clinical KnowledgeExtraction
Although many documentation tools
include structured and semi-structured
elements, the vast majority of computer
based documentation (CBD) remains in
‘‘natural language’’ narrative formats [24].
Thus, to be useful for data mining,
narrative data must be processed through
use of text-searching (e.g., keyword search-
ing) or NLP systems. Keyword searching
can effectively identify rare physical exam
findings in text [32], and extension to use
of regular expression pattern matching has
been used to extract blood pressure
readings [33]. NLP computer algorithms
scan and parse unstructured ‘‘free-text’’
documents, applying syntactic and seman-
tic rules to extract structured representa-
tions of the information content, such as
concepts recognized from a controlled
terminology [34–37]. Early NLP efforts
to extract medical concepts from clinical
text documents focused on coding in the
Systematic Nomenclature of Pathology or
the ICD for financial and billing purposes
[38], while more recent efforts often use
complete versions of the Unified Medical
Language System (UMLS) [39–41],
SNOMED-CT [16], and/or domain-spe-
cific vocabularies such as RxNorm for
medication extraction [42]. NLP systems
utilize varying approaches to ‘‘understand-
ing text,’’ including rule-based and statis-
tical approaches using syntactic and/or
semantic information. Natural language
Figure 2. Use of Intelligent Character Recognition to codify handwriting. Figure courtesy of Luke Rasmussen, Northwestern University.doi:10.1371/journal.pcbi.1002823.g002
PLOS Computational Biology | www.ploscompbiol.org 5 December 2012 | Volume 8 | Issue 12 | e1002823
processors can achieve classification rates
similar to those of manual reviewers, and
can be superior to keyword searches. A
number of researchers have demonstrated
the effectiveness of NLP for large-scale
text-processing tasks. Melton and Hripc-
sak used MedLEE to recognize instances
of adverse events in hospital discharge
summaries [43]. Friedman and colleagues
evaluated NLP for pharmacovigilance to
discover adverse drug events from clinical
records by using statistical methods that
associate extracted UMLS disease con-
cepts with extracted medication names
[40]. These studies show the potential
for NLP to aid in specific phenotype
recognition.
Using either NLP systems or keyword
searching, the primary task in identifying a
particular phenotype is to filter out
concepts (or keywords) within a corpus of
documents that indicate statements other
than the patient having the disease.
Researchers may desire to specify partic-
ular document types (e.g., documents
within a given domain, problem lists,
etc.) or particular types of visits or
specialists (e.g., requiring a visit with an
ophthalmologist). Some common NLP
tasks needed in phenotype classification
include identifying family medical history
context and negated terms (e.g., ‘‘no
cardiac disease’’), and removing drug
allergies when searching for patients
taking a certain medication. Recognition
of sections within documents can be
handled using structured section labels,
specialized NLP systems such as SecTag
[44], or more general-purpose NLP sys-
tems such as MedLEE [45] or HITEX
[46]. A number of solutions have been
proposed for negation detection; among
the more widespread are adaptations of
the NegEx algorithm developed by Chap-
man et al., which uses a series of negation
phrases and boundary words to identify
negated text [47]. NegEx or similar
algorithms can be used as a standalone
system or be integrated within a number
of general-purpose NLP systems including
MedLEE [48], the KnowledgeMap con-
cept identifier [49], cTAKES [50], and the
National Library of Medicine’s MetaMap
[51].
Medication information extraction is
an important area for clinical applica-
tions that benefits from specialized NLP
tools. Most general-purpose NLP systems
will recognize medications by the medi-
cation ingredient mentioned in the text
but may not identify the relevant medi-
cation metadata such as dose, frequency,
and route. In addition, a general purpose
NLP system using as its vocabulary the
UMLS will likely recognize ‘‘atenolol’’
and ‘‘Tenormin’’ (a United States brand
name for atenolol) as two different
concepts, since each is represented by
separate concepts in the UMLS. Medi-
cation-specific NLP systems focus on
extracting such metadata for a medica-
tion. Sirohl and Peissig applied a com-
mercial medication NLP system to de-
rived structured medication information
[52], which was later linked to laboratory
data and used to explore the pharmaco-
dynamics of statin efficacy (a cholesterol-
lowering medication) [53]. Xu et al.
developed a similar system at Vanderbilt
called MedEx, which had recall and
precision $0.90 for discharge summaries
and clinic notes on Vanderbilt clinical
documents [42]. Additionally, the 2009
i2b2 NLP challenge focused on medica-
tion extraction using de-identified dis-
charge summaries from Partners Health-
care, and 20 teams competed to identify
medications and their signatures. The
best systems achieved F-measures $0.80
[54]. Much work remains to be done in
this area, as extraction of both medica-
tion names and associated signature
information can be challenging when
considering the full breadth of clinical
documentation formats available, includ-
ing provider-staff and provider-patient
communications, which often contain less
formal and misspelled representations of
prescribed medications.
For more information on NLP methods
and applications, please see the article on
text mining elsewhere in this collection
(submitted).
4. EHR-Associated Biobanks:Enabling EHR-Based GenomicScience
DNA biobanks associated with EHR
systems can be composed of either ‘‘all
comers’’ or a focused collection, and
pursue either a conventional consented
‘‘opt-in’’ or an ‘‘opt-out’’ approach. Cur-
rently, the majority of DNA biobanks
have an opt-in approach that selects
patients for particular research studies.
Two population-based models in the
eMERGE network are the Personalized
Medicine Research Population (PMRP)
project of the Marshfield Clinic (Marsh-
field, WI) [55] and Northwestern Uni-
versity’s NUgene project (Chicago, IL).
The PMRP project selected 20,000 indi-
viduals who receive care in the geograph-
ic region of the Marshfield Clinic. These
patients have been consented, surveyed,
and have given permission to the inves-
tigators for recontact in the future if
additional information is needed. The
NUgene project, which has enrolled
nearly 10,000 people through 2012, uses
a similar approach, obtaining patients’
consent during outpatient clinic visits
[56]. Another example of an EHR-
associated biobank is the Kaiser-Perma-
nente biobank, which has genotyped
100,000 individuals [57].
The alternative ‘‘opt-out’’ approach is
evidenced by Vanderbilt University’s
BioVU, which associates DNA with de-
identified EHR data [58]. In this model,
patients have the opportunity to ‘‘opt out’’
of the DNA biobank by checking a box on
the standard ‘‘Consent to Treatment’’
form signed as part of routine clinical
care. A majority of patients (.90%) do
not check this box, indicating assent to
the use of their DNA in the biobank [58].
If the patient does not opt-out, blood
that is scheduled to be discarded after
routine laboratory testing is instead sent
for DNA extraction, which is stored for
potential future use. To ensure that no
one knows with certainty if a subject’s
DNA is in BioVU, an additional small
percentage of patients are randomly
excluded.
The BioVU model requires that the
DNA and associated EHR data be de-
identified in order to assure that the model
complies with the policies of non-human
subjects research. The full-text of the EHR
undergoes a process of de-identification
with software programs that remove
Health Insurance Portability and Account-
ability Act (HIPAA) identifiers from all
clinical documentation in the medical
record. At the time of this writing, text
de-identification for BioVU is performed
using the commercial product DE-ID [59]
with additional pre- and post-processing
steps. However, a number of other clinical
text de-identification software packages
have been studied, some of which are
open source [60,61]. Multiple reviews by
both the local institutional review board
and the federal Office for Human Re-
search Protections have affirmed this
status as nonhuman subjects research
according to 45 CFR 46 [58]. Nonethe-
less, all research conducted within BioVU
and the associated de-identified EHR
(called the ‘‘Synthetic Derivative’’) is
overseen by the local Institutional Review
Board. An opt-out model similar to
BioVU is used by Partners Healthcare
for the Crimson biobank, which can
accrue patients who meet specific pheno-
type criteria as they have routine blood
draws.
An advantage of the opt-out approach is
rapid sample accrual. BioVU began col-
PLOS Computational Biology | www.ploscompbiol.org 6 December 2012 | Volume 8 | Issue 12 | e1002823

lecting DNA samples in 2007, adding
about 500 new samples weekly, and has
over 150,000 subjects as of September
2012. Since it enrolls subjects prospective-
ly, investigation of rare phenotypes may be
possible with such systems. The major
disadvantage of the opt-out approach is
that it precludes recontact of the patients
since their identity has been removed.
However, the Synthetic Derivative is
continually updated as new information
is added to the EHR, such that the
amount of phenotypic information for
included patients grows over time.
5. Race and Ethnicity in EHR-Derived Biobanks
Given that much genetic information
varies greatly within ancestral populations,
accurate knowledge of genetic ancestry
information is essential to allow for proper
genetic study design and control of
population stratification. Without it, one
can see numerous spurious genetic associ-
ations due solely to race/ethnicity [62].
Single nucleotide polymorphisms (SNPs)
common in one population may be rare in
another. In large-scale GWA analyses, one
can tolerate less accurate knowledge of
ancestry a priori, since the large amount of
genetic data allows one to calculate the
genetic ancestry of the subject using
catalogs of SNPs known to vary between
races. Alternatively, one can also adjust for
genetic ancestry using tools such as
EIGENSTRAT [63]. However, in smaller
candidate gene studies, it is important to
know the ancestry beforehand.
Self-reported race/ethnicity data is often
used in genetic studies. In contrast race/
ethnicity as recorded within an EHR may
be entered through a variety of sources.
Most commonly, administrative staff re-
cord race/ethnicity via structured data
collection tools in the EHR. Often, this
field can be ignored (left as ‘‘unknown’’),
especially in busy clinical environments,
such as emergency departments. ‘‘Un-
known’’ percentages of patients can range
between 9% and 23% of subjects [17,18].
Among those patients for whom data is
entered, a study of genetic ancestry infor-
mative markers correlated well with EHR-
reported race/ethnicities [64]. In addition,
a study within the Veterans Administration
(VA) hospital system noted that over 95%
of all EHR-derived race/ethnicity agreed
with self-reported race/ethnicity using
nearly one million records [65]. Thus,
despite concerns over EHR-derived ances-
tral information, such information, when
present, appears similar to self-report
ancestry information.
6. Phenotype-Driven Discoveryin EHRs
6.1 Measure of Phenotype SelectionLogic Performance
The evaluation of phenotype selection
logic can use metrics similar to informa-
tion retrieval tasks. Common metrics are
sensitivity (or recall), specificity, positive
predictive value (PPV, also known as
precision), and negative predictive value
(see Box 1). If a population is assessed for
case and control status, then another
useful metric is comparing the receiver
operator characteristic (ROC) curves.
ROC curves graph the sensitivity vs. false
positive rate (or, 1-specificity) given a
continuous measure of the outcome of
the algorithm. By calculating the area
under the ROC curve (AUC), one has a
single measure of the overall performance
of an algorithm that can be used to
compare two algorithms or selection
logics. Since the scale of the graph is 0 to
1 on both axes, the performance of a
perfect algorithm is 1, and random chance
is 0.5.
6.2 Creation of Phenotype SelectionLogic
Initial work in phenotype detection has
often focused on a single modality of EHR
data. A number of studies have used
billing data, some comparing directly to
other genres of data, such as NLP. Li et al.
compared the results of ICD-9 encoded
diagnoses and NLP-processed discharge
summaries for clinical trial eligibility
queries, finding that use of NLP provided
more valuable data sources for clinical trial
pre-screening than ICD-9 codes [15].
Savova et al. has used cTAKES to
discover peripheral arterial disease cases
by looking for particular key words in
radiology reports, and then aggregating
the individual instances using ‘‘AND-OR-
NOT’’ Boolean logic to classify cases into
four categories: positive, negative, proba-
ble, and unknown [66].
Phenotype algorithms can be created
multiple ways, depending of the rarity of
the phenotype, the capabilities of the EHR
system, and the desired sample size of the
study. Generally, phenotype selection logics
(algorithms) are composed of one or more
of four elements: billing code data, other
structured (coded) data such as laboratory
values and demographic data, medication
information, and NLP-derived data. Struc-
tured data can be retrieved effectively from
most EHR systems. These data can be
combined through simple Boolean logic
Figure 3. General figure for identifying cases and controls using EHR data. Application of electronic selection algorithms lead to division ofa population of patients into four groups, the largest of which comprises patients who were excluded because they lack sufficient evidence to beeither a case or control patient. Definite cases and controls cross some predefined threshold of positive predictive value (e.g., PPV$95%), and thus donot require manual review. For very rare phenotypes or complicated case definitions, the category of ‘‘possible’’ cases may need to be reviewedmanually to increase the sample size.doi:10.1371/journal.pcbi.1002823.g003
PLOS Computational Biology | www.ploscompbiol.org 7 December 2012 | Volume 8 | Issue 12 | e1002823

[17] or through machine learning methods
such as logistic regression [18], to achieve a
predefined specificity or positive predictive
value. A drawback to the use of machine
learning data (such as logistic regression
models) is that it may not be as portable to
other EHR systems as more simple Boolean
logic, depending on how the models are
constructed. The application of many
phenotype selection logics can be thought
of partitioning individuals into four buckets
– definite cases (with sufficiently high PPV),
possible cases (which can be manually
reviewed if needed), controls (which do
not have the disease with acceptable
PPV), and individuals excluded from the
analysis due to either potentially overlap-
ping diagnoses or insufficient evidence
(Figure 3).
For many algorithms, sensitivity (or
recall) is not necessarily evaluated, assum-
ing there are an adequate number of cases.
A possible concern in not evaluating recall
(sensitivity) of a phenotype algorithm is
that there may be a systematic bias in how
patients were selected. For example,
consider a hypothetical algorithm to find
patients with T2D whose logic was to
select all patients that had at least one
billing code for T2D and also required
that cases receive an oral hypoglycemic
medication. This algorithm may be highly
specific for finding patients with T2D
(instead of type 1 diabetes), but would
miss those patients who had progressed in
disease severity such that oral hypoglyce-
mic agents no longer worked and who now
require insulin treatment. Thus, this
phenotype algorithm could miss the more
severe cases of T2D. However, for a
practical application, such assessments of
recall can be challenging given large
samples sizes of rare diseases. Certain
assumptions (e.g., that a patient should
have at least one billing code for the
disease) are reasonable and likely do not
lead to significant bias.
For other algorithms, the temporal
relationships of certain elements are very
important. Consider an algorithm to
determine whether a certain combination
of medication adversely impacted a given
lab, such as kidney function or glucose
[67]. Such an algorithm would need to
take into account the temporal sequence
and time between the particular medica-
tions and laboratory tests. For example,
glucose changes within minutes to hours
of a single administration of insulin, but
the development of glaucoma from corti-
costeroids (a known side effect) would not
be expected to happen acutely following a
single dose.
For very rare diseases or findings, one
may desire to find every case, and thus
the logic may simply be a union of
keyword text queries and billing codes
followed by manual review of all returned
cases. Examples include the rare physical
exam finding hippus (exaggerated pupil-
lary oscillations occurring in the setting of
altered mental status) [32], or potential
drug adverse events (e.g., Stevens-Johnson
syndrome), which are often very rare but
severe.
Since EHRs represent longitudinal rec-
ords of patient care, they are biased to
recording those events that are recorded as
part of medical care. Thus, they are
particularly useful for investigating dis-
ease-based phenotypes, but potentially less
efficacious for investigating non-disease
phenotypes such as hair or eye color, left
vs. right handedness, cognitive attributes,
biochemical measures (beyond routine
labs), etc. On the other hand, they may
be particularly useful for analyzing disease
progression over time.
7. Examples of GeneticDiscovery Using EHRs
The growth of ‘‘EHR-driven genomic
research’’ (EDGR) – that is, genomic
research proceeding primarily from
EHR data linked to DNA samples – is
a recent phenomenon [6]. Preceding
these most recent research initiatives,
other studies laid the groundwork for use
of EHR data to study genetic phenom-
ena. Rzhetsky et al. used billing codes
from the EHRs of 1.5 million patients to
analyze disease co-occurrence in 161
conditions as a proxy for possible genetic
overlap [68]. Chen et al. compared
laboratory measurements and age with
gene expression data to identify rates of
change that correlated with genes known
to be involved in aging [69]. A study at
Geisinger Clinic evaluated SNPs in the
9p21 region that are known to be
associated to cardiovascular disease and
early myocardial infarction [70]. They
found these SNPs were associated with
heart disease and T2D using EHR-
derived data. Several specific examples
of EDGR are detailed below.
7.1 Replicating Known GeneticAssociations for Five Diseases
An early replication study of known
genetic associations with five diseases with
known genetic associations was performed
in BioVU. The study was designed to test
the hypothesis that an EHR-linked DNA
biobank could be used for genetic associ-
ation analyses. The goal was to use only
EHR data for phenotype information.
The first 10,000 samples accrued in
BioVU were genotyped at 21 SNPs that
are known to be associated with these five
diseases (atrial fibrillation, Crohn’s disease,
multiple sclerosis, rheumatoid arthritis,
Table 2. Methods of finding cases and controls for genetic analysis of five common diseases.
Disease Methods Cases Controls Case PPV Control PPV
Atrial fibrillation NLP of ECG impressionsICD9 codesCPT codes
168 1695 98% 100%
Crohn’s Disease ICD9 codesMedications (text)
116 2643 100% 100%
Type 2 Diabetes ICD9 codesMedications (text)Text searches (controls)
570 764 100% 100%
Multiple Sclerosis ICD9 codes or text diagnosis 66 1857 87%* 100%
Rheumatoid Arthritis ICD9 codesMedications (text)Text searches (exclusions)
170 701 97% 100%
*Given the small number of multiple sclerosis cases, all possible cases were manually validated to ensure high recall.doi:10.1371/journal.pcbi.1002823.t002
PLOS Computational Biology | www.ploscompbiol.org 8 December 2012 | Volume 8 | Issue 12 | e1002823

and T2D). Reported odds ratios were
1.14–2.36 in at least two previous studies
prior to the analysis. Automated pheno-
type identification algorithms were devel-
oped using NLP techniques (to identify key
findings, medication names, and family
history), billing code queries, and struc-
tured data elements (such as laboratory
results) to identify cases (n = 70–698) and
controls (n = 808–3818). Final algorithms
achieved PPV of $97% for cases and
100% for controls on randomly selected
cases and controls (Table 2) [17]. For each
of the target diseases, the phenotype
algorithms were developed iteratively,
with a proposed selection logic applied to
a set of EHR subjects, and random cases
and controls evaluated for accuracy. The
results of these reviews were used to refine
the algorithms, which were then rede-
ployed and reevaluated on a unique set of
randomly selected records to provide final
PPVs.
Used alone, ICD9 codes had PPVs of
56–89% compared to a gold standard
represented by the final algorithm. Errors
were due to coding errors (e.g., typos),
misdiagnoses from non-specialists (e.g., a
non-specialist diagnosed a patient as
having rheumatoid arthritis followed by
a rheumatologist who revised the diag-
nosis to psoriatic arthritis), and indeter-
minate diagnoses that later evolved into
well-defined ones (e.g., a patient thought
to have Crohn’s disease was later deter-
mined to have ulcerative colitis, another
type of inflammatory bowel disease).
Each of the 21 tests of association yielded
point estimates in the expected direction,
and eight of the known associations
achieved statistical significance
[17].
7.2 Demonstrating MultiethnicAssociations with RheumatoidArthritis
Using a logistic regression algorithm
operating on billing data, NLP-derived
features, medication records, and labo-
ratory data, Liao et al. developed an
algorithm to accurately identify rheuma-
toid arthritis patients [18]. Kurreeman
et al. used this algorithm on EHR data
to identify a population of 1,515 cases
and 1,480 matched controls [71]. These
researchers genotyped 29 SNPs that had
been associated with RA in at least one
prior study. Sixteen of these SNPs
achieved statistical significance, and
26/29 had odds ratios in the same
direction and with similar effect sizes.
The authors also demonstrated that
these portions of these risk alleles were
associated with rheumatoid arthritis in
Table 3. eMERGE network participants.
Institution Biorepository Overview Model Size EHR SummaryPhenotypingMethods
Group Health1
(Seattle, WA)GHC BiobankAlzheimer’s DiseasePatient Registry and AdultChanges in Thought Study
Disease specificCohort
4000 Comprehensivevendor-based EHRsince 2004
Structured dataextraction, NLP
Marshfield Clinic ResearchFoundation1
(Marshfield, WI)
Personalized MedicineResearch ProjectMarshfield Clinic, an integratedregional health system
Population based 20,000 Comprehensiveinternally developedEHR since 1985
Structured dataextraction, NLP,Intelligent CharacterRecognition
Mayo Clinic1
(Rochester, MN)Disease cohortDerived from vascular laboratory &exercise stress testing labs
Disease specificCohorts
16,500 Comprehensiveinternally developedEHR since 1995
Structured dataextraction, NLP
Northwestern University1
(Chicago, IL)NUgene ProjectNorthwestern affiliated hospitalsand outpatient clinics
Population based .10,000 Comprehensivevendor basedInpatient andOutpatient (differentsystems) EHRsince 2000
Structured dataextraction, textsearches, NLP
Vanderbilt University1
(Nashville, TN)BioVUPrimarily drawn from outpatient routinelaboratory samples
Population based 150,000 Comprehensiveinternally developedEHR since 2000
Structured dataextraction, NLP
Geisinger Health System2
(Pennsylvania)MyCodeEnrollment of health plan participants
Population based .30,000 Comprehensivevendor-based EHR
Structured dataextraction, NLP
Mount Sinai MedicalCenter2 (New York, NY)
Institute for PersonalizedMedicine BiobankOutpatient enrollment
Population based .30,000 Comprehensivevendor-based EHRsince 2004
Structured dataextraction, NLP
Cincinnati Children’sHospital3
(Cincinnati, OH)
General and disease cohorts. Population based .3,000 Comprehensivevendor-based EHR
Structured dataextraction, NLP
Children’s Hospital ofPhiladelphia3
(Philadelphia, PA)
General and disease cohorts. Population based .100,000 Comprehensivevendor-based EHR
Structured dataextraction, NLP
Boston Children’s3
(Boston MA)CrimsonOn-demand, de-identifiedphenotype-driven collection
Disease based Virtual Comprehensiveinternally developedEHR
Structured dataextraction, NLP
Sizes represent approximate sizes as of 2012; many sites are still actively recruiting. NLP = Natural Language Processing. Sites joined with 1eMERGE-I in 2007, 2eMERGE-IIin 2011, or as 3pediatric sites in 2012.doi:10.1371/journal.pcbi.1002823.t003
PLOS Computational Biology | www.ploscompbiol.org 9 December 2012 | Volume 8 | Issue 12 | e1002823
East Asian, African, and Hispanic Amer-
ican populations.
7.3 eMERGE NetworkThe eMERGE network is composed of
nine institutions as of 2012 (http://gwas.
org; Table 3). Each site has a DNA
biobank linked to robust, longitudinal
EHR data. The initial goal of the
eMERGE network was to investigate the
feasibility of genome-wide association
studies using EHR data as the primary
source for phenotypic information. Each
of these sites initially set out to investigate
one or two primary phenotypes (Table 3).
Network sites have currently created and
evaluated electronic phenotype algorithms
for 14 different primary and secondary
phenotypes, with nearly 30 more planned.
After defining phenotype algorithms,
each site then performed genome-wide
genotyping at one of two NIH-supported
genotyping centers.
The primary goals of an algorithm are
to perform with high precision ($95%)
and reasonable recall. Algorithms incor-
porate billing codes, laboratory and vital
signs data, test and procedure results, and
clinical documentation. NLP is used to
both increase recall (find additional cases)
and achieve greater precision (via im-
proved specificity). These phenotype algo-
rithms are available for download from
PheKB (http://phekb.org).
Initial plans were for each site to
analyze their own phenotypes indepen-
dently. However, the network has realized
the benefits of synergy. Central efforts
across the network were involved in
harmonization of the collective genetic
data.
7.4 Early Genome-Wide AssociationStudies from the eMERGE Network
As of 2012, the eMERGE Network has
published GWAS on atrioventricular con-
duction [72], red blood cell [23] and white
blood cell [73] traits, primary hypothyroid-
ism [74], and erythrocyte sedimentation
rate [75], with others ongoing. The first two
studies published by the network were using
single-site GWAS studies; latter studies
have realized the advantage of pooling
data across multiple sites to increase the
sample size available for a study. Impor-
tantly, several studies in eMERGE have
explicitly evaluated the portability of the
electronic phenotype algorithms by review-
ing algorithms at multiple sites. Evaluation
of the hypothyroidism algorithm at the five
eMERGE-I sites, for instance, noted an
overall weighted PPV of 92.4% and 98.5%
for cases and controls, respectively [74].
Similar results have been found with T2D
[76], cataracts [27], and rheumatoid ar-
thritis [77] algorithms.
As a case study, the GWAS for
atrioventricular conduction (as measured
by the PR interval on the ECG), conduct-
ed entirely within samples drawn from one
site, identified variants in SCN10A.
SCN10A is a sodium channel expressed in
autonomic nervous system tissue and is
now known to be involved in cardiac
regulation. The phenotype algorithm
identified patients with normal ECGs
who did not have evidence of prior heart
disease, were not on medications that
would interfere with cardiac conduction,
and had normal electrolytes. The pheno-
type algorithm used NLP and billing code
queries to search for the presence of prior
heart disease and medication use [72]. Of
note, the algorithm highlights the impor-
tance of using clinical note section tagging
and negation to exclude only those
patients with heart disease, as opposed to
patients whose records contained negated
heart disease concepts (e.g., ‘‘no myocar-
dial infarction’’) or heart disease concepts
in related individuals (e.g., ‘‘mother died of
a heart attack’’). Use of NLP improved
recall of cases by 129% compared with
simple text searching, while maintaining a
positive predictive value of 97% (Figure 4)
[78,72].
The study of RBC traits identified four
variants associated with RBC traits. One
of these, SLC17A1, had not been previ-
ously identified, and is involved in sodium-
phosphate co-transport in the kidney. The
latter study of RBC traits utilized patients
genotyped at one site as cases and controls
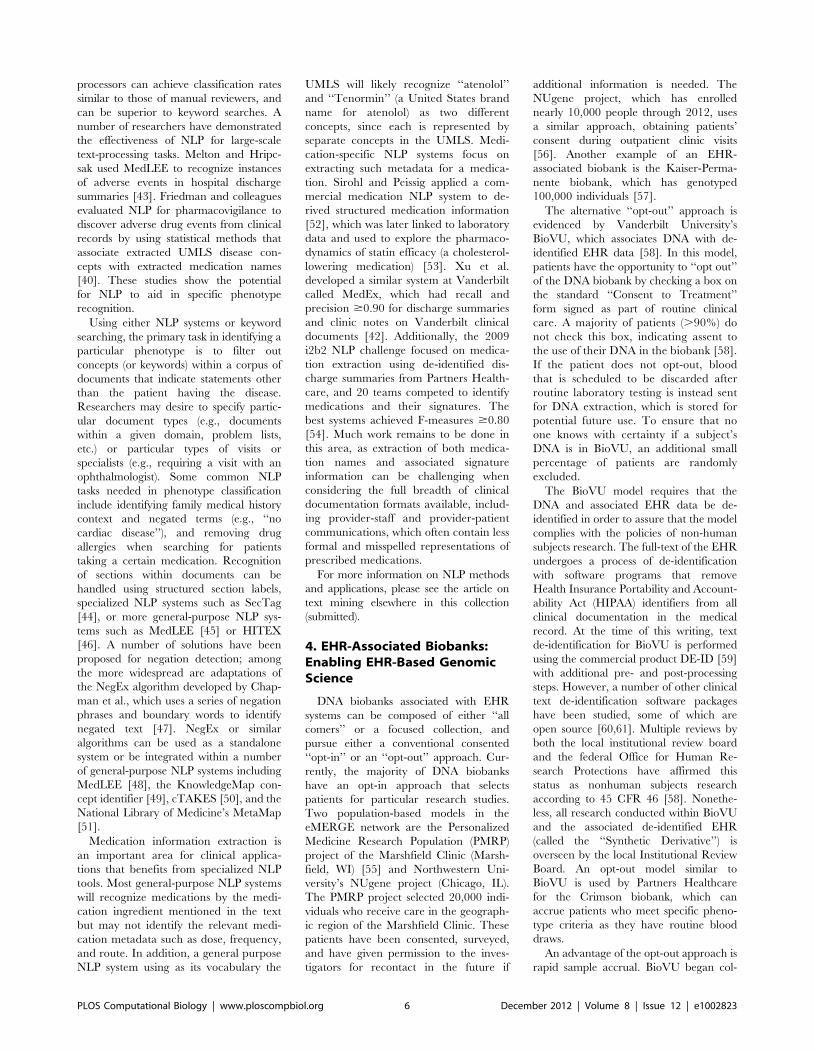
Figure 4. Use of NLP to identify patients without heart disease for a genome-wide analysis of normal cardiac conduction. Usingsimple text searching, 1564 patients would have been eliminated unnecessarily due to negated terms, family medical history of heart disease, or lowdose medication use that would not affect measurements on the electrocardiogram. Use of NLP improves recall of these cases without sacrificingpositive predictive value. The final case cohort represented the patients used for GWAS in [71].doi:10.1371/journal.pcbi.1002823.g004
PLOS Computational Biology | www.ploscompbiol.org 10 December 2012 | Volume 8 | Issue 12 | e1002823
for their primary phenotype of peripheral
arterial disease (PAD). Thus, this repre-
sents an in silico GWAS for a new finding
that did not require new genotyping, but
instead leveraged the available data within
the EHR. The eMERGE study of primary
hypothyroidism, similarly, identified a
novel association with FOXE1, a thyroid
transcription factor, without any new
genotyping by using samples derived from
five eMERGE sites.
7.5 Phenome-Wide AssociationStudies (PheWAS)
Typical genetic analyses investigate
many genetic loci against a single trait or
disease. Such analyses cannot identify
pleiotropic associations, and may miss
important confounders in an analysis.
Another approach, engender by the rich
phenotype record included in the EHR, is
to simultaneously investigate many pheno-
types associated with a given genetic locus.
A ‘‘phenome-wide association study’’
(PheWAS) is, in a sense, a ‘‘reverse
GWAS.’’ PheWAS investigations require
large representative patient populations
with definable phenotypic characteristics.
Such studies only recently became feasi-
ble, facilitated by linkage of DNA bior-
epositories to EHR systems, which can
provide a comprehensive, longitudinal
record of disease.
The first PheWAS studies were per-
formed on 6,005 patients genotyped for
five SNPs with seven previously known
disease associations [79]. This PheWAS
used ICD9 codes linked to a code-
translation table that mapped ICD9 codes
to 776 disease phenotypes. In this study,
PheWAS methods replicated four of seven
previously known associations with
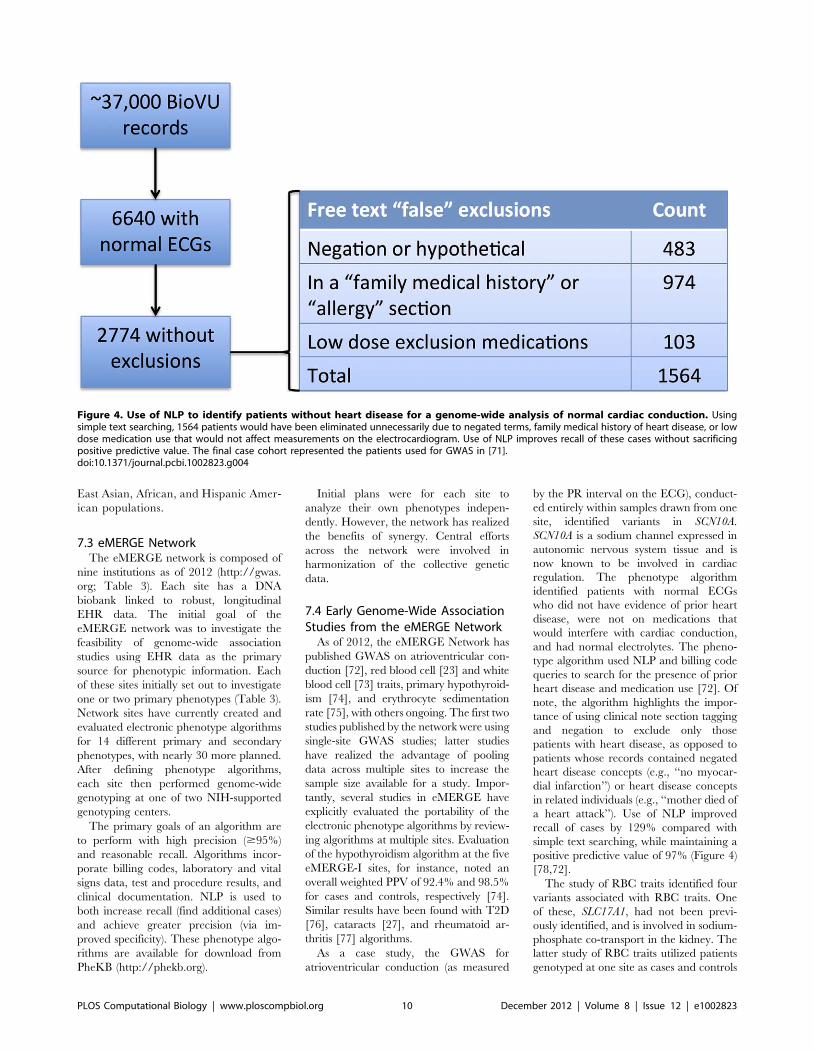
p,0.011. Figure 5 shows one illustrative
PheWAS plot of phenotype associations
with an HLA-DRA SNP known to be
associated with multiple sclerosis. Of note,
this PheWAS not only demonstrates a
strong association between this SNP and
multiple sclerosis, but also highlights other
possible associations, such as Type 1
diabetes and acquired hypothyroidism.
Recent explorations into PheWAS meth-
ods using NLP have shown greater
efficacy for detecting associations: with
the same patients, NLP-based PheWAS
replicated six of the seven known associ-
ations, generally with more significant p-
values [80].
PheWAS methods may be particularly
useful for highlighting pleiotropy and
clinically associated diseases. For exam-
ple, an early GWAS for T2D identified,
among others, FTO loci as an associated
variant [81]. A later GWAS demonstrat-
ed this risk association was mediated
through the effect of FTO on increasing
body mass index, and thus increasing risk
of T2D within those individuals. Such
effects may be identified through broad
phenome scans made possible through
PheWAS.
Figure 5. A PheWAS plot for rs3135388 in HLA-DRA. This region has known associations with multiple sclerosis. The red line indicatesstatistical significance at Bonferroni correction. The blue line represents p,0.05. This plot is generated from updated data from [78] and the updatedPheWAS methods as described in [73].doi:10.1371/journal.pcbi.1002823.g005
PLOS Computational Biology | www.ploscompbiol.org 11 December 2012 | Volume 8 | Issue 12 | e1002823
8. Conclusions and FutureDirections
EHRs have long been seen as a vehicle
to improve healthcare quality, cost, and
safety. However, their growing adoption
in the United States and elsewhere is
demonstrating their capability as a broad
tool for research. Enabling tools include
enterprise data warehouses and software
to process unstructured information, such
as de-identification and NLP. When
linked to biological data such as DNA
or tissue biorepositories, EHRs can be-
come a powerful tool for genomic anal-
ysis. One can imagine future repositories
also storing intermittent plasma samples
to allow for proteomic analyses.
A key advantage of EHR-based genetic
studies is that they allow for the collection
of phenotype information as a byproduct
of routine healthcare. Moreover, this
information collection grows over time
and is continually refined as new informa-
tion may confirm or refute a diagnosis for
a given individual. Through the course of
one’s life, a number of information points
concerning disease, response to treatment,
and laboratory and test data are collected.
Aggregation of this information can allow
for generation of large sample sizes of
patients with certain diseases or medica-
tion exposures. Moreover, once a subject
receives dense genotyping for one EHR-
based study, their genetic data can be
reused for many other genotypic studies,
allowing for relatively low-cost reuse of the
genetic material (once a given phenotype
can be found in the EHR).
Three major rate-limiting steps impede
utilization of EHR data for genetic
analysis. A major challenge is derivation
of accurate collections of cases and
controls for a given disease of interest,
usually achieved through creation and
validation of phenotype selection logics.
These algorithms take significant time and
effort to develop and often require adjust-
ment and a skilled team to deploy at a
secondary site. Another challenge is the
availability of phenotypic information.
Many patients may be observed at a given
healthcare facility only for certain types of
care (e.g., primary care or a certain
subspecialist), leading to fragmented
knowledge of a patient’s medical history
and medication exposures. Future growth
of Health Information Exchanges could
substantially improve these information
gaps. Finally, DNA biobanks require
significant institutional investment and
ongoing financial, ethical, and logistical
support to run effectively. Thus, they are
not ubiquitous.
As genomics move beyond discovery
into clinical practice, the future of person-
alized medicine is one in which our genetic
information could be ‘‘simply a click of the
mouse’’ away [82]. In this future, DNA-
enabled EHR systems will assist in more
accurate prescribing, risk stratification,
and diagnosis. Genomic discovery in
EHR systems provides a real-world test
bed to validate and discover clinically
meaningful genetic effects.
9. Exercises
1) Compare and contrast the basic
types of data available in an Elec-
tronic Health Records (EHR) that
are useful for mining genetic data.
What are some of the strengths and
drawbacks of each type of data?
2) Explain what a phenotype algo-
rithm is and why it is necessary. For
example, how can use of natural
language processing improve upon
use of billing codes alone?
3) Select a clinical disease and design
a phenotype algorithm for it.
4) How might a phenotype algorithm
be different for a very rare disease
(e.g., prion diseases) vs. a more
common one (e.g., Type 2 diabe-
tes)? How would a phenotype
algorithm be different for a phys-
ical exam finding (e.g., hippus or a
particular type of heart murmur) vs.
a disease?
5) Describe the differences between a
DNA biobank linked to an EHR
and one collected as part of a non-
EHR research cohort. What are the
advantages and disadvantages of a
de-identified DNA biobank vs. an
identified DNA biobank (either
linked to an EHR or not).
6) It is often harder to create algo-
rithms to find drug-response pheno-
types (such as adverse drug events)
than for a chronic disease. Give
several reasons why this might be.
Answers to the Exercises can be found
in Text S1.
Supporting Information
Text S1 Answers to Exercises.
(DOCX)
Further Reading
N Shortliffe EH, Cimino JJ, editors (2006) Biomedical informatics: computer applications in health care and biomedicine. 3rdedition. Springer. 1064 p.Chapters of particular relevance: Chapter 2 (‘‘Biomedical data: their acquisition, storage, and use’’), Chapter 8 (‘‘Natural languageand text processing in biomedicine’’), Chapter 12 (‘‘Electronic health record systems’’)
N Hristidis V, editor (2009) Information discovery on electronic health records. 1st edition. Chapman and Hall/CRC. 331 p.Chapters of particular relevance: Chapter 2 (‘‘Electronic health records’’), Chapter 4 (‘‘Data quality and integration issues inelectronic health records’’), 7 (‘‘Data mining and knowledge discovery on EHRs’’).
N Wilke RA, Xu H, Denny JC, Roden DM, Krauss RM, et al. (2011) The emerging role of electronic medical records inpharmacogenomics. Clin Pharmacol Ther 89: 379–386. doi:10.1038/clpt.2010.260.
N Roden DM, Xu H, Denny JC, Wilke RA (2012) Electronic medical records as a tool in clinical pharmacology: opportunities andchallenges. Clin Pharmacol Ther. Available: http://www.ncbi.nlm.nih.gov/pubmed/22534870. Accessed 30 June 2012.
N Kohane IS (2011) Using electronic health records to drive discovery in disease genomics. Nat Rev Genet 12: 417–428.doi:10.1038/nrg2999.
PLOS Computational Biology | www.ploscompbiol.org 12 December 2012 | Volume 8 | Issue 12 | e1002823

References
1. Hindorff LA, Sethupathy P, Junkins HA, Ramos
EM, Mehta JP, et al. (2009) Potential etiologic
and functional implications of genome-wide
association loci for human diseases and traits.
Proc Natl Acad Sci USA 106: 9362–9367.
doi:10.1073/pnas.0903103106.
2. Wellcome Trust Case Control Consortium (2007)
Genome-wide association study of 14,000 cases of
seven common diseases and 3,000 shared con-
trols. Nature 447: 661–678.
3. Dehghan A, Kottgen A, Yang Q, Hwang S-J, Kao
WL, et al. (2008) Association of three genetic loci
with uric acid concentration and risk of gout: a
genome-wide association study. Lancet 372: 1953–
1961. doi:10.1016/S0140-6736(08)61343-4.
4. Benjamin EJ, Dupuis J, Larson MG, Lunetta KL,
Booth SL, et al. (2007) Genome-wide association
with select biomarker traits in the Framingham
Heart Study. BMC Med Genet 8 Suppl 1: S11.
doi:10.1186/1471-2350-8-S1-S11.
5. Kiel DP, Demissie S, Dupuis J, Lunetta KL,
Murabito JM, et al. (2007) Genome-wide association
with bone mass and geometry in the Framingham
Heart Study. BMC Med Genet 8 Suppl 1: S14.
6. Kohane IS (2011) Using electronic health records
to drive discovery in disease genomics. Nat Rev
Genet 12: 417–428. doi:10.1038/nrg2999.
7. Manolio TA (2009) Collaborative genome-wide
association studies of diverse diseases: programs of
the NHGRI’s office of population genomics.
Pharmacogenomics 10: 235–241.
8. Kaiser Permanente, UCSF Scientists Complete
NIH-Funded Genomics Project Involving 100,000
People (n.d.). Available: http://www.dor.kaiser.
org/external/news/press_releases/Kaiser_
Permanente,_UCSF_Scientists_Complete_NIH-
Funded_Genomics_Project_Involving_100,000_
People/. Accessed 13 September 2011.
9. Herzig SJ, Howell MD, Ngo LH, Marcantonio
ER (2009) Acid-suppressive medication use and
the risk for hospital-acquired pneumonia. Jama
301: 2120–2128.
10. Klompas M, Haney G, Church D, Lazarus R,
Hou X, et al. (2008) Automated identification of
acute hepatitis B using electronic medical record
data to facilitate public health surveillance. PLoS
ONE 3: e2626. doi:10.1371/journal.pone.
0002626.
11. Kiyota Y, Schneeweiss S, Glynn RJ, Cannuscio
CC, Avorn J, et al. (2004) Accuracy of Medicare
claims-based diagnosis of acute myocardial in-
farction: estimating positive predictive value on
the basis of review of hospital records. American
heart journal 148: 99–104.
12. Dean BB, Lam J, Natoli JL, Butler Q, Aguilar D,
et al. (2009) Use of Electronic Medical Records
for Health Outcomes Research: A Literature
Review. Med Care Res Rev. Available: http://
www.ncbi.nlm.nih.gov/entrez/query.fcgi?cmd =
Retrieve&db = PubMed&dopt = Citationlistuids =
19279318.
13. Elixhauser A, Steiner C, Harris DR, Coffey RM
(1998) Comorbidity measures for use with
administrative data. Medical care 36: 8–27.
14. Charlson ME, Pompei P, Ales KL, MacKenzie
CR (1987) A new method of classifying prognostic
comorbidity in longitudinal studies: development
and validation. Journal of chronic diseases 40:
373–383.
15. Li L, Chase HS, Patel CO, Friedman C, Weng C
(2008) Comparing ICD9-encoded diagnoses and
NLP-processed discharge summaries for clinical
trials pre-screening: a case study. AMIA. Annual
Symposium proceedings/AMIA Symposium:
404–408.
16. Elkin PL, Ruggieri AP, Brown SH, Buntrock J,
Bauer BA, et al. (2001) A randomized controlled
trial of the accuracy of clinical record retrieval using
SNOMED-RT as compared with ICD9-CM.
Proceedings/AMIA. Annual Symposium: 159–
163.
Glossary
N Candidate gene study: A study of specific genetic loci in which a phenotype-genotype association may exist (e.g.,hypothesis-led genotype experiment)
N Computer-based documentation (CBD): Any electronic note or report found within an EHR system. Typically, these canbe dictated or typed directly into a ‘‘note writer’’ system (which may leverage ‘‘templates’’) available within the EHR. Notably,CBD excludes scanned documents.
N Computerized Provider Order Entry (CPOE): A system for allowing a provider (typically a clinician or a nursepractitioner) to enter, electronically, an order for a patient. Typical examples include medication prescribing or test ordering.These systems allow for a precise electronic record of orders given and also can provide decision support to help improvecare.
N Electronic Health Record (EHR): Any comprehensive electronic medical record system storing all the data about apatient’s encounters with a healthcare system, including medical diagnoses, physician notes, prescribing records. EHRsinclude CPOE and CBD systems (among others), and allow for easy information retrieval of clinical notes and results.
N Genome-wide association study (GWAS): A broad scale study of a number of points selected along a genome withoutusing a prior hypothesis. Typically, these studies analyze more than .500,000 loci on the genome.
N Genotype: The specific DNA sequence at a given location.
N Natural language processing (NLP): Use of algorithms to created structured data from unstructured, narrative textdocuments. Examples include use of comprehensive NLP software solutions to find biomedical concepts in documents, aswell as more focused applications of techniques to find extract features from notes, such as blood pressure readings.
N Phenome-wide association study (PheWAS): A broad scale study of a number phenotypes selected along the genomewithout regard to a prior hypothesis as what phenotype(s) a given genetic locus may be associated.
N Phenotype selection logic (or algorithm): A series of Boolean rules or machine learning algorithms incorporating suchinformation as billing codes, laboratory values, medication records, and NLP designed to derive a case and controlpopulation. from EHR data.
N Phenotype: Any observable attribute of an individual.
N Single nucleotide polymorphism (SNP): a single locus on the genome that shows variation in the human population.
N Structured data: Data that is already recorded in a system in a structured name-value pair format and can be easily queriedvia a database.
N Unified Medical Language System (UMLS): A comprehensive metavocabulary maintained by the National Library ofMedicine which combines .100 individual standardized vocabularies. The UMLS is composed of the Metathesaurus, theSpecialist Lexicon, and the Semantic Network. The largest component of the UMLS is the Metathesaurus, which contains theterm strings, concept groupings of terms, and concept interrelationships.
N Unstructured data: Data contained in narrative text documents such as the clinical notes generated by physicians andcertain types of text reports, such as pathology results or procedures such as echocardiograms.
PLOS Computational Biology | www.ploscompbiol.org 13 December 2012 | Volume 8 | Issue 12 | e1002823

17. Ritchie MD, Denny JC, Crawford DC, RamirezAH, Weiner JB, et al. (2010) Robust replication of
genotype-phenotype associations across multiple
diseases in an electronic medical record.Am J Hum Genet 86: 560–572. doi:10.1016/
j.ajhg.2010.03.003.
18. Liao KP, Cai T, Gainer V, Goryachev S, Zeng-treitler Q, et al. (2010) Electronic medical records
for discovery research in rheumatoid arthritis.Arthritis Care Res (Hoboken) 62: 1120–1127.
doi:10.1002/acr.20184.
19. Conway M, Berg RL, Carrell D, Denny JC, Kho
AN, et al. (2011) Analyzing the heterogeneity andcomplexity of electronic health record oriented
phenotyping algorithms. AMIA Annu Symp Proc2011: 274–283.
20. Denny JC, Peterson JF, Choma NN, Xu H,
Miller RA, et al. (2010) Extracting timing andstatus descriptors for colonoscopy testing from
electronic medical records. J Am Med Inform
Assoc 17: 383–388. doi:10.1136/jamia.2010.004804.
21. Huff SM, Rocha RA, McDonald CJ, De Moor GJ,
Fiers T, et al. (1998) Development of the LogicalObservation Identifier Names and Codes (LOINC)
vocabulary. J Am Med Inform Assoc 5: 276–292.
22. Logical Observation Identifiers Names and Codes(2007). Available: http://www.regenstrief.org/
medinformatics/loinc/.
23. Kullo IJ, Ding K, Jouni H, Smith CY, Chute CG(2010) A genome-wide association study of red
blood cell traits using the electronic medical record.PLoS ONE 5: e13011. doi:10.1371/journal.
pone.0013011
24. Rosenbloom ST, Stead WW, Denny JC, Giuse D,
Lorenzi NM, et al. (2010) Generating ClinicalNotes for Electronic Health Record Systems.
Appl Clin Inform 1: 232–243. doi:10.4338/ACI-2010-03-RA-0019.
25. Rosenbloom ST, Denny JC, Xu H, Lorenzi N,
Stead WW, et al. (2011) Data from clinical notes: aperspective on the tension between structure and
flexible documentation. J Am Med Inform Assoc
18: 181–186. doi:10.1136/jamia.2010.007237.
26. Rasmussen LV, Peissig PL, McCarty CA, Starren
J (2012) Development of an optical character
recognition pipeline for handwritten form fieldsfrom an electronic health record. Journal of the
American Medical Informatics Association: JA-MIA 19: e90–e95. doi:10.1136/amiajnl-2011-
000182.
27. Peissig PL, Rasmussen LV, Berg RL, LinnemanJG, McCarty CA, et al. (2012) Importance of multi-
modal approaches to effectively identify cataract
cases from electronic health records. J Am MedInform Assoc 19: 225–234. doi:10.1136/amiajnl-
2011-000456.
28. Denny JC, Spickard A, Miller RA, Schildcrout J,Darbar D, et al. (2005) Identifying UMLS
concepts from ECG Impressions using Knowl-edgeMap. AMIA. Annual Symposium proceed-
ings/AMIA Symposium: 196–200.
29. Willems JL, Abreu-Lima C, Arnaud P, vanBemmel JH, Brohet C, et al. (1991) The
diagnostic performance of computer programs
for the interpretation of electrocardiograms. TheNew England journal of medicine 325: 1767–
1773.
30. Poon EG, Keohane CA, Yoon CS, Ditmore M,Bane A, et al. (2010) Effect of bar-code technol-
ogy on the safety of medication administration.N Engl J Med 362: 1698–1707. doi:10.1056/
NEJMsa0907115.
31. FitzHenry F, Peterson JF, Arrieta M, Waitman
LR, Schildcrout JS, et al. (2007) Medicationadministration discrepancies persist despite elec-
tronic ordering. J Am Med Inform Assoc 14: 756–764. doi:10.1197/jamia.M2359.
32. Denny JC, Arndt FV, Dupont WD, Neilson EG
(2008) Increased hospital mortality in patientswith bedside hippus. The American journal of
medicine 121: 239–245.
33. Turchin A, Kolatkar NS, Grant RW, MakhniEC, Pendergrass ML, et al. (2006) Using Regular
Expressions to Abstract Blood Pressure andTreatment Intensification Information from the
Text of Physician Notes. Journal of the American
Medical Informatics Association 13: 691–695.doi:10.1197/jamia.M2078.
34. Sager N, Lyman M, Bucknall C, Nhan N, Tick LJ(1994) Natural language processing and the
representation of clinical data. J Am Med InformAssoc 1: 142–160.
35. Haug PJ, Ranum DL, Frederick PR (1990)
Computerized extraction of coded findings fromfree-text radiologic reports. Work in progress.
Radiology 174: 543–548.
36. Friedman C, Hripcsak G, Shablinsky I (1998) An
evaluation of natural language processing meth-
odologies. Proceedings/AMIA. Annual Sympo-sium: 855–859.
37. Denny JC, Smithers JD, Miller RA, Spickard A(2003) ‘‘Understanding’’ medical school curricu-
lum content using KnowledgeMap. J Am MedInform Assoc 10: 351–362.
38. Dunham GS, Pacak MG, Pratt AW (1978)
Automatic indexing of pathology data. Journalof the American Society for Information Science
29: 81–90.
39. Denny JC, Spickard A, Miller RA, Schildcrout J,
Darbar D, et al. (2005) Identifying UMLS
concepts from ECG Impressions using Knowl-edgeMap. AMIA. Annual Symposium proceed-
ings [electronic resource]/AMIA Symposium:196–200.
40. Wang X, Hripcsak G, Markatou M, Friedman C
(2009) Active computerized pharmacovigilanceusing natural language processing, statistics, and
electronic health records: a feasibility study. J AmMed Inform Assoc 16: 328–337.
41. Meystre SM, Haug PJ (2008) Randomizedcontrolled trial of an automated problem list with
improved sensitivity. International journal of
medical informatics. Available: http://www.ncbi.nlm.nih.gov/entrez/query.fcgi?cmd = Retrieve
&db=PubMed&dopt=Citation&list_uids=18280787.
42. Xu H, Stenner SP, Doan S, Johnson KB,
Waitman LR, et al. (2010) MedEx: a medication
information extraction system for clinical narra-tives. J Am Med Inform Assoc 17: 19–24.
doi:10.1197/jamia.M3378.
43. Melton GB, Hripcsak G (2005) Automated
detection of adverse events using natural lan-
guage processing of discharge summaries. J AmMed Inform Assoc 12: 448–457.
44. Denny JC, Spickard A, Johnson KB, PetersonNB, Peterson JF, et al. (2009) Evaluation of a
method to identify and categorize section headersin clinical documents. J Am Med Inform Assoc
16: 806–815. doi:10.1197/jamia.M3037.
45. Friedman C, Shagina L, Lussier Y, Hripcsak G(2004) Automated encoding of clinical documents
based on natural language processing. J Am MedInform Assoc 11: 392–402.
46. Zeng QT, Goryachev S, Weiss S, Sordo M,
Murphy SN, et al. (2006) Extracting principaldiagnosis, co-morbidity and smoking status for
asthma research: evaluation of a natural languageprocessing system. BMC medical informatics and
decision making 6: 30.
47. Chapman WW, Bridewell W, Hanbury P,Cooper GF, Buchanan BG (2001) A simple
algorithm for identifying negated findings anddiseases in discharge summaries. Journal of
biomedical informatics 34: 301–310.
48. Friedman C, Shagina L, Lussier Y, Hripcsak G
(2004) Automated encoding of clinical documents
based on natural language processing. J Am MedInform Assoc 11: 392–402.
49. Denny JC, Miller RA, Waitman LR, Arrieta MA,Peterson JF (2009) Identifying QT prolongation
from ECG impressions using a general-purpose
Natural Language Processor. International jour-nal of medical informatics 78 Suppl 1: S34–42.
50. Savova GK, Masanz JJ, Ogren PV, Zheng J,Sohn S, et al. (2010) Mayo clinical Text Analysis
and Knowledge Extraction System (cTAKES):architecture, component evaluation and applica-
tions. J Am Med Inform Assoc 17: 507–513.doi:10.1136/jamia.2009.001560.
51. Aronson AR, Lang F-M (2010) An overview of
MetaMap: historical perspective and recentadvances. J Am Med Inform Assoc 17: 229–
236. doi:10.1136/jamia.2009.002733.
52. Sirohi E, Peissig P (2005) Study of effect of drug
lexicons on medication extraction from electronicmedical records. Pac Symp Biocomput: 308–318.
53. Wilke RA, Berg RL, Linneman JG, Zhao C,
McCarty CA, et al. (2008) Characterization of low-density lipoprotein cholesterol-lowering efficacy
for atorvastatin in a population-based DNAbiorepository. Basic Clin Pharmacol Toxicol 103:
354–359. doi:10.1111/j.1742-7843.2008.00291.x.
54. Uzuner O, Solti I, Cadag E (2010) Extractingmedication information from clinical text. Journal
of the American Medical Informatics Association17: 514–518. doi:10.1136/jamia.2010.003947.
55. McCarty CA, Nair A, Austin DM, Giampietro
PF (2007) Informed consent and subject motiva-tion to participate in a large, population-based
genomics study: the Marshfield Clinic Personal-ized Medicine Research Project. Community
Genet 10: 2–9. doi:10.1159/000096274.
56. NUgene Project (n.d.). Available: https://www.
nugene.org/. Accessed 16 September 2012.
57. Kaiser Permanente, UCSF Scientists CompleteNIH-Funded Genomics Project Involving 100,000
People (n.d.). Available: http://www.dor.kaiser.org/external/news/press_releases/Kaiser_
Permanente,_UCSF_Scientists_Complete_NIH-
Funded_Genomics_Project_Involving_100,000_People/. Accessed 13 September 2011.
58. Roden DM, Pulley JM, Basford MA, BernardGR, Clayton EW, et al. (2008) Development of a
large-scale de-identified DNA biobank to enablepersonalized medicine. Clinical pharmacology
and therapeutics 84: 362–369.
59. Gupta D, Saul M, Gilbertson J (2004) Evaluationof a deidentification (De-Id) software engine to
share pathology reports and clinical documentsfor research. American journal of clinical pathol-
ogy 121: 176–186.
60. Aberdeen J, Bayer S, Yeniterzi R, Wellner B,Clark C, et al. (2010) The MITRE Identification
Scrubber Toolkit: design, training, and assess-ment. Int J Med Inform 79: 849–859.
doi:10.1016/j.ijmedinf.2010.09.007.
61. Uzuner O, Luo Y, Szolovits P (2007) Evaluating thestate-of-the-art in automatic de-identification. J Am
Med Inform Assoc 14: 550–563. doi:10.1197/jamia.M2444.
62. Cardon LR, Palmer LJ (2003) Population stratifi-cation and spurious allelic association. Lancet 361:
598–604. doi:10.1016/S0140-6736(03)12520-2.
63. Price AL, Patterson NJ, Plenge RM, WeinblattME, Shadick NA, et al. (2006) Principal compo-
nents analysis corrects for stratification in ge-nome-wide association studies. Nat Genet 38:
904–909. doi:10.1038/ng1847.
64. Dumitrescu L, Ritchie MD, Brown-Gentry K,Pulley JM, Basford M, et al. (2010) Assessing the
accuracy of observer-reported ancestry in abiorepository linked to electronic medical records.
Genet Med 12: 648–650. doi:10.1097/GIM.0-
b013e3181efe2df.
65. Sohn M-W, Zhang H, Arnold N, Stroupe K,
Taylor BC, et al. (2006) Transition to the newrace/ethnicity data collection standards in the
Department of Veterans Affairs. Popul HealthMetr 4: 7. doi:10.1186/1478-7954-4-7.
66. Savova GK, Fan J, Ye Z, Murphy SP, Zheng J,
et al. (2010) Discovering peripheral arterialdisease cases from radiology notes using natural
language processing. AMIA Annu Symp Proc2010: 722–726.
67. Tatonetti NP, Denny JC, Murphy SN, Fernald
GH, Krishnan G, et al. (2011) Detecting DrugInteractions From Adverse-Event Reports: Inter-
action Between Paroxetine and Pravastatin In-creases Blood Glucose Levels. Clin Pharmacol
Ther. Available: http://www.ncbi.nlm.nih.gov/pubmed/21613990. Accessed 7 June 2011.
PLOS Computational Biology | www.ploscompbiol.org 14 December 2012 | Volume 8 | Issue 12 | e1002823

68. Rzhetsky A, Wajngurt D, Park N, Zheng T (2007)
Probing genetic overlap among complex humanphenotypes. Proc Natl Acad Sci USA 104:
11694–11699. doi:10.1073/pnas.0704820104.
69. Chen DP, Weber SC, Constantinou PS, FerrisTA, Lowe HJ, et al. (2008) Novel integration of
hospital electronic medical records and geneexpression measurements to identify genetic
markers of maturation. Pac Symp Biocomput:
243–254.70. Wood GC, Still CD, Chu X, Susek M, Erdman R,
et al. (2008) Association of chromosome 9p21 SNPswith cardiovascular phenotypes in morbid obesity
using electronic health record data. Genomic Med 2:33–43. doi:10.1007/s11568-008-9023-z.
71. Kurreeman F, Liao K, Chibnik L, Hickey B,
Stahl E, et al. (2011) Genetic basis of autoanti-body positive and negative rheumatoid arthritis
risk in a multi-ethnic cohort derived fromelectronic health records. Am J Hum Genet 88:
57–69. doi:10.1016/j.ajhg.2010.12.007.
72. Denny JC, Ritchie MD, Crawford DC, Schildcr-out JS, Ramirez AH, et al. (2010) Identification of
genomic predictors of atrioventricular conduc-tion: using electronic medical records as a tool for
genome science. Circulation 122: 2016–2021.doi:10.1161/CIRCULATIONAHA.110.948828.
73. Crosslin DR, McDavid A, Weston N, Nelson SC,
Zheng X, et al. (2012) Genetic variants associated
with the white blood cell count in 13,923 subjects
in the eMERGE Network. Hum Genet 131: 639–
652. doi:10.1007/s00439-011-1103-9.
74. Denny JC, Crawford DC, Ritchie MD, Bielinski SJ,
Basford MA, et al. (2011) Variants Near FOXE1 Are
Associated with Hypothyroidism and Other Thyroid
Conditions: Using Electronic Medical Records for
Genome- and Phenome-wide Studies. Am J Hum
Genet 89: 529–542. doi:10.1016/j.ajhg.2011.09.008.
75. Kullo IJ, Ding K, Shameer K, McCarty CA,
Jarvik GP, et al. (2011) Complement receptor 1
gene variants are associated with erythrocyte
sedimentation rate. Am J Hum Genet 89: 131–
138. doi:10.1016/j.ajhg.2011.05.019.
76. Kho AN, Hayes MG, Rasmussen-Torvik L, Pacheco
JA, Thompson WK, et al. (2012) Use of diverse
electronic medical record systems to identify genetic
risk for type 2 diabetes within a genome-wide
association study. J Am Med Inform Assoc 19:
212–218. doi:10.1136/amiajnl-2011-000439.
77. Carroll RJ, Thompson WK, Eyler AE, Mandelin
AM, Cai T, et al. (2012) Portability of an
algorithm to identify rheumatoid arthritis in
electronic health records. Journal of the American
Medical Informatics Association: JAMIA 19:
e162–e169. doi:10.1136/amiajnl-2011-000583.
78. Denny JC, Kho A, Chute CG, Carrell D,
Rasmussen L, et al. (2010) Use of Electronic
Medical Records for Genomic Research –
Preliminary Results and Lessons from the
eMERGE Network.
79. Denny JC, Ritchie MD, Basford MA, Pulley JM,
Bastarache L, et al. (2010) PheWAS: demonstrat-
ing the feasibility of a phenome-wide scan to
discover gene-disease associations. Bioinformatics
26: 1205–1210. doi:10.1093/bioinformatics/
btq126.
80. Denny JC, Bastarache L, Crawford DC, Ritchie
MD, Basford MA, et al. (2010) Scanning the
EMR Phenome for Gene-Disease Associations
using Natural Language Processing. Proc AMIA
Annu Fall Symp.
81. Scott LJ, Mohlke KL, Bonnycastle LL, Willer CJ,
Li Y, et al. (2007) A genome-wide association
study of type 2 diabetes in Finns detects multiple
susceptibility variants. Science 316: 1341–1345.
82. Collins F (2009) Opportunities and challenges for
the NIH–an interview with Francis Collins.
Interview by Robert Steinbrook. N Engl J Med
361: 1321–1323. doi:10.1056/NEJMp0905046.
PLOS Computational Biology | www.ploscompbiol.org 15 December 2012 | Volume 8 | Issue 12 | e1002823