chapter 131 assumptions underlying parametric statistical techniques
Post on 21-Dec-2015
241 views
TRANSCRIPT

Chapter 13 1
Chapter 13
Assumptions Underlying Parametric Statistical Techniques

Chapter 13 2
Parametric Statistics
We have been studying parametric statistics.
They include estimations of mu and sigma, correlation, t tests and F tests.

Chapter 13 3
Five Assumptions
two research assumptions;
two assumptions about the type of the distributions in the samples,
and one assumption about the kind of numbering system that we are using.
To validly use parametric statistics, we make
Chapter 13 4
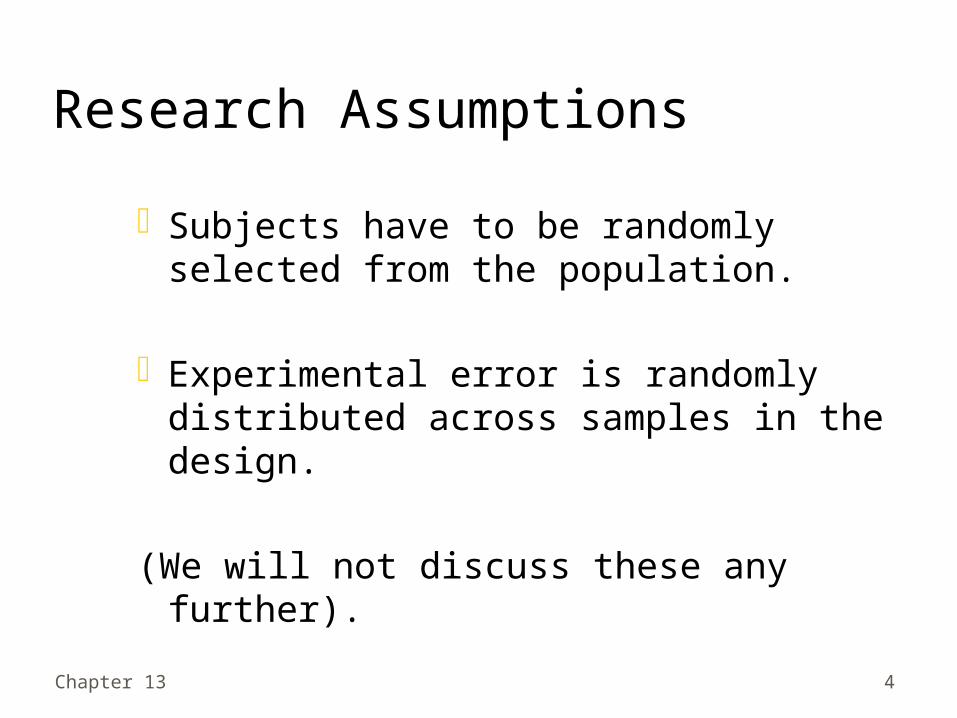
Research Assumptions
Subjects have to be randomly selected from the population.
Experimental error is randomly distributed across samples in the design.
(We will not discuss these any further).

Chapter 13 5
Distribution Assumptions
The distribution of sample means fit a normal curve.
Homogeneity of variance (using FMAX).

Chapter 13 6
Assumptions about Numbering Schemes
The measures we take are on an interval scale.
(Other numbering scales, such as ordinal and nominal, are non-parametric).

Chapter 13 7
Violating the Assumptions
If any of these assumptions are violated, we cannot use parametric statistics.
We must use less-powerful, non-parametric statistics.

Chapter 13 8

Chapter 13 9
Sample Means
An assumption we need to make is that the distribution of sample means is normally distributed.
This is not as extreme an assumption as it might seem.
We will follow an example from Chapter 4 to demonstrate.

Chapter 13 10
Example: Start with a tiny population N=5
The scores in this population form a perfectly rectangular distribution.
Mu = 5.00Sigma = 2.83We are going to list all the possible
samples of size 2 (n=2)First see the population, then the list
of samples

Chapter 13 11
Figure 4.5: Scores of the 5 research participants in this population. Frequency 3 2 1 x x x x x 1.00 2.00 3.00 4.00 5.00 6.00 7.00 8.00 9.00

Chapter 13 12
Figure 4.6: Means of all possible 25 samples (n=2) from this population Frequency 5 X 4 X X X 3 X X X X X 2 X X X X X X X 1 X X X X X X X X X Score 1.00 2.00 3.00 4.00 5.00 6.00 7.00 8.00 9.00

Chapter 13 13
Table 4.10: List of all 25 possible samples (n=2) of scores from the tiny population of 5 scores shown in Table 4.9 and Figure 4.5 I Sample Scores X Sample Scores X Summary statistics (all samples, n=2) AA 1,1 1.00 DA 7,1 4.00 X = 125.00 AB 1,3 2.00 DB 7,3 5.00 N = 25 AC 1,5 3.00 DC 7,5 6.00 mu = 5.00 AD 1,7 4.00 DD 7,7 7.00 SS = 100.00 AE 1,9 5.00 DE 7,9 8.00 BA 3,1 2.00 EA 9,1 5.00 BB 3,3 3.00 EB 9,3 6.00 BC 3,5 4.00 EC 9,5 7.00 BD 3,7 5.00 ED 9,7 8.00 BE 3,9 6.00 EE 9,9 9.00 CA 5,1 3.00 CB 5,3 4.00 CC 5,5 5.00 CD 5,7 6.00 CE 5,9 7.00

Chapter 13 14
Normal Curve for Sample Means Conclusion
Even if we have a small population (5),… with a rectangular distribution,… and a small sample size (2),… which yields a small number of possible
samples (52= 25)
… the sample means tend to fall in a normal distribution.
This assumption is seldom violated.This assumption is robust.

Chapter 13 15
Figure 4.6: Means of all possible 25 samples (n=2) from this population Frequency 5 X 4 X X X 3 X X X X X 2 X X X X X X X 1 X X X X X X X X X Score 1.00 2.00 3.00 4.00 5.00 6.00 7.00 8.00 9.00

Chapter 13 16
Violating the Normal Curve Assumption
Normal curves are symmetric are bell-shaped
have a single peak
Non-normal curves have skew have kurtosis-
platykutic or leptokurtic are polymodal
Distributions can vary from normal in many ways.

Chapter 13 17
Symmetry
Frequency
score
The left side is the same shape as the right side.

Chapter 13 18
Skewed
NORMAL
Skewed RightSkewed Left

Chapter 13 19
Bell-shaped
Frequency
score
Area under the curve occurs in a prescribed manner,as listed in the Z table.
1 sigma ~ 34%; 2 sigma ~ 48%; On each side of the mean

Chapter 13 20
Kurtosis
NORMAL
Leptokurtic Platykurtic

Chapter 13 21
One mode
Frequency
score
There is only one mode and it equals the medianand the mean.

Chapter 13 22
Polymodality
NORMAL
Bimodal Trimodal

Chapter 13 23
Violation of normally distributed sample means
If the distribution of sample means is… skewed,… or has kurtosis,… or more than one mode,
… then we cannot use parametric statistics.

Chapter 13 24

Chapter 13 25
For F Ratios and t Tests
We assume that the distribution of scores around each sample mean is similar.
The distributions within each group all estimate the same thing, that is, sigma2.
The mean squares within each group should be the same in each group.
For F ratios and t tests, this is called homogeneity of variance.
Chapter 13 26
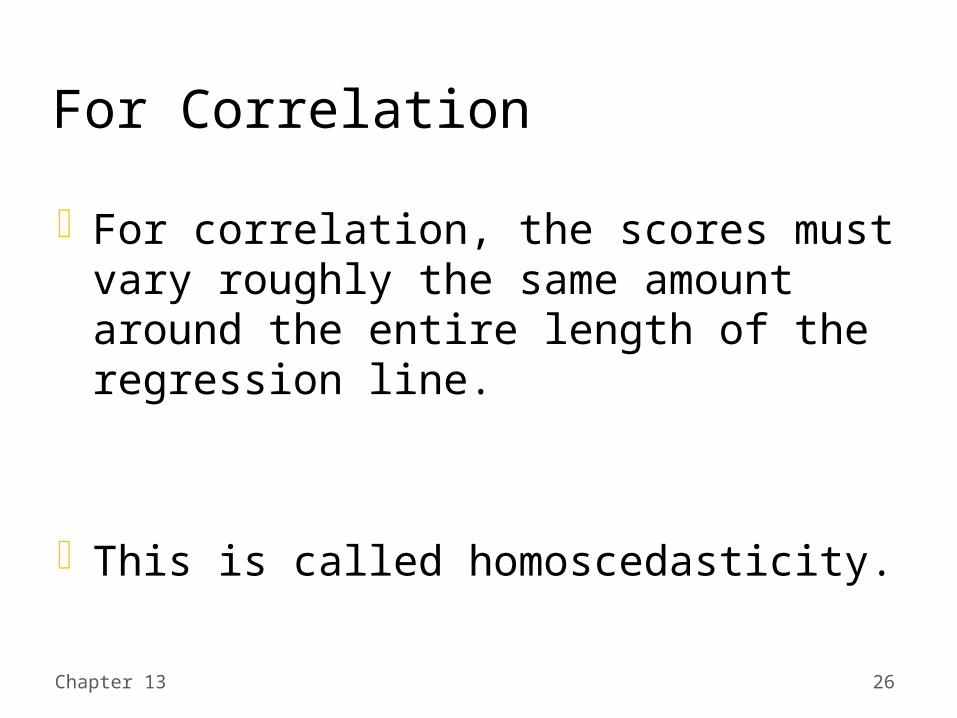
For Correlation
For correlation, the scores must vary roughly the same amount around the entire length of the regression line.
This is called homoscedasticity.

Chapter 13 27
Homoscedasticity3
-3
2
1
0
-1
-2
3 -3 2 1 0 -1 -2

Chapter 13 28
Non-Homoscedasticity3
-3
2
1
0
-1
-2
3 -3 2 1 0 -1 -2

Chapter 13 29
Homogeneity of Variance
In mathematical terms, homogeneity of variance means that the mean squares for each group are about the same.
221 sigmaMSMSMSMS WK
MSW is a consistent estimate of sigma2. The more degrees of freedom for MSW, the closer it tends to come to sigma2.

Chapter 13 30
We assume the mean square is your best estimate of sigma2
Since MSW has more df than MS1 or MS2 or MSK, it should be a better estimate of sigma2. But that only works when the mean squares in all the groups are fairly good estimates of sigma2.We use the FMAX test to check if the group with the smallest mean squares is “too different” from the group with the largest mean squares for the combined mean square (MSW) to be a good estimate of sigma2.

Chapter 13 31
FMAX
If FMAX is significant, then the Mean Squares differ too much from each other to combine into a single estimate.
(Usually it means that the variance in one of the groups has virtually disappeared because of a floor or ceiling effect. When that happens, adding that groups sum of squares and df into the mix produces an underestimate of sigma2.
When that happens, it becomes too easy to make a Type 1 error.
We say that “The assumption of homogeneity of variance is violated.”
And we cannot use parametric statistics!

Chapter 13 32
7Wdf43.3WMS
Divide by df(nG-1) to get MS for each group.
7Wdf21.0WMS
Sum the deviations.
00.24WSS 48.1WSS
Book Example - no homogeneity
1.11.21.31.41.51.61.71.8
12355664
X#S2.12.22.32.42.52.62.72.8
98999989
9.004.001.001.001.004.004.000.00
21XX
Square thedeviations.
.06
.56
.06
.06
.06
.06
.56
.06
22XX -3.00-2.00-1.001.001.002.002.000.00
1XX
Calculate thedeviations.
.25-.75.25.25.25.25
-.75.25
2XX X#S4.004.004.004.004.004.004.004.00
1X
00.41 X
Within each groupCalculate
the means.
8.758.758.758.758.758.758.758.75
2X
75.82 X

Chapter 13 33
FMAX
In FMAX, the “MAX” part refers to the largest ratio that can be obtained by comparing the estimated variances from 2 experimental groups.
MinimumG
MaximumGMAX MS
MSF
The significance of FMAX is checked in an FMAX table.

2 3 4 5 6 7 8 9 10 4 23.2 37 49 59 69 79 89 97 106
5 14.9 22 28 33 38 42 46 50 54
6 11.1 15.5 19.1 22 25 27 30 32 34
7 8.89 12.1 14.5 16.5 18.4 20 22 23 24
8 7.50 9.9 11.7 13.2 14.5 15.8 16.9 17.9 18.9
9 6.54 8.5 9.9 11.1 12.1 13.1 13.9 14.7 15.3
10 5.85 7.4 8.6 9.6 10.4 11.1 11.8 12.4 12.9
12 4.91 6.1 6.9 7.6 8.2 8.7 9.1 9.5 9.9
15 4.07 4.9 5.5 6.0 6.4 6.7 7.1 7.3 7.5
20 3.32 3.8 4.3 4.6 4.9 5.1 5.3 5.5 5.6
30 2.63 3.0 3.3 3.4 3.6 3.7 3.8 3.9 4.0
60 1.96 2.2 2.3 2.4 2.4 2.5 2.5 2.6 2.6
K = number of variances
dfFMAX
alpha = .01.
nG(larger) - 1Default = larger df.
The number of groupsin the experiment.

2 3 4 5 6 7 8 9 10 4 23.2 37 49 59 69 79 89 97 106
5 14.9 22 28 33 38 42 46 50 54
6 11.1 15.5 19.1 22 25 27 30 32 34
7 8.89 12.1 14.5 16.5 18.4 20 22 23 24
8 7.50 9.9 11.7 13.2 14.5 15.8 16.9 17.9 18.9
9 6.54 8.5 9.9 11.1 12.1 13.1 13.9 14.7 15.3
10 5.85 7.4 8.6 9.6 10.4 11.1 11.8 12.4 12.9
12 4.91 6.1 6.9 7.6 8.2 8.7 9.1 9.5 9.9
15 4.07 4.9 5.5 6.0 6.4 6.7 7.1 7.3 7.5
20 3.32 3.8 4.3 4.6 4.9 5.1 5.3 5.5 5.6
30 2.63 3.0 3.3 3.4 3.6 3.7 3.8 3.9 4.0
60 1.96 2.2 2.3 2.4 2.4 2.5 2.5 2.6 2.6
k = number of variances
dfFMAX
The critical values.

Chapter 13 36
Book Example
43.31 MS 21.02 MS
33.16
21.0
43.3
MinimumG
MaximumGMAX MS
MSF
7MAXdf

2 3 4 5 6 7 8 9 10 4 23.2 37 49 59 69 79 89 97 106
5 14.9 22 28 33 38 42 46 50 54
6 11.1 15.5 19.1 22 25 27 30 32 34
7 8.89 12.1 14.5 16.5 18.4 20 22 23 24
8 7.50 9.9 11.7 13.2 14.5 15.8 16.9 17.9 18.9
9 6.54 8.5 9.9 11.1 12.1 13.1 13.9 14.7 15.3
10 5.85 7.4 8.6 9.6 10.4 11.1 11.8 12.4 12.9
12 4.91 6.1 6.9 7.6 8.2 8.7 9.1 9.5 9.9
15 4.07 4.9 5.5 6.0 6.4 6.7 7.1 7.3 7.5
20 3.32 3.8 4.3 4.6 4.9 5.1 5.3 5.5 5.6
30 2.63 3.0 3.3 3.4 3.6 3.7 3.8 3.9 4.0
60 1.96 2.2 2.3 2.4 2.4 2.5 2.5 2.6 2.6
k = number of variances
dfFMAX
FMAX = 16.33 > 8.89FMAX exceeds the critical value.
We cannot use parametric statistics.

Chapter 13 38
Examples
Number Subjects Critical valueDesign of Means in larger NG of FMAX
2X4 8 21 5.3 2X2 ? 16 ? 3X3 ? 11 ? 2X3 ? 9 ?
496

2 3 4 5 6 7 8 9 10 4 23.2 37 49 59 69 79 89 97 106
5 14.9 22 28 33 38 42 46 50 54
6 11.1 15.5 19.1 22 25 27 30 32 34
7 8.89 12.1 14.5 16.5 18.4 20 22 23 24
8 7.50 9.9 11.7 13.2 14.5 15.8 16.9 17.9 18.9
9 6.54 8.5 9.9 11.1 12.1 13.1 13.9 14.7 15.3
10 5.85 7.4 8.6 9.6 10.4 11.1 11.8 12.4 12.9
12 4.91 6.1 6.9 7.6 8.2 8.7 9.1 9.5 9.9
15 4.07 4.9 5.5 6.0 6.4 6.7 7.1 7.3 7.5
20 3.32 3.8 4.3 4.6 4.9 5.1 5.3 5.5 5.6
30 2.63 3.0 3.3 3.4 3.6 3.7 3.8 3.9 4.0
60 1.96 2.2 2.3 2.4 2.4 2.5 2.5 2.6 2.6
K = number of variances
dfFMAX

Chapter 13 40
CPE 14.2.1
Number Subjects Critical valueDesign of Means in larger NG of FMAX
2X4 8 21 5.3 2X2 4 16 5.5 3X3 9 11 ? 2X3 6 9 ?

2 3 4 5 6 7 8 9 10 4 23.2 37 49 59 69 79 89 97 106
5 14.9 22 28 33 38 42 46 50 54
6 11.1 15.5 19.1 22 25 27 30 32 34
7 8.89 12.1 14.5 16.5 18.4 20 22 23 24
8 7.50 9.9 11.7 13.2 14.5 15.8 16.9 17.9 18.9
9 6.54 8.5 9.9 11.1 12.1 13.1 13.9 14.7 15.3
10 5.85 7.4 8.6 9.6 10.4 11.1 11.8 12.4 12.9
12 4.91 6.1 6.9 7.6 8.2 8.7 9.1 9.5 9.9
15 4.07 4.9 5.5 6.0 6.4 6.7 7.1 7.3 7.5
20 3.32 3.8 4.3 4.6 4.9 5.1 5.3 5.5 5.6
30 2.63 3.0 3.3 3.4 3.6 3.7 3.8 3.9 4.0
60 1.96 2.2 2.3 2.4 2.4 2.5 2.5 2.6 2.6
K = number of variances
dfFMAX

Chapter 13 42
CPE 14.2.1
Number Subjects Critical valueDesign of Means in larger NG of FMAX
2X4 8 21 5.3 2X2 4 16 5.5 3X3 9 11 12.4 2X3 6 9 ?

2 3 4 5 6 7 8 9 10 4 23.2 37 49 59 69 79 89 97 106
5 14.9 22 28 33 38 42 46 50 54
6 11.1 15.5 19.1 22 25 27 30 32 34
7 8.89 12.1 14.5 16.5 18.4 20 22 23 24
8 7.50 9.9 11.7 13.2 14.5 15.8 16.9 17.9 18.9
9 6.54 8.5 9.9 11.1 12.1 13.1 13.9 14.7 15.3
10 5.85 7.4 8.6 9.6 10.4 11.1 11.8 12.4 12.9
12 4.91 6.1 6.9 7.6 8.2 8.7 9.1 9.5 9.9
15 4.07 4.9 5.5 6.0 6.4 6.7 7.1 7.3 7.5
20 3.32 3.8 4.3 4.6 4.9 5.1 5.3 5.5 5.6
30 2.63 3.0 3.3 3.4 3.6 3.7 3.8 3.9 4.0
60 1.96 2.2 2.3 2.4 2.4 2.5 2.5 2.6 2.6
K = number of variances
dfFMAX

Chapter 13 44
CPE 14.2.1
Number Subjects Critical valueDesign of Means in larger NG of FMAX
2X4 8 21 5.3 2X2 4 16 5.5 3X3 9 11 9.5 2X3 6 9 14.5

Chapter 13 45
Example – other way
Design2X42X3 2X23X3
Numberof Means
8???
MSG
max18.226.334.218.0
MSG
min1.12.04.60.5
FMAX
16.5???
Subjects inlarger NG
1012217
dfFMAX
9???
p.01.01???
649
11206
13.27.4
36.0

2 3 4 5 6 7 8 9 10 4 23.2 37 49 59 69 79 89 97 106
5 14.9 22 28 33 38 42 46 50 54
6 11.1 15.5 19.1 22 25 27 30 32 34
7 8.89 12.1 14.5 16.5 18.4 20 22 23 24
8 7.50 9.9 11.7 13.2 14.5 15.8 16.9 17.9 18.9
9 6.54 8.5 9.9 11.1 12.1 13.1 13.9 14.7 15.3
10 5.85 7.4 8.6 9.6 10.4 11.1 11.8 12.4 12.9
12 4.91 6.1 6.9 7.6 8.2 8.7 9.1 9.5 9.9
15 4.07 4.9 5.5 6.0 6.4 6.7 7.1 7.3 7.5
20 3.32 3.8 4.3 4.6 4.9 5.1 5.3 5.5 5.6
30 2.63 3.0 3.3 3.4 3.6 3.7 3.8 3.9 4.0
60 1.96 2.2 2.3 2.4 2.4 2.5 2.5 2.6 2.6
k = number of variances
dfFMAX
FMAX(6,11) = 13.2
p.01

Chapter 13 47
Design2X42X3 2X23X3
Numberof Means
8???
MSG
max18.226.334.218.0
MSG
min1.12.04.60.5
FMAX
16.513.27.4
36.0
Subjects inlarger NG
1012217
dfFMAX
911206
p.01.01.01??
649

2 3 4 5 6 7 8 9 10 4 23.2 37 49 59 69 79 89 97 106
5 14.9 22 28 33 38 42 46 50 54
6 11.1 15.5 19.1 22 25 27 30 32 34
7 8.89 12.1 14.5 16.5 18.4 20 22 23 24
8 7.50 9.9 11.7 13.2 14.5 15.8 16.9 17.9 18.9
9 6.54 8.5 9.9 11.1 12.1 13.1 13.9 14.7 15.3
10 5.85 7.4 8.6 9.6 10.4 11.1 11.8 12.4 12.9
12 4.91 6.1 6.9 7.6 8.2 8.7 9.1 9.5 9.9
15 4.07 4.9 5.5 6.0 6.4 6.7 7.1 7.3 7.5
20 3.32 3.8 4.3 4.6 4.9 5.1 5.3 5.5 5.6
30 2.63 3.0 3.3 3.4 3.6 3.7 3.8 3.9 4.0
60 1.96 2.2 2.3 2.4 2.4 2.5 2.5 2.6 2.6
k = number of variances
dfFMAX
FMAX(4,20) = 7.4
p.01

Chapter 13 49
Design2X42X3 2X23X3
Numberof Means
8???
MSG
max18.226.334.218.0
MSG
min1.12.04.60.5
FMAX
16.513.27.4
36.0
Subjects inlarger NG
1012217
dfFMAX
911206
p.01.01.01.01?
649

2 3 4 5 6 7 8 9 10 4 23.2 37 49 59 69 79 89 97 106
5 14.9 22 28 33 38 42 46 50 54
6 11.1 15.5 19.1 22 25 27 30 32 34
7 8.89 12.1 14.5 16.5 18.4 20 22 23 24
8 7.50 9.9 11.7 13.2 14.5 15.8 16.9 17.9 18.9
9 6.54 8.5 9.9 11.1 12.1 13.1 13.9 14.7 15.3
10 5.85 7.4 8.6 9.6 10.4 11.1 11.8 12.4 12.9
12 4.91 6.1 6.9 7.6 8.2 8.7 9.1 9.5 9.9
15 4.07 4.9 5.5 6.0 6.4 6.7 7.1 7.3 7.5
20 3.32 3.8 4.3 4.6 4.9 5.1 5.3 5.5 5.6
30 2.63 3.0 3.3 3.4 3.6 3.7 3.8 3.9 4.0
60 1.96 2.2 2.3 2.4 2.4 2.5 2.5 2.6 2.6
K = number of variances
dfFMAX
FMAX(9,6) = 36.0
p.01

Chapter 13 51
Answers to examples
Design2X42X3 2X23X3
Numberof Means
8???
MSG
max18.226.334.218.0
MSG
min1.12.04.60.5
FMAX
16.513.27.4
36.0
Subjects inlarger NG
1012217
dfFMAX
911206
p.01.01.01.01.01
649
You cannot use theF test for any of these
experiments!

Chapter 13 52
Homogeneity of Variance Conclusions
If FMAX is significant, then the assumptionof homogeneity of variance has beenviolated.
If the assumption of homogeneity of varianceis violated, then we cannot use parametric statistics.

Chapter 13 53

Chapter 13 54
Assumption
Our last assumption that we must meet to use parametric statistics is that the measures in our experiment use an interval scale.
An interval scale is a set of numbers whose differences are equal at all points along the scale.

Chapter 13 55
Examples of Interval Scales
Integers - 1,2,3,4,…
Real numbers - 1.0, 1.1, 1.2, 1.3,…
Time - 1 minute, 2 minutes, 3 minutes, …
Distance - 1 foot, 2 feet, 3 feet, 4 feet, …

Chapter 13 56
Examples of Non-Interval Scales
Ordinal - ranks, such as first, second, third; high medium low; etc. The difference in time between first and
second can be very different from the time between second and third.
The median is the best measure of central tendency for ordinal data.

Chapter 13 57
Examples of Non-Interval Scales
Nominal - categories, such as, male, female; pass, fail.
There is not even an order for nominal data.
Categories should be mutually exclusive and exhaustive.
The best measure of central tendency is the mode.

Chapter 13 58
Comparing Scales
Interval scales have more information than ordinal scales, which in turn have more information than nominal scales.
The more information that is available, the more sensitive that a given statistical test can be.

Chapter 13 59
Book Example - test grades
Interval ScaleSCORES
9884777675626160
Ordinal ScaleRANKS
12345678
Nominal ScalePass/Fail
PPPPPFFF

Chapter 13 60
Book Example - test grades
Interval ScaleSCORES
9884777675626160
Ordinal ScaleRANKS
12345678
Nominal ScalePass/Fail
PPPPPFFF
Ordinal scales show the relative order of individual measures.
However, there is no information about how far apart individuals are.

Chapter 13 61
Book Example - test grades
Interval ScaleSCORES
9884777675626160
Ordinal ScaleRANKS
12345678
Nominal ScalePass/Fail
PPPPPFFF
Categories are mutually exclusive; you either pass or fail.
Categories are exhaustive; you can only pass or fail.

Chapter 13 62
Interval Scale Conclusion Parametric tests can only be performed on interval data. Non-parametric tests must be used on ordinal and nominal
data. Researchers prefer parametric tests because more
information is available, which makes it easier to find: Significant differences between experimental group
means or Significant correlations between two variables.
If any assumptions are violated, it is common practice to convert from the interval scale to another scale. Then you can use the weaker, non-parametric statistics.
There are non-parametric statistics that correspond to all of the parametric statistics that we have studied.

Chapter 13 63
Summary - Assumptions
Subjects are randomly selected from the population.
Experimental error is randomly distributed across samples in the design.
The distribution of sample means fit a normal curve.
There is homogeneity of variance demonstrated by using FMAX.
The measures we take are on an interval scale.
To use parametric statistics, it must be true that: