chapter 14 inferential data analysis. inferential statistics techniques that allow us to study...
TRANSCRIPT

Chapter 14
Inferential Data Analysis

Inferential Statistics
Techniques that allow us to study samples and then make generalizations about the population. Inferential statistics are a very crucial part of scientific research in that these techniques are used to test hypotheses

Uses for Inferential Statistics
Statistics for determining differences between experimental and control groups in experimental research
Statistics used in descriptive research when comparisons are made between different groups
These statistics enable the researcher to evaluate the effects of an independent variable on a dependent variable
Sampling Error
Differences between a sample statistic and a population parameter because the sample is not perfectly representative of the population

Hypothesis Testing
The purpose of the statistical test is to evaluate the null hypothesis (H0) at a specified level of
significance (e.g., p < .05) In other words, do the treatment effects differ
significantly so that these differences would be attributable to chance occurrence less than 5 times in 100?

Hypothesis Testing Procedures
State the hypothesis (H0) Select the probability level (alpha) Determine the value needed for significance Calculate the test statistic Accept or reject H0

Statistical Significance
A statement in the research literature that the statistical test was significant indicates that the value of the calculated statistic warranted rejection of the null hypothesis For a difference question, this suggests a real
difference and not one due to sampling error

Parametric Statistics
Techniques which require basic assumptions about the data, for example:
normality of distribution homogeneity of variance requirement of interval or ratio data
Most prevalent in HHP Many statistical techniques are considered robust to
violations of the assumptions, meaning that the outcome of the statistical test should still be considered valid

t-tests
Characteristics of t-tests requires interval or ratio level scores used to compare two mean scores easy to compute pretty good small sample statistic

Types of t-test
One-Group t-test t-test between a sample and population mean
Independent Groups t-test compares mean scores on two independent samples
Dependent Groups (Correlated) t-test compares two mean scores from a repeated
measures or matched pairs design most common situation is for comparison of pretest
with posttest scores from the same sample

Hypothesis Testing Errors
Hypothesis testing decisions are made without direct knowledge of the true circumstance in the population. As a result, the researcher’s decision may or may not be correct
Type I Error Type II Error

Type I Error
. . . is made when the researcher rejects the null hypothesis when in fact the null hypothesis is true
probability of committing Type I error is equal to the significance (alpha) level set by the researcher
thus, the smaller the alpha level the lower the chance of committing a Type I error

Type II Error
. . . occurs when the researcher accepts the null hypothesis, when in fact it should have been rejected
probability is equal to beta (B) which is influenced by several factors
inversely related to alpha level increasing sample size will reduce B
Statistical Power – the probability of rejecting a false null hypothesis
Power = 1 – beta Decreasing probability of making a Type II error
increases statistical power
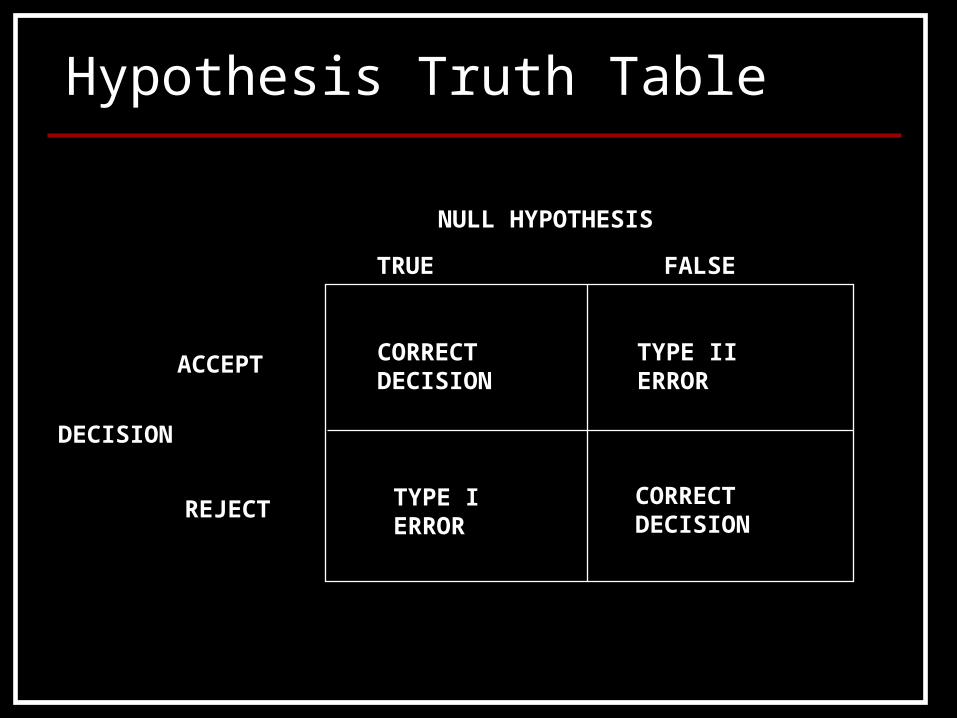
Hypothesis Truth Table
CORRECT DECISION
CORRECT DECISION
TYPE IIERROR
TYPE IERROR
NULL HYPOTHESIS
TRUE FALSE
ACCEPT
REJECT
DECISION

ANOVA - Analysis of Variance
A commonly used family of statistical tests that may be considered a logical extension of the t-test requires interval or ratio level scores used for comparing 2 or more mean scores maintains designated alpha level as compared to
experimentwise inflation of alpha level with multiple t-tests
may also test more than 1 independent variable as well as interaction effect

One-way ANOVA
Extension of independent groups t-test, but may be used for evaluating differences among 2 or more groups

Repeated Measures ANOVA
Extension of dependent groups t-test, where each subject is measured on 2 or more occasions a.k.a “within subjects design”
Test of sphericity assumption is recommended

Random Blocks ANOVA
This is an extension of the matched pairs t-test when there are three or more groups or the same as the matched pairs t-test when there are two groups
Participants similar in terms of a variable are placed together in a block and then randomly assigned to treatment groups

Factorial ANOVA
This is an extension of the one-way ANOVA for testing the effects of 2 or more independent variables as well as interaction effects Two-way ANOVA (e.g., 3 X 2 ANOVA) Three-way ANOVA (e.g., 3 X 3 X 2 ANOVA)

Assumptions of Statistical Tests
Parametric tests are based on a variety of assumptions, such as Interval or ratio level scores Random sampling of participants Scores are normally distributed
N = 30 considered minimum by some Homogeneity of variance Groups are independent of each other Others
Researchers should try to satisfy assumptions underlying the statistical test being used

Improving the Probability of Meeting Assumptions
Utilize a sample that is truly representative of the population of interest
Utilize large sample sizes Utilize comparison groups that have about the
same number of participants

Two-Group Comparison Tests
a.k.a. Multiple Comparison or Post Hoc Tests The various ANOVA tests are often referred
to as “omnibus” tests because they are used to determine if the means are different but they do not specify the location of the difference if the null hypothesis is rejected, meaning that
there is a difference among the mean scores, then the researcher needs to perform additional tests in order to determine which means (groups) are actually different

Common Post Hoc Tests
Multiple comparison (post hoc) tests are used to make specific comparisons following a significant finding from ANOVA in order to determine the location of the difference Duncan Tukey Bonferroni Scheffe
Note that post hoc tests are only necessary if there are more than two levels of the independent variable

Analysis of Covariance
ANOVA ANOVA design which statistically adjusts the
difference among group means to allow for the fact that the groups differ on some other variable frequently used to adjust for inequality of groups at
the start of a research study

Nonparametric Statistics
Considered assumption free statistics Appropriate for nominal and ordinal data or in
situations where very small sample sizes (n < 10) would probably not yield a normal distribution of scores
Less statistical power than parametric statistics
Chi Square
A nonparametric test used with nominally scaled data which are common with survey research The statistic is used when the researcher is
interested in the number of responses, objects, or people that fall in two or more categories

Single Sample Chi-Square
a.k.a one-way chi-square or goodness of fit chi-square
Used to test the hypothesis that the collected data (observed scores) fits an expected distribution i.e. are the observed frequencies and expected
frequencies for a questionnaire item in agreement with each other?

Independent Groups Chi-Square
a.k.a. two-way chi-square or contingency table chi-square
Used to test if there is a significant relationship (association) between two nominally scaled variables
In this test we are comparing two or more patterns of frequencies to see if they are independent from each other
Overview of Multivariate Tests
Univariate statistic – used in situations where each participant contributed
one score to the data analysis, or in the case of a repeated measures design, one score per cell
Multivariate statistic – used in situations where each participant contributes
multiple scores

Example Multivariate Tests
MANOVA Canonical correlation Discriminant analysis Factor analysis

Multiple Analysis of Variance
MANOVA Analogous to ANOVA except that there are
multiple dependent variables Represents a type of multivariate test

Prediction and Regression Analysis
Correlational technique Simple prediction
Predicting an unknown score (Y) based on a single predictor variable (X)
Y’ = bX + c
Multiple prediction Involves more than one predictor variable Y’ = b1X1 + b2X2 + c

Multiple Regression/Prediction
a.k.a multiple correlation Determines the relationship between one
dependent variable and 2 or more predictor variables
Used to predict performance on one variable from another Y’ = b1X1 + b2X2 + c
Standard error of prediction is an index of accuracy of the prediction
Statistical Power
The probability that the statistical test will correctly reject a false null hypothesis . . . it is effectively the probability of finding
significance, that the experimental treatment actually does have an effect
a researcher would like to have a high level of power

Statistical Power
alpha = probability of a Type I error rejecting a true null hypothesis this is your significance level
beta = probability of a Type II error failing to reject a false null hypothesis
Statistical power = 1 - beta
Factors Affecting Power
Alpha level Sample size Effect size One-tailed or two-tailed test

Alpha level
Reducing the alpha level (moving from .05 to .01) will reduce the power of a statistical test. This makes it harder to reject the null hypothesis

Sample size
In general, the larger the sample size the greater the power. This is because the standard error of the mean decreases as the sample size increases

One-tailed versus two-tailed tests
It is easier to reject the null hypothesis using a one-tailed test than a two-tailed test because the critical region is larger

Effect size
This is an indication of the size of the treatment effect, its meaningfulness
With a large effect size, it will be easy to detect differences and statistical power will be high
But, if the treatment effect is small, it will be difficult to detect differences and power will be low

Effect Size
Numerous authors have indicated the need to estimate the magnitude of differences between groups as well as to report the significance of the effects
One way to describe the strength of a treatment effect, or meaningfulness of the findings, is the computation of “effect size” (ES)
ES = M1 - M2
SD
Note: SD represents the standard deviation of the control group or the pooled standard deviation if there is no control group

Effect Size
Interpretation of ES by Cohen (1988) 0.2 represents a small ES 0.5 represents a moderate ES 0.8 represents a large ES
Researchers using experimental designs are advised to provide post hoc estimates of ES for any significant findings as a way to evaluate the meaningfulness

A Priori Procedures
Calculate the power for each of the statistical procedures to be applied requires three indices - alpha, sample size, effect
size
Estimate the sample size needed to detect a certain effect (ES) given a specific alpha and power may require an estimation of ES from previous
published studies or from a pilot study