chapter 14: optimizing windows 2000 - bur.stshwell/training/ms/2000/2751c14.pdf660 chapter 14...
TRANSCRIPT

Chapter
14
Optimizing Windows 2000
MICROSOFT EXAM OBJECTIVES COVERED IN THIS CHAPTER
�
Deploy service packs.
�
Optimize and troubleshoot performance of the Windows 2000
Professional desktop.
�
Optimize and troubleshoot memory performance. �
Optimize and troubleshoot processor utilization. �
Optimize and troubleshoot disk performance. �
Optimize and troubleshoot network performance. �
Optimize and troubleshoot application performance.
�
Configure, manage, and troubleshoot the Task Scheduler.

T
o have an optimized system, you must monitor its perfor-mance. The two tools for monitoring Windows 2000 Professional are Sys-tem Monitor and Performance Logs and Alerts. With these tools, you can track memory, processor activity, the disk subsystem, the network sub-system, and other computer subsystems.
You can make your administrative tasks easier by automating some of them. You can schedule system tasks by using the Scheduled Task Wizard.
This chapter begins with discussions of the Windows Update utility and ser-vice packs. Then you will learn how to monitor and optimize Windows 2000 Professional using the System Monitor, Performance Logs and Alerts, and Task Manager utilities. You will also learn how to optimize application performance.
Keeping Windows 2000 Up-to-Date
A
n optimal operating system is one that is running the most up-to-date software and has had the most recent service pack installed. Microsoft pro-vides the Windows Update utility to help you obtain updated Windows 2000 software. Microsoft issues service packs as necessary to update the operating system with bug fixes and new features.
Using the Windows Update Utility
The
Windows Update
utility connects your computer to Microsoft’s Web site and checks your files to make sure that you have all of the latest and greatest updates.

Keeping Windows 2000 Up-to-Date
657
To use Windows Update, you must first have a valid Internet connection. Then simply choose Start �
Windows Update to go to the correct URL for updates.
For product updates, click the Product Updates option on the home page and follow the directions to choose which files you want to update. The files in the update section are arranged by the following categories:
�
Critical updates
�
Picks of the month
�
Recommended updates
�
Additional Windows features
�
Device drivers
Within each category, you will see the available updates, along with a description, file size, and download time estimate for each update. Just check the files you want to update and click the Download icon to download your selections.
Using Windows Service Packs
Service packs
are used to deliver bug fixes (and sometimes new features) to Windows operating systems. Windows 2000 offers a new technology for service packs called
slipstream
. With slipstream technology, service packs are applied once, and they are not overwritten as new services are added to the computer. This means that you should not need to reapply service packs after new services are added, which sometimes was required when Windows NT 4 service packs were applied.
You can determine if any service packs have been installed on your com-puter by using the
WINVER
command. To issue this command, select Start �
Programs �
Accessories �
Command Prompt. In the Command Prompt dia-log box, type
WINVER
and press Enter. You will see a dialog box that shows which service packs are currently installed.
�
MicrosoftExam
Objective
Deploy service packs.

658
Chapter 14 �
Optimizing Windows 2000
Using System Monitoring Tools
B
efore you can optimize the performance of Windows 2000 Profes-sional, you must monitor critical subsystems to determine how your system is currently performing and what (if anything) is causing system bottlenecks. Windows 2000 Professional ships with two tools that you can use to track and monitor system performance: the System Monitor utility and the Perfor-mance Logs and Alerts utility.
You can access the monitoring tools by adding the System Monitor snap-in and the Performance Logs and Alerts snap-in to the MMC. The System Monitor snap-in is added as an ActiveX control.
In Exercise 14.1, you will create a management console for monitoring system performance.
�
MicrosoftExam
Objective
Optimize and troubleshoot performance of the Windows 2000
Professional desktop.
�
Optimize and troubleshoot memory performance.
�
Optimize and troubleshoot processor utilization.
�
Optimize and troubleshoot disk performance.
�
Optimize and troubleshoot network performance.
E X E R C I S E 1 4 . 1
Creating a Management Console for Monitoring System Performance
1.
Select Start �
Run, type
MMC
in the Run dialog box, and click the OK button.
2.
Select Console �
Add/Remove Snap-in.
3.
In the Add/Remove Snap-in dialog box, click the Add button. In the Add Standalone Snap-in dialog box, select ActiveX Control and click the Add button.
4.
In the Insert ActiveX Control dialog box, click the Next button.

Using System Monitoring Tools
659
In Windows NT 4, the functions of the System Monitor utility and the Perfor-mance Logs and Alerts utility were implemented in the Performance Monitor
utility.
Now that you’ve added the monitoring tools to the MMC, you can use them to monitor and optimize Windows 2000. The following sections describe how to evaluate your system’s current performance; how to use Sys-tem Monitor and Performance Logs and Alerts; and how to monitor and optimize the system memory, processor, disk subsystem, and network sub-system.
Determining System Performance
The monitoring tools allow you to assess your server’s current health and determine what it requires to improve its present condition. With System Monitor and Performance Logs and Alerts, you can perform the following tasks:
�
Create baselines.
�
Identify system bottlenecks.
5.
In the Insert ActiveX Control dialog box, select System Monitor Control and click the Next button. Click the Finish button.
6.
In the Add Standalone Snap-in dialog box, click the Close button.
7.
In the Add/Remove Snap-in dialog box, click the Add button. In the Add Standalone Snap-in dialog box, select Performance Logs and Alerts and click the Add button, then click the Close button.
8.
In the Add/Remove Snap-in dialog box, click the OK button.
9.
Select Console �
Save As.
10.
In the Save As dialog box, select Save in Administrative Tools (the default selection) and save the file as
Monitor
.
You can now access this console by selecting Start �
Programs �
Administrative Tools �
Monitor.
E X E R C I S E 1 4 . 1
( c o n t i n u e d )

660 Chapter 14 � Optimizing Windows 2000
� Determine trends.
� Create alert thresholds.
Each of these tasks is discussed in the following sections.
Creating Baselines
A baseline is a snapshot of how your system is currently performing. Sup-pose that your computer’s hardware has not changed over the last six months, but the computer seems to be performing more slowly now than it did six months ago. If you have been using the Performance Logs and Alerts utility and taking baseline logs, as well as noting the changes in your workload, you can more easily determine what resources are causing the system to slow down.
You should create baselines at the following times:
� When the system is first configured without any load
� At regular intervals of typical usage
� Whenever any changes are made to the system’s hardware or software configuration
Baselines are particularly useful for determining the effect of changes that you make to your computer. For example, if you are adding more memory to your computer, you should take baselines before and after you install the memory to determine the effect of the change. Along with hardware changes, system configuration modifications also can affect your computer’s perfor-mance, so you should create baselines before and after you make any changes to your Windows 2000 Professional configuration.
For the most part, Windows 2000 Professional is a self-tuning operating sys-tem. If you decide to tweak the operating system, you should take baselines before and after each change. If you do not notice a performance gain after the tweak, you should consider returning the computer to its original configura-tion, because some tweaks may cause more problems than they solve.
You create baselines by using the Performance Logs and Alerts utility to create a baseline counters log file. This process is described in the “Creating Baseline Reports” section later in this chapter.

Using System Monitoring Tools 661
Identifying System Bottlenecks
A bottleneck is a system resource that is inefficient compared with the rest of the computer system as a whole. The bottleneck can cause the rest of the sys-tem to run slowly.
You need to pinpoint the cause of a bottleneck in order to correct it. Con-sider a system that has a Pentium 166 processor with 64MB of RAM. If your applications are memory-intensive, and lack of memory is your bottleneck, then upgrading your processor will not eliminate the bottleneck.
By using System Monitor, you can measure the performance of the vari-ous parts of your system, which allows you to identify system bottlenecks in a scientific manner. You will learn how to set counters to monitor your net-work and spot bottlenecks in the “Using System Monitor” section later in this chapter.
Determining Trends
Many of us tend to manage situations reactively instead of proactively. With reactive management, you focus on a problem when it occurs. With proac-tive management, you take steps to avoid the problem before it happens. In a perfect world, all management would be proactive.
System Monitor and Performance Logs and Alerts are great tools for pro-active network management. If you are creating baselines on a regular basis, you can identify system trends. For example, if you notice average CPU uti-lization increasing 5 percent every month, you can assume that within the next six months, you’re going to have a problem. Before performance becomes so slow that your system is not responding, you can upgrade the hardware.
Using Alerts for Problem Notification
The Performance Logs and Alerts utility provides another tool for proactive management in the form of alerts. Through Performance Logs and Alerts, you can specify alert thresholds (when a counter reaches a specified value) and have the utility notify you when these thresholds are reached.
For example, you could specify that if your logical disk has less than 10 percent of free space, you want to be notified. Once alerted, you can add more disk space or delete unneeded files before you run out of disk space. You will learn how to create alerts in the “Using Performance Logs and Alerts” section later in this chapter.
662 Chapter 14 � Optimizing Windows 2000
Using System Monitor
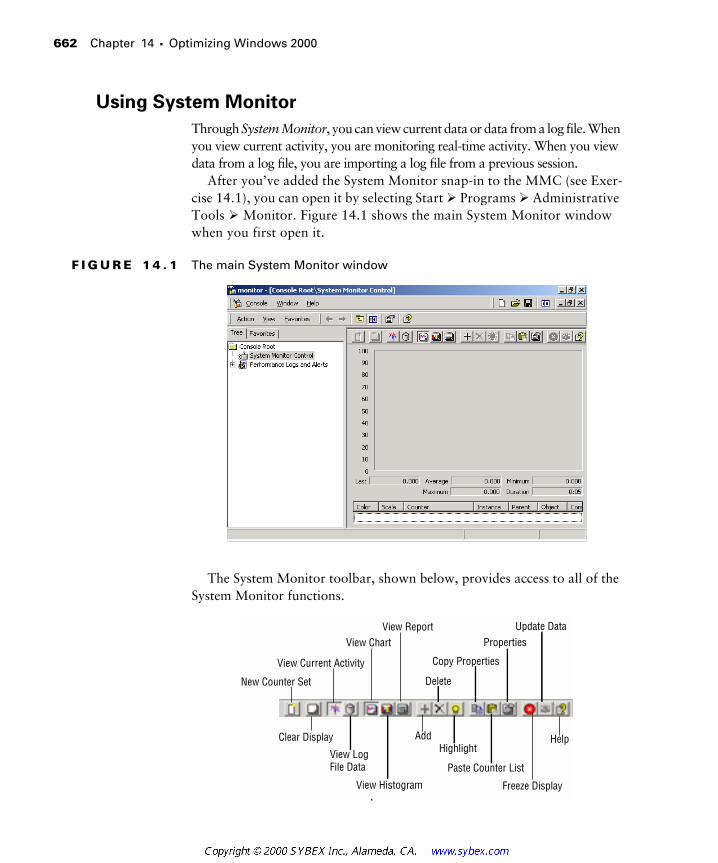
Through System Monitor, you can view current data or data from a log file. When you view current activity, you are monitoring real-time activity. When you view data from a log file, you are importing a log file from a previous session.
After you’ve added the System Monitor snap-in to the MMC (see Exer-cise 14.1), you can open it by selecting Start � Programs � Administrative Tools � Monitor. Figure 14.1 shows the main System Monitor window when you first open it.
F I G U R E 1 4 . 1 The main System Monitor window
The System Monitor toolbar, shown below, provides access to all of the System Monitor functions.
New Counter Set
Clear Display
View Log File Data
View Current Activity
View Chart
View Histogram
View Report
Add
Delete
Copy Properties
Paste Counter List
Properties
Freeze Display
Update Data
HelpHighlight

Using System Monitoring Tools 663
When you first start System Monitor, you will notice that nothing is tracked by default. In order for System Monitor to be useful, you must con-figure it to track some type of system activity, which is done by adding counters, as described shortly. After you’ve added counters, they will be listed at the bottom of the System Monitor window. The fields just above the counter list will contain data, based on the counter that is highlighted in the list, as follows:
� The Last field displays the most current data.
� The Average field shows the average of the counter.
� The Minimum field shows the lowest value that has been recorded for the counter.
� The Maximum field shows the highest value that has been recorded for the counter.
� The Duration field shows how long the counter has been tracking data.
The following sections describe the three System Monitor views, how to add counters to track data, and how to configure System Monitor properties.
Selecting the Appropriate View
By clicking the appropriate button on the System Monitor toolbar, you can see your data in three views:
Chart view The chart view, shown in Figure 14.2, is the default view used with System Monitor. This view is useful for viewing a small number of counters in a graphical format. The main advantage of chart view is that you can see how the data has been tracked during the defined time period. When you start to track a large number of counters, it can be dif-ficult to view the data in chart form.
Histogram view The histogram view, shown in Figure 14.3, shows Sys-tem Monitor data in bar graph form. This view is useful for viewing large amounts of data. However, it only shows performance for the current period. You do not see a record of performance over time, as you do with the chart view.
Report view The report view, shown in Figure 14.4, is used to list all of the counters that are being tracked through System Monitor in a logical report. The data that is displayed is for the current session. Watching these numbers in real time is like watching someone on a pogo stick, because the numbers are constantly jumping up and down. The advantage

664 Chapter 14 � Optimizing Windows 2000
of this view is that it allows you to easily track large numbers of counters in a real-time manner.
F I G U R E 1 4 . 2 The chart view in System Monitor
F I G U R E 1 4 . 3 The histogram view in System Monitor

Using System Monitoring Tools 665
F I G U R E 1 4 . 4 The report view in System Monitor
Adding Counters
To use System Monitor, you must add counters. To add counters, use the fol-lowing steps:
1. In System Monitor, click the Add button on the toolbar. This brings up the Add Counters dialog box, as shown in Figure 14.5.
To see information about a specific counter, select it and click the Explain button in the upper-right corner of the Add Counters dialog box. System Mon-itor will display text regarding the highlighted counter.
F I G U R E 1 4 . 5 The Add Counters dialog box

666 Chapter 14 � Optimizing Windows 2000
2. In the Add Counters dialog box, select the Use Local Computer Counters (the default) radio button to monitor the local computer. Alternatively, select the Select Counters from Computer radio button and choose a computer from the drop-down list to select counters from a specific computer. You can monitor remote computers if you have Administrative permissions. This option is useful when you do not want the overhead of System Monitor running on the computer you are trying to monitor.
3. Select the performance object from the drop-down list. All Win-dows 2000 system resources are tracked as performance objects, such as Cache, Memory, Paging File, Process, and Processor. The sum of all objects represents your total system. Some performance objects exist on all Windows 2000 computers; other objects appear only if specific processes or services are running. For example, if you want to track how busy the physical disk is, choose the PhysicalDisk performance object.
4. Select the All Counters radio button to track all the associated counters, or select the Select Counters from List radio button and choose specific counters from the list box below. Each performance object has an associated set of counters. Counters are used to track specific information regarding a performance object. For example, for the PhysicalDisk performance object, there is a %Disk Time counter, which will tell you how busy a disk has been servicing read and write requests. PhysicalDisk also has %Disk Read Time and %Disk Write Time counters, which will show you what percentage of disk requests are read requests and what percentage of disk requests are write requests, respectively.
You can select multiple counters of the same performance object by Shift+clicking contiguous counters or Ctrl+clicking noncontiguous counters.
5. Select the All Instances radio button to track all the associated instances, or select the Select Instances from List radio button and choose specific instances from the list box below. An instance is a mechanism that allows you to track how a specific object is perform-ing if you have more than one item associated with a specific perfor-mance object. For example, suppose that your computer has two

Using System Monitoring Tools 667
physical drives. When you track the PhysicalDisk performance object, you can track both of your drives, or you could track drive 0 and drive 1 separately.
6. Click the Add button to add the counters for the performance object.
7. Repeat steps 2 through 6 to specify any additional counters you want to track. When you are finished, click the Close button.
After you’ve added counters, you can select a specific counter by high-lighting it in System Monitor. To highlight a counter, click it and then click the Highlight button on the System Monitor toolbar. Alternatively, you can highlight a counter by selecting it and pressing Ctrl+H.
To remove a counter, highlight the counter in System Monitor and click the Delete button on the System Monitor toolbar.
Managing System Monitor Properties
To configure the System Monitor properties, click the Properties button on the System Monitor toolbar. This brings up the System Monitor Properties dialog box, as shown in Figure 14.6. This dialog box has six tabs: General, Source, Data, Graph, Colors, and Fonts. The properties you can configure on each of these tabs are described in the following sections.
F I G U R E 1 4 . 6 The General tab of the System Monitor Properties dialog box

668 Chapter 14 � Optimizing Windows 2000
General Properties
The General tab of the System Monitor Properties dialog box (see Figure 14.6) contains the following options:
� The view that will be displayed: graph, histogram, or report
� The display elements that will be used: legend, value bar, and/or toolbar
� The data that will be displayed: default (for reports or histograms this is current data; for logs, this is average data), current, average, mini-mum, or maximum
� The appearance, either flat or 3D
� The border, either none or fixed single
� How often the data is updated, in seconds
� Whether duplicate counter instances are allowed
Source Properties
The Source tab, shown in Figure 14.7, allows you to specify the data source. This can be current activity, or it can be data that has been collected in a log file. If you import data from a log file, you can specify the time range that you wish to view.
F I G U R E 1 4 . 7 The Source tab of the System Monitor Properties dialog box

Using System Monitoring Tools 669
Data Properties
The Data tab, shown in Figure 14.8, lets you specify the counters that you wish to track. You can add and remove counters by clicking the Add and Remove buttons. You can also select a specific counter and define the color, scale, width, and style that is used to represent the counter in the graph.
F I G U R E 1 4 . 8 The Data tab of the System Monitor Properties dialog box
Graph Properties
The Graph tab, shown in Figure 14.9, contains the following options, which can be applied to the chart or histogram view:
� A title
� A vertical axis label
� Whether you will show a vertical grid, a horizontal grid, and/or verti-cal scale numbers
� The minimum and maximum numbers for the vertical scale

670 Chapter 14 � Optimizing Windows 2000
F I G U R E 1 4 . 9 The Graph tab of the System Monitor Properties dialog box
Color and Font Properties
The Colors and Fonts tabs of the System Monitor Properties dialog box have options for customizing the appearance of the System Monitor display. In the Colors tab, you can choose the colors that will be used by System Mon-itor. In the Fonts, tab, you can choose the fonts that System Monitor will use.
Using Performance Logs and Alerts
Through Performance Logs and Alerts, you can create counter logs and trace logs, and you can define alerts. After you’ve created logs, you can view the log files with the System Monitor, as described in the previous section.
After you’ve added the Performance Logs and Alerts snap-in to the MMC (see Exercise 14.1), you can open it by selecting Start � Programs � Administrative Tools � Monitor and clicking Performance Logs and Alerts. Figure 14.10 shows the expanded Performance Logs and Alerts snap-in. From here, you can define new counter logs, trace logs, and alerts, as described in the following sections.

Using System Monitoring Tools 671
F I G U R E 1 4 . 1 0 The expanded Performance Logs and Alerts snap-in
Creating a Counter Log
Counter logs record data about hardware usage and the activity of system services. You can configure logging to occur manually or on a predefined schedule.
To create a counter log, take the following steps:
1. Expand Performance Logs and Alerts, right-click Counter Logs, and select New Log Settings from the pop-up menu.
2. The New Log Settings dialog box appears, as shown in Figure 14.11. Type in a name for the log file. For example, you might give the log a name that indicates its type and the date (Countermmddyy). Then click the OK button.
F I G U R E 1 4 . 1 1 The New Log Settings dialog box

672 Chapter 14 � Optimizing Windows 2000
3. The counter log file Properties dialog box appears. You can configure counter log properties as follows:
� In the General tab, shown in Figure 14.12, you can specify the counters you want to track in the log and the interval for sampling data. Click the Add button to add counters.
F I G U R E 1 4 . 1 2 The General tab of the counter log file Properties dialog box
� In the Log Files tab, shown in Figure 14.13, you can configure the loca-tion of the log file, the filename, the log file type, and the log file size.
F I G U R E 1 4 . 1 3 The Log Files tab of the counter log Properties dialog box
Using System Monitoring Tools 673
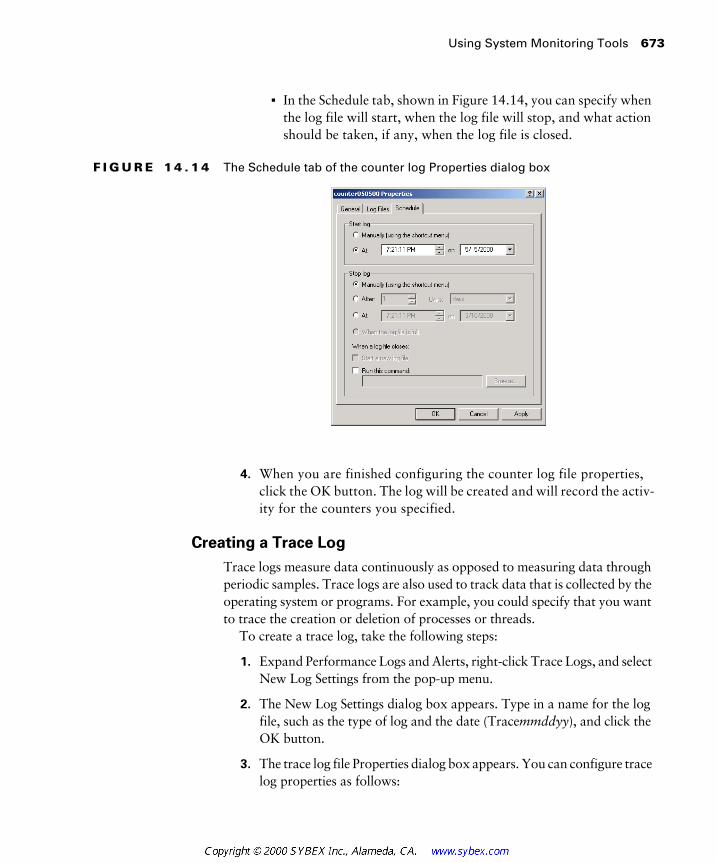
� In the Schedule tab, shown in Figure 14.14, you can specify when the log file will start, when the log file will stop, and what action should be taken, if any, when the log file is closed.
F I G U R E 1 4 . 1 4 The Schedule tab of the counter log Properties dialog box
4. When you are finished configuring the counter log file properties, click the OK button. The log will be created and will record the activ-ity for the counters you specified.
Creating a Trace Log
Trace logs measure data continuously as opposed to measuring data through periodic samples. Trace logs are also used to track data that is collected by the operating system or programs. For example, you could specify that you want to trace the creation or deletion of processes or threads.
To create a trace log, take the following steps:
1. Expand Performance Logs and Alerts, right-click Trace Logs, and select New Log Settings from the pop-up menu.
2. The New Log Settings dialog box appears. Type in a name for the log file, such as the type of log and the date (Tracemmddyy), and click the OK button.
3. The trace log file Properties dialog box appears. You can configure trace log properties as follows:

674 Chapter 14 � Optimizing Windows 2000
� In the General tab, shown in Figure 14.15, you can select which system events you want to track. For example, you can check the Process Creations/Deletions and Thread Creations/Deletions check boxes. You can also specify which system providers you want to track.
F I G U R E 1 4 . 1 5 The General tab of the trace log file Properties dialog box
� In the Log Files tab, shown in Figure 14.16, you can configure the location, filename, log file type, and log file size.
F I G U R E 1 4 . 1 6 The Log Files tab of the trace log file Properties dialog box

Using System Monitoring Tools 675
� In the Schedule tab, shown in Figure 14.17, you can configure when the log file will start, when the log file will stop, and what action should be taken, if any, when the log file is closed.
F I G U R E 1 4 . 1 7 The Schedule tab of the trace log file Properties dialog box
� In the Advanced tab, shown in Figure 14.18, you can configure the buffer settings for the log file. By default, the log service will save the trace file to memory and then transfer the data to the log file.
F I G U R E 1 4 . 1 8 The Advanced tab of the trace log file Properties dialog box

676 Chapter 14 � Optimizing Windows 2000
4. When you are finished configuring the trace file properties, click the OK button. The log will be created and will record the activity for the system events you specified.
Creating an Alert
Alerts can be generated when a specific counter exceeds or falls below a spec-ified value. You can configure alerts so that a message is sent, a program is run, or a more detailed log file is generated.
To create an alert, take the following steps:
1. Expand Performance Logs and Alerts, right-click Alerts, and select New Alert Settings from the pop-up menu.
2. The New Alert Settings dialog box appears. Type in a name for the alert file and click the OK button.
3. The alert file Properties dialog box appears. You can configure alert properties as follows:
� In the General tab, shown in Figure 14.19, you can select which counters you want to track. When you add a counter, you must specify that the alert be generated when the counter is under or over a certain value. You can also set the interval for sampling data.
F I G U R E 1 4 . 1 9 The General tab of the alert Properties dialog box

Using System Monitoring Tools 677
� In the Action tab, shown in Figure 14.20, specify what action should be taken if an alert is triggered. You can select to log an entry in the application event log, send a network message, start another performance data log, and/or run a specific program.
F I G U R E 1 4 . 2 0 The Action tab of the alert Properties dialog box
� In the Schedule tab, shown in Figure 14.21, you can configure when scans of the counters you have defined will start and stop.
F I G U R E 1 4 . 2 1 The Schedule tab of the alert Properties dialog box

678 Chapter 14 � Optimizing Windows 2000
4. When you are finished configuring the alert properties, click the OK button.
Monitoring and Optimizing Memory
When a program or process is required by the operating system, the first place it looks is physical memory. If the program or process is not in physical memory, the system will look in logical memory (the page file). If the pro-gram or process is not in logical memory, the system will need to retrieve the program or process from the hard disk. It has been estimated that it can take up to 1,000 times longer to access information from the hard disk than to access it from physical RAM.
Memory is the most likely cause of system bottlenecks. If you have no idea what is causing a system bottleneck, memory is usually a good place to start checking. To determine how memory is being used, there are two areas you need to examine:
� Physical memory, which is the physical RAM you have installed on your computer. You can’t have too much memory. It’s actually a good idea to have more memory than you think you will need just to be on the safe side. As you’ve probably noticed, each time you add or upgrade applications, you require more system memory.
� The page file, which is logical memory that exists on the hard drive. If you are using excessive paging (swapping between the page file and physical RAM), it’s a clear sign that you need to add more memory.
For example, suppose that the accounting department has just started using a new accounting application that runs on the accounting manager’s local computer. The accounting manager complains that this application is slow, and he says that he needs a new computer. You decide to use System Monitor to determine why the computer is responding so slowly. You see that the processor utilization is low, and that the system is using excessive paging. Based on this information, you determine that the account man-ager’s computer will work with the application, but it needs a memory upgrade.
In this book, we use the format performance object > counter. For example, Memory > Available MBytes denotes the Memory performance object and the Available MBytes counter.

Using System Monitoring Tools 679
The following are the three most important counters for monitoring memory:
� Memory > Available MBytes measures the amount of physical mem-ory that is available to run processes on the computer. If this number is less than 4MB, you should consider adding more memory.
� Memory > Pages/Sec shows the number of times that the requested information was not in memory and the request had to be retrieved from disk. This counter’s value should be below 20. For optimal per-formance, this counter’s value should be 4 to 5.
� Paging File > %Usage indicates how much of the allocated page file is currently in use. If this number is consistently over 99%, you may need to add more memory.
These counters work together to show what is happening on your system, so you should use the Paging File > % Usage counter value in conjunction with the Memory > Available MBytes and Memory > Pages/Sec counters to determine how much paging is occurring on your computer.
Some documentation suggests that you can optimize memory by manipulat-ing the page file. This generally applies to servers that use more sophisticated disk subsystems. On a regular workstation running Windows 2000 Profes-sional, the best way to optimize memory is to add more physical memory.
In Exercise 14.2, you will monitor your computer’s memory subsystem. This exercise assumes that you have completed Exercise 14.1.
E X E R C I S E 1 4 . 2
Monitoring System Memory
1. Select Start � Programs � Administrative Tools � Monitor.
2. In the System Monitor window, click the Add button on the toolbar.
3. In the Add Counters dialog box, select the following performance objects and counters:
� Select Memory from the performance object drop-down list, select Available MBytes in the counter list box, and click the Add button.

680 Chapter 14 � Optimizing Windows 2000
Monitoring and Optimizing the Processor
Although processors are usually not the source of bottlenecks, you should still monitor this subsystem to make sure that processor utilization is at an efficient level.
The following are the two most important counters for monitoring the system processor:
� Processor > %Processor Time measures the time that the processor spends responding to system requests. If this value is consistently above an average of 80%, you may have a processor bottleneck.
� Processor > Interrupts/Sec shows the average number of hardware interrupts the processor receives each second. If this value is more than 3,500 on a Pentium computer, you might have a problem with a pro-gram or hardware that is generating spurious interrupts.
� Select Memory from the performance object drop-down list, select Pages/Sec in the counter list box, and click the Add button.
� Select Paging File from the performance object drop-down list, select %Usage in the counter list box, and click the Add button.
4. Click the Close button. You should see a chart showing how your computer’s memory is being used.
5. To generate some activity, select Start � Help. Close Help. Open Help again and then close Help. You should have seen that the first time you opened Help, your Memory > Pages/Sec counter spiked, and the second time you accessed Help, the spike was much lower. This is because the first time you accessed the program, it needed to be retrieved from disk; the second time you accessed this pro-gram, it was already in memory.
6. Note the Paging > %Usage counter. If this counter is below 99%, you are not using excessive paging.
7. Note the Memory > Available MBytes counter. If this counter is above 4MB, you should have sufficient RAM.
Leave System Monitor open, because you will use this utility again in Exercise 14.3.
E X E R C I S E 1 4 . 2 ( c o n t i n u e d )

Using System Monitoring Tools 681
If you suspect that you have a processor bottleneck, you can try the fol-lowing solutions:
� Use less processor-intensive applications.
� Upgrade your processor.
� If your computer supports multiple processors, add a processor. Win-dows 2000 Professional can support up to two processors, which will help if you use multithreaded applications.
Beware of running 3-D screen savers on your computer. As you will see in Exercise 14.3, they can use quite a bit of the processor’s time.
In Exercise 14.3, you will monitor your computer’s processor. This exer-cise assumes that you have completed the other exercises in this chapter.
E X E R C I S E 1 4 . 3
Monitoring the System Processor
1. If System Monitor is not already open, select Start � Programs � Administrative Tools � Monitor.
2. In the System Monitor window, click the Add button on the toolbar.
3. In the Add Counters dialog box, select the following performance objects and counters:
� Select Processor from the performance object drop-down list, select %Processor Time in the counter list box, and click the Add button.
� Select Processor from the performance object drop-down list, select Interrupts/Sec in the counter list box, and click the Add button.
4. Click the Close button. You should see these counters added to your chart.

682 Chapter 14 � Optimizing Windows 2000
Monitoring and Optimizing the Disk Subsystem
Disk access is the amount of time it takes your disk subsystem to retrieve data that is requested by the operating system. The two factors that deter-mine how quickly your disk subsystem will respond to system requests are the average disk access time on your hard drive and the speed of your disk controller.
You can monitor the PhysicalDisk object, which is the sum of all logical drives on a single physical drive, or you can monitor the LogicalDisk object, which represents a specific logical disk. The following are the most impor-tant counters for monitoring the disk subsystem:
� PhysicalDisk > %Disk Time shows the amount of time the physical disk is busy because it is servicing read or write requests. If the disk is busy more than 90% of the time, you will improve performance by adding another disk channel and splitting the disk I/O requests between the channels.
� PhysicalDisk > %Current Disk Queue Length indicates the number of outstanding disk requests that are waiting to be processed. This value should be less than 2.
These counters can be tracked for both the PhysicalDisk object and the LogicalDisk object.
If you suspect that you have a disk subsystem bottleneck, the first thing you should check is your memory subsystem. If you do not have enough
5. To generate some activity, select Start � Settings � Control Panel � Display. Click the Screen Saver tab. Select 3D FlowerBox (OpenGL) and click the Preview button. Let this process run for about 5 seconds. Close all of the dialog boxes you opened in this step. You should see that the %Processor Time counter spiked during this process.
6. Note the Processor > %Processor Time counter. If this counter’s average is below 80%, you do not have a processor bottleneck.
7. Note the Processor > Interrupts/Sec counter. If this counter is below 3,500 on a Pentium computer, you do not have any pro-cesses or hardware that are generating excessive interrupts.
Leave System Monitor open, because you will use this utility again in Exercise 14.4.
E X E R C I S E 1 4 . 3 ( c o n t i n u e d )

Using System Monitoring Tools 683
physical memory, it can cause excessive paging, which in turn affects the disk subsystem. If you do not have a memory problem, you can try the following solutions to improve disk performance:
� Use faster disks and controllers.
� Use disk striping to take advantage of multiple I/O channels.
� Balance heavily used files on multiple I/O channels.
� Add another disk controller for load balancing.
In Windows NT 4, you enabled all disk counters through the DISKPERF –Y com-mand. Physical disk counters are automatically enabled in Windows 2000 Pro-fessional. However, you must enable DISKPERF to track the logical disk object and counters.
In Exercise 14.4, you will monitor your disk subsystem. This exercise assumes that you have completed the other exercises in this chapter.
E X E R C I S E 1 4 . 4
Monitoring the Disk Subsystem
1. If System Monitor is not already open, select Start � Programs � Administrative Tools � Monitor.
2. In the System Monitor window, click the Add button on the toolbar.
3. Notice that there is a performance object for PhysicalDisk, but but not LogicalDisk.
4. Select Start � Programs � Accessories � Command Prompt.
5. At the command prompt, type DISKPERF -Y and press Enter. You see a message stating that both the logical and physical disk per-formance counters are set to start when the computer boots. Close the Command Prompt dialog box and restart your computer.
6. Select Start � Programs � Administrative Tools � Monitor.
7. In the System Monitor window, click the Add button on the toolbar.

684 Chapter 14 � Optimizing Windows 2000
You can monitor your logical disk's amount of free disk space through the LogicalDisk > %Free Space counter. This counter can also be used as an alert. For example, you might set an alert to notify you when LogicalDisk > %Free Space on your C: drive is under 10%.
8. In the Add Counters dialog box, select the following performance objects and counters:
� Select PhysicalDisk from the performance object drop-down list, select %Disk Time from the counter list box, and click the Add button.
� Select PhysicalDisk from the performance object drop-down list, select Current Disk Queue Length from the counter list box, and click the Add button.
� Select LogicalDisk from the performance object drop-down list, select %Idle Time from the counter list box, and click the Add button.
9. Click the Close button. You should see these counters added to your chart.
10. To generate some activity, open and close some applications and copy some files between your C: drive and D: drive.
11. Note the PhysicalDisk > %Disk Time counter. If this counter’s average is below 90%, you are not generating excessive requests to this disk.
12. Note the PhysicalDisk > %Current Disk Queue Length counter. If this counter’s average is below 2, you are not generating excessive requests to this disk.
Leave System Monitor open, because you will use this utility again in Exercise 14.5.
E X E R C I S E 1 4 . 4 ( c o n t i n u e d )

Using System Monitoring Tools 685
Monitoring and Optimizing the Network Subsystem
Windows 2000 Professional does not have a built-in mechanism for moni-toring the entire network. However, you can monitor and optimize the traf-fic that is generated on the specific Windows 2000 computer. You can monitor the network interface (your network card), and you can monitor the network protocols that have been installed on your computer.
The following are two of the counters that are useful for monitoring the network subsystem:
� Network Interface > Bytes Total/Sec measures the total number of bytes that are sent or received from the network interface and includes all network protocols.
� TCP > Segments/Sec measures the number of bytes that are sent or received from the network interface and includes only the TCP protocol.
Normally, you monitor and optimize the network subsystem from a network perspective rather than from a single computer. For example, you can use a network protocol analyzer to monitor all of the traffic on the network to deter-mine if the network bandwidth is acceptable for your requirements or if the network bandwidth is saturated.
The following suggestions can help to optimize and minimize network traffic:
� Use only the network protocols you need. For example, use TCP/IP and don’t use NWLink and NetBEUI.
� If you need to use multiple network protocols, place the most com-monly used protocols higher in the binding order.
� Use network cards that take full advantage of your bus width. For example, use 32-bit cards instead of 16-bit cards.
� Use faster network cards. For example, use 100Mbps Ethernet instead of 10Mbps Ethernet.

686 Chapter 14 � Optimizing Windows 2000
In Exercise 14.5, you will monitor your network subsystem. This exercise assumes that you have completed the other exercises in this chapter.
Creating Baseline Reports
As explained earlier in this chapter, baselines show how your server is per-forming at a certain time. By taking baselines at regular intervals and also whenever you make any changes to the system’s configuration, you can monitor your server’s performance over time.
E X E R C I S E 1 4 . 5
Monitoring the Network Subsystem
1. If System Monitor is not already open, select Start � Programs � Administrative Tools � Monitor.
2. In the System Monitor window, click the Add button on the toolbar.
3. In the Add Counters dialog box, select the following performance objects and counters:
� Select Network Interface from the performance object drop-down list, select Bytes Total/Sec in the counter list box, and click the Add button.
� Select TCP from the performance object drop-down list, select Segments/Sec from the counter list box, and click the Add button.
4. Click the Close button. You should see these counters added to your chart.
5. To generate some activity, copy some files between your C: drive and D: drive.
6. Note the Network Interface > Bytes Total/Sec and TCP > Segments/Sec counters. These numbers are cumulative. Use them in your baselines to determine network activity.
Leave your Monitor console open, because you will use it again in Exercise 14.6.

Using System Monitoring Tools 687
You can create baselines by setting up a counter log file in the Perfor-mance Logs and Alerts utility. After you’ve created the baseline log file, you can view it in System Monitor, as shown in Figure 14.22.
F I G U R E 1 4 . 2 2 Viewing a baseline in System Monitor
In Exercise 14.6, you will create a baseline report for your computer.
E X E R C I S E 1 4 . 6
Creating a Baseline Report
1. If the Monitor console is not already open, select Start � Pro-grams � Administrative Tools � Monitor.
2. Double-click Performance Logs and Alerts.
3. Right-click Counter Logs and select New Log Settings.

688 Chapter 14 � Optimizing Windows 2000
4. In the New Log Settings dialog box, type Countermmddyy (replace mmddyy with the current month, date, and year) as the log name. The log file should be stored in the C:\PerfLogs folder by default. Click the OK button.
5. In the General tab of the counter log Properties dialog box, click the Add button and add the following counters:
� Memory > Available MBytes
� Memory > Pages/Sec
� Paging File > %Usage
� Processor > %Processor Time
� Processor > Interrupts/Sec
� PhysicalDisk > %Disk Time
� PhysicalDisk > Current Disk Queue Length
� Network Interface > Bytes Total/Sec
� TCP > Segments/Sec
6. Set the interval for sampling data to 5 seconds.
7. Click the Log Files tab. Uncheck the End File Names With check box. This will prevent the filename from being appended with mmddhh (month/day/hour). Click the OK button to close the Prop-erties dialog box and start the log file.
8. To generate system activity, start and stop some applications, copy a few files, and run a screen saver for 1 to 2 minutes.
9. To view your log file, open System Monitor. Click the View Log File Data button on the toolbar.
10. In the open file dialog box, select C:\PerfLogs\Countermmddyy and click the Open button.
11. Add the counters from the log file you created to see the data that was collected in your log.
E X E R C I S E 1 4 . 6 ( c o n t i n u e d )

Using Task Manager 689
Using Task Manager
The Task Manager utility shows the applications and processes that are currently running on your computer, as well as CPU and memory usage information. To access Task Manager, press Ctrl+Alt+Delete and click the Task Manager button. Alternatively, right-click an empty area in the Task-bar and select Task Manager from the pop-up menu.
Managing Application Tasks
The Applications tab of the Task Manager dialog box, shown in Figure 14.23, lists all of the applications that are currently running on the computer. For each task, you will see the name of the task and the current status (running, not responding, or stopped).
F I G U R E 1 4 . 2 3 The Applications tab of the Task Manager dialog box
�MicrosoftExam
Objective
Optimize and troubleshoot performance of the Windows 2000
Professional desktop.
� Optimize and troubleshoot processor utilization.
� Optimize and troubleshoot application performance.

690 Chapter 14 � Optimizing Windows 2000
To close an application, select it and click the End Task button at the bot-tom of the dialog box. To make the application window active, select it and click the Switch To button. If you want to start an application that isn’t run-ning, click the New Task button and specify the location and name of the program you wish to start.
Managing Process Tasks
The Processes tab of the Task Manager dialog box, shown in Figure 14.24, lists all of the processes that are currently running on the computer. This is a convenient way to get a quick look at how your system is performing. Unlike with System Monitor, you don’t need to first configure the collection of this data; it’s gathered automatically.
F I G U R E 1 4 . 2 4 The Processes tab of the Task Manager dialog box
For each process, you will see a unique process ID (PID) that changes each time a process is started, the amount of CPU utilization that the process is using, and the amount of time the processor spent running the process.
From the Processes tab, you can organize the listing and control processes as follows:
� To organize the processes based on usage, click the column headings. For example, if you click the CPU column, the listing will start with

Using Task Manager 691
the processes that use the most CPU resources. If you click the CPU column a second time, the listing will be reversed.
� To manage a process, right-click it and choose an option from the pop-up menu. You can choose to end the process, end the process tree, or set the priority of the process (to real time, high, above nor-mal, normal, below normal, or low). If your computer has multiple processors installed, you can also set processor affinity (the process of associating a specific process with a specific processor) for a pro-cess. See Chapter 4, “Configuring the Windows 2000 Environ-ment,” for details on setting processor affinity.
� To customize the counters that are listed, select View � Select Columns. This brings up the Select Columns dialog box, shown in Figure 14.25, where you can select the information that you want to see listed on the Processes tab.
F I G U R E 1 4 . 2 5 The Select Columns dialog box
Managing Performance Tasks
The Performance tab of the Task Manager dialog box, shown in Figure 14.26, provides an overview of your computer’s CPU and memory usage. This is sim-ilar to the information that System Monitor tracks, and you don’t need to con-figure it first as you do with System Monitor.

692 Chapter 14 � Optimizing Windows 2000
F I G U R E 1 4 . 2 6 The Performance tab of the Task Manager dialog box
The Performance tab shows the following information:
� CPU usage, real-time and history graph
� Memory usage, real-time and history graph
� Totals for handles, threads, and processes
� Physical memory statistics
� Commit charge memory statistics
� Kernel memory statistics
�MicrosoftExam
Objective
Optimize and troubleshoot performance of the Windows 2000
Professional desktop.
� Optimize and troubleshoot memory performance

Using Task Manager 693
Configuring Application Performance
If you run multiple applications concurrently on your Windows 2000 Pro-fessional computer, the foreground application is given higher priority when the applications are processed. As noted in the previous section, you can dynamically change an application’s priority through the Processes tab of the Task Manager dialog box. The options for foreground and background application processing are accessed through the System icon in Control Panel.
To configure application performance, open Control Panel, double-click the System icon, select the Advanced tab, and click the Performance Options button. You will see the Performance Options dialog box, as shown in Figure 14.27.
F I G U R E 1 4 . 2 7 The Performance Options dialog box
This dialog box allows you to configure application response as follows:
� If you select the Applications radio button, foreground applications are always processed at a higher priority than background applications.
� If you select the Background Services radio button, foreground and background applications are processed at the same priority.
In Exercise 14.7, you will configure your computer so that foreground and background applications are processed at the same priority.
E X E R C I S E 1 4 . 7
Optimizing Applications
1. Select Start � Settings � Control Panel and double-click the Sys-tem icon.

694 Chapter 14 � Optimizing Windows 2000
Scheduling Tasks
Windows 2000 Professional includes a Task Scheduler utility that allows you to schedule tasks to occur at specified intervals. You can have any of your Windows programs run automatically at a specific time and at a set interval, such as daily, weekly, or monthly. For example, you might schedule your Windows Backup program to run daily at 2:00 A.M.
Creating a New Task
To set up scheduled tasks, take the following steps:
1. Select Start � Settings � Control Panel and double-click the Scheduled Tasks icon.
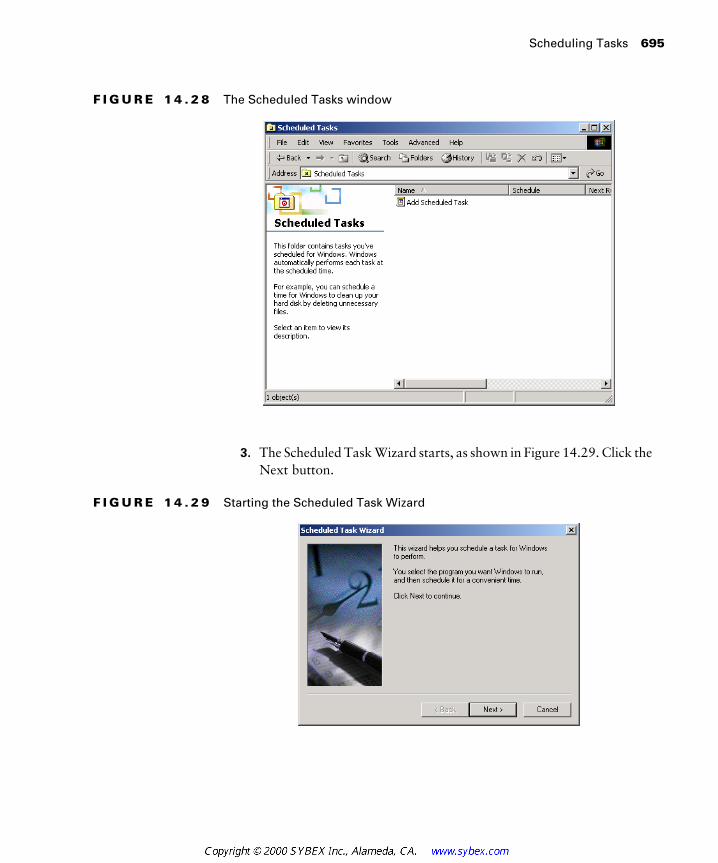
2. The Scheduled Tasks window appears, as shown in Figure 14.28. Double-click the Add Scheduled Task icon.
2. In the System Properties dialog box, click the Advanced tab.
3. Click the Performance Options button.
4. In the Performance Options dialog box, click the Background Ser-vices radio button. Then click the OK button.
5. In the System Properties dialog box, click the OK button.
�MicrosoftExam
Objective
Configure, manage, and troubleshoot the Task Scheduler.
E X E R C I S E 1 4 . 7 ( c o n t i n u e d )
Scheduling Tasks 695
F I G U R E 1 4 . 2 8 The Scheduled Tasks window
3. The Scheduled Task Wizard starts, as shown in Figure 14.29. Click the Next button.
F I G U R E 1 4 . 2 9 Starting the Scheduled Task Wizard

696 Chapter 14 � Optimizing Windows 2000
4. The first Scheduled Task Wizard dialog box lists applications you can run, as shown in Figure 14.30. You can select an application from the list or click the Browse button to locate any application or program that your computer has access to. After you select an application, click the Next button.
F I G U R E 1 4 . 3 0 Selecting an application
5. The next Scheduled Task Wizard dialog box, shown in Figure 14.31, prompts you to select a name for the task and specify when the task will be performed. Your choices are Daily, Weekly, Monthly, One Time Only, When My Computer Starts, or When I Log On. Make your selection and click the Next button.
F I G U R E 1 4 . 3 1 Specifying a name and schedule

Scheduling Tasks 697
6. Depending on the selection you made for the task’s schedule, you may see another dialog box for setting the specific schedule. For example, if you chose to run the task weekly, the next dialog box lets you select the start time for the task, run the task every x weeks, and choose the day of the week that the task should be run, as shown in Figure 14.32. Make your selection and click the Next button.
F I G U R E 1 4 . 3 2 Setting a daily schedule
7. The next Scheduled Task Wizard dialog box prompts you to enter the username and password that will be used to start the task, as shown in Figure 14.33. After you enter this information, click the Next button.
F I G U R E 1 4 . 3 3 Entering a username and password for running a scheduled task

698 Chapter 14 � Optimizing Windows 2000
8. The final dialog box shows your selections for the scheduled task, as shown in Figure 14.34. If this information is correct, click the Finish button.
F I G U R E 1 4 . 3 4 Confirming the scheduled task configuration
In Exercise 14.8, you will create a scheduled task.
E X E R C I S E 1 4 . 8
Creating a Scheduled Task
1. Select Start � Settings � Control Panel and double-click the Sched-uled Tasks icon.
2. In the Scheduled Tasks window, double-click the Add Scheduled Task icon.
3. In the opening Scheduled Task Wizard dialog box, click the Next button.
4. In the next dialog box, highlight Disk Cleanup and click the Next button.
5. In the next dialog box, leave the default name for the task and make sure that the Weekly radio button is selected. Click the Next button.

Scheduling Tasks 699
Managing Scheduled Task Properties
You can manage a scheduled task through its properties dialog box, as shown in Figure 14.35. To access this dialog box, open the Scheduled Tasks window (by selecting Start � Settings � Control Panel and double-clicking the Scheduled Tasks icon), right-click the task you wish to manage, and select Properties from the pop-up menu.
F I G U R E 1 4 . 3 5 The Disk Cleanup task properties
6. In the Start Time and Day field, select the time that is 2 minutes from your current time, select every one week, and select the cur-rent day of the week. Click the Next button.
7. Enter the Administrator name and password and click the Next button.
8. In the final dialog box, click the Finish button.
9. Wait for your scheduled task to run.
E X E R C I S E 1 4 . 8 ( c o n t i n u e d )

700 Chapter 14 � Optimizing Windows 2000
The scheduled task dialog box has four tabs with options for managing how and when the task is run and who can manage it. These options are described in the following sections.
Task Properties
Through the Task tab (see Figure 14.35), you can configure the following options:
� The command-line program that is used to run the task
� The folders that contain related files that might be required to run the specified task (the Start In option)
� Any comments that you want to include for informational purposes
� The username and password that should be used to run the specified task (the Run As option)
� Whether the scheduled task is enabled
Schedule Properties
The Schedule tab, shown in Figure 14.36, shows the schedule configured for the task. You can change any of the options on this tab to reschedule the task.
F I G U R E 1 4 . 3 6 The Schedule tab of the scheduled task dialog box

Scheduling Tasks 701
Settings Properties
Through the Settings tab, shown in Figure 14.37, you can configure several settings for the scheduled task:
� The options in the Scheduled Task Completed section allow you to delete the task if it will not be run again and specify how long the task should be allowed to run before it is stopped.
� The options in the Idle Time section are useful if the computer must be idle when the task is run. You can specify how long the computer must be idle before the task begins and whether the task should be stopped if the computer ceases to be idle.
� The options in the Power Management section are useful if the com-puter on which the task runs may be battery-powered. You can specify that the task should not start if the computer is running from batteries and choose to stop the task if battery mode begins.
F I G U R E 1 4 . 3 7 The Settings tab of the scheduled task dialog box
Security Properties
The Security tab, shown in Figure 14.38, allows you to configure the security settings for the scheduled task object. Normally, only Administrators can

702 Chapter 14 � Optimizing Windows 2000
manage scheduled tasks. However, you might want to assign this task to other users, who will need the appropriate permissions to manage scheduled tasks.To assign permissions for a task, click the Add button, select the user or group, and then check the Allow or Deny check boxes for the permissions. (See Chapter 10, “Accessing Files and Folders,” for more information about assigning permissions to users and groups.)
F I G U R E 1 4 . 3 8 The Security tab of the scheduled task dialog box
Summary
In this chapter, you learned about Windows 2000 Professional optimi-zation and reliability. We covered the following topics:
� How to keep your operating system up to date by using the Windows Update utility and applying Windows 2000 service packs
� How to use the System Monitor utility and the Performance Logs and Alerts utility to track and monitor your system’s performance
� How to monitor and optimize memory, the processor, the disk sub-system, and the network subsystem and how to create a system baseline

Summary 703
� How to use the Task Manager utility to view and manage running applications and processes, and to get an overview of CPU and mem-ory usage
� How to use the System icon in the Control Panel to optimize applica-tion performance
� How to automate tasks through the Task Scheduler utility
Key Terms
Before taking the exam, you should be familiar with the following terms:
alert
baseline
bottleneck
counter
page file
Performance Logs and Alerts
service pack
slipstream technology
System Monitor
Task Manager
Task Scheduler
Windows Update
704 Chapter 14 � Optimizing Windows 2000
Review Questions
1. Which of the following options is not a valid view in Windows 2000 System Monitor?
A. Chart
B. Histogram
C. Report
D. Graph
2. Which of the following options cannot be configured through Perfor-mance Logs and Alerts?
A. Report logs
B. Counter logs
C. Trace logs
D. Alerts
3. You are monitoring the Memory > Available MBytes counter and see that it is at 12MB. What should you do?
A. Add RAM
B. Increase the size of the page file
C. Split the page file over two physical disk channels
D. Take no action
4. You are monitoring your Window 2000 Professional computer for a processor bottleneck. When monitoring the Processor > %Processor Time counter, what number would indicate a potential bottleneck?
A. 5%
B. 50%
C. 60%
D. 85%

Review Questions 705
5. You notice that your disk subsystem has a high load of activity. What other subsystem should you monitor before determining you have a disk subsystem bottleneck?
A. Memory
B. Processor
C. Network
D. Application
6. Which of the following two subsystems can be easily monitored for performance through the Task Manager utility?
A. Memory
B. Processor
C. Network
D. Disk
7. Which Windows 2000 utility would you use if you wanted to auto-mate a specific application to run every day at 5:00 P.M.?
A. Scheduled Tasks
B. Automated Scheduler
C. Task Manager
D. Task Automater
8. Which Windows 2000 mechanism allows you to deliver bug fixes to the Windows 2000 operating system?
A. Windows Update
B. Service packs
C. Service fixes
D. Windows Upgrade

706 Chapter 14 � Optimizing Windows 2000
9. Which Windows 2000 mechanism allows you to connect to Microsoft’s Web site to update operating system files?
A. Windows Update
B. Service packs
C. Service fixes
D. Windows Upgrade
10. What needs to be done in order to enable physical disk counters in Sys-tem Monitor?
A. Run DISKPERF –y
B. Run DISKCOUNT –y
C. Run PERFMON –y
D. The counters are enabled by default
11. You are troubleshooting a Windows 2000 Professional computer in your company. Which command can you use to determine whether any service packs have been applied to the computer?
A. SERVPACK
B. WINVER
C. CURRENTVER
D. CONFIG
12. You suspect that you have a memory bottleneck on your computer. You decide to run System Monitor. You want to track five memory-related counters and see how the data is tracked over a specified time period. Which view should you use in System Monitor?
A. Chart
B. Histogram
C. Trace
D. Report

Review Questions 707
13. Which of the following counters are added to System Monitor by default?
A. Memory > Pages/Sec
B. Processor > %Processor Time
C. Paging File > %Usage
D. None
14. You want to configure alerts to be generated when a specific counter exceeds a specific value. Which of the following actions can be gener-ated when an alert is generated? Choose three answers.
A. Run a specific program
B. Page a specific person with a predefined code
C. Send a text message
D. Generate a more detailed log file
15. You are monitoring the Processor > Interrupts/Sec counter through System Monitor. You should suspect that you have a program or piece of hardware that is generating spurious interrupts when this counter reaches which of the following values on a Pentium computer?
A. 250
B. 500
C. 1,000
D. 3,500
16. You are monitoring the PhysicalDisk > Current Disk Queue Length counter through System Monitor. You might have a disk subsystem bottleneck when this counter is over which of the following values?
A. 1
B. 2
C. 10
D. 12

708 Chapter 14 � Optimizing Windows 2000
17. You have an application that seems to have hung. Which utility can you use to see the current status of the application?
A. Application Manager
B. Service Manager
C. Task Manager
D. Control Panel, Add/Remove Programs
18. When you schedule a task to be run, which of the following task prop-erties cannot be configured?
A. The username and password of the user who will run the task
B. Power management, so that if the computer is battery-operated, the task will not run if the computer is running on batteries
C. Whether the task will be run once or will be a recurring task
D. Whether another task will be run if specific conditions trigger the secondary task
19. You want to track system performance for a baseline over a period of two days. You want the data to be collected every five minutes. What type of log would you create through Performance Logs and Alerts?
A. Counter log
B. Trace log
C. Monitoring log
D. Baseline log
20. You are monitoring the Memory > Pages/Sec counter through System Monitor. Which of the following statements reflects what is consid-ered optimal performance for this counter?
A. This counter’s value should be around 4 to 5.
B. This counter’s value should be around 30 to 40.
C. This counter’s value should be around 40 to 50.
D. This counter’s value should be around 50 to 60.

Answers to Review Questions 709
Answers to Review Questions
1. D. There is no graph view in System Monitor. The three views that are supported are chart, histogram, and report.
2. A. Through Performance Logs and Alerts, you can configure counter logs, trace logs, and alerts.
3. D. As long as the Memory > Available MBytes counter shows more that 4MB of memory, no bottleneck is indicated, so you would not need to take any action.
4. D. If the average Processor > %Processor Time counter is consistently above 80%, a processor bottleneck may be indicated.
5. A. You should check the memory. If your computer does not have enough memory, it can cause excessive paging, which may be per-ceived as a disk subsystem bottleneck.
6. A, B. Through the Performance tab of Task Manager, you can easily monitor your computer’s current processor and memory utilization.
7. A. To automate scheduled tasks, you use the Scheduled Tasks utility.
8. B. Service packs are used to deliver bug fixes (and some new features) to the Windows 2000 operating system.
9. A. The Windows Update utility connects you to the Microsoft Web site to make sure you have the most current files.
10. D. In Windows 2000, physical disk counters are enabled by default. In order to view Logical Disk counters, you must run DISKPERF -y.
11. B. The WINVER command is used to display the current operating sys-tem that is loaded, any service packs that are loaded, and the amount of physical memory that is installed on the computer.

710 Chapter 14 � Optimizing Windows 2000
12. A. The chart view is used to display a small number of counters in a graphical format. With this view, you can easily track information over a specified time period.
13. D. No counters are tracked by System Monitor by default.
14. A, C, D. When you create an alert, you can configure the following actions when an alert is generated: log an entry to the Application event log, send a network message to a specified user, start a perfor-mance data log, or run a specified program.
15. D. The Processor > Interrupts/Sec counter shows the average number of hardware interrupts the processor receives each second. If this value is more than 3,500 on a Pentium computer, you might have a problem with a program or hardware that is generating spurious interrupts.
16. B. The PhysicalDisk > Current Disk Queue Length counter indicates the number of outstanding disk requests that are waiting to be pro-cessed. This value should be less than 2.
17. C. The Applications tab of the Task Manager dialog box lists all of the applications that are currently running on the computer. For each task, you will see the name of the task and the current status (running, not responding, or stopped).
18. D. There are no options to trigger secondary conditional tasks.
19. A. Counter logs record data about hardware usage and the activity of system services. You can configure logging to occur manually or on a predefined schedule.
20. A. The Memory > Pages/Sec counter shows the number of times that the requested information was not in memory and the information needed to be retrieved from disk. This counter’s value should be below 20. For optimal performance, this counter’s value should be 4 to 5.