chapter 15 policy timing, deficit targeting, and stock market effects © 2009 pearson education,...
Post on 19-Dec-2015
219 views
TRANSCRIPT

CH
AP
TE
R 1
5 P
olic
y T
imin
g, D
efic
it T
arge
ting,
and
Sto
ck M
arke
t Effe
cts
© 2009 Pearson Education, Inc. Publishing as Prentice Hall Principles of Macroeconomics 9e by Case, Fair and Oster 1 of 31
PowerPoint Lectures for
Principles of Macroeconomics, 9e
By
Karl E. Case, Ray C. Fair & Sharon M. Oster
; ;

CH
AP
TE
R 1
5 P
olic
y T
imin
g, D
efic
it T
arge
ting,
and
Sto
ck M
arke
t Effe
cts
© 2009 Pearson Education, Inc. Publishing as Prentice Hall Principles of Macroeconomics 9e by Case, Fair and Oster 2 of 31

15PART IV FURTHER MACROECONOMICS ISSUES
© 2009 Pearson Education, Inc. Publishing as Prentice Hall Principles of Macroeconomics 9e by Case, Fair and Oster
Policy Timing, Deficit
Targeting, and Stock
Market Effects
Fernando & Yvonn Quijano
Prepared by:

CH
AP
TE
R 1
5 P
olic
y T
imin
g, D
efic
it T
arge
ting,
and
Sto
ck M
arke
t Effe
cts
© 2009 Pearson Education, Inc. Publishing as Prentice Hall Principles of Macroeconomics 9e by Case, Fair and Oster 4 of 31
Time Lags Regarding Monetary and Fiscal PolicyStabilizationRecognition LagsImplementation LagsResponse Lags
Fiscal Policy: Deficit TargetingThe Effects of Spending Cuts on the DeficitEconomic Stability and Deficit ReductionSummary
The Stock Market and the EconomyStocks and BondsDetermining the price of a StockThe Stock Market Since 1948Stock Market Effects on the Economy
CHAPTER OUTLINE
Policy Timing, Deficit
Targeting, and Stock
Market Effects
15PART IV FURTHER MACROECONOMICS ISSUES

CH
AP
TE
R 1
5 P
olic
y T
imin
g, D
efic
it T
arge
ting,
and
Sto
ck M
arke
t Effe
cts
© 2009 Pearson Education, Inc. Publishing as Prentice Hall Principles of Macroeconomics 9e by Case, Fair and Oster 5 of 31
Time Lags Regarding Monetary and Fiscal Policy
stabilization policy Describes both monetary and fiscal policy, the goals of which are to smooth out fluctuations in output and employment and to keep prices as stable as possible.
time lags Delays in the economy’s response to stabilization policies.

CH
AP
TE
R 1
5 P
olic
y T
imin
g, D
efic
it T
arge
ting,
and
Sto
ck M
arke
t Effe
cts
© 2009 Pearson Education, Inc. Publishing as Prentice Hall Principles of Macroeconomics 9e by Case, Fair and Oster 6 of 31
Time Lags Regarding Monetary and Fiscal Policy
Path A is less stable—it varies more over time—than path B. Other things being equal, society prefers path B to path A.
FIGURE 15.1 Two Possible Time Paths for GDP
CH
AP
TE
R 1
5 P
olic
y T
imin
g, D
efic
it T
arge
ting,
and
Sto
ck M
arke
t Effe
cts
© 2009 Pearson Education, Inc. Publishing as Prentice Hall Principles of Macroeconomics 9e by Case, Fair and Oster 7 of 31
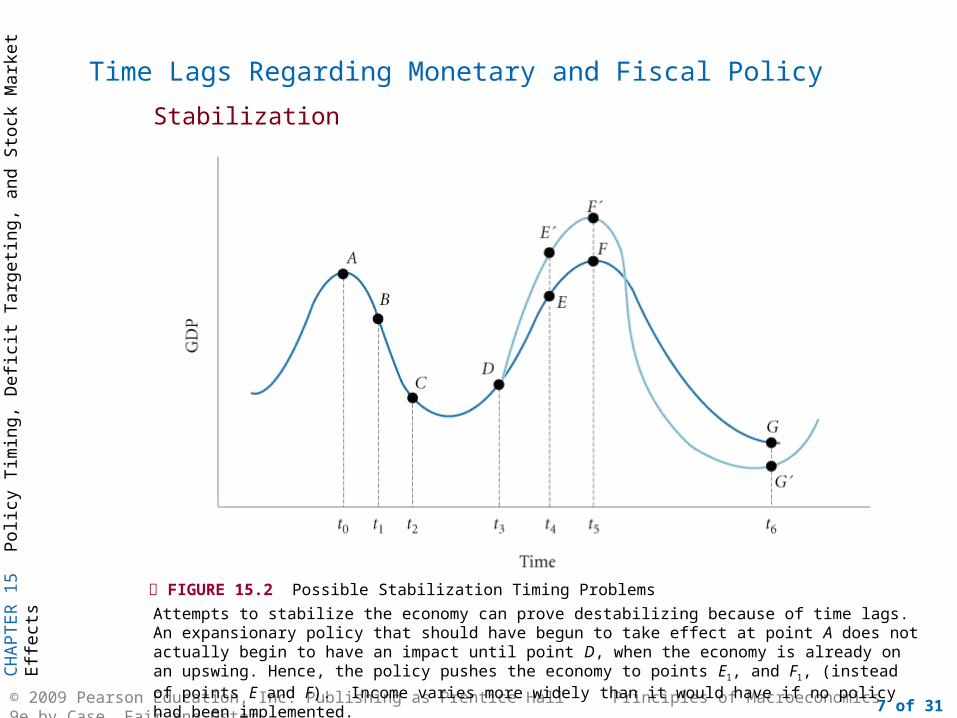
Time Lags Regarding Monetary and Fiscal Policy
Attempts to stabilize the economy can prove destabilizing because of time lags. An expansionary policy that should have begun to take effect at point A does not actually begin to have an impact until point D, when the economy is already on an upswing. Hence, the policy pushes the economy to points E1, and F1, (instead of points E and F). Income varies more widely than it would have if no policy had been implemented.
FIGURE 15.2 Possible Stabilization Timing Problems
Stabilization

CH
AP
TE
R 1
5 P
olic
y T
imin
g, D
efic
it T
arge
ting,
and
Sto
ck M
arke
t Effe
cts
© 2009 Pearson Education, Inc. Publishing as Prentice Hall Principles of Macroeconomics 9e by Case, Fair and Oster 8 of 31
Time Lags Regarding Monetary and Fiscal Policy
Recognition Lags
recognition lag The time it takes for policy makers to recognize the existence of a boom or a slump.
implementation lag The time it takes to put the desired policy into effect once economists and policy makers recognize that the economy is in a boom or a slump.
Implementation Lags
CH
AP
TE
R 1
5 P
olic
y T
imin
g, D
efic
it T
arge
ting,
and
Sto
ck M
arke
t Effe
cts
© 2009 Pearson Education, Inc. Publishing as Prentice Hall Principles of Macroeconomics 9e by Case, Fair and Oster 9 of 31
Time Lags Regarding Monetary and Fiscal Policy
Response Lags
response lag The time that it takes for the economy to adjust to the new conditions after a new policy is implemented; the lag that occurs because of the operation of the economy itself.

CH
AP
TE
R 1
5 P
olic
y T
imin
g, D
efic
it T
arge
ting,
and
Sto
ck M
arke
t Effe
cts
© 2009 Pearson Education, Inc. Publishing as Prentice Hall Principles of Macroeconomics 9e by Case, Fair and Oster 10 of 31
Time Lags Regarding Monetary and Fiscal Policy
Response Lags
Response Lags for Fiscal Policy
Neither individuals nor firms revise their spending plans instantaneously. Until they can make those revisions, extra government spending does not stimulate extra private spending.
Monetary policy works by changing interest rates, which then change planned investment.
The response of consumption and investment to interest rate changes takes time.
Response Lags for Monetary Policy
CH
AP
TE
R 1
5 P
olic
y T
imin
g, D
efic
it T
arge
ting,
and
Sto
ck M
arke
t Effe
cts
© 2009 Pearson Education, Inc. Publishing as Prentice Hall Principles of Macroeconomics 9e by Case, Fair and Oster 11 of 31
Time Lags Regarding Monetary and Fiscal Policy
Response Lags
Summary
Stabilization is not easily achieved. It takes time for policy makers to recognize the existence of a problem, more time for them to implement a solution, and yet more time for firms and households to respond to the stabilization policies taken.

CH
AP
TE
R 1
5 P
olic
y T
imin
g, D
efic
it T
arge
ting,
and
Sto
ck M
arke
t Effe
cts
© 2009 Pearson Education, Inc. Publishing as Prentice Hall Principles of Macroeconomics 9e by Case, Fair and Oster 12 of 31
Fiscal Policy: Deficit Targeting
Gramm-Rudman-Hollings Act Passed by the U.S. Congress and signed by President Reagan in 1986, this law set out to reduce the federal deficit by $36 billion per year, with a deficit of zero slated for 1991.
The GRH legislation, passed in 1986, set out to lower the federal deficit by $36 billion per year. If the plan had worked, a zero deficit would have been achieved by 1991.
FIGURE 15.3 Deficit Reduction Targets under Gramm-Rudman-Hollings

CH
AP
TE
R 1
5 P
olic
y T
imin
g, D
efic
it T
arge
ting,
and
Sto
ck M
arke
t Effe
cts
© 2009 Pearson Education, Inc. Publishing as Prentice Hall Principles of Macroeconomics 9e by Case, Fair and Oster 13 of 31
Fiscal Policy: Deficit Targeting
deficit response index (DRI) The amount by which the deficit changes with a $1 change in GDP.
The Effects of Spending Cuts on the Deficit
A cut in government spending causes the economy to contract. Both the taxable income of households and the profits of firms fall.
The deficit tends to rise when GDP falls, and tends to fall when GDP rises.

CH
AP
TE
R 1
5 P
olic
y T
imin
g, D
efic
it T
arge
ting,
and
Sto
ck M
arke
t Effe
cts
© 2009 Pearson Education, Inc. Publishing as Prentice Hall Principles of Macroeconomics 9e by Case, Fair and Oster 14 of 31
Fiscal Policy: Deficit Targeting
The Effects of Spending Cuts on the Deficit
Monetary Policy to the Rescue?
A zero multiplier can come about through renewed optimism on the part of households and firms or through very aggressive behavior on the part of the Fed, but because neither of these situations is very plausible, the multiplier is likely to be greater than zero. Thus, it is likely that to lower the deficit by a certain amount, the cut in government spending must be larger than that amount.

CH
AP
TE
R 1
5 P
olic
y T
imin
g, D
efic
it T
arge
ting,
and
Sto
ck M
arke
t Effe
cts
© 2009 Pearson Education, Inc. Publishing as Prentice Hall Principles of Macroeconomics 9e by Case, Fair and Oster 15 of 31
Fiscal Policy: Deficit Targeting
Economic Stability and Deficit Reduction
negative demand shock Something that causes a negative shift in consumption or investment schedules or that leads to a decrease in U.S. exports.
automatic stabilizers Revenue and expenditure items in the federal budget that automatically change with the economy in such a way as to stabilize GDP.
automatic destabilizers Revenue and expenditure items in the federal budget that automatically change with the economy in such a way as to destabilize GDP.

CH
AP
TE
R 1
5 P
olic
y T
imin
g, D
efic
it T
arge
ting,
and
Sto
ck M
arke
t Effe
cts
© 2009 Pearson Education, Inc. Publishing as Prentice Hall Principles of Macroeconomics 9e by Case, Fair and Oster 16 of 31
Fiscal Policy: Deficit Targeting
Economic Stability and Deficit Reduction
Deficit targeting changes the way the economy responds to negative demand shocks because it does not allow the deficit to increase. The result is a smaller deficit but a larger decline in income than would have otherwise occurred.
FIGURE 15.4 Deficit Targeting as an Automatic Destabilizer

CH
AP
TE
R 1
5 P
olic
y T
imin
g, D
efic
it T
arge
ting,
and
Sto
ck M
arke
t Effe
cts
© 2009 Pearson Education, Inc. Publishing as Prentice Hall Principles of Macroeconomics 9e by Case, Fair and Oster 17 of 31
Fiscal Policy: Deficit Targeting
Summary
It is clear that the GRH legislation, the balanced-budget amendment, and similar deficit targeting measures have some undesirable macroeconomic consequences.
Locking the economy into spending cuts during periods of negative demand shocks, as deficit-targeting measures do, is not a good way to manage the economy.

CH
AP
TE
R 1
5 P
olic
y T
imin
g, D
efic
it T
arge
ting,
and
Sto
ck M
arke
t Effe
cts
© 2009 Pearson Education, Inc. Publishing as Prentice Hall Principles of Macroeconomics 9e by Case, Fair and Oster 18 of 31
The Stock Market and the Economy
Stocks and Bonds
stock A certificate that certifies ownership of a certain portion of a firm.
capital gain An increase in the value of an asset.
realized capital gain The gain that occurs when the owner of an asset actually sells it for more than he or she paid for it.
CH
AP
TE
R 1
5 P
olic
y T
imin
g, D
efic
it T
arge
ting,
and
Sto
ck M
arke
t Effe
cts
© 2009 Pearson Education, Inc. Publishing as Prentice Hall Principles of Macroeconomics 9e by Case, Fair and Oster 19 of 31
The Stock Market and the Economy
Determining the Price of a Stock
Things that are likely to affect the price of a stock include:
• What people expect its future dividends will be.
• When the dividends are expected to be paid.
• The amount of risk involved.

CH
AP
TE
R 1
5 P
olic
y T
imin
g, D
efic
it T
arge
ting,
and
Sto
ck M
arke
t Effe
cts
© 2009 Pearson Education, Inc. Publishing as Prentice Hall Principles of Macroeconomics 9e by Case, Fair and Oster 20 of 31
The Stock Market and the Economy
The Stock Market Since 1948
Dow Jones Industrial Average An index based on the stock prices of 30 actively traded large companies. The oldest and most widely followed index of stock market performance.
NASDAQ Composite An index based on the stock prices of over 5,000 companies traded on the NASDAQ Stock Market. The NASDAQ market takes its name from the National Association of Securities Dealers Automated Quotation System.
Standard and Poor’s 500 (S&P 500) An index based on the stock prices of 500 of the largest firms by market value.

CH
AP
TE
R 1
5 P
olic
y T
imin
g, D
efic
it T
arge
ting,
and
Sto
ck M
arke
t Effe
cts
© 2009 Pearson Education, Inc. Publishing as Prentice Hall Principles of Macroeconomics 9e by Case, Fair and Oster 21 of 31
The Stock Market and the Economy
The Stock Market Since 1948
FIGURE 15.5 The S&P 500 Stock Price Index, 1948 I–2007 IV

CH
AP
TE
R 1
5 P
olic
y T
imin
g, D
efic
it T
arge
ting,
and
Sto
ck M
arke
t Effe
cts
© 2009 Pearson Education, Inc. Publishing as Prentice Hall Principles of Macroeconomics 9e by Case, Fair and Oster 22 of 31
The Stock Market and the Economy
The Stock Market Since 1948
FIGURE 15.6 Ratio of After-Tax Profits to GDP, 1948 I–2007 IV

CH
AP
TE
R 1
5 P
olic
y T
imin
g, D
efic
it T
arge
ting,
and
Sto
ck M
arke
t Effe
cts
© 2009 Pearson Education, Inc. Publishing as Prentice Hall Principles of Macroeconomics 9e by Case, Fair and Oster 23 of 31
The Stock Market and the Economy
Stock Market Effects on the Economy
An increase in stock prices causes an increase in wealth, and consequently an increase in consumer spending.
Investment is also affected by higher stock prices. With a higher stock price, a firm can raise more money per share to finance investment projects.

CH
AP
TE
R 1
5 P
olic
y T
imin
g, D
efic
it T
arge
ting,
and
Sto
ck M
arke
t Effe
cts
© 2009 Pearson Education, Inc. Publishing as Prentice Hall Principles of Macroeconomics 9e by Case, Fair and Oster 24 of 31
The Stock Market and the Economy
Stock Market Effects on the Economy
The Crash of October 1987
The value of stocks in the United States fell by about a trillion dollars between August 1987 and the end of October 1987.
If the multiplier is 1.4, the total decrease in GDP would be about 1.4 x $40 billion = $56 billion, or about 1.4 percent of GDP.
The stock market crash of 1987 did not result in a recession in 1988 because households and business firms did not lower their expectations drastically.

CH
AP
TE
R 1
5 P
olic
y T
imin
g, D
efic
it T
arge
ting,
and
Sto
ck M
arke
t Effe
cts
© 2009 Pearson Education, Inc. Publishing as Prentice Hall Principles of Macroeconomics 9e by Case, Fair and Oster 25 of 31
The Stock Market and the Economy
Stock Market Effects on the Economy
The Boom of 1995–2000
FIGURE 15.7 Personal Saving Rate, 1995 I–2002 III

CH
AP
TE
R 1
5 P
olic
y T
imin
g, D
efic
it T
arge
ting,
and
Sto
ck M
arke
t Effe
cts
© 2009 Pearson Education, Inc. Publishing as Prentice Hall Principles of Macroeconomics 9e by Case, Fair and Oster 26 of 31
The Stock Market and the Economy
Stock Market Effects on the Economy
The Boom of 1995–2000
FIGURE 15.8 Investment-Output Ratio, 1995 I–2002 III

CH
AP
TE
R 1
5 P
olic
y T
imin
g, D
efic
it T
arge
ting,
and
Sto
ck M
arke
t Effe
cts
© 2009 Pearson Education, Inc. Publishing as Prentice Hall Principles of Macroeconomics 9e by Case, Fair and Oster 27 of 31
The Stock Market and the Economy
Stock Market Effects on the Economy
The Boom of 1995–2000
FIGURE 15.9 Ratio of Federal Government Budget Surplus to GDP, 1995 I–2002 III

CH
AP
TE
R 1
5 P
olic
y T
imin
g, D
efic
it T
arge
ting,
and
Sto
ck M
arke
t Effe
cts
© 2009 Pearson Education, Inc. Publishing as Prentice Hall Principles of Macroeconomics 9e by Case, Fair and Oster 28 of 31
The Stock Market and the Economy
Stock Market Effects on the Economy
The Boom of 1995–2000
FIGURE 15.10 Growth Rate of Real GDP, 1995 I–2002 III
CH
AP
TE
R 1
5 P
olic
y T
imin
g, D
efic
it T
arge
ting,
and
Sto
ck M
arke
t Effe
cts
© 2009 Pearson Education, Inc. Publishing as Prentice Hall Principles of Macroeconomics 9e by Case, Fair and Oster 29 of 31
The Stock Market and the Economy
Stock Market Effects on the Economy
The Boom of 1995–2000
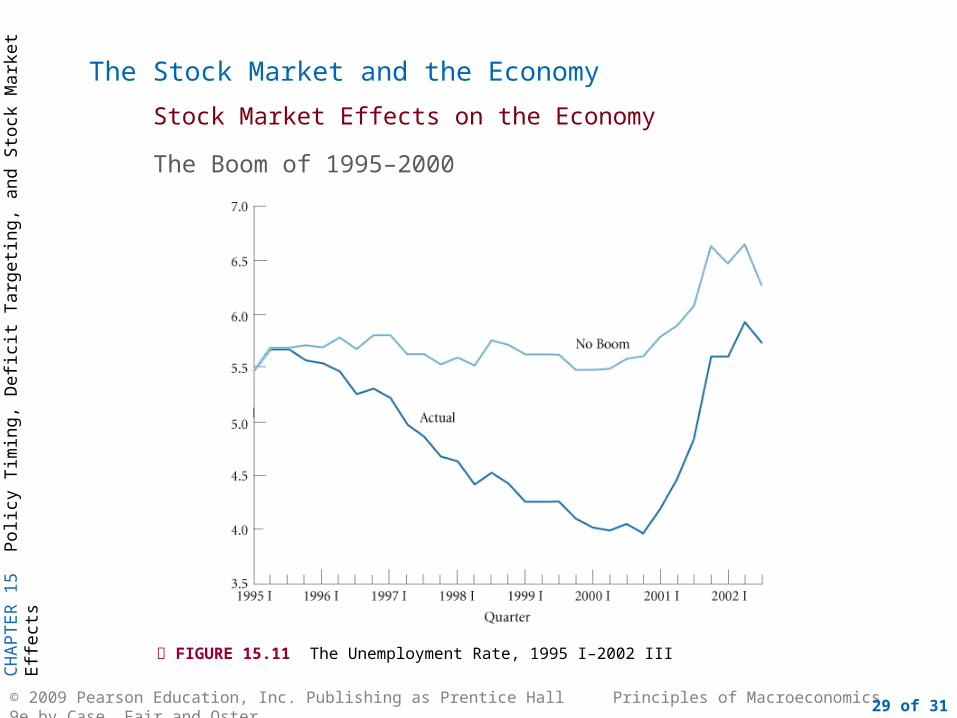
FIGURE 15.11 The Unemployment Rate, 1995 I–2002 III

CH
AP
TE
R 1
5 P
olic
y T
imin
g, D
efic
it T
arge
ting,
and
Sto
ck M
arke
t Effe
cts
© 2009 Pearson Education, Inc. Publishing as Prentice Hall Principles of Macroeconomics 9e by Case, Fair and Oster 30 of 31
The Stock Market and the Economy
Stock Market Effects on the Economy
The Boom of 1995–2000
FIGURE 15.12 Inflation Rate, 1995 I–2002 III

CH
AP
TE
R 1
5 P
olic
y T
imin
g, D
efic
it T
arge
ting,
and
Sto
ck M
arke
t Effe
cts
© 2009 Pearson Education, Inc. Publishing as Prentice Hall Principles of Macroeconomics 9e by Case, Fair and Oster 31 of 31
The Stock Market and the Economy
Stock Market Effects on the Economy
Fed Policy and the Stock Market
FIGURE 15.13 3-Month Treasury Bill Rate, 1995 I–2002 III

CH
AP
TE
R 1
5 P
olic
y T
imin
g, D
efic
it T
arge
ting,
and
Sto
ck M
arke
t Effe
cts
© 2009 Pearson Education, Inc. Publishing as Prentice Hall Principles of Macroeconomics 9e by Case, Fair and Oster 32 of 31
The Stock Market and the Economy
Stock Market Effects on the Economy
The Post-Boom Economy
Both stock market wealth and housing wealth have important effects on the economy.
Bubbles or RationalInvestors?
Bernanke’s Bubble Laboratory: Princeton Protégés of Fed Chief Study the Economics of Manias
Wall Street Journal

CH
AP
TE
R 1
5 P
olic
y T
imin
g, D
efic
it T
arge
ting,
and
Sto
ck M
arke
t Effe
cts
© 2009 Pearson Education, Inc. Publishing as Prentice Hall Principles of Macroeconomics 9e by Case, Fair and Oster 33 of 31
automatic destabilizers
automatic stabilizers
capital gain
deficit response index (DRI)
Dow Jones Industrial Average
Gramm-Rudman-Hollings Act
implementation lag
NASDAQ Composite
REVIEW TERMS AND CONCEPTS
negative demand shock
realized capital gain
recognition lag
response lag
stabilization policy
Standard and Poor’s 500 (S&P 500)
stock
time lags