chapter 16
TRANSCRIPT
Hansen, Mowen, Elias & Senkow (ITP, 1998)
Chapter 16-1
Week 11 - Quality Costs and Productivity:
Measurement, Reporting, and ControlChapter 16

Hansen, Mowen, Elias & Senkow (ITP, 1998)
Chapter 16-2
Learning Objectives
1. Identify and describe the four types of quality costs.
2. Prepare a quality cost report and explain the difference between the conventional view of acceptable quality level and the view espoused by total quality control.
3. Explain why quality cost information is needed and how it is used.
4. Explain what productivity is and calculate the impact of productivity changes on profits.

Hansen, Mowen, Elias & Senkow (ITP, 1998)
Chapter 16-3
Quality Defined
Quality of Design: The degree of excellence, which is a function of a product’s specifications
– Example: Compare a Cadillac Seville with a Honda Civic. The Seville is a luxury car with specially designed features and the Civic is an economy car with standard features. Both are designed to provide transportation but the design quality are obviously different
Quality of Conformance: The degree of excellence, which is a measure of how well the product meets its requirements or specifications
– Example: If the Honda Civic does what it is designed to do and does it well, quality exists. If an economy car is designed to provide reliable, low-cost, low-maintenance transportation, the desired quality exists

Hansen, Mowen, Elias & Senkow (ITP, 1998)
Chapter 16-4
Quality Dimensions
Performance consistently Aesthetics Serviceability Features or quality of design Reliability Durability Quality conformance Achievement of advertised functions

Hansen, Mowen, Elias & Senkow (ITP, 1998)
Chapter 16-5
Measuring the Costs of Quality
Control activities Prevention costs Appraisal costs
Failure activities Internal failure costs External failure costs
Hansen, Mowen, Elias & Senkow (ITP, 1998)
Chapter 16-6
Estimating Hidden Quality Costs
The Multiplier Method The Market Research Method

Hansen, Mowen, Elias & Senkow (ITP, 1998)
Chapter 16-7
Examples of Quality Costs
Prevention costs Appraisal Costs
Quality engineering Inspection of raw materials
Quality training Packaging inspection
Quality planning Product acceptance
Quality audits Process acceptance
Design reviews Field testing
Quality circles Supplier verification
Hansen, Mowen, Elias & Senkow (ITP, 1998)
Chapter 16-8
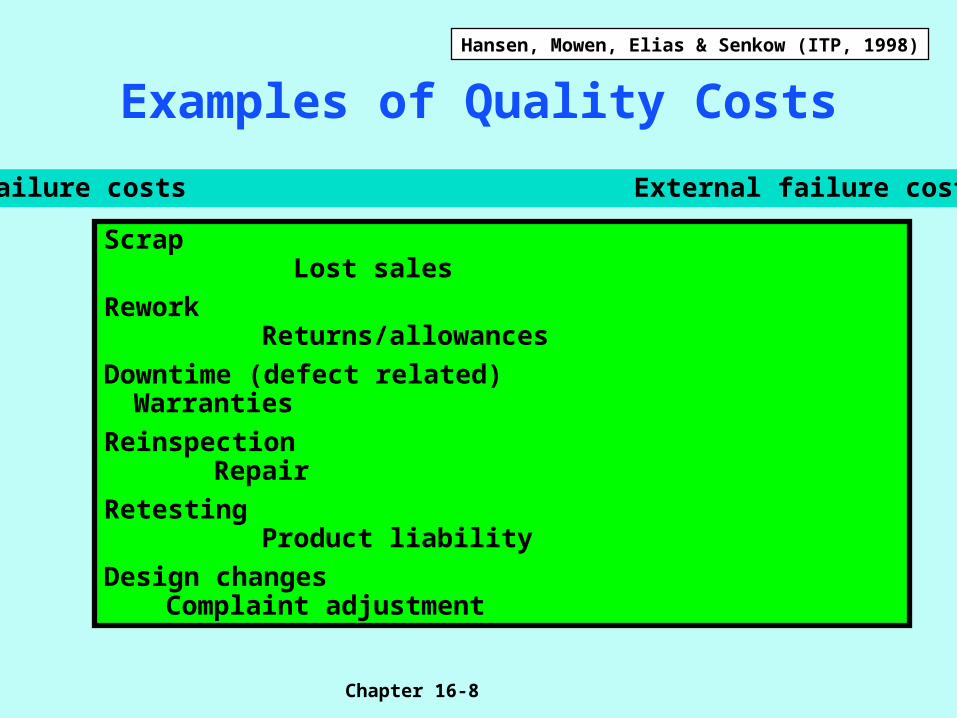
Internal failure costs External failure costs
Scrap Lost sales
Rework Returns/allowances
Downtime (defect related) Warranties
Reinspection Repair
Retesting Product liability
Design changes Complaint adjustment
Examples of Quality Costs

Hansen, Mowen, Elias & Senkow (ITP, 1998)
Chapter 16-9
Reporting Quality Costs Quality Costs %of Sales
Prevention costs:
Quality training $35,000
Reliability engineering 80,000 $115,000 4.11
Appraisal costs:
Materials inspection $20,000
Product acceptance 10,000
Process acceptance 38,000 68,000 2.43
Internal failure costs:
Scrap 50,000
Rework 35,000 85,000 3.04
External failure costs:
Customer complaints 25,000
Warranty 25,000
Repair 15,000 65,000 2.32
Total quality costs $333,000 11.90%
Hansen, Mowen, Elias & Senkow (ITP, 1998)
Chapter 16-10
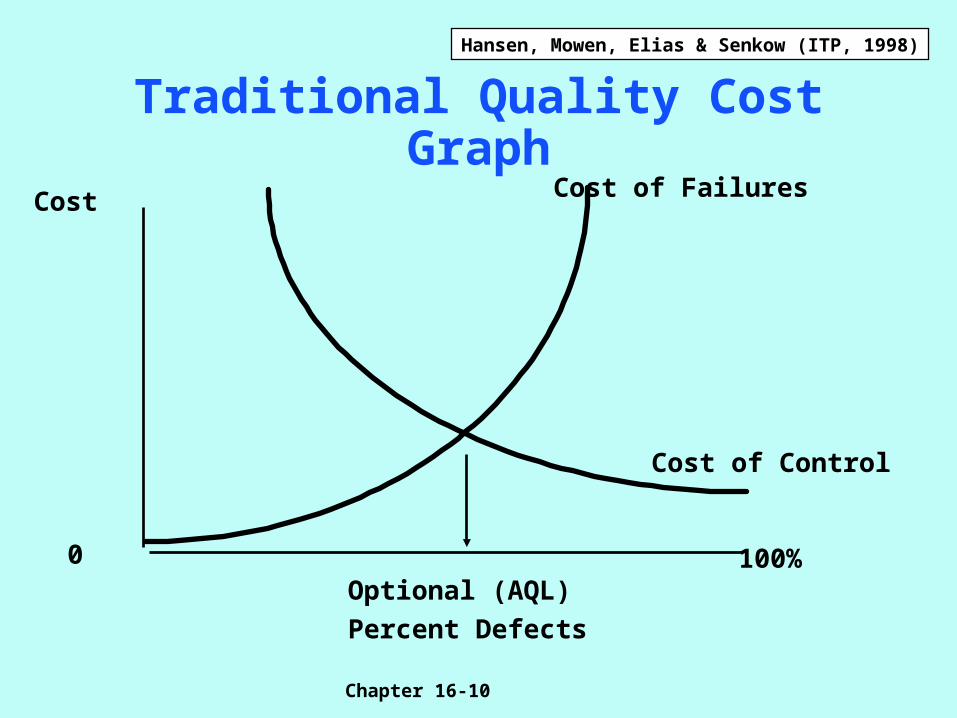
Traditional Quality Cost Graph
Cost
0Optional (AQL)
Percent Defects
100%
Cost of Failures
Cost of Control

Hansen, Mowen, Elias & Senkow (ITP, 1998)
Chapter 16-11
ZERO-DEFECT GRAPH
Cost Total
Quality
Cost
0 100%
Percentage Defects

Hansen, Mowen, Elias & Senkow (ITP, 1998)
Chapter 16-12
Types of Quality Performance Reports
Progress with respect to a current-period standard or goal.
Progress with respect to last year’s quality performance.
The progress trend since the inception of the quality improvement program.
Progress with respect to the long-range standard or goal.

Hansen, Mowen, Elias & Senkow (ITP, 1998)
Chapter 16-13
Prevention costs:
Quality training $35,000 $30,000 $5,000U
Reliability engineering 80,000 $115,000 80,000 $110,000 0 $5,000U
Appraisal costs:
Materials inspection $20,000 $28,000 $8,000F
Product acceptance 10,000 15,000 5,000F
Process acceptance 38,000 $68,000 35,000 $78,000 3,000U $10,000F
Internal failure costs:
Scrap 50,000 $44,000 6,000U
Rework 35,000 $85,000 36,500 $80,500 1,500F $4,500U
External failure costs:
Customer complaints 25,000 $25,000 $ 0
Warranty 25,000 20,000 5,000U
Repair 15,000 $65,000 17,500 $62,500 2,500F $2,500U
Total quality costs $333,000 $331,000 $2,000U
Cost Item Actual Costs Budgeted Costs Variance
Interim Quality Cost Report

Hansen, Mowen, Elias & Senkow (ITP, 1998)
Chapter 16-14
Actual Costs Actual Costs
Cost Item 1998 1997 Variance
Quality Cost: One-year Trend
Prevention costs:
Quality training $35,000 $36,000 $1,000F
Reliability engineering 80,000 $115,000 120,000 $156,000 40,000F $41,000F
Appraisal costs:
Materials inspection $20,000 $33,600 $13,600F
Product acceptance 10,000 16,800 6,800F
Process acceptance 38,000 $68,000 $39,200 $89,600 1,200F $21,600F
Internal failure costs:
Scrap 50,000 $48,000 2,000U
Rework 35,000 $85,000 40,000 $88,000 5,000F $3,000F
External failure costs:
Customer complaints 25,000 $33,000 $8,000F
Warranty 25,000 23,000 2,000U
Repair 15,000 $65,000 16,400 $72,400 1,400F $7,400F
Total quality costs $333,000 $406,000 $73,000F

Hansen, Mowen, Elias & Senkow (ITP, 1998)
Chapter 16-15
Multiple-Period Quality Costs
Quality Costs Actual Sales %of Sales
1994 $462,000 $2,200,000 21.0
1995 423,000 2,350,000 18.0
1996 412,500 2,750,000 15.0
1997 406,000 2,800,000 14.5
1998 333,000 2,800,000 11.9
Assume the following data:
Worksheet

Hansen, Mowen, Elias & Senkow (ITP, 1998)
Chapter 16-16
Multiple-Period Total Quality Costs
0
5
10
15
20
25
1994 1995 1996 1997 1998
Total Quality Costs as a % of Sales

Hansen, Mowen, Elias & Senkow (ITP, 1998)
Chapter 16-17
Multiple-Trend Analysis for Individual Quality Costs
Internal External
Prevention Appraisal Failure Failure
1994 6.0%1 4.5% 4.5% 6.0%
1995 6.0 4.0 3.5 4.5
1996 5.4 3.6 3.0 3.0
1997 5.6 3.2 3.1 2.6
1998 4.4 2.4 3.0 2.3
Assume the following quality cost data:
1Expressed as a % of sales

Hansen, Mowen, Elias & Senkow (ITP, 1998)
Chapter 16-18
Quality Cost Information
For monitoring quality performance For understanding the relationship between
quality and costs For suggesting alternative programs For implementing new programs

Hansen, Mowen, Elias & Senkow (ITP, 1998)
Chapter 16-19
Illustration of Productivity Improvement
Technical Efficiency: Condition where no more of any one input is used than necessary to produce a given output.
A. Technical efficiency improvement: using less input to produce the same output or producing more output using the same input.
B. Price efficiency improvement: using a less costly input mix to produce the same output.

Hansen, Mowen, Elias & Senkow (ITP, 1998)
Chapter 16-20
Partial Productivity Measures
I. Partial Productivity Measurement: measuring productivity for one input at a time.
Partial Measure = Output / Input
II. Operational Productivity Measure: partial measure where both input and output are expressed in physical terms.

Hansen, Mowen, Elias & Senkow (ITP, 1998)
Chapter 16-21
Productivity: Measurement and Control
Productivity Measurement Defined - Productivity is the
relationship between output and the inputs used to produce
the output.
Partial Productivity Ratio = Output/Input

Hansen, Mowen, Elias & Senkow (ITP, 1998)
Chapter 16-22
Productivity Measurement
Assume the following data:
1995 1996
Number of heaters produced 110,000 110,000
Labour hours used 11,000 10,000
Material used (kgs.) 110,000 88,000
Unit selling price (heaters) $25 $25
Wages per labour hour $10 $10
Cost per pound of material $5 $5

Hansen, Mowen, Elias & Senkow (ITP, 1998)
Chapter 16-23
Operational Productivity Measurements
1995a 1996b
Labour productivity ratio 10.00 11.00
Material productivity ratio 1.00 1.25
Ratios do not reveal the value of the improvement
labour: 110,000/11,000; Materials: 110,000/110,000bLabour: 110,000/10,000; Materials: 110,000/88,000

Hansen, Mowen, Elias & Senkow (ITP, 1998)
Chapter 16-24
Profit-Linked Productivity Measurement
Profit-Linkage Rule: The measure of value of productivity changes
is the difference between costs of inputs that should be used
in the absence of any productivity change and the cost of inputs
actually used. The difference in costs is the amount by which profits
changed because of productivity changes.
Hansen, Mowen, Elias & Senkow (ITP, 1998)
Chapter 16-25
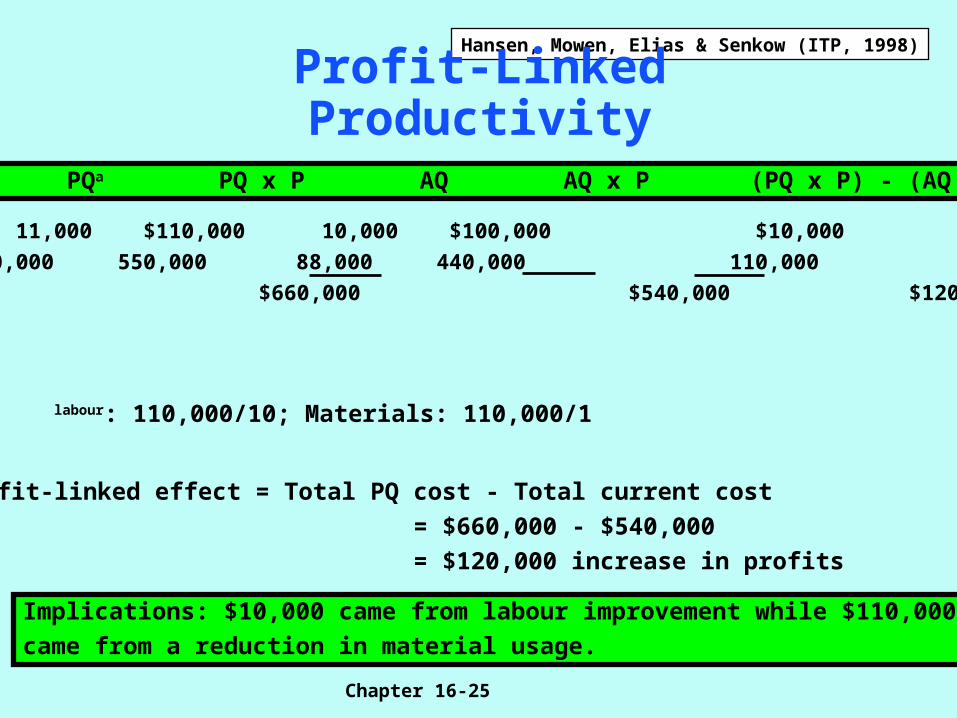
Profit-Linked Productivity
Input PQa PQ x P AQ AQ x P (PQ x P) - (AQ x P)
Labour 11,000 $110,000 10,000 $100,000 $10,000
Materials 110,000 550,000 88,000 440,000 110,000
$660,000 $540,000 $120,000
labour: 110,000/10; Materials: 110,000/1
Profit-linked effect = Total PQ cost - Total current cost
= $660,000 - $540,000
= $120,000 increase in profits
Implications: $10,000 came from labour improvement while $110,000
came from a reduction in material usage.

Hansen, Mowen, Elias & Senkow (ITP, 1998)
Chapter 16-26
In-Class AssignmentPrevention
- quality engineering
- receiving inspection
- quality training
Appraisal
- product inspection
Internal failure
- scrap
- rework
External failure
- net cost of returned products

Hansen, Mowen, Elias & Senkow (ITP, 1998)
Chapter 16-27
Cost of Quality Report Shortcomings
Information is not explicitly gathered Budgets are not prepared Quantitative measures are missing Responsibility not properly delegated

Hansen, Mowen, Elias & Senkow (ITP, 1998)
Chapter 16-28
Numerical Questions from the Back of Chapter 16
W16-3, E16-3, E16-7,E16-13.

Hansen, Mowen, Elias & Senkow (ITP, 1998)
Chapter 16-29
Question E16-3
Please return to the textbook to read the question.

Hansen, Mowen, Elias & Senkow (ITP, 1998)
Chapter 16-30
Question E16-7
Please return to the textbook to read the question.

Hansen, Mowen, Elias & Senkow (ITP, 1998)
Chapter 16-31
Question E16-13
Please return to the textbook to read the question.