chapter 17 economic analysis in the public sector
TRANSCRIPT
Engineering Economics
Er. Sushant Raj Giri B.E. (Industrial Engineering), MBA
Lecturer Department of Industrial Engineering
Contemporary Engineering Economics 3rd Edition Chan S Park
1
Lecture 10

2
Chapter 17 Economic Analysis in the Public
Sector • Framework of Benefit-
Cost Analysis • Valuation of Benefits
and Costs • Benefit-Cost Ratios • Analysis of Public
Projects Based on Cost-Effectiveness

3
Benefit-Cost Analysis
• Benefit-cost analysis is commonly used to evaluate public projects.
• Benefits of a nonmonetary nature can be quantified and factored into the analysis.
• A broad range of project users distinct from the sponsor should be considered—benefits and disbenefits to all these users can (and should) be taken into account,

4
Framework of Benefit-Cost Analysis
1) Identifying all the users and sponsors of the project.
2) Identifying all the benefits and disbenefits of the project.
3) Quantifying all benefits and disbenefits in dollars or some other unit of measure.
4) Selecting an appropriate interest rate at which to discount benefits and costs to a present value.

5
Benefit-Cost Ratio Criterion
Benefit - Cost Ratio = Equivalent Users' Net BenefitsEquivalent Sponsor' s Net Cost
If this BC ratio exceeds 1, the project can be justified

6
Definition of Benefit-Cost Ratio B b i
C c i
nn
n
N
nn
n
N
= +
= +
−
=
−
=
∑
∑
( )
( )
1
1
0
0
bn=Benefit at the end of period n, cn=Expense at the end of period n, An= bn – cn N = Project life i =Sponsor’s interest rate (discount rate)
bn ≥ 0cn ≥ 0

7
I c i
C c i
BC i BC
BI C
I C
nn
n
K
nn
n K
N
= +
= +
= =+
+ >
−
=
−
= +
∑
∑
( )
' ( )
( )', '
1
1
0
0
1
Equivalent capital investment
Equivalent O&M costs

8
Example 17.1 BC Analysis

9
B P F P FP F P F
C P F P F P FP F P F
I P F
C C I
BC
= $20( / , ) + $30( / , )+$30( / , ) + $20( / , )
= $71.
= $10 + $10( / , ) + $5( / , ) + $5( / , )+ $8( / , + $8( / , )
= $37.41 = $10 + $10( / , )
= $19.’ = –
= $18.
10%, 2 1%, 310%, 4 10%, 5
98
10%, 1 10%, 2 10%, 310%, 4 10%, 5
10%, 109
3
10%) 71 9809 32
1 92
)
( .$19. $18.
.=+
= >1, Accept the project.
10
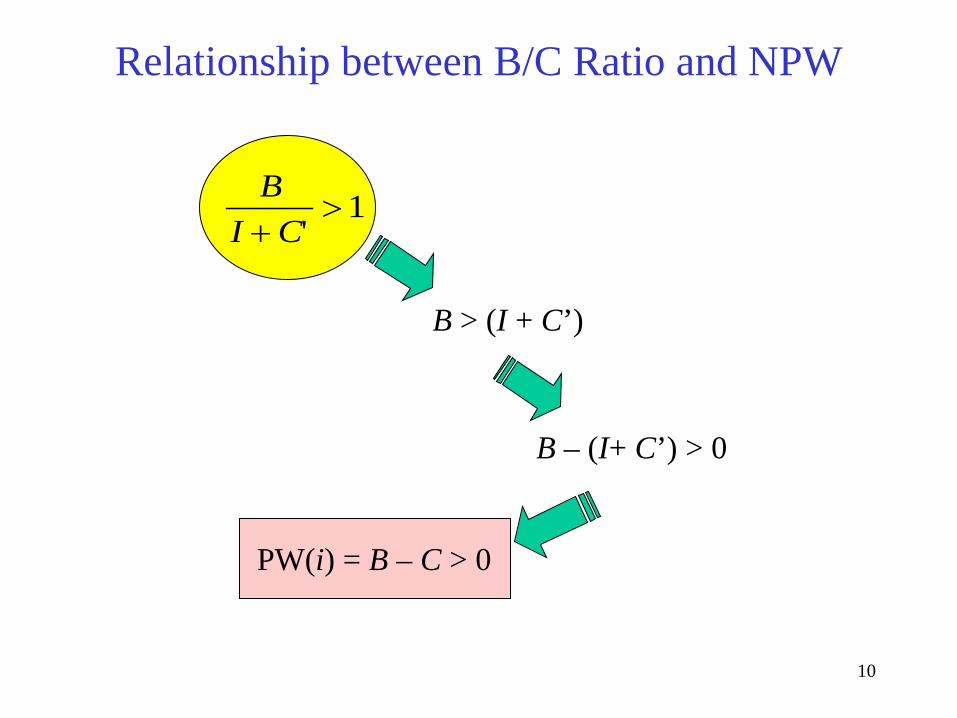
Relationship between B/C Ratio and NPW
BI C+
>'
1
B > (I + C’)
B – (I+ C’) > 0
PW(i) = B – C > 0

11
Incremental Analysis Based on BC(i)
∆
∆
∆
B B B
I I IC C C
k j
k J
k j
= −
= −
= −' ' '
BC i BI Ck j( )
'− =+∆
∆ ∆

12
Example 17.2 Incremental Benefit-Cost Ratios
A1 A2 A3
I $5,000 $20,000 $14,000
B 12,000 35,000 21,000
C’ 4,000 8,000 1,000
PW(i) $3,000 $7,000 $6,000

13
Solution A1 A2 A3
BC(i) 1.33 1.25 1.40
Ranking Base A1 A3 A2
I +C’ $9,000 $15,000 $28,000
BC i( ) $35, $21,($20, $14, ) ($8, $1, ). ,
2 3000 000
000 000 000 0001 08 1
− =−
− + −= > select A2.
BC i( ) $21, $12,($14, $5, ) ($1, $4, ). ,
2 1000 000
000 000 000 0001 5 1
− =−
− + −= > select A2.

14
General Procedure for Cost-Effectiveness Studies
• Step 1: Establish the goals to be achieved by the analysis. • Step 2: Identify the imposed restrictions on achieving the
goals, such as budget or weight. • Step 3: Identify all the feasible alternatives to achieve the
goals. • Step 4: Identify the social interest rate to use in the analysis. • Step 5: Determine the equivalent life-cycle cost of each
alternative, including research and development, testing, capital investment, annual operating and maintenance costs, and salvage value.

15
• Step 6: Determine the basis for developing the cost-effectiveness index. Two approaches may be used; – (1) the fixed-cost approach and – (2) the fixed-effectiveness approach. – If the fixed-cost approach is used, determine the
amount of effectiveness obtained at a given cost. – If the fixed-effectiveness approach is used, determine
the cost to obtain the predetermined level of effectiveness.
• Step 7: Compute the cost-effectiveness ratio for each alternative based on the selected criterion in Step 6.
• Step 8: Select the alternative with the maximum cost-effective index.
16
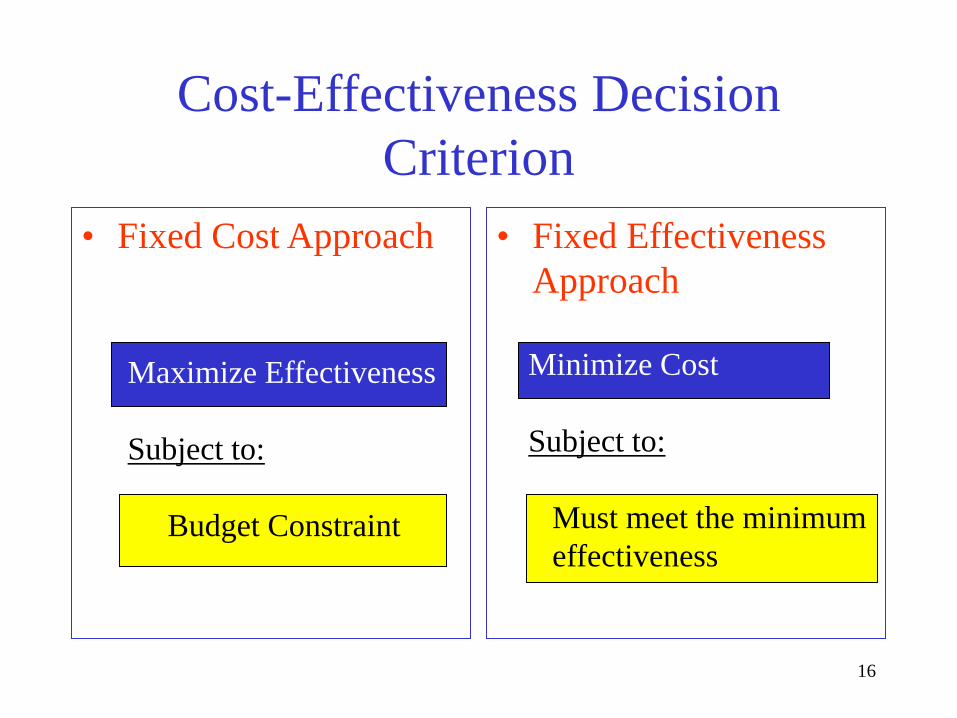
Cost-Effectiveness Decision Criterion
• Fixed Effectiveness Approach
• Fixed Cost Approach
Maximize Effectiveness Subject to: Budget Constraint
Minimize Cost Subject to: Must meet the minimum effectiveness

17
Case Study - Selecting an Weapon System

18
Weapon System Alternatives
Alternative Aj Advantage Disadvantage Probability of Kill
A1: Inertial navigation system
Low cost, mature technology.
Accuracy, target recognition
0.33
A2: Inertial navigation system: Global positioning system
Moderate cost, nature technology
Target recognition 0.70
A3: Imaging infrared (I2R)
Accurate, target recognition
High cost, bunkered target detection
0.90
A4: Synthetic aperture radar
Accurate, target recognition
High cost 0.99
A5: Laser detection/ranging
Accurate, target recognition
High cost, technical maturity
0.99
A6: Millimeter wave (MMW)
Moderate cost, accurate
Target recognition 0.80
19
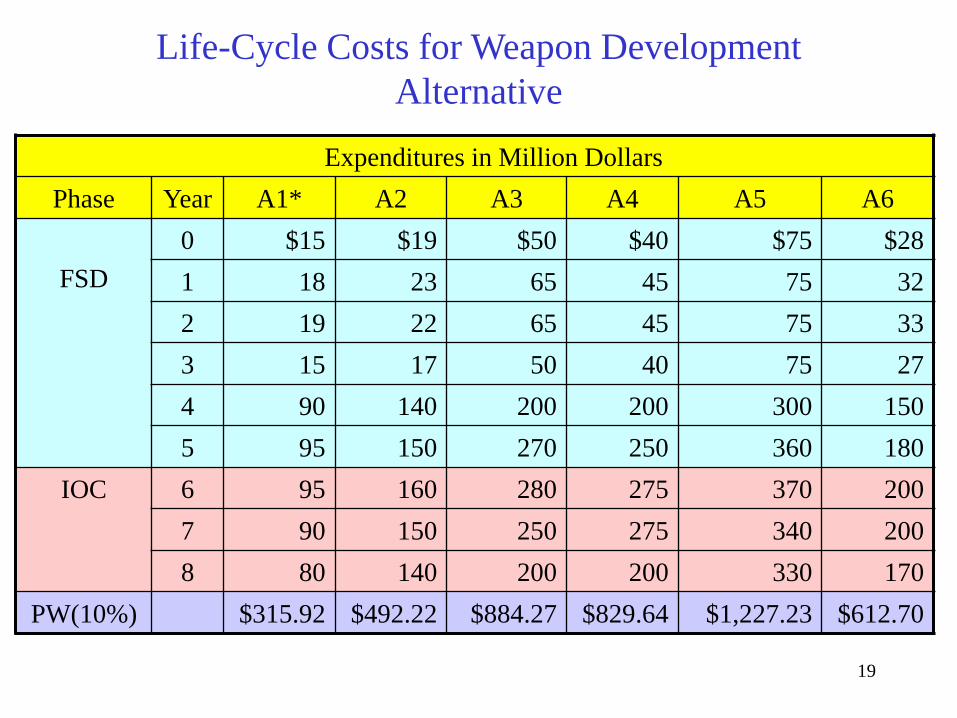
Life-Cycle Costs for Weapon Development Alternative
Expenditures in Million Dollars Phase Year A1* A2 A3 A4 A5 A6
FSD
0 $15 $19 $50 $40 $75 $28 1 18 23 65 45 75 32 2 19 22 65 45 75 33 3 15 17 50 40 75 27 4 90 140 200 200 300 150 5 95 150 270 250 360 180
IOC 6 95 160 280 275 370 200 7 90 150 250 275 340 200 8 80 140 200 200 330 170
PW(10%) $315.92 $492.22 $884.27 $829.64 $1,227.23 $612.70

20
Cost-Effectiveness Index Type Cost/Unit Probability
of Kill Cost/Kill Kill/Cost
A1 $31,592 0.33 $95,733 0.0000104
A2 49,220 0.70 70,314 0.0000142
A3 88,427 0.90 98,252 0.0000102
A4 82,964 0.90 83,802 0.0000119
A5 122,723 0.99 123,963 0.0000081
A6 61,370 0.80 76,713 0.0000130

21
$130,000
120,000
300 400 500 600 700 800 900 1000 1100 1200 1300
Unacceptable region
Cos
t/kill
Present value of life cycle cost ($ million)
A1 A3
A6
A4
A5
110,000
100,000
90,000
80,000
70,000 A2
Fixed cost
Maximize effectiveness
22
Summary • Benefit-cost analysis is commonly used to evaluate
public projects: • Difficulties involved in public project analysis include
the following: 1) Identifying all the users who can benefit from the
project. 2) Identifying all the benefits and disbenefits of the
project. 3) Quantifying all benefits and disbenefits in dollars or
some other unit of measure. 4) Selecting an appropriate interest rate at which to
discount benefits and costs to a present value.

23
• The B/C ratio is defined as:
The decision rule is if BC(i) > 1, the project is acceptable. • The net B/C ratio is defined as
The net B/C ratio expresses the net benefit expected per
dollar invested. The same decision rule applies as for the B/C ratio.
B C i B CI
BI
I/ ( ) ' '',=
−= > 0
BC i BC
BI C
I C( )', '= =
++ > 0

24
• The cost-effectiveness method allows us to compare projects on the basis of cost and nonmonetary effectiveness measures.
• We may either maximize effectiveness for a given cost criterion or minimize cost for a given effectiveness criterion.

End of Lecture 10

Notice!!!
Date: September 1, 2015 11:00 AM
26
Internal Assessment

Examination Pattern
Phase I: Objective Round 10 Questions (1 marks for correct answer, -0.2 for each incorrect one) Phase II: Subjective Round 2 Short Questions (5 marks each) 1 Long Question (10 marks)
27

Scheme for Internal Evaluation
Assessment: 50% Assignments: 50%
Total Internal Evaluation: 100%
28

Chance Assignment
Chapter 8 (Page 383) 8.1, 8.4, 8.8, 8.12, 8.16, 8.21, 8.26, 8.32, 8.35 Chapter 9 (Page 436) 9.1, 9.5, 9.7, 9.10, 9.12, 9.16, 9.21, 9.25, 9.28
29
Submission Deadline:
September 1, 2015 (Tuesday)