chapter 17 ppp options for toll road development
TRANSCRIPT

CHAPTER 17
PPP OPTIONS FOR TOLL ROAD DEVELOPMENT

17-1
CHAPTER 17 PPP OPTIONS FOR TOLL ROAD DEVELOPMENT
17.1 CONCEPTS OF PPP 17.1.1 Definition of PPP
While there is no widely accepted definition of Public-Private Partnerships (PPP), ADB introduce the following definition and concepts in the Public-Private Partnership Handbook, 2008. The term “public-private partnership” (PPP) describes a range of possible relationship among public and private entities in the context of infrastructure and other services. Other terms used for this type of activity include “private sector participation” (PSP) and privatization (PRV). While the three terms have often been used interchangeably, there are differences.
PPPs present a framework that – while engaging the private sector – acknowledge and structure the role for government in ensuring that social obligations are met and successful sector reforms and public investments achieved.
A strong PPP allocates the tasks, obligations, and risks among the public and private partners in an optional way. The public partners in PPP are government entities, and the private partners may include businesses or investors with technical or financial expertise relevant to the project. The private sector brings his capital and ability to deliver projects on time and to budget, while the public sector retains the responsibility to provide these services to the public in a way that benefits the public and delivers economic development and an improvement in the quality of life.
PSP is a term often used interchangeably with PPPs. However contracts transfer obligation to
the private sector rather than emphasizing the opportunity for partnership. The critical analysis of PSP experience has led to the design of a new generation of transactions, which are now more commonly known as PPPs.
Privatization involves the sale of shares or ownership in a company or the sale of operating
assets or services owned by the public sector. Privatization is most common and more widely accepted in sectors that are not traditionally considered public services, such as manufacturing, construction, etc.
PPPs structures shown in Figure 17.1.1-1 indicates that PPPs fill a space between traditionally procured government projects and full privatization where government no longer has a direct role in on-going projects. PPP may enable to develop project, which do not have enough profitability with revenues and are not self-sustaining.

17-2
Source: Heather Skilling and Kathleen Booth, 2007.
FIGURE 17.1.1-1 PPP STRUCTURES
17.1.2 Objectives of PPPs
Governments recognize the indispensable role of the private sector as the main engine for national growth and development. Private sector resources shall be utilized for the purposes of providing services, financing and constructions, operation and maintenance of infrastructure projects. There are ranges of reasons that governments enter into PPPs for infrastructures including the followings.
Mobilization of Private Capital
Governments face an-ever-increasing need to find sufficient financing to develop and maintain infrastructure required to support growing population. Combined with most governments’ limited financial capacity, there is a desire to mobilize private sector capital and provide increased infrastructure provision and services.
The end of the private sector in entering into a PPP is to seek compensation for its services through fees for services rendered, resulting in an appropriate return on capital invested.
Tool for Greater Efficiency
The public sector has few incentives for efficiency structured into its organization and process
and is thus poorly positioned to efficiently build and operate infrastructure. The private sector, however, enters into an investment with the clear goal of maximizing profits, by increased efficiency in investment and operations with full utilization of the private sector’s skills.
Concession
BOT
BOO
Affermage/Lease
Self- Sustaining PFI
Joint Venture PFI Service-
Provision PFI
Privatization
Traditional Public Sector Operation
Outsourcing
PFI
Low/Nil
High Profitability
Weak
Need of Public Sector Involvement
Strong
PPP

17-3
17.1.3 Requirements of PPPs
PPPs aim at financing, designing, implementing public sector facilities and services. They refer to innovative methods used by the public sector to contract with the private sector to be followed by several requirements including the followings.
Key Characteristics in Contract PPPs can follow a variety of structures and contractual formats, but shall incorporate three key characteristics.
A contractual agreement defining the roles and responsibilities of the parties. Sensible risk-sharing among the public and the private sector partners, and Financial rewards to the private party commensurate with achievement of pre-specified
output.
Government Commitment
The private sector expects government to be a competent partner in discharging its obligations in terms of policy and reform planning, project development, and contract oversight. The government is also expected to establish the appropriate legal and other frameworks to set target, monitor progress, evaluate progress, report progress, enforce the contract provisions, and handle disputes. The government’s commitment to the strategy is demonstrated in several ways; through a public statement of the strategy and expectation of PPP; through stakeholder consultation and transparency of process; and through the provision of adequate funding and support for the process. Stakeholder Consultation
Stakeholder consultation is increasingly seen as important for success of PPP projects. Inadequate consultation with stakeholders increases the danger of opposition, potentially late in the process, leading to delays or even cancellation. Furthermore, the stakeholders are critical to the sustainability of a PPP. Even if the contract is awarded despite opposition, the difficulty and risk of the project increase drastically if public support is not present. There must be a consultation process to reconcile and prioritize issues in implementing PPP projects. The stakeholders have different roles and interests as shown in Figure 17.1.3-1.

17-4
Source: Heather Skilling and Kathleen Booth, 2007.
FIGURE 17.1.3-1 RANGE OF STAKEHOLDER INTERESTS IN PPPS
For stakeholders to play an active role in the PPP process, they must be given not only a forum for participation but also the information they need to participate effectively.
* Maximize revenue* Provide universal access to service* Ensure affordable basic service* Promote fair competition* Attract investors* Improve public welfare
* Ensure fair treatment of present * Ensure fair pricing employees * Improve quality and reliability* Provide career opportunities of service* Improve productivity, efficiency, * Increase accountability and and morale responsiveness
* Ensure stable, transparent regulatory process* Enable organizational restructuring and asset allocations that favor efficient operations* Provide trained human resources* Generate more investment opportunities
Employees Employees
Government
Investors
StakeholderInterests

17-5
17.2 TYPES OF PPP 17.2.1 Available PPP Options
There are a range of PPP models that allocate responsibilities and risks between the public and private partners in different ways including the following basic PPP contract types. Refer to Table 17.2.1-1.
(1) Service Contracts
Under a service contract, the government hires a private company or entity to carry out one or more specific tasks or services for a period, typically 1-3 years. Service contracts are unsuitable if the main objective is to attract capital investment. The private company is not under an obligation to provide financing. The government pays the private company a pre-determined fee for the service, which may be based on a one-time, unit cost, or other basis.
(2) Management Contracts A management contract expands the services to be contracted out to include some or all of the management and operation of the public service. Although ultimate obligation for service provision remains in the public sector, daily management control and authority is assigned to the private contractor.
The private contractor is paid a pre-determined rate for the labor and other anticipated operating costs.
(3) Affermage or Lease Contracts
Under a lease contract, the private partner is responsible for the service in its entirety and undertakes obligations relating to quality and service standards. The private partner provides service at his expense and risk. The initial establishment of the system is financed by the public authority and contracted to a private company for operation and maintenance. Leases do not involve any sale of assets to the private sector.
The revenues for the private contractor are derived from customer payments; therefore the tariff level becomes increasingly sensitive. Figure 17.2.1-1 shows the lease contract’s typical structure.
Regulation:Tariff setting
Service standards
Environmental monitoring
Government
Concessionaire
Consumers
Lenders
Shareholders
Reporting
Concession contract
Finance/ Equity
Revenues Services
Government
Asset Company
Fermier/Lessee
Investment Approval
Affermage/Lease Contract • Performance
Target • Variable Fees
Reporting
Regulation: Tariff setting
Service standardsEnvironmental
monitoring
Planning
Source: Heather Skilling and Kathleen Booth, 2007
FIGURE 17.2.1-1 STRUCTURE OF LEASE CONTRACT

17-6
(4) Concessions
Under a concession, the private sector operator (concessionaire) is responsible for the full delivery of service in a specified area, including operation, maintenance, collection, management and construction and rehabilitation of system. The operator is responsible for all capital investment, and the public sector’s role shifts from being the service provider to regulating the price and quality of service. The concessionaire collects the tariff directly from the system users, which is established by the concession contract.
A key advantage of the concession arrangement is that it provides incentives to the operator to achieve improved level of efficiency and effectiveness since gains in efficiency translate into increased profits and return to its concessionaire. But, there is a risk that the operator will only invest in new assets where it expects payback within the remaining period of the contract. A concession contract’s typical structure is shown in Figure 17.2.1-2.
(5) BOT and Similar Arrangements
Build-Operate-Transfer (BOT) and similar arrangements are a kind of specialized concession in which a private firm or consortium finances and develops a new infrastructure project according to performance standards set by the government. There are many variations on the basic BOT structure including build-transfer-operate (BTO), build-own-operate (BOO), design-build-operate (DBO),design-build-finance-operate (DBFO), and design build (DB).
Source: Heather Skilling and Kathleen Booth, 2007
Source: Heather Skilling and Kathleen Booth, 2007
Government/Public Utility
Private Developer
BOT
Consumers (Directly or
through Distributor)
Eventual Return of Investment
Capital Investment
Revenues
Tariffs Services
Regulation:Tariff setting
Service standards
Environmental monitoring
Government
Concessionaire
Consumers
Lenders
Shareholders
Reporting
Concession contract
Finance/ Equity
Revenues Services
FIGURE 17.2.1-2 STRUCTURE OF CONCESSION CONTRACT
FIGURE 17.2.1-3 STRUCTURE OF BOT CONTRACT

17-7
The distinction between a BOT type arrangement and a concession is that a concession generally involves extensions to and operation of existing systems, whereas a BOT generally involves Greenfield investments requiring substantial outside finance, for both equity and debt. Figure 17.2.1-3 illustrates the BOT contract structure.
(6) Joint Venture
Joint ventures are alternatives to full privatization in which the infrastructure is co-owned and operated by the public and private operators. Under a joint venture, the public and private sector partners can either form a new company or assume joint ownership of an existing company through a sale of shares to one or several private investors. Joint ventures are real partnership of the public and private sectors that match the advantages of the private sector with the social concerns and local knowledge of the public sector. Government’s dual roles as owner and regulator can lead to conflict of interest. Joint ventures also have a tendency to be directly negotiated or to follow a less formal procurement path, which can lead to concern for corruption. Figure 17.2.1-4 is the typical joint venture contract’s structure.
Government
Private Owner/Operator
Consumers
Reporting
Asset Ownership (full or partial)
RevenuesServices
Regulation:Tariff setting
Service standards
Environmental monitoring
Source: Heather Skilling and Kathleen Booth, 2007FIGURE 17.2.1-4 STRUCTURE OF JOINT VENTURE CONTRACT

17-8
TABLE 17.2.1-1 SUMMARY OF KEY FEATURES OF BASIC FORMS OF PUBLIC-PRIVATE PARTNERSHIP (PPP)
SERVICE CONTRACTS
MANAGEMENT CONTRACTS
LEASE CONTRACTS CONCESSION BOT AND
VARIATIONS
Scope Multiple contracts for a variety of support services.
Management of entire operation or a major component
Responsibility for management, operations, and specific renewals
Responsibility for all operations and for financing and execution of specific investments
Investment in and operation of a specific major component
Asset Ownership
Public Public Public Public/Private Public/Private
Duration 1-3 years 2-5 years 10-15 years 25-30 years Varies
O&M Responsibility
Public Private Private Private Private
Capital Investment
Public Public Public Private Private
Commercial Risk
Public Public Shared Private Private
Overall Level of Risk Assumed by Private Sector
Minimal Minimal/moderate Moderate High High
Compensation Terms
Unit prices Fixed fee, preferably with performance incentives
Portion of tariff revenues
All or part of tariff revenues
Mostly fixed, part variable related to production parameters
Special Features
Useful as part of strategy for improving efficiency of public company; Promotes local private sector development
Interim solution during preparation for more intense private participation
Improves operational and commercial efficiency; Develops local staff
Improves operational and commercial efficiency; Mobilizes investment finance; Develops local staff
Mobilizes investment finance; Develops local staff
Problems and Challenges
Requires ability to administer multiple contracts and strong enforcement of contract laws
Management may not have adequate control over key elements, such as budgetary resources, staff policy, etc.
Potential conflicts between public body which is responsible for investments and the private operator
How to compensate investments and ensure good maintenance during last 5-1o years of contract
Does not necessarily improve efficiency of ongoing operations; May require guarantees
Note: BOT = build-operate-transfer, O&M = operation and maintenance
Source: Heather Skilling and Kathleen Booth, 2007

17-9
17.2.2 Contractual Arrangements in the Philippine BOT Law
The Revised IRR of the Philippine BOT Law prescribes the following contractual arrangements or schemes, as well as other variations thereof, as may be approved by the President, by which infrastructure and/or developments projects may be undertaken.
Build-and-transfer (BT) Build-lease-and-transfer (BLT) Build-operate-and-transfer (BOT) Build-own-and-operate (BOO) Build-transfer-and-operate (BTO) Contract-add-and-operate (CAO) Develop-operate-and-transfer (DOT) Rehabilitate-Operate-and-Transfer (ROT) Rehabilitate-own-and-operate (ROO)
The BLT, BOT, BOO and BTO Arrangements are defined as follows. The major characteristics of agreements are summarized in Table 17.2.2-1. Build-lease-and-transfer (BLT) A contractual arrangement whereby a Project Proponent is authorized to finance and construct an infrastructure or development facility and upon its completion turns it over to the Agency/LGU concerned on a lease arrangement for a fixed period, after which ownership of the facility is automatically transferred to the Agency/LGU concerned. Build-operate-and-transfer (BOT) A contractual arrangement whereby the Project Proponent undertakes the Construction, including financing, of a given infrastructure facility, and the operation and maintenance thereof. The Project Proponent operates the facility over a fixed term during which it is allowed to charge facility users appropriate tolls, fees, rentals, and charges not exceeding those proposed in its bid or as negotiated and incorporated in the contract to enable the Project Proponent to recover its investment, and operating and maintenance expenses in the project. The Project Proponent transfers the facility to the Agency/LGU concerned at the end of the fixed term that shall not exceed fifty (50) years. This build-operate-and-transfer contractual arrangement shall include a supply-and-operate scheme which is a contractual arrangement whereby the supplier of equipment and machinery for a given infrastructure facility, it the interest of the Government so requires, operates the facility providing in the process technology transfer and training to Filipino nationals. Build-own-and-operate (BOO) A contractual arrangement whereby a Project Proponent is authorized to finance, construct, own, operate and maintain an infrastructure or development facility from which the Project Proponent is allowed to recover its total investment, operating and maintenance costs plus a reasonable return thereon by collecting tolls, fees, rentals, or other charges from facility users; provided, That all such projects upon recommendation of the Investment Coordination Committee (ICC) of the National Economic and Development Authority (NEDA), shall be approved by the President of the Philippines. Under this project the proponent who owns the assets of the facility may assign its operation and maintenance to a Facility operator.

17-10
Build-transfer-and-operate (BTO)
A contractual arrangement whereby the Agency/LGU contracts out the Construction of an infrastructure facility to a private entity such that the Contractor builds the facility on a turnkey basis, assuming cost overruns, delays, and specified performance risks. Once the facility is commissioned satisfactorily, title is transferred to the implementing Agency/LGU. The private entity however operates the facility on behalf of the implementing Agency/LGU under an agreement. The Philippine BOT Law does not discuss the contractual arrangements of Design-Build-Operate (DBO) and Design-Build-Finance-Operate (DBFO).

17-11
TABLE 17.2.2-1 TYPICAL TYPES OF CONTRACTUAL AGREEMENTS IN THE PHILIPPINES BOT LAW
17-11
Option
Type
Public Undertaking
Private Undertaking
Typical Applications
Major Risk Allocation
Publ
ic P
roje
ct
Type 0 Conventional
• ROW Acquisition • Design & Construction • Operation &
Maintenance • All Finances
(Contract –out to consultant and contractor for design and construction, respectively)
• Economically feasible, but not
financially. • Sensitive in natural and social
environment
• All risks with the
government
Spec
ial C
ase
Type 1
Build-and- Transfer (BT)
• ROW Acquisition • Operation
• Design & Construction
and its Finance
• Critical facilities with security or
strategic reasons • Special Projects
• After completion, turn it
over to the government on Payment Schedule Agreement of total investment and reasonable return
Type 2
Build-Lease-and- Transfer (BLT)
• ROW Acquisition • (Operation)
• Design & Construction
and its Finance • (Operation)
• Financially feasible with the
government support.
• After completion, turn it
over to the government on Lease Agreement
Tran
sfer
afte
r Con
stru
ctio
n
Type 3
Build-Transfer-and- Operate (BTO)
ROW Acquisition
• Design & Construction on
Turnkey Basis • Operation & Maintenance
• Financially feasible with the
government support.
• After completion, turn it
over on Operation Agreement
• Construction cost overruns, delays, and specified performance risks
PPP
Tran
sfer
afte
r O
pera
tion
Type 4
Build-Operate-and-Transfer (BOT)
• ROW Acquisition
• Design & Construction
and its Finance • Operation & Maintenance
• Financially feasible with or
without government support
• Transfer at the End of
Term • All Risks including Toll
Revenue with Private Sector
• ROW Acquisition
17-12
17.3 IMPLEMENTATION OPTIONS THROUGH PPP SCHEMES 17.3.1 Expectations and Characteristics of Toll Road Projects
(1) Expectations in PPPs
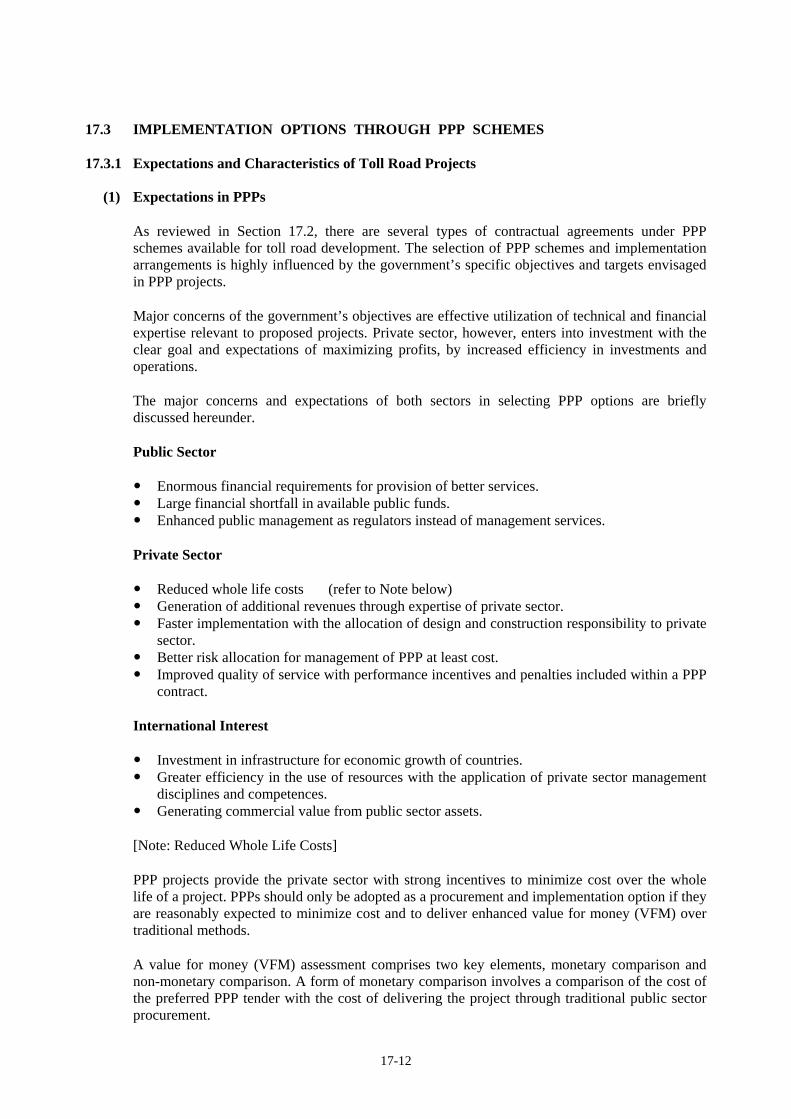
As reviewed in Section 17.2, there are several types of contractual agreements under PPP schemes available for toll road development. The selection of PPP schemes and implementation arrangements is highly influenced by the government’s specific objectives and targets envisaged in PPP projects. Major concerns of the government’s objectives are effective utilization of technical and financial expertise relevant to proposed projects. Private sector, however, enters into investment with the clear goal and expectations of maximizing profits, by increased efficiency in investments and operations. The major concerns and expectations of both sectors in selecting PPP options are briefly discussed hereunder. Public Sector
Enormous financial requirements for provision of better services. Large financial shortfall in available public funds. Enhanced public management as regulators instead of management services.
Private Sector
Reduced whole life costs (refer to Note below) Generation of additional revenues through expertise of private sector. Faster implementation with the allocation of design and construction responsibility to private
sector. Better risk allocation for management of PPP at least cost. Improved quality of service with performance incentives and penalties included within a PPP
contract.
International Interest
Investment in infrastructure for economic growth of countries. Greater efficiency in the use of resources with the application of private sector management
disciplines and competences. Generating commercial value from public sector assets.
[Note: Reduced Whole Life Costs] PPP projects provide the private sector with strong incentives to minimize cost over the whole life of a project. PPPs should only be adopted as a procurement and implementation option if they are reasonably expected to minimize cost and to deliver enhanced value for money (VFM) over traditional methods. A value for money (VFM) assessment comprises two key elements, monetary comparison and non-monetary comparison. A form of monetary comparison involves a comparison of the cost of the preferred PPP tender with the cost of delivering the project through traditional public sector procurement.
17-13
Factors determining value for money (VFM) include the followings:
Reduced life cycle costs Generation o f additional revenue. Better allocation of risk Faster implementation Improved service quality
(2) Characteristics of Toll Road Projects
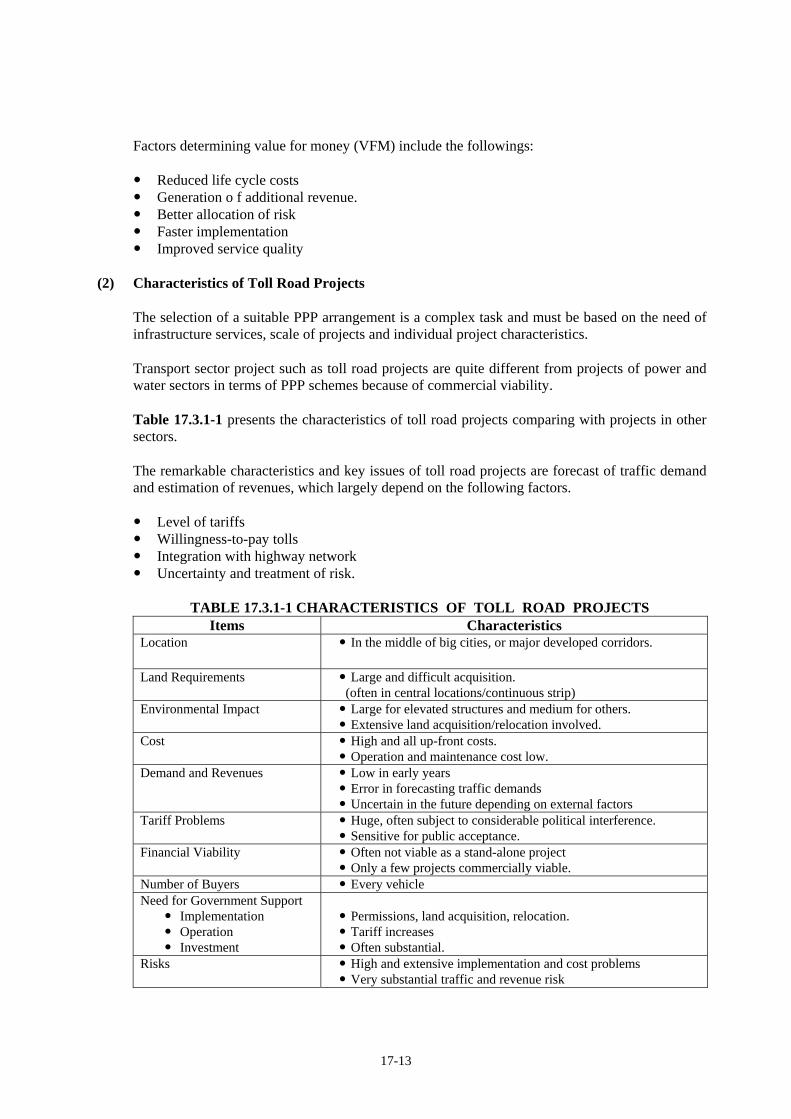
The selection of a suitable PPP arrangement is a complex task and must be based on the need of infrastructure services, scale of projects and individual project characteristics. Transport sector project such as toll road projects are quite different from projects of power and water sectors in terms of PPP schemes because of commercial viability. Table 17.3.1-1 presents the characteristics of toll road projects comparing with projects in other sectors. The remarkable characteristics and key issues of toll road projects are forecast of traffic demand and estimation of revenues, which largely depend on the following factors.
Level of tariffs Willingness-to-pay tolls Integration with highway network Uncertainty and treatment of risk.
TABLE 17.3.1-1 CHARACTERISTICS OF TOLL ROAD PROJECTS
Items Characteristics Location In the middle of big cities, or major developed corridors.
Land Requirements Large and difficult acquisition. (often in central locations/continuous strip)
Environmental Impact Large for elevated structures and medium for others. Extensive land acquisition/relocation involved.
Cost High and all up-front costs. Operation and maintenance cost low.
Demand and Revenues Low in early years Error in forecasting traffic demands Uncertain in the future depending on external factors
Tariff Problems Huge, often subject to considerable political interference. Sensitive for public acceptance.
Financial Viability Often not viable as a stand-alone project Only a few projects commercially viable.
Number of Buyers Every vehicle Need for Government Support
Implementation Operation Investment
Permissions, land acquisition, relocation. Tariff increases Often substantial.
Risks High and extensive implementation and cost problems Very substantial traffic and revenue risk

17-14
17.3.2 Possible PPP Options
(1) Major Assumptions in Work Sharing The present practice of toll road developments and issues in implementation through PPP schemes in the Philippines was reviewed and identified in Chapter 5. The concepts of available PPP options were discussed, and contractual agreement in the Philippines BOT Law were briefly reviewed in the previous sections. In proposing possible implementation options; the following assumptions are made as mandatory and optional supports of government.
(a) Right of Way Acquisition
Right of way required for a project shall be closely defined and acquired on time, preferably prior to tendering or at least before the commencement of construction work. The government is purely responsible for ROWA on time.
(b) Business Case Study and Feasibility Study
Business case study aims to assess the suitability of a proposed project to be implemented under PPP schemes for the official approval by the government approving bodies, while feasibility study intends to provide basis and parameters necessary for equitable tendering of a project such as design parameters, traffic forecast, analysis on initial toll rate and adjustment formula etc. to be presented in tendering documents. The government is responsible for conducting business case study and feasibility study on time.
(c) Toll Level Risk due to Inflation
The toll level shall be adjusted in accordance with the inflation every three (3) years based on a pre-determined formula. The government is responsible for accepting adjustment in accordance with the law and project contract.
(d) Traffic Volume Risk The traffic volume level shall be maintained as assumed in the contract. As an alternative, a private entity shall bear the traffic risk. Thus, a private entity shall be responsible for reviewing, validating, accepting or changing traffic forecast in the feasibility study, and for making its own forecast. The private entity shall take full responsibility over its traffic forecast, including the impact of any traffic shortfall on toll revenues.
(e) Financial Support
The followings are the optional financial support of the government. a. Up-front capital subsidy/share for construction b. Service payment subsidy during operation

17-15
c. Combination of up-front capital and service payment subsidy.
(2) Possible PPP Options
Based on the review and discussions mentioned above, implementation options through PPP schemes were developed and proposed for preliminary comparison, as shown in Table 17.3.2-1.
TABLE 17.3.2-1 IMPLEMENTATION OPTIONS THROUGH PPP SCHEMES
Work Sharing Options Type Public Sector Private Sector 0 Conventional Type ROWA
Design Construction O&M
Outsourcing of some portion of works
1 Role Sharing Type (Lease)
ROWA Design Construction
O&M
2 Segment Dividing Type
ROW of whole section Construction and financing of certain segment
Construction and financing of remaining segment under BOT scheme O&M of whole section
3 BOT Type with Government subsidy
ROWA Design Upfront capital subsidy (Option 3-1) Annual service payment subsidy (Option 3-2)
Construction and Financing of whole section under BOT scheme
O&M
4 BOT Type ROWA Design and Construction including financing under BOT Scheme
O&M Note: ROWA: Right of Way Acquisition O&M: Operation and Maintenance
17.3.3 Preliminary Evaluation of Possible PPP Options
Table 17.3.3-1 (1 to 5) graphically demonstrates the concepts of work sharing, financial arrangement, public sector expenditure and project structure including issues and comments and preliminary evaluation of each options. Option 0 Conventional Type This type is, not PPP options, the conventional method which the public sector is responsible for implementation of project including right of way acquisition (ROWA), design, construction, operation and maintenance and its financing. Under this method, some services and works are executed through simple outsourcing agreements (OA).

17-16
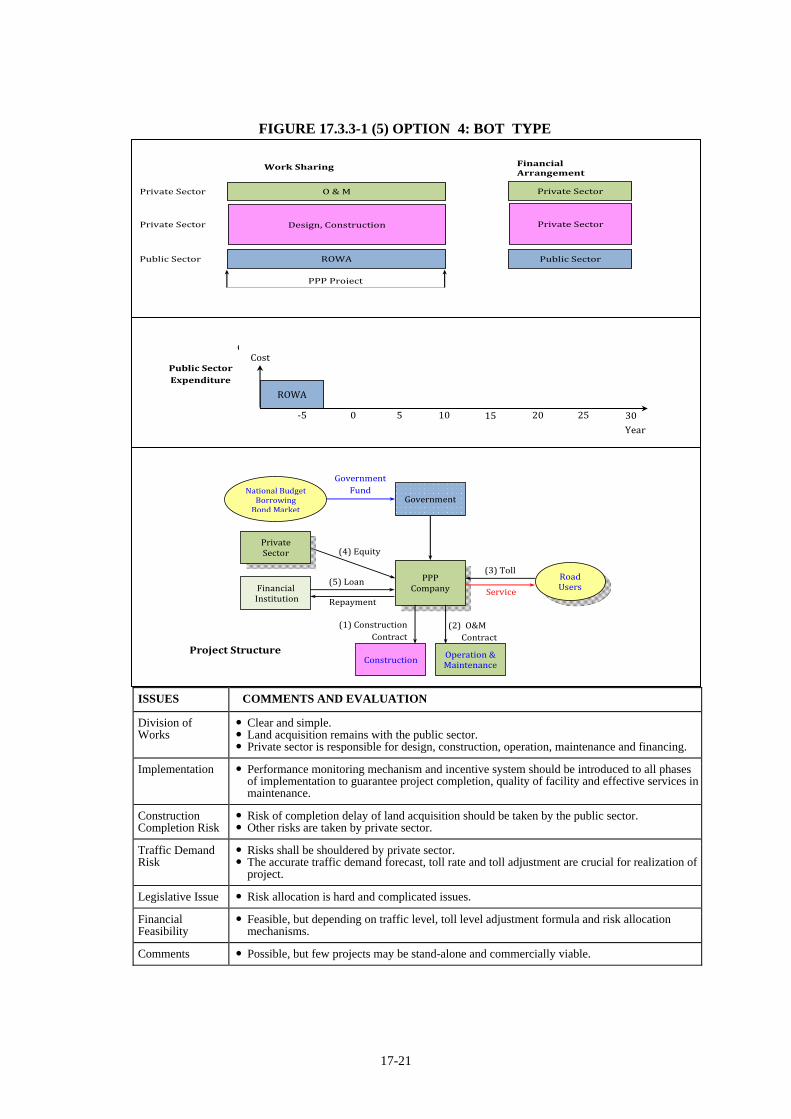
Option 1 Role Sharing Type (Lease) The public sector is responsible for ROWA, design, construction and its financing for whole section. The private sector undertakes operation and maintenance under a lease contract (L.C.). The former leases toll road, and the latter pays lease fee which are derived from customer payments. Option 2 Segment Dividing Type Commercially viable segment will be selected to be implemented under BOT scheme by the private sector, and the remaining segment will be constructed by the public sector. Each sector is responsible for design, construction and its financing for each designated segment (BOT contract for private sector) The public sector is responsible for ROWA for the whole section, and the private sector is in charge of operation and maintenance of whole section under an operation and maintenance contract (O&M contract). Options 3 BOT Type with Government Subsidy The private sector is responsible for design, construction, operation, maintenance and its financing based on a BOT contract. The public sector is in charge of ROWA. The public sector provides initial upfront subsidy to reduce financing requirements for construction to the level affordable by toll revenues. (Option 3-1, Upfront Subsidy) The public sector pledges annual service payment to the private sector during the operational period of facility to reduce financial requirement for operation to the level supportable by toll revenues. (Option 3-2, Service Payment) The public sector provides both, upfront capital subsidy and annual service payment over the life of operation of facility to reduce financing requirements for construction and operation to the level affordable by toll revenues. (Combination of Option 3-1 and 3-2) Option 4 BOT Scheme The private sector undertakes design, construction, operation, maintenance and its financing under BOT contract. The public sector is responsible for ROWA. The private sector operates the facility over a fixed term during which it is allowed to charge facility users’ appropriate tolls, fees, rentals and charges, and transfers the facility to the public sector at the end of the fixed term.

17-17
FIGURE 17.3.3-1 (1) OPTION 1: ROLE SHARING TYPE (LEASE/AFFERMAGE)
ISSUES COMMENTS AND EVALUATION
Division of Works Very clear and simple. Public sector executes ROWA of whole section, and designs and constructs with whole
financing. Private sector operates and maintains under lease contract.
Implementation Responsibility on defects and damages of structures during operation should be clearly defined.
Performance monitoring system should be introduced to assure quality of service.
Construction Completion Risk
The public sector, through the construction company, should assume responsibility for risk on failures in requirements on quality of structures and defect liabilities.
Traffic Demand Risk Depend on lease payment mechanism. In case of variable lease payment according to traffic volume, the public sector assumes
toll revenue risk. In case of fixed payment mechanism, the private sector assumes toll revenue risk.
Legislative Issue Treatment of the lease revenue.
Financial Feasibility Feasible from the view point of the private sector.
Comments Possible and preferable for non profitable projects. Loan from international lending agencies can be arranged.
Project Structure
Work Sharing
Private Sector
Public Sector
Public Sector
O & M
Design, Construction
ROWA
PPP Project
Financial Arrangement
Private Sector
Public Sector
Public Sector
Public Sector Expenditure
(1)
Year
Government Barrowing for Whole Section (1) Interest Payment (2) Capital Repayment
‐5 5 15 25 30 20 10 0
Cost
Design, Construction (Whole Section)
ROWA (2) (1)
Government Construction
Operation & Maintenance
Government Fund
(2) Construction Contract
Lease Payment
(3) Operation and Maintenance
PPP Company
Road Users
(4) Toll
Service
National Budget Borrowing Bond Market
(1) Lease Contract

17-18
FIGURE 17.3.3-1 (2) OPTION 2: SEGMENT DIVIDING TYPE
ISSUES COMMENTS AND EVALUATION
Division of Works
Close coordination between the private and the public sectors is required. Public sector executes ROWA of whole section, and design and constructs public segment with
its finance. Private sector designs and constructs remaining private segment with its finance under BOT
scheme, and operates and maintains whole section.
Implementation Measures should be taken so as to maintain the same quality of structures by public and the private sectors.
Boundary of the scope of construction works between the public and private sectors should be clearly defined.
Construction Completion Risk
Risk of failure to meet construction schedule and requirement on quality of facilities shall be taken by both public and private sectors.
Risk on delay of land acquisition should be taken by the public sector.
Traffic Demand Risk
The risk will be shared between the public and private sectors. Allocation of risk between them depends on O&M contract.
Legislative Issue Loan from international lending agencies is easy for public segment, but hard for private.
Financial Feasibility
Feasible depending on the dividing mechanism.
Comments Possible and preferable because financial feasibility of the whole section is secured by selecting commercially viable segment to private sector and non viable segment to public sector.
Loan from international lending agencies can be arranged.
Project Structure
Work Sharing
Private Sector
Public/Private Sectors
Public Sector
O & M
Design, Construction
Design, Construction
ROWA
Private Segment (PPP Segment) Public Segment
PPP Project
Financial Arrangement
Note:
Financially feasible sections will be implemented through BOT scheme, and the rest will be constructed by the public sector. Whole segment will be operated and maintained by private sector.
Private Sector
Private Segment
Public Segment
Public Sector
Public Sector Expenditure
(1)
Year
Government Barrowing for Public Segment (1) Interest Payment (2) Capital Repayment
‐5 5 15 25 30 20 10 0
Cost
Design, Construction (Public Segment)
ROWA (2) (1)
PPP Company Financial
Institution
Road Users
(1) Provide Private Segment
(7) Loan
Repayment
(5) Toll
Service
(6) Equity Private Sector
Construction Operation & Maintenance
(3) Construction Contract
(4) O&M Contract
Whole Segment Private Segment
Government
Government Fund National Budget
Borrowing Bond Market
(2) Construction Contract
Construction
Public Segment

17-19
FIGURE 17.3.3-1 (3) OPTION 3-1: BOT TYPE WITH GOVERNMENT (UPFRONT) SUBSIDY
ISSUES COMMENTS AND EVALUATION
Division of Works Clear and simple. Land acquisition and budget support remains with the public sector. Others are delegated to the private sector.
Implementation Performance monitoring mechanism and incentive system should be introduced to all phases of implementation to assure on-time work, quality and services.
Construction Completion Risk
Risk of completion delay of land acquisition should be taken by the public sector. Other risks are taken by private sector
Traffic Demand Risk
Risk shall be shouldered by private sector in accordance with traffic level specified in the agreement.
The accurate traffic demand forecast and toll adjustment formula are crucial for project implementation.
Legislative Issue Loan from international lending agencies may be difficult. Special arrangement for such loan may be required.
Financial Feasibility
Feasible if the amount of upfront subsidy for construction cost be appropriate to the private sector.
Cost sharing of the government shall not exceed 50% of the project cost.
Comments Possible because non-viable project can be financially feasible project, but may be difficult due to special loan arrangement.
Project Structure
Work Sharing
Private Sector
Private Sector
Public Sector
O & M
Design, Construction
ROWA
Note:
Up‐front capital subsidy (loans) must be provided to lower financing requirements of the private sector down to the level affordable by toll revenue.
Financial Arrangement
Private Sector
Private Sector
Public Sector
PPP Project
Public Sector Expenditure
(1)
Year
Government Barrowing for Up‐front Subsidy (1) Interest Payment (2) Capital Repayment
‐5 5 15 25 30 20 10 0
Cost
Up‐front Subsidy
ROWA (2) (1)
PPP Company Financial
Institution
Road Users
(1) Upfront Capital Subsidy (3‐1)
(6) Loan
Repayment
(4) Toll
Service
(5) Equity Private Sector
Government
Government Fund National Budget
Borrowing Bond Market
Construction Operation & Maintenance
(2) Construction Contract
(3) O&M Contract

17-20
FIGURE 17.3.3-1 (4) OPTION 3-2: BOT TYPE WITH GOVERNMENT SUBSIDY (SERVICE PAYMENT)
ISSUES COMMENTS AND EVALUATION
Division of Works Clear and simple. Land acquisition and budget support remains with the public sector. Others are delegated to the private sector.
Implementation Performance monitoring mechanism and incentive system should be introduced to all phases of implementation to ensure on-time work, quality and service.
Construction Completion Risk
Risk of completion delay of land acquisition should be taken by the public sector. Other risks are taken by private sector.
Traffic Demand Risk Risk will be shared between the public and the private sectors in accordance with traffic level specified in the agreement.
Allocation of traffic demand risk between them depends on how to design service payment mechanism.
Legislative Issue Loan from international lending agencies maybe difficult Special arrangement for such loan may be required.
Financial Feasibility Feasible, but depending on service payment mechanism. Credit enhancement mechanism will be necessary to assure government payments.
Comments Possible, because non-viable project can be financially feasible project, but maybe difficult due to special loan arrangement.
Legal basis and commitment on service payment under a long term contract may need public acceptance.
Project Structure
PPP Company Financial
Institution
Road Users
(1) Annual Service Payment Subsidy (3‐2)
(6) Loan
Repayment
(4) Toll
Service
(5) Equity Private Sector
Government
Government Fund National Budget
Borrowing Bond Market
Construction Operation & Maintenance
(2) Construction Contract
(3) O&M Contract
Public Sector Expenditure
(1)
Year
Government Barrowing for Service Payment (1) Interest Payment
‐5 5 15 25 30 20 10 0
Cost
ROWA (1)
Work Sharing
Private Sector
Private Sector
Public Sector
O & M
Design, Construction
ROWA
Note:
Service payment will be provided during the operationperiod to cover a part of financing requirements of theprivate sector up to the level affordable by toll revenue.
Financial Arrangement
Private Sector
Private Sector
Public Sector
PPP Project
17-21
FIGURE 17.3.3-1 (5) OPTION 4: BOT TYPE
ISSUES COMMENTS AND EVALUATION
Division of Works
Clear and simple. Land acquisition remains with the public sector. Private sector is responsible for design, construction, operation, maintenance and financing.
Implementation Performance monitoring mechanism and incentive system should be introduced to all phases of implementation to guarantee project completion, quality of facility and effective services in maintenance.
Construction Completion Risk
Risk of completion delay of land acquisition should be taken by the public sector. Other risks are taken by private sector.
Traffic Demand Risk
Risks shall be shouldered by private sector. The accurate traffic demand forecast, toll rate and toll adjustment are crucial for realization of project.
Legislative Issue Risk allocation is hard and complicated issues.
Financial Feasibility
Feasible, but depending on traffic level, toll level adjustment formula and risk allocation mechanisms.
Comments Possible, but few projects may be stand-alone and commercially viable.
Work Sharing
Private Sector
Private Sector
Public Sector
O & M
Design, Construction
ROWA
Financial Arrangement
Private Sector
Private Sector
Public Sector
PPP Project
p
Year ‐5 5 15 25 30 20 10 0
Cost
ROWA
Public Sector Expenditure
C
Project Structure
PPP Company Financial
Institution
Road Users
(5) Loan
Repayment
(3) Toll
Service
(4) Equity Private Sector
Government
Government Fund National Budget
Borrowing Bond Market
Construction Operation & Maintenance
(1) Construction Contract
(2) O&M Contract

CHAPTER 18
IMPLEMENTATION ARRANGEMENT OF RECOMMENDED PPP

18-1
CHAPTER 18 IMPLEMENTATION ARRANGEMENT OF RECOMMENDED PPP SCHEMES
18.1 PPP OPTIONS RECOMMENDED FOR PRIORITY PROJECTS 18.1.1 Characteristics of Priority Projects
The proposed HSH development master plan identified 18 projects, among which 8 projects are proposed to be completed before year 2020, including the following projects, as discussed in Chapter 16. • NLEx – SLEx Link Expressway • NAIA Expressway (Phase-2) • C-6 Expressway (South-East Section) • C-6 Expressway (North Section) • CALA Expressway • Central Luzon Expressway • Calamba-Los Baños Toll Expressway • SLEx Extension
(1) Project Characteristics in terms of VFM
PPP projects may provide the private sector with strong incentives to minimize cost over the whole life of projects. PPPs should only be adopted as procurement and implementation option if they are reasonably expected to deliver enhanced value for money over traditional methods. Value for Money (VFM) assessment is therefore crucial to deciding the suitability of a project as PPP. VFM assessment comprises two key elements, monetary comparison and non-monetary comparison. A form of monetary comparison involves a comparison of the cost of the preferred PPP tender with the cost of delivering the project through traditional public sector procurement. Factors determining value for money may obviously vary from projects to projects including the followings. • Reduced life cycle cost • Generation of additional revenue • Faster implementation • Improved service quality • Better allocation of risk The nature of the value for money assessment depends on the type of PPP project as described hereunder. • Financially free-standing projects
For financially free-standing projects, the contractor is required to recover all costs through charges on the final users of the service (toll revenue). The public sector is required to play a facilitating role, but no public money is involved.
18-2
• Public sector-support projects The public sector may be required to provide supports (grant financing and/or subventions) for this type of projects, but the revenues come principally from user charge. The public sector is a minority funder, but there is a need to ensure that the project represents the best use of the public funds since investment of public money is involved. • Public sector-main fund project In the case of projects where the public sector is the main funder, a detailed value for money assessment is required to compare the cost and benefits of the preferred PPP tender with the costs and benefits of traditional procurement.
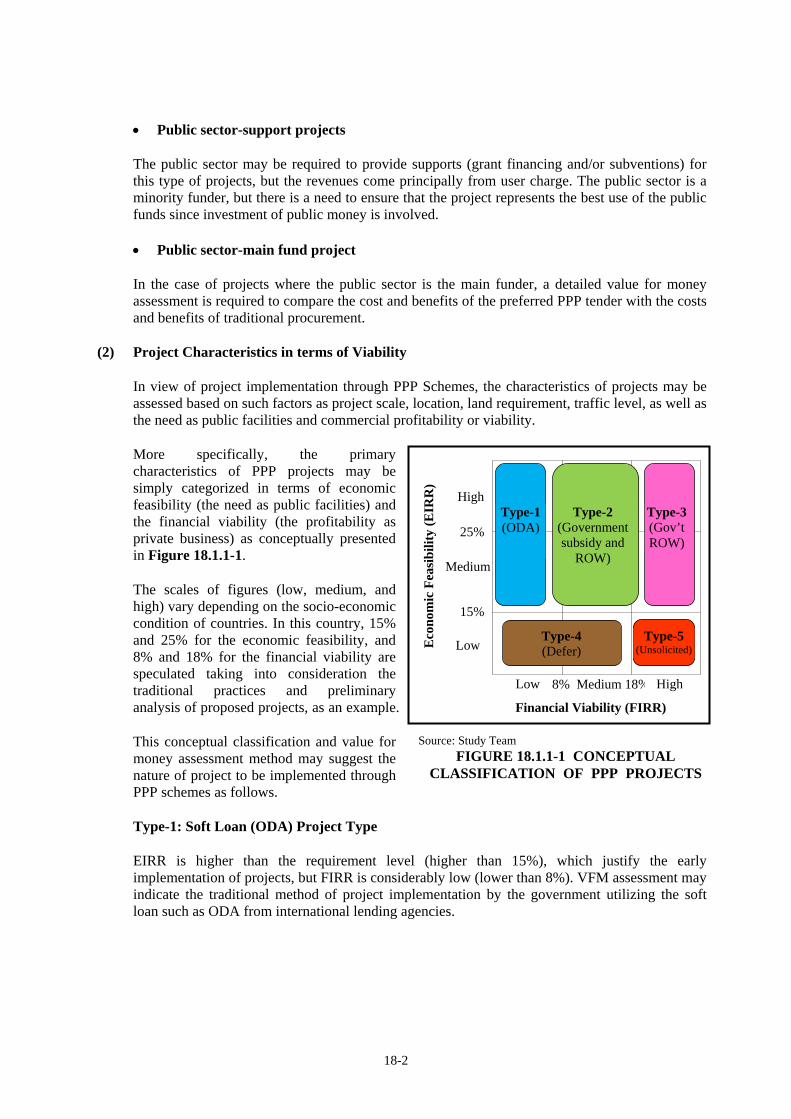
(2) Project Characteristics in terms of Viability
In view of project implementation through PPP Schemes, the characteristics of projects may be assessed based on such factors as project scale, location, land requirement, traffic level, as well as the need as public facilities and commercial profitability or viability.
More specifically, the primary characteristics of PPP projects may be simply categorized in terms of economic feasibility (the need as public facilities) and the financial viability (the profitability as private business) as conceptually presented in Figure 18.1.1-1. The scales of figures (low, medium, and high) vary depending on the socio-economic condition of countries. In this country, 15% and 25% for the economic feasibility, and 8% and 18% for the financial viability are speculated taking into consideration the traditional practices and preliminary analysis of proposed projects, as an example. This conceptual classification and value for money assessment method may suggest the nature of project to be implemented through PPP schemes as follows. Type-1: Soft Loan (ODA) Project Type EIRR is higher than the requirement level (higher than 15%), which justify the early implementation of projects, but FIRR is considerably low (lower than 8%). VFM assessment may indicate the traditional method of project implementation by the government utilizing the soft loan such as ODA from international lending agencies.
Source: Study Team FIGURE 18.1.1-1 CONCEPTUAL
CLASSIFICATION OF PPP PROJECTS
High
Medium
Low
Low 8% Medium 18% High
Type-3(Gov’t ROW)
Type-2 (Government subsidy and
ROW)
Type-1(ODA)
Type-4 (Defer)
Type-5 (Unsolicited)
Financial Viability (FIRR)
Eco
nom
ic F
easi
bilit
y (E
IRR
)
15%
25%

18-3
Type-2: PPP Project Type with the government support including ROW Acquisition EIRR is the same level as Type-1, therefore the early implementation of project is acceptable. However, the medium level of FIRR (8~18%) indicates the fact that project is not financially viable. For those projects, project implementation through PPP schemes is highly recommended with the government financial support including ROW Acquisition. Type-3: Free-standing Project Type with ROW Acquisition by the Government This type is considered to be financially free-standing project because FIRR higher than 18% may be assessed commercially viable. The government participation of ROW acquisition may be justifiable because of higher level of EIRR more than 15% in order to provide the incentives to the private sector. Type-4: Highly Commercial Project Type with Less Economic Justification EIRR reveals the low level of economic feasibility (lower than 15%), which may imply an optimum timing of project implementation in the future. However, FIRR may be relatively high enough to attract a possible investor from the private sector. In this case, the unsolicited proposals may be appreciated with the government incentives and undertakings except the direct government guarantees, direct government subsidy or equity and ROW acquisition. Type-5: Second Priority Project Type EIRR is estimated to be low, which suggests to defer a project implementation, and FIRR is low and medium which may invite no interest from the private sector.
18.1.2 PPP Options for Implementation
The implementation options through PPP schemes are discussed in Chapter 17, involving the following four (4) options. Option 0; Conventional Type Option 1; Role Sharing Type (Lease) Option 2; Segment Dividing Type Option 3; BOT Type with Government Subsidy Option 4; BOT Type Based on the preliminary evaluation of possible PPP options, implementation options are recommended in accordance with the characteristics of PPP projects, namely Type 1, Type 2 and Type 3, as shown in Table 18.1.2-1.

18-4
TABLE 18.1.2-1 IMPLEMENTATION OPTIONS OF PPP SCHEMES
● ROWA ● Outsourcing of some Preferable for Type‐1 Projects● Design portion of works ● Low financial viability● Construction ● O & M of whole section ● High/medium economic● O & M feasibility● ROWA ● Outsourcing of some Preferable for Type‐1 Projects● Design portion of works ● Low financial viability● Construction ● O & M of whole section ● High/medium economic
feasibility● ROW of whole section ● Design Adoptable for Type‐2 Projects● Design ● Construction & financing ● Medium financial viability● Construction and of private segment under ● High/medium economic
financing of public BOT scheme feasibilitysegment ● O & M of whole section
● ROWA ● Design Adoptable for Type‐2 Projects● Upfront capital ● Construction & financing ● Medium financial viability
subsidy (Option 3‐1) of whole section under ● High/medium economic● Annual service BOT scheme feasibility
payment subsidy ● O & M of whole section(Option 3‐2)
● ROWA ● Design and construction Applicable for Type‐3 Projectsincluding financing under ● High financial viabilityBOT scheme ● Medium/high economic
● O & M of whole section feasibility
Proposed Toll Road
Option 0; Conventional
Type
Option 1; Role Sharing Type
(Lease)
Option 4; BOT Type
Option 3; BOT Type With Government Subsidy
Option 2; Segment
Dividing Type
Proposed Toll Road
ApplicationWork Sharing
Public PrivatePPP Options
Government
Public Private
Private Segment
Private Segment
Government
Note: Note: ROWA (Right of Way Acquisition)

18-5
18.2 GOVERNMENT SUPPORT
18.2.1 Conventional Arrangements
The government support usually focuses on the provision of services for the realization of infrastructure project for PPPs. The most common form is to make a project commercially viable from the perspective of the private sector by providing financial subsidy. This is most often the case for public infrastructure, which does not usually yield sufficient financial viability for commercial financing. The government also provides support for social considerations. As for toll roads, the government typically provides subsidies to reduce tariff level for the purposes of helping the poor, addressing public health and environmental issues, and political constraints on raising tariffs. The conventional arrangements of the government support include the followings.
Providing ROW Providing existing infrastructure
The existing infrastructure may be provided and utilized under service contract, operation and management contract or lease contract for the private sector to participate in the maintenance, operation, management, improvements of the infrastructure and/or with related newly proposed PPP projects.
Providing shadow toll payment Shadow toll may be considered instead of real tolling if revenue do not cover some percentage of investment costs.
The financing subsidies of the government are generally applied in the following forms.
Provision of regular, subsidy payments to operational costs. This can be useful in the first year of operation when cash flow is not sufficient to cover all costs.
Subsidy of revenue flows This is particularly useful if a policy objective is to keep user charge low.
Coverage of financial costs - Reducing the cost of borrowing by softening loans - Providing loan guarantee - Financing risk elements - Subsidizing taxation payments - Covering exchange rate losses

18-6
18.2.2 Possible Forms for Toll Road Development
(1) Provisions in Revised IRR of BOT Law of the Philippines The Revised IRR of the BOT Law of the Philippines, as amended, defines the Government Undertaking, as follows.
(a) Cost Sharing This shall refer to bearing a portion of capital expenses of an infrastructure development facility such as right of way, etc., which shall not exceed fifty percent (50%) of the project cost. Such government share may be financed from direct government appropriations and/or from ODA of foreign government or institutions.
(b) Credit Enhancement
This shall refer to direct and indirect support, the provision of which is contingent upon occurrence of certain events/risks. The credit enhancements are allocated to the party, public/private sector that is best able to manage and assure the consequences of the risk involved. This may include, but are not limited to, government guarantees or the performance or the obligation of the government.
(c) Direct Government Subsidy
This shall refer to an agreement whereby the government will; (i) Defray, pay or shoulder a portion of project cost and costs in operating or maintaining the
project. (ii) Condone or postpone any payment due from the Project Proponent. (iii) Contribute any property or assets. (iv) Waive or grant special rates on real property taxes. (v) Waive charges or fees relative to business permits or licenses.
(d) Direct Government Equity
This shall refer to the subscription by the government of shares of stock, or other securities convertible to shares of stock, whether such subscription will be paid by the money or assets.
(e) Performance Undertaking
This shall refer to an undertaking of a department, etc., in assuming responsibility for the performance of the Agency obligation including the payment of monetary obligation. These undertakings may be subject to payment of risk premium.
(f) Legal Assistance
This shall refer to the extension of representation by government layers only in cases where the Agency and Project Proponent are partly-defendants.
(g) Security Assistance
This shall refer to the development of government security forces, in the vicinity of the project site to provide security during the implementation of the project to completion.
18-7
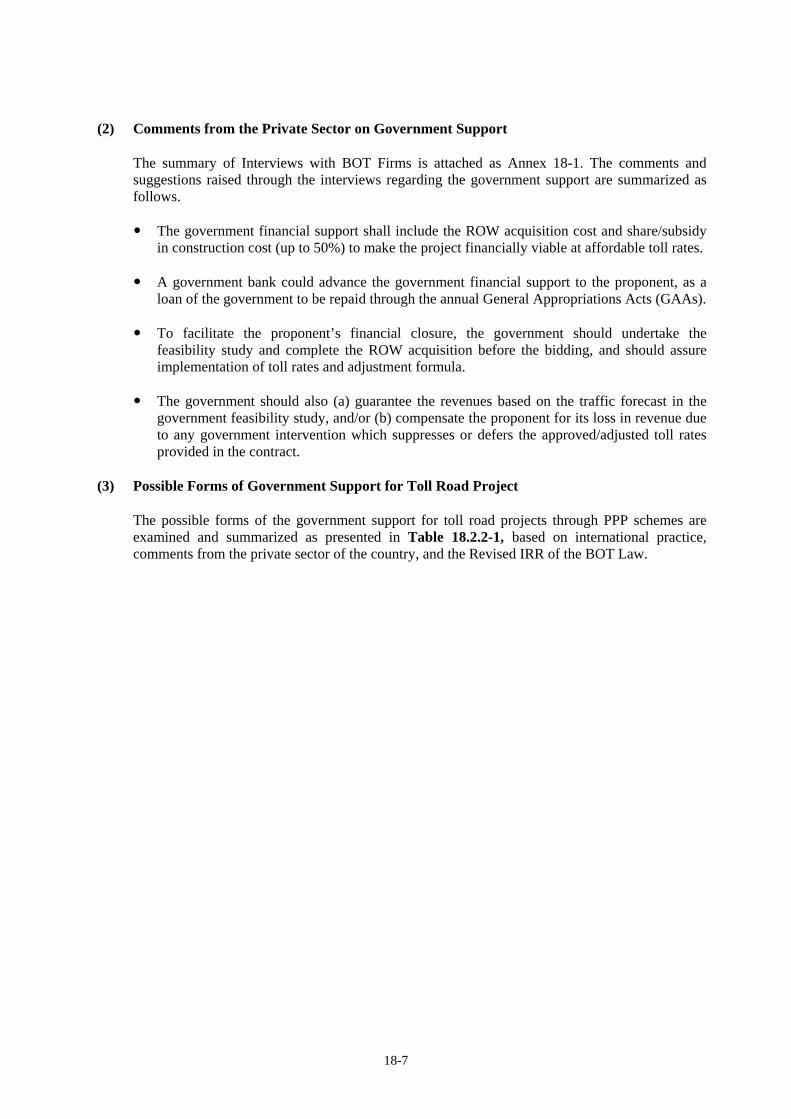
(2) Comments from the Private Sector on Government Support The summary of Interviews with BOT Firms is attached as Annex 18-1. The comments and suggestions raised through the interviews regarding the government support are summarized as follows.
The government financial support shall include the ROW acquisition cost and share/subsidy in construction cost (up to 50%) to make the project financially viable at affordable toll rates.
A government bank could advance the government financial support to the proponent, as a
loan of the government to be repaid through the annual General Appropriations Acts (GAAs).
To facilitate the proponent’s financial closure, the government should undertake the feasibility study and complete the ROW acquisition before the bidding, and should assure implementation of toll rates and adjustment formula.
The government should also (a) guarantee the revenues based on the traffic forecast in the
government feasibility study, and/or (b) compensate the proponent for its loss in revenue due to any government intervention which suppresses or defers the approved/adjusted toll rates provided in the contract.
(3) Possible Forms of Government Support for Toll Road Project
The possible forms of the government support for toll road projects through PPP schemes are examined and summarized as presented in Table 18.2.2-1, based on international practice, comments from the private sector of the country, and the Revised IRR of the BOT Law.

18-8
TABLE 18.2.2-1 POSSIBLE FORMS OF GOVERNMENT SUPPORT FOR TOLL ROAD PROJECTS THROUGH PPP
Description Advantages Disadvantages 1. ROW Acquisition The government has the right to
acquire and expropriate land for public use and purposes.
The government can start ROW acquisition before tendering, and complete before commencement of construction work.
The organization and capacity of the government are not enough to expedite ROW acquisition on time.
2. Combination of New Facility with Existing Facility.
New projects will be implemented through PPP scheme, and combine with existing facility to enlarge tollway capacity.
Toll fee will be collected over the combined assets.
Reduce investment cost Increase toll revenue Foreseeable minimum traffic
volume
Existing facility associated/related with new PPP project shall exist.
3. Integration of Public and Private Facilities
A portion of the toll road shall be implemented through conventional public procedure by the government, while remaining shall be under PPP scheme by private sector
Both shall be operated and maintained as one by the private sector
Non-profitable project will become commercially viable.
Clear definition of the responsibilities for both.
Reduce total cost. Effective integration of public
infrastructure to provide service.
Public fund is required. Effective coordination in design,
construction, implementation timing is vital.
4. Guarantee of Minimum Traffic and Revenues
The government guarantees a minimum traffic volume or minimum revenue if toll rate is justified in view of social, environmental, political aspects.
Non-profitable project will become commercially viable.
No serious risks to private sector.
Incentive of private sector may become less.
Serious risks to the government.
5. Provision of Financial Subsidy The provisions of Revised IRR of the BOT Law are conformed.
Fair to both, public and private sectors.
Fair to both, public and private sectors.
18-8

18-9
18.3 WORK SHARING
18.3.1 Traditional Practices of Work Sharing Traditionally, governments have relied on public procurement to develop infrastructure systems. Under the traditional public procurement method, government agencies vested with responsibility for implementing infrastructure projects can utilize the services of the private sectors for planning, design and construction selected through a competitive basis. Upon the completion of a c project, it is operated and maintained by the agency. A PPP is a partnership between the public and private sectors for the purpose of implementing a project or a service to develop infrastructure system under a project agreement. The main objectives of government are the effective utilization of technical expertise and financial resources of the private sector, while the expectations of private sector are to undertake commercially viable projects with the clear goal of maximizing profits. The substance of such project agreement is found in defining work sharing and risk allocation between both sectors. The extent of work and risk sharing to the private sector is the principle criteria in forming a PPP structure. The commercial viability of a project is greatly influenced by such work and risk sharing. In Section 17.3.2, the mandatory and optional support of the government are assumed in proposing possible PPP options. Such mandatory support of the government shall be considered as the works to be shouldered by the government. Based on the mandatory obligations of the government and past practices of toll road development projects, the basic traditional practices of the work sharing between the public sector and private sectors, are presented in Table 18.3.1-1. Among the work items, shown in the table, particularly of BOT scheme, the followings are key factors in discussing the work sharing. Business Case Study
The business case study aims to assess the unsuitability of a project as PPP project. A lengthy process is likely to be required to package and approve PPP projects after project identification.
Through a thorough business case study to be conducted by the government, the appraisal of a project as PPP project by the government shall be done immediately.
Feasibility Study
The objectives of the feasibility study are to execute the design of PPP structure, traffic study, economic and financial analysis and establishment of bidding process including basic standards and parameters for bidding.
Moreover, the ROW required for the project shall be clearly defined with parcellary plan ; and the resettlement plan for PAPs shall be prepared during the feasibility study. Therefore, the government shall undertake and authorize the study on time.
18-10
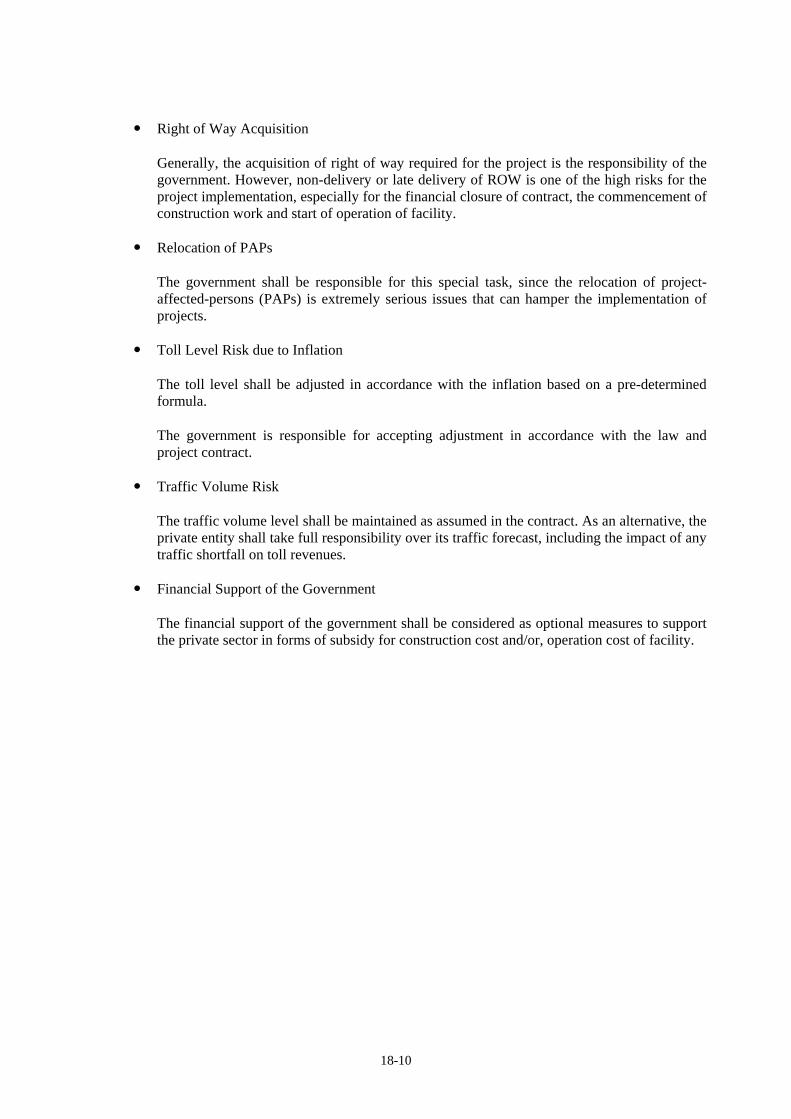
Right of Way Acquisition
Generally, the acquisition of right of way required for the project is the responsibility of the government. However, non-delivery or late delivery of ROW is one of the high risks for the project implementation, especially for the financial closure of contract, the commencement of construction work and start of operation of facility.
Relocation of PAPs
The government shall be responsible for this special task, since the relocation of project-affected-persons (PAPs) is extremely serious issues that can hamper the implementation of projects.
Toll Level Risk due to Inflation
The toll level shall be adjusted in accordance with the inflation based on a pre-determined formula.
The government is responsible for accepting adjustment in accordance with the law and project contract.
Traffic Volume Risk
The traffic volume level shall be maintained as assumed in the contract. As an alternative, the private entity shall take full responsibility over its traffic forecast, including the impact of any traffic shortfall on toll revenues.
Financial Support of the Government
The financial support of the government shall be considered as optional measures to support the private sector in forms of subsidy for construction cost and/or, operation cost of facility.

18-11
TABLE 18.3.1-1 TRADITIONAL PRACTICE OF WORK SHARING FOR TOLL ROAD DEVELOPMENT
Work Items Public Sector (Government/ Implementing
Agency)
Private Sector (Project
Proponent)
Remarks
1. Preparation of National Legislative and Regulatory Structures
-
• Political and government commitment on PPP project promotion.
2. Project Identification (Business Case Study)
-
• PPP Structure • Work/Risk Sharing • Government Support
3. Project Appraisal - • Strong commitment on project configuration and PPP modality.
4. Feasibility Study (PPP Design, Basic Parameter for Tendering)
• Delineation of ROW • Initial Toll Rate
5. Traffic Analysis
(Indicative)
(Own)
• Public sector conducts through F.S.
6. Environmental Impact Assessment
(Preliminary)
(Final)
• Public sector conducts through F.S.
7. Right of Way Acquisition
(Fund, Execution) -
• Proper timing of ROW delivery, preferably before commencement of construction.
8. Relocation of PAPs
(Fund, Execution)
-
9. Detailed Engineering - • Public sector renders the construction supervision.
10. Construction - • Public sector renders the construction supervision.
11. Operation and Maintenance - • Public sector administers and oversees O & M through monitoring.
12. Toll Rate Adjustment
(Approve)
(Apply)
• Private sector is responsible for initial toll rate.
13. Fund
(Counterpart Fund)
(All equity/
Debt)
14. Financial Support
(Optional)
• Appropriateness of amount shall be justified.
Note: Main Task
Sub Task

18-12
18.3.2 An Example of Work Sharing for Toll Road Development
As an example of work sharing in the country, the contract agreement of Tarlac-La Union Toll Expressway (TLUTE) is reviewed with the focuses on work sharing and risk allocation, as summarized in Table 18.3.2-1.
(1) Project Background
The extension of the North Luzon Expressway (NLE) up to Laoag, Ilocos Norte was originally intended for progressive completion. In 2000, the Department of Public Works and Highways (the DPWH) proposed the North Luzon Expressway Extension (NLEE) Project Phase 1 (Tarlac to Rosario, La Union) with a proposed implementation period from 2003 to 2006. However, the DPWH budget hindered the implementation of the proposed NLEE. The DPWH enjoined the private sector proponents, through international competitive bidding, to implement the project, to effectively address the public need, without incurring unnecessary debt on the part of the government.
(2) Project Scope
TLUTE starts near the terminus of the Subic-Clark-Tarlac Expressway in La Paz, Tarlac and terminates in Rosario, La Union, with a high speed facility, controlled acess, divided highway on embankments with a 2-lanes (initial, Phase 1) and a 4-lanes (Phase 2 in the future).
Project Limit La Paz, Tarlac to Rosario La Union Number of Lanes 2 lanes (initial stage) Lane width 3.65 meters Shoulder (on both sides) 3.0 meters (50mm ACP) No. of Interchange (min) 7 No. of Toll Plaza (Start/End) 2 Pavement Asphalt Concrete Pavement Embankment Height to be determined based on minimum freeboard
of 0.6 meter from the maximum flood level Road Right-of-Way 32 meters (minimum)
(3) Contractual Framework
The contractual agreement for the project is the Build-Transfer-and-Operate (BTO) scheme under the BOT Law of the Philippines. Under this agreement, the proponent takes full responsibility for design and construction of the project. Once the toll road is certified substantially completed, title is transferred to the DPWH, and the proponent will operate and maintain the tollway. At the end of the concession period, the proponent shall turn over the facility to the DPWH in good operating condition. Contractor; Philippine Infrastructure Development Corporation (PLDC)
(4) Grant of Rights, Privilege and Recital Obligations
Major rights and obligation of both parties are as follows.

18-13
By the Grantor (Government)
Grant of Rights and Privilege Obligations
- Turn-over the possession of the facility to operate and maintain - Provide necessary road Right-of-Way - Ensure the allocation of the counterpart fund (subsidy)
By the Grantee (Contractor)
Acceptance of Rights and Privilege Obligations
- Design, construct, operate and maintain the TLUTE Project - Provide the Operation and Maintenance Center - Undertake all necessary activities for the satisfactory fulfillment of the Project
The special provisions are noticed in this contract agreement as summarized below, with the comments of the Study Team.
Provision 1: Government Financial Participation The government has duly approved the implementation of the project of which P 3.7 Billion will be provided as its counterpart fund. P 793 Million will be used for the Right of Way acquisition and the remaining amount of P 2,907 Million in cash subsidy of the government for the civil works. [Comments] The appropriateness of the amount of cash subsidy should be justified by the government in views of technical, economical and financial aspects, exercising value for money assessment (VFM). Provision 2: Right of Way Plan and Acquisition The government shall be responsible for acquiring the road right of way. The Proponent shall survey and prepared the required ROW plans including the parcellary plans of affected lots and the required documentation for the acquisition of the ROW. [Comments] The government shall be unconditionally responsible for all activities of ROW acquisition. The ROW required for a project shall be clearly defined in a feasibility study which shall be undertaken by the government. The ROW acquisition shall be promptly started and completed before bidding. These activities shall not be managed by the private sector, especially by a winning bidder after a bidding. Provision 3: Feasibility Study and Traffic Study The bid will consist of the following documents: 1) Qualification Document; 2) Technical Proposal (Feasibility Study) and 3) Financial Proposal – all of which will be submitted simultaneously in three (3) separate envelopes. The feasibility study must be undertaken in accordance with acceptable standards and must conclusively demonstrate the feasibility/viability of the project in the following terms; (included are Traffic Study, Economic Feasibility, Financial Requirements, among others).

18-14
[Comments] A bidding shall be held with the transparent, fair and competitive manner in accordance with the rules and regulations and other requirements including engineering and financial requirements. The standards and minimum requirements in engineering aspects, and traffic demand and financial analysis in financial aspects are the indispensable factors, among others, in bidding PPP project. The feasibility study shall establish such indispensable factors as basic parameters for bidding, based on which the fair bidding will be ensured. Provision 4: Material Adverse Grantor Action Material Adverse Grantor Action means action of any national or local government unit, agency and/or authority action, representation or operation shown in Table 18.3.2-1. The parties shall conduct negotiation in good faith for a period not exceeding one hundred twenty days from the date of the Grantee’s notification. [Comments] When this provision will be observed in good faith, no issues during project implementation and operation may be broken out.

18-15
TABLE 18.3.2-1 AN EXAMPLE OF WORKSHARING TARLAC-LA UNION TOLL EXPRESSWAY (TLUTE)
Items Descriptions PPP Modality Build-Transfer-and-Operate (BOT) Scheme
Once the toll road is certified substantially completed, the title is transferred to the DPWH.
At the end of the concession period, it shall be turned over to the DPWH.Government Financial Participation
P 3,700 M in total - 793 M for ROW acquisition
- 2,907 M as cash subsidy for the civil works Right of Way Acquisition and Plan
The Government shall be responsible for acquiring the road right of way. The proponent shall survey and prepare the required ROW plan including
the parcellary plan of affected lots and the required documentation for the acquisition of the ROW.
Prior to commencement of construction, the Independent Consultant shall confirm that there exists sufficient land for construction to proceed in the next six (6) months and at least six (6) months thereafter in terms of the Toll Concession Agreement.
Environmental Impact The proponent shall undertake a new Environmental Impact Assessment (EIA) and obtain an Environmental Clearance Certificate (ECC), if the Proponent introduces a new alignment.
Traffic Analysis Indicative traffic forecast by the DPWH. The proponent is required to conduct own analysis. Technical
Requirement 1.1 Traffic Study 1.2 Engineering Design 1.3 Construction Execution Plan 1.4 Environmental Management
Operational and Maintenance Requirements
2.1 Operational Plan 2.2 Maintenance Plan
Bid Information Requirements (to be submitted for bid)
Financial and Economic Requirements
3.1 Economic Study (Feasibility) 3.2 Financial Viability (Requirements) 3.3 Toll Rates
Detailed Engineering, Construction, Operation & Maintenance
All works shall be done by the proponent All outputs shall be reviewed by the DPWH and Independent Consultant
Toll Rate Adjustment (1) Periodic Adjustment Calculated through the formula involving Consumer Price Index
(CPI). (2) Interim Adjustments
Adjusted upon the occurrence of any of the following events; (i) In the event of Force Majeure. (ii) Additional costs of repair on works arising out of
Force Majeure. Hidden Defects The proponent shall, at its own cost, repair any damage, except any
damage due to ordinary wear and tear. Force Majeure The proponent shall be responsible for damages by utilizing any
insurance proceeds. Damages due to insufficiency of insurance shall be repaid by means of 1)
toll rate increase and concession period extension. Independent Consultant The DPWH shall submit a list of 10 candidates, and appointed and funded
by the Proponent. The Independent Consultant will be provided during preparation and
review of the detailed engineering design and during construction of the project.
Material Adverse Grantor Action (Public Sectors)
Government units’ actions on the following. Any failure on adjustments of the authorized Toll Rate. Non-delivery or late delivery of ROW. Any failure to issue Toll Operation Permit/Certificate. Any change in existing laws, rules or policies making the performance
more difficult. Any change in existing laws, rules, or policies making unlawful to freely
convert Peso into other currencies. Any act of the government, which adversely affects the feasibility of the
project.

18-16
18.4 RISK ALLOCATION
18.4.1 General Principles
Risks in PPP projects are defined as any factor, event or influence that threatens the successful completion of projects in terms of time, cost or quality. A key principle of PPPs is that risks should be allocated to the sector best able to manage them. The objectives of risk transfer include the followings, among others.
To reduce long term cost of a project by allocating risks in a most cost effective manner. To improve the quality of service and increase revenue through more efficient operation. To provide a more consistent and predictable profits of expenditure for more sustainable
management. Risks discussed below are the extracts from Guidelines for successful Public-Private-Partnerships published by the European Commission and Legislative Guide on Privately financed Infrastructure by the United Nations Commission on International Trade Law.
(1) Political/Regulatory Risk
The long duration of most concession agreements and the common aversion to user fee increases make PPP projects especially susceptible to political risk. This is aggravated when unpopular projects are overseen by the government. A private sector entity also faces the risk that project execution may be negatively affected by the contracting authority of the government. Such risks are often referred to as political risks which may include three types; traditional political risks (e.g. nationalization of the project company’s assets), regulatory risks (e.g. introduction of more stringent standard of service delivery, and quasi-commercial risks (breaches due to change in the government’s priority). The private entity may be able to mitigate such risks through forms of political insurance. Bilateral agencies are known to provide political risk guarantees to private entities from aligned countries.
(2) Revenue Risk (Traffic Demand and Toll Revenue Risks)
In order to arrange project financing, certain assumptions regarding usage and revenue levels must be made. These are always significant residual risks on the traffic levels that projects will actually attract, due to forecasts of future growth potential and surveys of people’s willingness to pay tolls. With unforeseen future event that may have dramatic impacts on toll revenue, the possibility that the project can not generate the expected revenue may seriously impair the private entity’s capacity to provide acceptable services and efficient operation of facility. The careful and thorough analysis on the adequate level of traffic risks to be transferred to the private sector shall be undertaken. Share toll or availability payment mechanisms should be considered instead of real tolling, which does not yield enough revenue to cover a significant percentage of investment costs.

18-17
(3) Construction Risk
The financial feasibility of a concession can be jeopardized when cost overruns of capital construction cost are incurred due to poor project plan and definition, unknown geological condition, and loosely defined specification item. Construction delay also have detrimental effects on capital costs while some delays can be minimized through construction management, there are often external factors, such as timely delivery of right of way which is difficult to manage. Construction risk is always assigned to the private entity, which in turn to include strong incentives for on-time completion of works, if right of way will be provided on-time.
(4) Foreign Exchange Risk
Prices and user fees charged to local users or customers will most likely be paid for in local currency, while loan facilities and equipment and fuel costs may be denominated in foreign currency. In addition to exchange rate fluctuation, the private entity may face the risk that foreign exchange control may limit the availability of foreign currency in the local market needed to repay the original investment. Foreign currency risk can be assumed, in certain cases, by sovereign government or international financial institutions.
(5) Environmental Risk
Citizen groups are increasingly concerned on environmental impacts of infrastructure projects, and vigilant to mitigate political impacts. Environmental issues can increase capital costs considerably and result in serious delays. Environmental risk is usually assumed by the private entity so that thorough environmental assessment shall be undertaken to assess any environmental impacts, identify mitigation programs and estimate associated mitigation costs.
(6) Public Acceptance Risk
Infrastructure projects have the potential to provoke serious protests among local communities, which can cancel projects. Public consultation meetings or stakeholder meetings shall be held during planning phase of projects or before deciding to invest, to assess public approvals as well as public sentiment towards the projects.
(7) Force Majeure
Both parties, the government and private entities, face the risk that project may be disrupted by unforeseen or extraordinary events outside their controls, which may be of a physical nature such as natural disaster (floods, storms, or earthquakes) or the result of human action such as war, riots, or terrorist attacks.

18-18
Such unforeseen or extraordinary events may cause a temporary interruption of the project execution or operation of facility, resulting in construction delay, loss of revenue and other losses. Severe events may cause physical damage to the facility. Neither government nor the private entity cannot control this risk since the private entity will not be able to manage, the government often takes the risk. However, both parties may jointly integrate damages against human actions through some form of political insurance.
(8) Land Availability Risk
The land acquisition and availability for the project is the responsibility of the government for ensuring ownership rights and giving possession without any incumbency for land required for the project. The risk is that the project land is not available and has not been acquired. If the land has not been acquired, the risk is compounded by construction delay and associated uncertainty on costs. The government shall make available the land required for the project, preferably at the point of bidding, or before the signing of contract with the private entity. It shall be noted that the feasibility study for the project to be undertaken by the government should define the right of way so that the government can promptly start the actual work of right of way acquisition simultaneously with the feasibility study, and be completed before bidding or commencement of construction activities. Based on the discussion and international practices, the typical form of risk allocation is prepared as shown in Table 18.4.1-1.

18-19
TABLE 18.4.1-1 TYPICAL FORM OF RISK ALLOCATION Risks Government Project
Proponent 1. Political Risk
Changes in Policy/Strategy Vulnerability of political support
2. Legislative and Regulatory Risk Unclear demarcation of related agencies’ responsibilities. Non-compliance of rules and regulations. Changes in legislations and regulations
3. Administrative Risk Lack of road network planning Lengthy process in project appraisal Delay in contract approval Insufficient capacity in man-power/organization.
4. Social Risk Poor public relation/awareness Inadequate assessment on stakeholders/affected parties Inefficient grievance mechanism
5. Environmental Risk Adverse impact on natural environment (ecology,
erosion) Unfavorable issues on landscape, aesthetic, historical
heritage. Delay in issuance of environmental compliance
certificate (ECC)
6. ROW Risk Protest on ROW acquisition due to unrealistic land price. Resistance due to non-resettlement action plan (RAP). Public Opposition due to poor acquisition procedures.
7. Economic and Financial Risks Inflation Foreign exchange rate Interest Rate
8. Tendering Risk Lengthy/delayed procurement process Unclear engineering standards on design for tendering Unclear criteria on evaluation of tender
9. Engineering Risk Inadequate survey data (Topography, Geotechnical) Design issues (mistake, errors) Design change Defects liability
(FS)
(FS)
(DE) (DE) (DE) (DE)
10. Construction Risk Delay in delivery of ROW Cost overrun Delay in construction Delay in material procurement
11. Traffic Risk Traffic Volume Toll Rate
(BT, BLT)
12. Operation and Maintenance Risks Conflict with other projects O&M system and cost
(BT, BLT)
(BOT, BTO)
13. Force Majeures Note: Main, Sub
FS; Feasibility Study, DE; Detailed Engineering

18-20
18.4.2 Key Risks in Toll Road Development
(1) Key Risks and Issues through International Practices The international experiences have revealed the following three (3) reasons as key issues and risks in practicing toll road projects through PPP schemes.
(a) The government has not defined the policy with the sound political support and stability.
(Political and Administrative Risk)
(b) Toll road projects have been expected to be profitable without the government support, which are rare cases. (Toll Rate Risk)
(c) Commercially viable tariffs and tariffs adjustment have been difficult to introduce due to
public interest (Viability/Public Accessibility Gap) (2) Key Risks and Issues for Private Sector
The major issues as well as comments and suggestion raised by BOT Firms in the country are summarized in Chapter 4. The firms commits their willingness to assume financing and construction risks in undertaking toll road projects through PPP mechanism providing that the government can handle the obligations specified in the contract agreement. The private sector assures that key issues and risks on the part of private sector are likely to be certain issues which the private sector cannot manage or deal with. Through the discussions with the public and private sectors as well as review of experiences in PPP projects implementation in the country key issues and risks are identified as shown in Table 18.4.2-1. Based on the analysis on risks raised by BOT Firms and key risks noticed through international practices , key risks and issues and mitigation measures in undertaking toll road projects through PPP mechanism in the country are summarized as listed in Table 18.4.2-2; and briefly discussed hereunder.
(a) Political Risk
Toll road development through PPP schemes shall be launched by the government with people’s acceptance and as the political commitment. It shall be noted that as political risk raises, the cost of obtaining financing increases, and process in packaging project become lengthy and bureaucratic.
(b) Administrative Risk
The efficient and capable man-power and organization to undertake PPP projects are vital in administrating and implementing PPP toll road projects. Particularly, at the project planning stage, identification of projects, execution of feasibility study, timely preparation and approval of document shall be done smoothly and effectively. To mitigate such risk, thorough Business Case Study and Feasibility Study for a proposed PPP project shall be conducted.

18-21
TABLE 18.4.2-1 RISKS RAISED BY BOT FIRMS IN THE PHILIPPINES Risks
1. Political Risk 1.1 Franchise and grant of right for linkaged roads 1.2 Lengthy process to package and approve BOT projects
2. Legislative and Regulatory Risk 2.1 Unclear demarcation of agencies, responsibilities 2.2 Delay in issuing ECC, TOC, etc. 2.3 Issuance of building permits within ROW
3. Administrative Risk 3.1 Delay of government approval necessary before bidding 3.2 In-sufficient capacity for BOT group in DPWH 3.3 Non-assertive action of TRB
4. Social Risk 4.1 None
5. Environmental Risk 5.1 Delay in issuing ECC, etc
6. ROW Risk 6.1 No defining of ROW in Feasibility Study 6.2 No ROW acquisition before bidding 6.3 Non/delayed delivery of ROW before construction 6.4 No realistic BIR zonal valuation 6.5 No full-time group for ROW acquisition in DPWH 6.6 No effective Implementation Rules for ROW acquisition 6.7 Non-special ROW courts for expropriation cases
7. Economic and Financial Risk 7.1 Not sufficient GFS including ROW and subsidy in construction cost 7.2 Inadequate and non-timely GFS 7.3 Delay in the proponent’s financial closure 7.4 Foreign exchange risk (loan should be in pesos)
8. Bidding Risk 8.1 Required preparation of feasibility study 8.2 Non-clear evaluation criteria (should be toll rate)
9. Engineering Risk 9.1 Non-clear standards, specifications and parameters for DE
10. Construction Risk 10.1 No enforcement of time limits/milestones of construction 10.2 Impeded construction due to non-delivery of ROW
11. Toll Rate Risk 11.1 Unreliable traffic forecasts done by the government 11.2 Non-approval of toll rate and adjustment formula before bidding 11.3 Shortfalls in traffic volumes 11.4 Shortfalls in revenues 11.5 Disallowing the agreed adjustment of toll rate
12. Operation and Maintenance Risk 12.1 Automatic grant of franchise after contract award 13. Force Majeures
13.1 None

18-22
(c) ROW Risk
Untimely delivery of ROW is one of the most crucial problems, involving innumerable complications, such as delay in design, construction and operation resulting in unnecessary cost increases. Moreover, banks will not release funds until land is available. Banks also required a high level of diligence on legal documents, as well as economic feasibility, commercial viability, cash flow schedule and financial requirements as the condition of financial closure.. To address such risks, the in-depth feasibility study can provide the solution on such risks, including defining ROW required for projects, and preparing a practical implementation schedule of ROW acquisition.
(d) Bidding Risk
In some projects, the government does not prepare a complete business case study and feasibility study, and bidders are required to submit their own feasibility study including traffic study, engineering design, economic feasibility study and financial viability study and financial requirements, among others.
(e) Financial Risk
Some of toll road projects may not be implemented by the finance by commercial sources alone because those projects do not usually provide sufficient financial viability for commercial financing. To attract the investment from private sector for these projects as PPP projects, the government‘s financial participation must be inevitably required in terms of the grant, loan, or guarantee mechanism. This critical requirement shall be thoroughly analyzed in a feasibility study and clearly specified in the Terms of Reference of bidding.
(f) Toll Rate Risk
Traffic volume and toll rate levels are the key elements of toll road projects as sources of revenues so that traffic analysis submitted by bidders as one of bidding requirements shall be carefully evaluated through comparison with traffic analysis made by the government during the feasibility study stage. To mitigate the toll rate risk, the introduction of initial toll rate and toll rate adjustment provided in the contract agreement mutually accepted through bid negotiation shall be systematically and automatically enforced.

18-23
TABLE 18.4.2-2 MAIN RISKS AND MITIGATION MEASURES FOR TOLL ROAD DEVELOPMENT IN THE PHILIPPINES
Risks Proposed Mitigation Measures 1. Political Risk
1.1 Unstable political support and commitment
1.2 Lengthy process in packaging BOT project
1.1 - Firm and strong commitment from politics, government and public.
- Agreement from related agencies including LGU. - Close consultation with stakeholder.
1.2 - Master Plan to justify Effective Road Network including Toll Road Development - Business Case Study to warrant appropriate PPP modality, legal
context. Financial aspects and willingness from private sector. 2. Administration Risk
2.1 Inefficient capacity of DPWH BOT Group
2.2 Delay in approval/issuance of required documents.
2.1 - Capacity development for PPP project identification and
Formulation including PPP structure, business case study, feasibility study. - Capacity development for PPP project implementation including
bidding, contract, supervision on operation and maintenance.. - Capacity development to prepare Feasibility Study with more
emphasis on the financial and legal aspects, realistic traffic forecast, and defining of required ROW.
2.2 - Clear work delineation of government operational responsibilities. - Approval of necessary documents/conditions by the government
before bidding including development permits by LGUs, initial toll rate and adjustment formula by TRB, ECC by DENR, etc.
3. ROW Risk 3.1 Non-proper process for
defining ROW
3.2 Non-realistic zonal value 3.3 Non/delayed delivery of
ROW before construction
3.1 - Preparation of reliable Feasibility Study defining required ROW
And authorization thereof by all related government agencies. - Preparation of resettlement action plan for PAPs including informal
settlers. - Preparation of relocation plan of public utilities.
3.2 - More realistic BIR zonal valuation approximating market prices. 3.3 - Organize full-time DPWH ROW group.
- Timely provision of fund for Row acquisition. - Work commencement for ROW acquisition immediately after
authorization of Feasibility Study. 4. Bidding Risk 4.1 Required preparation of bid
proposals. 4.2 Non-clear standard,
specification and parameters for detailed engineering and required level of operation and maintenance.
4.1 - Proper advisement for local and international.
- Availability of all data, analysis, and studies undertaken by government including traffic data, financial analysis and action plan for ROW acquisition.
- Reasonable timing and duration for preparation of bid proposals. 4.2 - Preparation of complete and reliable Feasibility Study.
5. Financial Risk 5.1 Non-sufficient GFS 5.2 Foreign Exchange Risk
5.1 - Preparation of financial analysis to justify GFS. 5.2 - Maximum utilization of local financial system.
6. Toll Rate Risk 6.1 Delay in TOC approval
(Toll Operation Certificate) 6.2 Unreliable traffic forecast
done by the government 6.3 Shortfalls in traffic volumes
and revenues 6.4 Delay in implementation of
toll rate adjustment
6.1 - Approval before bidding by TRB and automatic approval after TCA (Toll Concession Agreement). 6.2 - Preparation of reliable traffic analysis during Feasibility Study. 6.3 - Realistic toll rate and adjustment formula with GFS if necessary. 6.4 - Provision of Material Adverse Grantor Action including
Any failure on adjustments of the authorized toll rate. Non-delivery or late delivery of ROW Any change in existing laws, rules or policies. Any act of the government, which adversely affect the feasibility of
the project.

18-24
18.5 IMPLEMENTATION PLAN 18.5.1 Project Processes and Key Issues
(1) PPP Project Processes
The road map for the successful implementation of PPP projects can be visualized through the development of the effective framework including the development of supporting national and local legislation and regulations, the development of institutional capabilities, and creation of effective management on PPP project cycle. The Guideline for Successful Public-Private-Partnerships by the European Commission suggests the following PPP project cycle.
Preliminary stage (Preparation) Project identification (Business Case Study) Project appraisal PPP design and agreement (Feasibility Study) Procurement (Tendering) Implementation
The Best Practices for Promoting Private Sector Investment in Infrastructure recommended by the ADB proposes the following steps.
Preparation of PPP environment (Preparation) Identification of PPP projects Preparation of Business Case Study Securing of competitive bids, negotiation and award (Tendering) Implementation and Operation
It is noted that both Reports underline the necessity of preparation of PPP environment, identification of PPP projects, and preparation of business case study and PPP design and structure (feasibility study) as the key issues for the successful implementation of PPP projects.
(2) Implementation Process in Revised IRR
The Revised IRR of the BOT Law of the Philippines prescribes the fifteen (15) rules covering all stages of project implementation including the followings.
Project identification and approval Bidding and contract approval Detailed Engineering Construction Operation and Maintenance Coordination and Monitoring

18-25
The lessons learned from the experience of implementation of PPP toll roads projects in the country reveal the following key issues in developing PPP road projects.
Preparation of sector policy Legal and regulatory framework for PPP Identification of projects for priority implementation Design of PPP modality Preparation of business case to establish the basis for bidding Preparation of feasibility study Transparent process of tendering and bid evaluation Specification of detailed engineering Completion of ROW acquisition.
18.5.2 PPP Project Cycle
Based on examination of PPP project implementation processes and key issues, the PPP Project cycle is prepared for recommendation as shown in Table 18.5.2-1. The typical timeframe of each step is assumed as graphically presented in Figure 18.5.2-1. The scope and activities of main step are briefly discussed hereunder.

18-26
TABLE 18.5.2-1 PPP PROJECT CYCLE
Main Outputs
mAMain OMbjectivsm
National Policy
Institutional Capacity
Priority PPP Project
Obstacles and Constraints
Private Sector Interest
Value for Money
Endorsement of PPP Project
Budget Allocation for FS
Establishment of PPP Structure
Establishment of all Parameters for Bidding
Bidding Documents
Commencement of ROW Acquisition
Contracting
Contract Award
Certification of engineering soundness quantity/ quality
Implementation of Toll Rate and Adjustment
Formulation of National Legislative and Regulatory Structure
Political Commitment
PPP Modality
PPP Suitability Assessment
Formulation of National Legislative and Regulatory Standard
Appraisal of Projects as PPP Projects
Implementation Arrangement
Engineering/ Financial Parameters
Delineation of ROW
Approval of Project Implementation
Bidding
Evaluation
Negotiation
Detailed Design
Construction
Operation
Maintenance
Conceptual Implementation Flow
Step 5 Step 4
Step 3
Step 2
Step 1 Step 0
Project Appraisal
Feasibility Study
Project Approval
Bidding
Step 6 - Implementation
(Transport Master Plan)
(Business Case Study)
Project Identification
Preparation Detailed
Design & Construction
Operation &
Maintenance
18-26
Note: ; Tasks to be undertaken by the government ; Tasks to be carried out by the professionals

18-27
FIGURE 18.5.1-1 TYPICAL IMPLEMENTATION SCHEDULE OF PPP PROJECT
Pre Project 1st Year
2nd Year
3rd Year
4th Year
5th Year
6th Year
7th Year
8th Year Remarks
Step 0: Preliminary
Step 1: Business Case Study
Outsourcing to Consultant
Step 2: Project Appraisal
By related Agencies
Step 3: Feasibility Study
Outsourcing to Consultant
Step 4: Project Approval
By Approving Body
Step 5: Bidding
Step 6: Implementation By private sector
6.1 Detailed Engineering
6.2 Construction 6.3 Operation & Maintenance
Step A1: ODA Arrangement By public sector
Step A2: ROW Acquisition
By public sector
18-27
Note: ; Tasks to be undertaken by the government ; Tasks to be carried out by the professionals

18-28
Step 0: Preparation Stage Prior to the decision process, a number of pre-condition shall be preliminary arranged within the
government as defined in the Preparation Stage. The development of an acceptable PPP legal framework, regulatory structures and institutional capacity for its implementation is the mandatory requirements for the successful implementation of PPP projects. These include the followings.
National legislative and regulatory structures Political leadership and commitment to PPP policy Political stability
Step 1: Project Identification The objective of this step is to assess whether a PPP approach is suitable for a proposed project.
The desirability and suitability of implementing a project as a PPP shall be assessed as a business case study. Crucial to the selection process of a PPP is whether it will provide value for money and above all additional value than the traditional public procurement method.
The scopes of the business case study is less than the feasibility study standard and is aimed to evaluate technical feasibility and socio-economic acceptability, and economical and commercial viability to put forward as a toll road project. Table 18.5.2-2 presents main scopes of business case study for PPP projects.
TABLE 18.5.2-2 MAIN SCOPES OF BUSINESS CASE STUDY FOR PPP PROJECTS Activities Outputs
1. Suitability Assessment Legal and institutional aspects Obstacles and constraints Potential PPP modality Preliminary risk assessment Market analysis and private sector interest
2. Traffic Study Network analysis Traffic demand forecast
3. Engineering Design Project Configuration Project Scope Minimum Design Preparation Preliminary cost
4. Environmental Impact Assessment
Initial environmental examination Assessment of land acquisition issues
5. Operation and Maintenance
Operation plan Maintenance plan
6. Economic Feasibility Analysis of economic parameters 7. Financial Evaluation Analysis of financial parameters
Preliminary toll rates Analysis on value for money
Step 2: Project Appraisal
The business case study is to be presented to related agencies of the government for the appraisal.
Upon the appraisal of the case study, the project is proceeds to a detailed feasibility study with a fund arrangement for a feasibility study.

18-29
The project appraisal shall focus on selection of PPP type and defining of PPP structure with the
consideration of the followings.
Project Priority ; Master Plan, PPP Modality Need assessment ; Objectives and needs of service. Design Standard ; Engineering/environment Financial Parameter ; Economic/financial Evaluation Risk allocation ; risk allocation in most cost effective manner, obstacles/constraints. PPP components ; procurement, financing and ownership Budget refinement ; significant improvement in service or cost savings. Expectation on PPP ; roles of public and interest of private sector. Budget for F.S.
Step 3: Feasibility Study
The objectives of this step are to prepare project PPP design and agreement relative to PPP
structure, design of tendering process and implementation conditions. A PPP structure entails technical performance standards and financial assessment to ensure the project viability including risk assessment.
The feasibility study is recommended to be prepared by the public sector because this study aims to develop the minimum technical performance standards and specifications and other significant basic parameters to be used as the basis of tendering and tender evaluation. Main scopes of feasibility study for PPP projects are presented in Table 18.5.2-3

18-30
TABLE 18.5.2-3 MAIN SCOPES OF FEASIBILITY STUDY FOR PPP PROJECTS Technical Aspect
- Project configuration, including alternatives - Minimum design parameters - Performance standards/specifications/level of improvement - Construction method, cost and schedule - Environmental impact assessment/Resettlement action plan - Right-of-way acquisition plan and schedule
Economic/Financial Aspect - Traffic demand forecast over the concession period - Economic analysis (economic costs and benefits, EIRR, ENPV, etc.) - Financial model and analysis (discount rate, foreign exchange rate, inflation
factor, financial viability indicators such as FIRR, FNPV, etc.) - Proposed tolls - Proposed formula and price indices to be used in the adjustment of toll rates - Proposed Government financial support (GFS)
Operation and Maintenance Aspect - Operation and maintenance system - Operation and maintenance cost - Traffic management including overloading - Routine, periodic and emergency maintenance plan - Monitoring plan
Contract Aspect - Assessment and selection of PPP modality] - Work sharing - Risk allocation - Pre-qualification requirements - Parameters and criterion for evaluating project proposals - Investment incentives and government undertakings - Bidding Documents - Contract terms and conditions
Step 4: Project Approval
The feasibility study shall be utilized and approved by the Approving Body (ICC, NEDA Board, Local Sanggunians) for the project implementation through PPP schemes. The project approval shall include all output of the feasibility study including the followings. • Implementation option • Implementation arrangement • Engineering parameters • Financial parameters • ROW acquisition plan • Bidding documents
18-31
Step 5: Bidding The Revised Implementing Rules and Regulations (IRR) of the BOT Law of the Philippines
prescribes the bidding process for toll road projects covering two (2) methods; the public bidding process and process for unsolicited proposals, which shall be observed for a PPP project.
The key in tender process selection lies in the degree to which it is possible to define a project.
The followings shall be clearly defined.
Project requirements to ensure equitable evaluation of bids. Government support for private sector to prepare realistic bids. Simple evaluation criteria Open and transparent tender process Detailed recordings of tender process and evaluation
Step 6: Implementation
The implementation of public sector infrastructure project requires a significant level of proactive
management of the interface between the public sector/government and private sector/contractor in order to ensure that the service is provided in accordance with the precise requirements.
In implementation of PPP project, two (2) separate management process must be considered.
Project management to deal with development of a project. Contract management to ensure the procedures and organization required.
In parallel with this feasibility study, the following two (2) special activities shall be performed by the public sector. Special Activity 1: ODA Arrangement/Budget Allocation The budget allocation in conformance with the project cost plan, the government subsidy arrangement, right of way acquisition plan and other costs required for project implementation shall be undertaken. When the official development aid (ODA) from international lending agencies is expected, the arrangement shall be commenced in parallel with the feasibility study. Special Activity 2: ROW Acquisition The feasibility study shall clearly delineate the road right of way (ROW) required for a project. The acquisition of ROW, therefore, shall be commenced almost simultaneously with the feasibility study, and shall be completed prior to the tendering or before the actual start of construction activities of projects.

18-32
18.6 OPERATION AND MAINTENANCE PLAN 18.6.1 Scope of Toll Road Management
Under PPP schemes, the project proponent shall perform the toll road management involving toll road operation and maintenance in accordance with the terms and conditions agreed between the government and the project proponent, maintaining the order and safety of traffic and ensuring the well being of the toll road users. The toll road management includes the operation and maintenance activities as shown in Figure 18.6.1-1.
FIGURE 18.6.1-1 SCOPE OF TOLL ROAD MANAGEMENT
Toll Collection and Accounting
Traffic Control and Management
Traffic Information Service/ Message Sign
Traffic Monitoring/ Surveillance
Vehicle Regulation (Weight, Load, Height)
Traffic Control (Congestion, Accident,
Emergency)
Rescue of Disabled Vehicles
Personnel and Staff Management
Patrol and Inspection
Maintenance (Daily, Routine, Periodic
Emergency)
Repair and Rehabilitation
Disaster Prevention and Recovery
Road Facilities
Supply Facilities (Electricity, Water, Telecom, Building)
Auxiliary Facilities (Parking, Rest Area)
Environmental Enhancement and
Protection
Operation
Maintenance
Toll Road Management
18-33
18.6.2 Toll Road Operation System The major tasks of toll road operation which PPP company is obliged to undertake include the followings. • Toll collection and accounting • Traffic control and maintenance
(1) Toll Collection and Accounting
Toll System There are two types of toll systems; namely “flat toll system” )open toll system) and “distance-dependent system” (closed toll system) where flat toll system is adopted, toll is collected according to vehicle classification by the toll collector with manual collection. Electronic Toll Collection (ETC) If distance-dependent toll system is selected, Electronic Toll Collection (ETC) is recommended to be introduced because of the calculation of tolls. The ETC system is a system that automatically collects toll from vehicle passing in a toll road without stopping and paying cash at a toll booth. The ETC system can eliminate queuing at toll gates by providing exclusive lanes for ETC-equipped vehicles, and transaction time is much faster. CO2 emissions are also expected to be reduced at ETC toll booths. There are two types of system, namely “on-board unit type” and “prepaid card type”. In the on-board unit system, vehicles do not need to stop at tollbooth, while in the pre-paid card system, prepaid card is inserted in the reading machine. The latter does not need to equip high-cost device on road users, but vehicles have to stop at toll gate.
(2) Traffic Control and Management Traffic control is defined as the actions of traffic controllers/regulators to enforce legislations on road traffic such as regulations on speed, overtaking, stopping and parking and traffic control in emergency. On the other hand, traffic management involves the deeds of road administrators to secure safe, smooth and comfortable traffic condition. Traffic Information System (TIS) The objectives of traffic information system (TIS) for toll roads are to enhance the safety and comfort of road users, ensure fast and smooth traffic flow, maximize efficiency of operation, and minimize adverse effect of incidents, through various functions as listed below; among others. • Information Service • Traffic monitoring/surveillance • Traffic condition and incident detection • Information dissemination The system is an integrated system consisting of several subsystem with respective functions including vehicle detector system, closed circuit television system (CCTV), graphic display panel, highway radio system, sign boards, etc.

18-34
Intelligent Transport System The intelligent transport system (ITS) is an information technology system to link people, vehicles and roads to reduce accidents, increase safety, and reduced congestion, which has been used in Japan. Other Traffic Management Activities The following services shall be included as traffic management activities of toll roads. • Vehicle regulation (weight, load, height) • Rescue of disable vehicles • Clearance of accident site • Rescue of injured persons in accident • Management of personnel and staff in traffic control and management
18.6.3 Toll Road Maintenance System
(1) Maintenance Activities Maintenance Work The objectives of toll road maintenance are to maintain the acceptable level of function of the road and related facilities including the followings. • Road facilities • Supply facilities (electricity, water, telecom, building, etc.) • Auxiliary facilities (parking, rest area, etc.) • Environmental enhancement and protection The activities of toll road maintenance encompass the followings. • Patrol and inspection • Maintenance (daily, routine, periodic, emergency) • Repair and rehabilitation • Disaster prevention and recovery Preventive Maintenance Measures It shall be noted that preventive measures be actively employed before any deteriorations become critical. If deterioration is left, the cost of repair work greatly increase, and the life cycle cost of facilities also increase. Inspection and diagnostic technologies are of the essence for conducting efficient maintenance. Also, inspection data management system and bridge management system shall be developed.
(2) Maintenance Criteria and Performance
Maintenance Criteria and Quality Assurance Maintenance criteria and specification for each road facility should be clearly prepared in bidding documents.

18-35
The quality assurance shall be performed through monitoring and inspection on the maintenance works which should be ensured to be executed in accordance with the criteria and specifications. The following maintenance reports are recommended to be prepared; • Inspection and maintenance activity (quarterly) • Road condition inspection report (annual)
(pavement flatness, undulation and serviceability survey) • Facilities condition report (annual) • Environmental enhancement and protection report (annual)
Performance based Contract
The performance based contract on maintenance of toll road may be recommended to maintain the safety and comfort of road users with the minimum maintenance cost.
This type of contract specifies the results or performance of the maintenance work required and the method of maintenance work can be adopted by a contractor. The contractor can select his special maintenance technique resulting in the good performance and cost reduction.
(3) Asset Management The objectives of maintenance of toll roads are to keep in functional condition and to preserve the values of road facilities with the minimum expenditure at appropriate timings. Management of road assets shall be exercised through the proper maintenance works based on an accurate inventory survey and the asset management plan including the followings. • Planning asset management
The asset management plan shall be designed in consideration of the characteristics of each facility such as facility type, required inspection, level of safety and life cycle cost, etc.
• Identification of field works The field works including daily, routine, repair works shall be identified through the patrols and inspection activities.
• Allocation of maintenance and rehabilitation costs The asset management aims to minimize the life cycle cost of road facilities. The maintenance and rehabilitation cost shall be allotted at the proper timing with appropriate amount.
• Establishment of Organization The organizational structure for asset management shall be established. The financial resources for asset management activities are recommended to be arranged separately from the ordinary maintenance works.
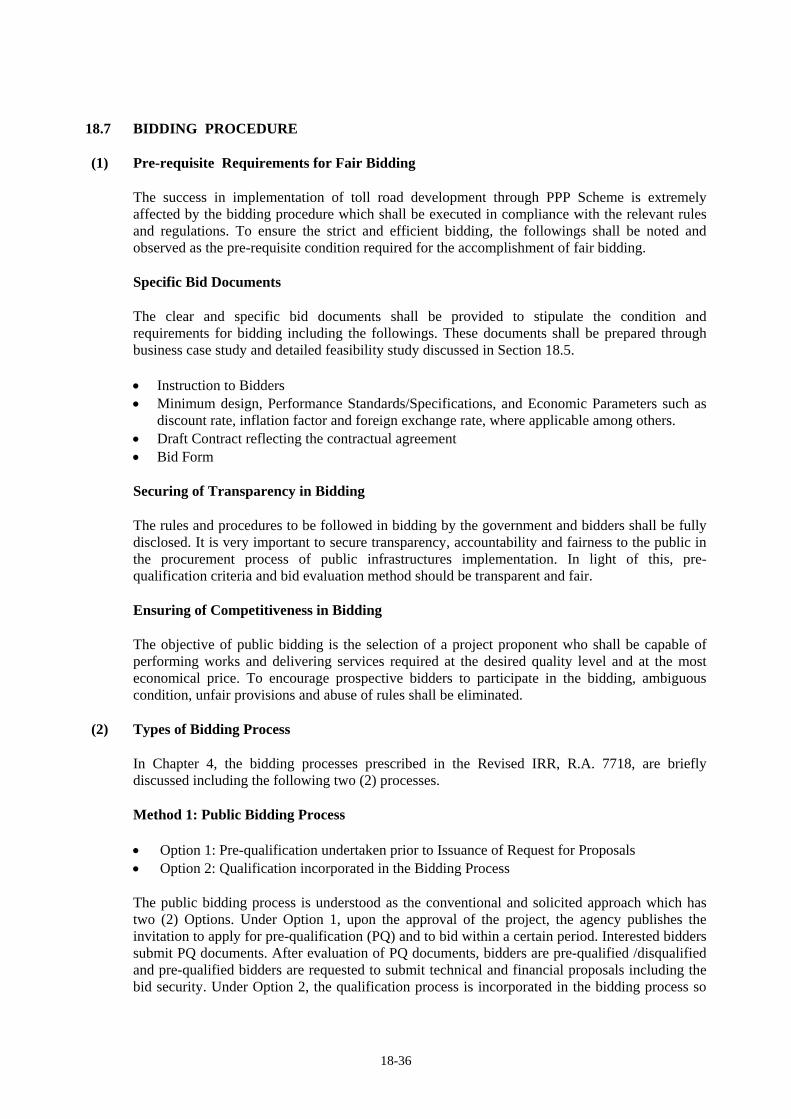
18-36
18.7 BIDDING PROCEDURE
(1) Pre-requisite Requirements for Fair Bidding The success in implementation of toll road development through PPP Scheme is extremely affected by the bidding procedure which shall be executed in compliance with the relevant rules and regulations. To ensure the strict and efficient bidding, the followings shall be noted and observed as the pre-requisite condition required for the accomplishment of fair bidding. Specific Bid Documents The clear and specific bid documents shall be provided to stipulate the condition and requirements for bidding including the followings. These documents shall be prepared through business case study and detailed feasibility study discussed in Section 18.5. • Instruction to Bidders • Minimum design, Performance Standards/Specifications, and Economic Parameters such as
discount rate, inflation factor and foreign exchange rate, where applicable among others. • Draft Contract reflecting the contractual agreement • Bid Form Securing of Transparency in Bidding The rules and procedures to be followed in bidding by the government and bidders shall be fully disclosed. It is very important to secure transparency, accountability and fairness to the public in the procurement process of public infrastructures implementation. In light of this, pre-qualification criteria and bid evaluation method should be transparent and fair. Ensuring of Competitiveness in Bidding The objective of public bidding is the selection of a project proponent who shall be capable of performing works and delivering services required at the desired quality level and at the most economical price. To encourage prospective bidders to participate in the bidding, ambiguous condition, unfair provisions and abuse of rules shall be eliminated.
(2) Types of Bidding Process In Chapter 4, the bidding processes prescribed in the Revised IRR, R.A. 7718, are briefly discussed including the following two (2) processes. Method 1: Public Bidding Process • Option 1: Pre-qualification undertaken prior to Issuance of Request for Proposals • Option 2: Qualification incorporated in the Bidding Process The public bidding process is understood as the conventional and solicited approach which has two (2) Options. Under Option 1, upon the approval of the project, the agency publishes the invitation to apply for pre-qualification (PQ) and to bid within a certain period. Interested bidders submit PQ documents. After evaluation of PQ documents, bidders are pre-qualified /disqualified and pre-qualified bidders are requested to submit technical and financial proposals including the bid security. Under Option 2, the qualification process is incorporated in the bidding process so
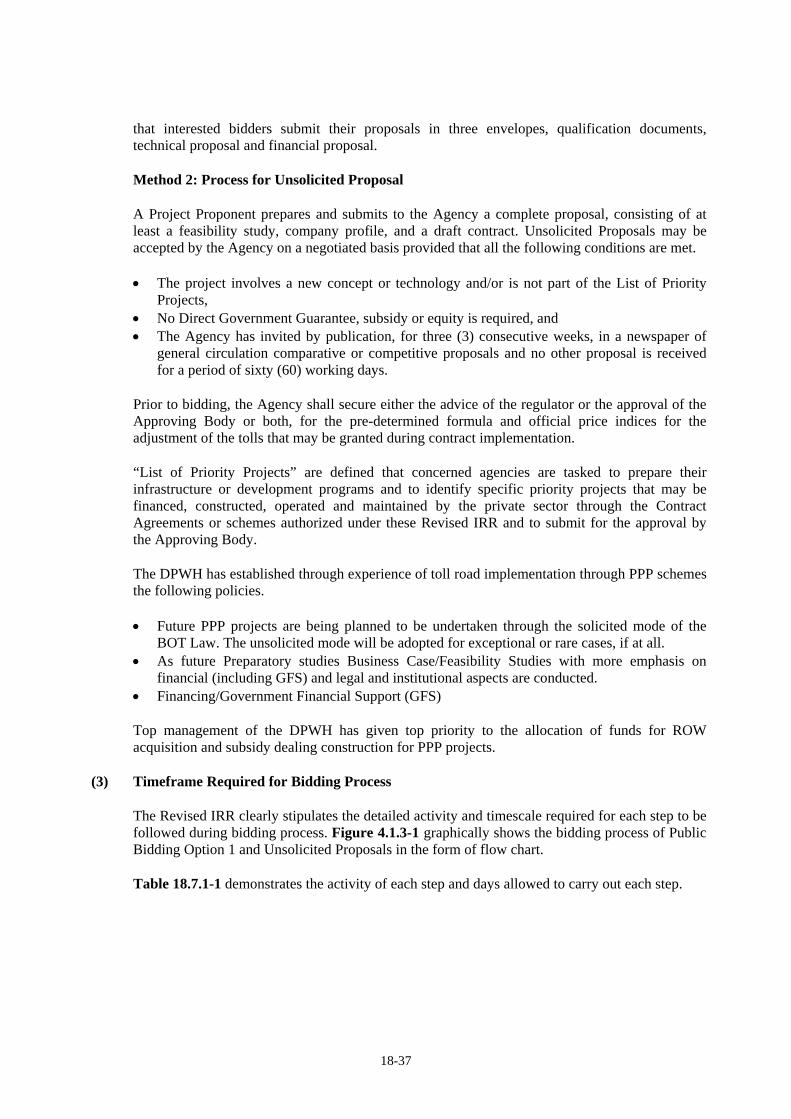
18-37
that interested bidders submit their proposals in three envelopes, qualification documents, technical proposal and financial proposal. Method 2: Process for Unsolicited Proposal A Project Proponent prepares and submits to the Agency a complete proposal, consisting of at least a feasibility study, company profile, and a draft contract. Unsolicited Proposals may be accepted by the Agency on a negotiated basis provided that all the following conditions are met. • The project involves a new concept or technology and/or is not part of the List of Priority
Projects, • No Direct Government Guarantee, subsidy or equity is required, and • The Agency has invited by publication, for three (3) consecutive weeks, in a newspaper of
general circulation comparative or competitive proposals and no other proposal is received for a period of sixty (60) working days.
Prior to bidding, the Agency shall secure either the advice of the regulator or the approval of the Approving Body or both, for the pre-determined formula and official price indices for the adjustment of the tolls that may be granted during contract implementation. “List of Priority Projects” are defined that concerned agencies are tasked to prepare their infrastructure or development programs and to identify specific priority projects that may be financed, constructed, operated and maintained by the private sector through the Contract Agreements or schemes authorized under these Revised IRR and to submit for the approval by the Approving Body. The DPWH has established through experience of toll road implementation through PPP schemes the following policies. • Future PPP projects are being planned to be undertaken through the solicited mode of the
BOT Law. The unsolicited mode will be adopted for exceptional or rare cases, if at all. • As future Preparatory studies Business Case/Feasibility Studies with more emphasis on
financial (including GFS) and legal and institutional aspects are conducted. • Financing/Government Financial Support (GFS) Top management of the DPWH has given top priority to the allocation of funds for ROW acquisition and subsidy dealing construction for PPP projects.
(3) Timeframe Required for Bidding Process The Revised IRR clearly stipulates the detailed activity and timescale required for each step to be followed during bidding process. Figure 4.1.3-1 graphically shows the bidding process of Public Bidding Option 1 and Unsolicited Proposals in the form of flow chart. Table 18.7.1-1 demonstrates the activity of each step and days allowed to carry out each step.

18-38
TABLE 18.7.1-1 TIMELINES REQUIRED FOR BIDDING PROCESS UNDER R.A. 7718 (BOT LAW)
Activities Agency RequiredDays Before Bidding 1st Year 2nd Year Remarks
Public Bidding; Prequalification undertaken Prior to Issuance of Request for Proposals (Option 1 Case)
Step 01: Project Identification and Preparation
Agency Indefinite FS Feasibility Study
Step 02: Approval by Approving Body A.B. 30 A.B. (ICC, NEDA)
Step 1: Advertisement/Invitation to Pre- qualify and Bid
Agency 21 P.Q. Invitation
Step 2: Preparation of P.Q. Documents Bidders 45 (30) (Less than Php 300M)
Step 3: P.Q. of Bidders and informing Agency 30 + 7 Pre/disqualification
Step 4: Issuance of Request for Proposal/Bid Preparation
Agencies/ Bidders
120 (90)
223 days
Pre-bid conference
Step 5: Bid Submission and Evaluation Agency 30 + 15 Two Envelopes (Technical/Financial)
Step 6: Approval of Contract Award Agency 7 + 7 282 days
PBAC, Head
Step 7
Issuance of Notice of Award Agency Indef. + 7 Notification
Compliance of Conditions and Requirement
Winning Proponent
30 Requirement for Contract Award
Step 8: Execution /Approval of Contract Agency Indef. 7 + 7
Compliance of all conditions
Step 9: Issuance of Notice to commence implementation & Contract Implementation
Agency 7
Financial Closure
Total 340 + Indefinite duration (2 Times); Estimated total Duration 15 months after Step 1.
Process for Unsolicited Proposals
Step 01: Submission of Complete Proposal
Proponent 7 F.S. Draft Contract Company Profile
Step 02: Evaluation of Proposal Agency 30 If complete proposal Reasonable Rate of Return
Step 03: Negotiation with Original Proponent
Agency Indef. + 90
After commencement of negotiation
Step 04: Approval of Project Proposal AB Indef. + 30
After receipt of endorsement
Step 1: Adjustment of Tolls/Fee Agency Indefinite Approval by Regulator & AB
Step 2: Acceptance of Terms and Conditions
Proponent 45 After receipt of Notice of Approval
Step 3: Issuance of Invitation for Comparative Proposals
Agency 21 After acceptance of all Terms and Conditions
Step 4: Preparation and Submission of Comparative Proposals
Comp. Proponent
60 3 envelopes (Qualification,
Note: : Activities before PQ Process/Approval of Project : Indefinite Duration

18-39
Process for Public Bidding (Option 1 Case) Step 01, 02; Project Identification and Approval by Approving Body
Agency prepares the feasibility study and the contract including all necessary documents and submits to the Approving Body (ICC, NEDA Board, Local Sanggunians) for proposal.
Step 1, 2, and 3; Pre-Qualification (PQ)
The Head of the Agency shall create a BOT Pre-qualification, Bids and Awards Committee (PBAC). For pre-qualification, a prospective Project Proponent must comply with the following requirements. • Legal Requirements • Experience or Track record (Firm Experience, Key Personal Experience) • Financial Capability (Capability in terms of Equity and Debt)
Step 4 and 5; Bid Preparation and Evaluation Pre-qualified bidders shall submit their proposal in two envelopes.
• First Envelope – Technical Proposal including Bid Security, and • Second Envelope – Financial Proposal Only those bidders whose technical proposal passed the evaluation criteria as prescribed shall have their financial proposal opened for further evaluation.
Step 6, 7, 8 and 9; Approval of Contract Award and Notice to Commence Implementation
The technical proposals of the bidder shall be evaluated in accordance with the following criteria. • Technical Soundness; preliminary/basic engineering design, construction method and
schedule. • Operational Feasibility; organization, methods and procedures for operation and
maintenance. • Environmental Standards; design in accordance with environmental standards. • Project Financing; financing plan meeting project cost requirements • Enhancements; offering terms more attractive to the government. The evaluation on second envelope shall involve the assessment and comparison of the financial proposal of the bidders. The notice to commence implementation and contract implementation shall be issued after approval of contract award, issuance of notice of award, compliance of conditions and requirement by a winning project proponent, execution or approval of contract and compliance with conditions precedent for contract implementation (usually include financial closure).
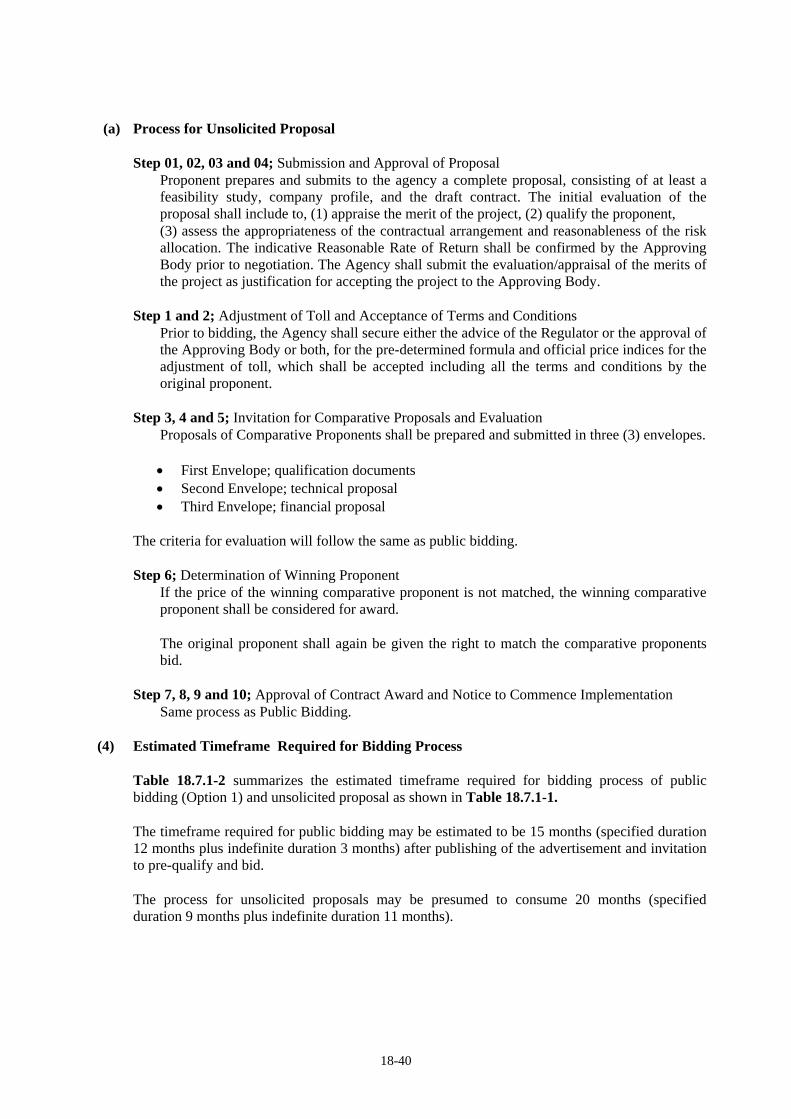
18-40
(a) Process for Unsolicited Proposal Step 01, 02, 03 and 04; Submission and Approval of Proposal
Proponent prepares and submits to the agency a complete proposal, consisting of at least a feasibility study, company profile, and the draft contract. The initial evaluation of the proposal shall include to, (1) appraise the merit of the project, (2) qualify the proponent, (3) assess the appropriateness of the contractual arrangement and reasonableness of the risk allocation. The indicative Reasonable Rate of Return shall be confirmed by the Approving Body prior to negotiation. The Agency shall submit the evaluation/appraisal of the merits of the project as justification for accepting the project to the Approving Body.
Step 1 and 2; Adjustment of Toll and Acceptance of Terms and Conditions
Prior to bidding, the Agency shall secure either the advice of the Regulator or the approval of the Approving Body or both, for the pre-determined formula and official price indices for the adjustment of toll, which shall be accepted including all the terms and conditions by the original proponent.
Step 3, 4 and 5; Invitation for Comparative Proposals and Evaluation Proposals of Comparative Proponents shall be prepared and submitted in three (3) envelopes.
• First Envelope; qualification documents • Second Envelope; technical proposal • Third Envelope; financial proposal
The criteria for evaluation will follow the same as public bidding. Step 6; Determination of Winning Proponent
If the price of the winning comparative proponent is not matched, the winning comparative proponent shall be considered for award. The original proponent shall again be given the right to match the comparative proponents bid.
Step 7, 8, 9 and 10; Approval of Contract Award and Notice to Commence Implementation Same process as Public Bidding.
(4) Estimated Timeframe Required for Bidding Process
Table 18.7.1-2 summarizes the estimated timeframe required for bidding process of public bidding (Option 1) and unsolicited proposal as shown in Table 18.7.1-1. The timeframe required for public bidding may be estimated to be 15 months (specified duration 12 months plus indefinite duration 3 months) after publishing of the advertisement and invitation to pre-qualify and bid. The process for unsolicited proposals may be presumed to consume 20 months (specified duration 9 months plus indefinite duration 11 months).

18-41
TABLE 18.7.1-2 ESTIMATED TIMEFRAME REQUIRED FOR BIDDING PROCESS Estimated Months before Commencement of Work
Steps Activities
Estimated Months before
Bidding Specified Months (days)
Estimated Indefinite Months
Estimated Total Months
Public Bidding Step 01, 02 Project Identification/Approval 18 mos. - - - Step 1, 2, 3 Pre-Qualification 2.2 (66) - 2.5 Step 4, 5 Bid Preparation/Evaluation 6.7 (202) - 7.0 Step 6, 7, 8, 9 Contract Approval/Notice to
Commence Implementation 2.4 (72) 3.0 5.5
Total 18 mos. 11.3 (340) 3.0 15 mos. Unsolicited Proposal
Step 01, 02, 03 Submission/Approval of Proposal 22 mos. - - - Step 1, 2 Acceptance of Terms/Conditions 1.5 (45) 4.0 5.5 Step 3, 4, 5 Comparative Proposals/Evaluation 5.2 (156) - 5.0 Step 6 Determination of Winning
Proponent - 4.0 4.0
Step 7, 8, 9, 10 Contract Approval/Notice to Commence Implementation
2.4 (72) 3.0 5.5
Total 22 mos. 9.1 (273) 11.0 20 mos.

18-42
18.8 ROADMAP FOR TOLL ROAD PROJECT IMPLEMENTATION THROUGH PPP SCHEME
(1) Practices Recommended through PPP Experiences
It is widely acknowledged through worldwide PPP experiences that reasons for limited progress in toll road development through PPP schemes are; • Non-initiatives of the Government.
Governments have not initiated their specific policy, resulting in project preparation and identification by the private sector.
• Over-expectation on PPP Toll road projects have been overestimated to be profitable without government support.
• Gap on Toll Level between Business Level and Public Acceptability Toll rate and its adjustment acceptable for the business level have been proved difficult to be introduced because of public acceptability.
• Professional Ethics and Approach Transparency and competition has been verified to be crucial and indispensable for successful implementation.
The best practices suggested by the ADB Report “Developing Best Practices for Promoting Private Sector Investment in Infrastructure, Roads, include the followings. Preparation of PPP Environment • Soundness of political leadership • Initiatives of the government • Creating independent regulator • Developing an acceptable PPP legal framework • Securing competition for the market • Project identification and preparation by the government, and • Competitive bidding for implementation by the private sector where unsolicited bids are
accepted, they should be subject to realistic competition. Identification of PPP Projects The government shall prepare a Transport Master Plan focusing on the followings. • Preparation of transport development strategy. • Identification of priority PPP projects
The potential projects in promoting economic development and social and environmental objectives should be addressed.
• Focus on implementability and financing. • Implementing capacity of the government. Preparation of Business Case Study The business case study shall be conducted with the in-depth analysis of the followings.
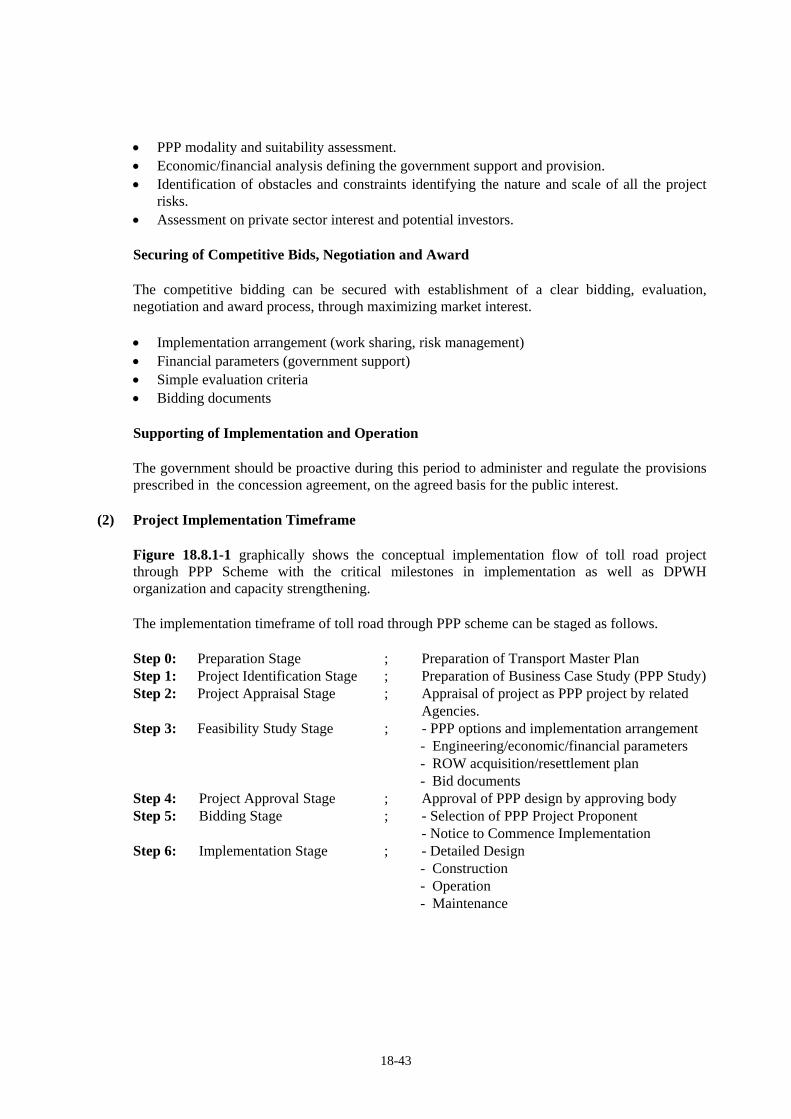
18-43
• PPP modality and suitability assessment. • Economic/financial analysis defining the government support and provision. • Identification of obstacles and constraints identifying the nature and scale of all the project
risks. • Assessment on private sector interest and potential investors. Securing of Competitive Bids, Negotiation and Award The competitive bidding can be secured with establishment of a clear bidding, evaluation, negotiation and award process, through maximizing market interest. • Implementation arrangement (work sharing, risk management) • Financial parameters (government support) • Simple evaluation criteria • Bidding documents Supporting of Implementation and Operation The government should be proactive during this period to administer and regulate the provisions prescribed in the concession agreement, on the agreed basis for the public interest.
(2) Project Implementation Timeframe Figure 18.8.1-1 graphically shows the conceptual implementation flow of toll road project through PPP Scheme with the critical milestones in implementation as well as DPWH organization and capacity strengthening.
The implementation timeframe of toll road through PPP scheme can be staged as follows. Step 0: Preparation Stage ; Preparation of Transport Master Plan Step 1: Project Identification Stage ; Preparation of Business Case Study (PPP Study)
Step 2: Project Appraisal Stage ; Appraisal of project as PPP project by related Agencies.
Step 3: Feasibility Study Stage ; - PPP options and implementation arrangement - Engineering/economic/financial parameters - ROW acquisition/resettlement plan - Bid documents
Step 4: Project Approval Stage ; Approval of PPP design by approving body Step 5: Bidding Stage ; - Selection of PPP Project Proponent - Notice to Commence Implementation Step 6: Implementation Stage ; - Detailed Design
- Construction - Operation - Maintenance

18-44
Project Identification and Business Case Study Stage Feasibility Study D/D & Construction Stage O & M Stage
CONCEPTUAL IMPLEMENTATION FLOW
Module 1:PPP Legal and Regulatory Framework
Module 2:Project Identification
Module 3:Project Business Case Study
Module 6:Project Implementation
Module 7:Project Operation
Module 8:Project Monitoring & Post-Evaluation of Impact
Milestone 1PPP Environment Development
Milestone 2Appraisal of Project as PPP by Related Agencies
Milestone 3Approval of PPP Design by Approving Body
Milestone 6Notice to Commence Implementation
•Political Commitment•PPP Legal/Regulatory•DPWH Implementing Organization/Capacity •Appraisal of
PPP Primary Subjects listed above
•Approval of PPP Design Subjects listed above
Milestone 4Loan/ODA Arrangement for GRP Segment
Milestone 5ROW Acquisition before commencement of Construction (Requirement of Financial Closure)
•Approval of Contract Award by Agency•Compliance of Condition and Requirement by Project Proponent•Financial Closure (Debt, Equity, Loan)
Note: Related Agencies•DPWH•TRB•NEDA•DOTC•DENR•DBM , etc
Note: Approving Body•ICC•NEDA Board•Local Sanggunians
•Detailed Traffic Survey•Technical Soundness Evaluation•Environmental Impact Evaluation•Preparation of O&M
•Economic Feasibility Evaluation•Financial Viability Evaluation•Risk Assessment•Selection of Modality
•Procurement Plan and Documents•Project Appraisal and Approval•Programming and Budgeting
•Conduct of Bidding•Bid Evaluation and Award•Contract Perfection•ROW Acquisition•Financial Closure
•Review of DE•Construction Supervision
•Toll Rate•Toll Rate Adjustment
•Implementation Option•Implementation Arrangement (Work Sharing, Risk Management)•Engineering Parameters (Project Configuration, Min. Requirements)•Economic Parameters (Traffic Demand, Economic Frameworks)•Financial Parameters (GFS, Toll Rate/Adjustment)•Environmental Consideration •ROW Acquisition/Resettlement Plan•Bidding (Bid Document, Draft Contract)
GRP SegmentPreparation Project Identification
Feasibility Study
Appraisal of Project as PPP
by Related Agencies
•Master Plan•Project Priority/PPP Modality•Engineering/Environment•Economic/Financial Evaluation•Obstacles and Constraints•Private Sector Interest•Budget for F.S
PPP Primary Subjects
Conventional
PPP Options Road SegmentsOption 0:
Option 2:
Option 3:
GRP Segment
Segment Dividing
Conventional
BOT Type
Private Segment
Approval of PPP Design by
Approving Body
PPP Design Subjects
Selection of Consultant
Detailed Design
Bidding for Construction
Construction
Operation and Maintenance
Bidding for Selection of PPP Project Proponent
Notice to Commence Implementation
ConstructionDetailed Design
GRP Segment
Private Segment
Private Segment
15 months By Winning Bidder
20 months Financial Closure By Project Proponent
By Project Proponent
Transport Master Plan•Political Commitment•National Policy•Regulatory Structure•Institutional Capacity
Business Case Study•PPP Modality•PPP Suitability Assessment•Value for Money
Contract Award
Milestone 7Implementation of intial toll rates and adjustment
Step 6Implementation Step 5
Step 4Project AppraisalStep 2
Step 1Step 0 Step 3
Project Approval
DPWH ORGANIZATION AND CAPACITY STRENGTHENING PLAN
CRITICAL MILESTONES IN PROJECT IMPLEMENTATION
Bidding Stage
Module 4: Project Feasibility Study
Module 5: Project Procurement
FIGURE 18.8.1-1 ROADMAP FOR REALIZATION OF TOLL ROAD PROJECT THROUGH PPP SCHEMES
18-44

18-45
(3) Critical Milestones in Project Implementation Figure 18.8.1-1 also demonstrates potential critical milestones in project implementation in line with the project implementation timeframe as summarized hereunder. Milestone 1; PPP Environment Development (Step 0) The PPP environment involving the national transport policy, political stability and commitment as well as legal and regulatory structure shall be developed, which is the most vital key for the success of toll road implementation under PPP scheme. The organization and capacity of PPP related agencies, especially DPWH, shall be strengthened since DPWH is the sole entry point for toll road projects and tasked to oversee the design, Row acquisition, bidding, construction, financing, operation and maintenance of toll roads. Milestone 2; Appraisal of Projects as PPP by related agencies (Step 2) The comprehensive Business Case Study shall be conducted before undertaking a feasibility study. The Business Case Study shall consider all funding options including PPP modality exercising the value for money concept, and assess the suitability of PPP scheme for a project. These PPP primary issues and subjects identified in the Business Case Study including PPP modality and suitability assessment shall be appraised by PPP related agencies such as DPWH, TRB, NEDA, DOTC, DENR, DBM, LGU, etc. Milestone 3; Approval on PPP Design by Approving Body (Step 4) Upon the appraisal of project as PPP project through Business Case Study, the detailed Feasibility Study shall be conducted to recommend the most appropriate implementation option and arrangement of PPP structure. The Feasibility Study shall also conduct the traffic analysis and establish the economic and financial parameters to provide the clear and fair bases for bidding. Bid document and draft contract required for selection of PPP project proponent shall also be prepared. It shall be noted that the ROW required for the project be clearly defined in the Feasibility Study, and the resettlement action plan for project affected people (PAP) be prepared. Therefore, the PPP design issues and subjects identified through the Feasibility study shall be promptly approved by the Approving Body (ICC, NEDA Board, Sanggunians). The prompt approval of the Feasibility Study shall be recognized to be the most critical milestone because of the followings.
Justification of the government support, if necessary Preparation of the clear and competing bidding documents. Delineation of ROW to be acquired and preparation of resettlement action plan. Commencement of loan (ODA) arrangement if necessary.
Milestone 4; Loan (ODA) Arrangement for GRP Segment (Step 4) The loan (ODA) arrangement shall be started after the project approval by the approving Body, and be preferably concluded before selection of consultants for the detailed design. The duration for this activity is very limited.
18-46
Milestone 5; ROW Acquisition (Step 4 & 5) The Row acquisition and resettlement of PAPs are undoubtedly the most serious obstacle and risk in project implementation. These activities shall, therefore, be commenced immediately after the approval of project and shall be completed preferably before bidding or at the latest before start of construction. It shall be noted that the clear construction area or availability of ROW is one of the compulsory conditions for the financial closure of the project. Milestone 6; Notice to Commence Implementation (Step 5) The lengthy process flow is required after bid evaluation to the issuance of notice to commence implementation and contract implementation, involving the approval of contract award, issuance of notice of award, compliance of conditions and requirement by winning proponent, execution/approval of contract, and the financial closure. The timely actions and approval by the related agencies on these matters shall be highly appreciated for the smooth implementation of the project. Milestone 7; Implementation of Initial Toll Rate and Adjustment (Step 6) The implementation of initial tool rate and timely toll adjustment agreed in the concession agreement may encounter with the difficulty because of public acceptance and political sensitiveness.
(4) DPWH Organization and Capacity Strengthening Plan Figure 18.8.1-1 also presents the DPWH organization and capacity strengthening plan for PPP project implementation. The modules are shown in accordance with the project implementation timeframe as summarized hereunder. Refer to Chapter 31 for the detailed discussion. Module 1: PPP Legal and Regulatory Framework Module 2: Project Identification Module 3: Project Business Case Study Module 4: Project Feasibility Study Module 5: Project Procurement Module 6: Project Implementation Module 7: Project Operation Module 8: Project Monitoring and Post Evaluation of Impact

PART III
METRO CEBU

CHAPTER 19
GENERAL PROFILE OF METRO CEBU

19-1
CHAPTER 19 GENERAL PROFILE OF METRO CEBU
19.1 PHYSICAL PROFILE 19.1.1 Geophysical Characteristics
The Philippine Archipelago is situated in Southeast Asia between 4º23’N to 21º25’N latitude and between 116ºE to 127ºE longitude. It consists of 7,100 islands with a total land area of 300, 000 km2. The Study Area is located in the Visayas, the third largest (56,607 km2) in terms of total land areas, of three (3) island groups that comprise the archipelago. The other island groups are namely Luzon, the largest with 138, 703 km2, and Mindanao, with 102,003 km2.
(1) Location of Metro Cebu
Metro Cebu consists of five cities (Danao, Cebu city, Lapu-lapu, Mandaue, Talisay) and eight municipalities (Compostela, Loan, Consolacion, Cordova, Minglanila, Naga, San Fernando, and Carcar). Metro Cebu HSH (proposed) is stretching out on the central east coast of Cebu Island, trough most of Metro Cebu, except these locating on Mactan island. Figure 19.1.1-1 shows a relative location of Cebu Island (Region VII).
(2) Topography
The study area starts from Danao City (10º31’N latitude, 124ºE 00’E longitude) and ends at Carcar (10º31’N latitude, 124ºE 00’E longitude) and runs from northeast to southwest. Its terrain is relatively flat on the narrow coastal plain and becomes rolling and hilly at elevations of 40 to 200 meters, then generally rugged and mountainous at elevation of 200 to almost 800 meters above sea level. The slopes vary from 0 to 60 degrees. Its relatively flat terrain is only approximately 15% of the total land area. The mountain areas have become generally unproductive due to the adverse effects of deforestration and poor soil condition; and, the inadequacy of feeder roads has limited the use of the land for agricultural purposes. Total of 80% of Cebu City is mountains with slope up to 60 degree and elevation between 40 to 800 meters. This topography forces to form a belt of built up commercial and residential areas right on the coast line. In terms of effective land use, Cebu City has very unfavorable topography, since 80% of its total land area is mountainous. This situation also holds true for the adjoining municipalities, thereby limiting growth to the linear or ribbon type of development along the coastal plains. Cebu City's scarce land for urban development is the rationale behind the reclamation of foreshore lands. Land use for the relatively flat area of Cebu City, considered as the urban core within the Metropolitan Cebu Area, is rapidly being intensified, with the old districts becoming high density areas including the Central Business District (CBD).

19-2
FIGURE 19.1.1-1 MAP OF REGION VII FIGURE 19.1.1-2 TOPOGRAPHICAL MAP OF METRO CEBU
(3) Geologic fault lines
Known active faults in Region 7 are shown in Figure 19.1.1-3.
19.1.2 Meteorology
Precipitation data were collected at Mactan international airport (10 ˚17’48’’ N latitude, 123 ˚57’48’’ E longitude, and 12.8m elevation) in Cebu for last three decays, from 1972 to 2000. The collected data were processed by Philippine Atmospheric, Geophysical and Astronomical Service Administration (PAGASA) of the Department of Science and Technology. Averaged amount of rain fall and temperature are summarized in Table 19.1.2-1

19-3
Source: Philippine Institute of Volcanology and Seismology ( PHIVOLCS)
FIGURE 19.1.1-3 GEOLOGICAL FAULT MAP OF REGION VII The Philippines is located in a tropical climate zone. The Cebu Metropolitan Area is located in the third type climate that is classified by the Weather Bureau in which there is no distinct wet or dry season. Humidity is approximately 77%, decreasing during the summer months and increasing during the rainy days by a few percent.
Ambient temperatures in Cebu area are fairy steady throughout a year. An averaged mean temperatures is 28.0 Celsius with deviation of 3 Celsius. On an average, the maximum and minimum of daily maximum temperatures are 32.8 Celsius in May and 29.8 Celsius in January respectively. On an average, the maximum and minimum of daily minimum temperatures are 25.8 Celsius in May and 23.8 Celsius in January respectively. The mean temperature of the coolest month of January is 1 Celsius wormer than the coolest hour in the hottest month of May. Total precipitation of Cebu is 1519mm per year. It seems that seasons in Cebu are separated into two by the amount of precipitations: it rains less from January to May than from June to December. On an average, it rains about 1/3 of a month through out the year. A month of the lowest precipitation is April; it rains about 50mm which is about 1/4 of May. The amount of precipitation jumps from 78.8mm in May to 181.3 in June. Precipitation in June is highest and

19-4
most intense, 13mm per day of a rain event. June, July, and October show high amount of precipitation with high numbers of thunders and lightings events reported, compare to the rest of a year due to frequent occurring of typhoons.
TABLE 19.1.2-1 AVERAGE PRECIPITATION AND TEMPERATURE (1972-2000) Month Annual
Jan Feb Mar Apr May June Jul Aug Sep Oct Nov Dec Cum. Ave.
Max (C) 29.8 30.1 31 32.1 32.8 32 31.6 31.8 31.9 31.4 31 30.3 N/A 31.3 Min(C) 23.8 23.9 24.4 25.4 25.8 25.3 24.9 25.1 24.9 24.8 24.7 24.2 N/A 24.8
Tem
p.
Mean(C) 26.8 27 27.7 28.8 29.3 28.7 28.3 28.5 28.4 28.1 27.9 27.3 N/A 28.0 Amount
(mm) 108.9 77.8 56.7 48.9 78.8 183.1 181.3 144.7 168.8 182.2 155 133.2 1519 126.6
Event (days/mo) 11 9 7 5 7 14 15 12 14 15 13 13 135 11
Prec
ipita
tion
Intensity (mm/event) 10 9 8 10 11 13 12 12 12 12 12 10 N/A 11
Source: PAGASA 19.1.3 Watershed and Flood
(1) Watershed There are five major watershed systems in Cebu City area (Table 19.1.3-1).
TABLE 19.1.3-1 LIST OF WATERSHEDS IN CEBU CITY AREA
Legal Mandate Area Covered (ha.)
Barangays Covered
Buhisan Watershed Forest Reserve
E.O. No. dated July 13, 1991
631 Buhisan, Tisa Pardo, Toong, Pamutan, Guadalupe, Sapangdaku
Mananga Watershed Forest Reserve
Presidential Proclamation 681
6,325 Buot-Taup, Sinsin, Bonbon, Pamutan & Pungol-Sibugay
Kot-kot Lusaran Watershed Forest Reserve
Presidential Proclamation 932 amended by 1074
14,220 Taptap, Guba, Agsungot, Paril, Lusaran, Adlaon, Sudlon I & II
Sudlon National Park
Presidential Proclamation 56
896 Sudlon I & II part of Sinsin
Central Cebu National Park
Presidential Proclamation 202 amended by 835-A
11,893.58 Balamban, Sudlon I & II, Tagbao, Lusaran , part of Cambinocot &
Adlaon Sources : DENR and Cebu City GIS, 1998 in City of Cebu Comprehensive land use plan
Especially Manakan and Kotkot-Lusaran watersheds are proclaimed as major watersheds of the country by Pursuant to Presidential Proclamation of 932 and 581, thus these areas are considered to be environment protected zone. However, regardless of the presidential act, these areas are occupied by settlers which potentially damage natural habitats and causes soil erosion. Almost one fourth of the population in the said watershed failed the slope requirements needed to have a safe settlement, especially those situated in the restoration zone1. Barangay Sinsin that incurred landslide in 2008 is located in Mananga Watershed Forest Reserve and Sudlon National Park.
1 E.A.L. Salas, S. Arguillas, R.J. Cua Ho, H.L. Torres. A situational report on the human settlement suitability in Cebu Watersheds. at http://www.gisdevelopment.net/application/urban/overview/ma0546pf.htm

19-5
(2) Flood prone area
Steep mountains locating close to each other which allow to funnel large amount of water into the rivers in short time. Cebu City contains 6 major rivers with high flood probability within 16km of coast line. Figure 19.1.3-1 shows river systems and flood model prediction. The red patches around rivers in the figure indicate flood prone areas. Buildup areas and poor settlers tends to locate in the red zones.
19.1.4 Environmentally
Protected Area
Four national parks, one game refuge and bird sanctuary, four wildness areas, four watershed forest reserves, and five mangrove swamp forests reserves locate in the region VII as shown in Figure 19.1.4-1. Out of those protected areas, four national parks, one game refuge and bird sanctuary, two wildness areas, and three watershed forest reserves are locating in the Metro Cebu area. The wildness areas are located in islands and shorelines.
Source: Study Team FIGURE 19.1.3-1 FLOOD PRONE AREAS

19-6
Source: Map Showing protected areas In Region 7. The Department of Environment and Natural Resources
FIGURE 19.1.4-1 ENVIRONMENTALLY PROTECTED AREA IN REGION VII 19.2
19.2 PRESENT REGIONAL AND URBAN DEVELOPMENT
The Study Area in Visayas is Metro Cebu situated in Central Visayas (Region VII), which is considered to be part of the Central Philippines Super Region. Metro Cebu is the regional center of Region VII and among the main economic hubs of the country. Similar to Metro Manila, Metro Cebu is currently described as not only the service and institutional core of Region VII but also the industrial and tourism core in the Visayas. A number of industrial and economic zones and parks are situated in the region. It is also considered as among the agricultural regions of the country.
Similarly, the region is identified as tourism destination and as such it is the international gateway for the Visayas. The principal tourism products of Metro Cebu and its environs are coastal and aquatic in nature. Furthermore, the proximity of Bohol, which is among the tourism destinations in the country, to Metro Cebu adds to the tourism development not only of Cebu but also of Region VII.
The current development planning approach in Central Visayas, same in Luzon, follows the cluster development approach and the provision of appropriate strategic infrastructure facilities in support of the development plan.

19-7
The clustering of commercial, industrial and institutional land uses in Cebu City justify the presence of metropolitan arrangements, thus the presence of Metro Cebu. Tourism development is concentrated in the environment of Cebu City and its adjacent areas, such as Mactan, Lapulapu and Cordova, among others. Tourism is predominantly coastal and aquatic.
19.3 SOCIO-ECONOMIC PROFILE 19.3.1 Demographic Trend
Past demographic trend is shown in Table 19.3.1-1. Average annual population growth rate of Region VII, Cebu Province and Cebu City between census years is shown in Figure 19.3.1-1. Population of Region VII was 6.4 million in 2007, which is about 7% of the country’s population. Population of Cebu Province, Cebu City, Lapu-lapu City and Mandaue City in 2007 was 2.4 million, 0.8 million, 0.3 million and 0.3 million, respectively. Population growth rate of Region VII, Cebu Province, and Cebu City from 2000 to 2007 was 1.65, 1.75 and 1.52% respectively, all of which were lower than the national average. Lapu-lapu City recorded high population growth rate for the said period at 4.36%. Mandaue City recorded 2.96% of population growth rate for the said period.
5.0
2.11
1.77
2.48
1.65
2.62
1.75
2.71
0.37
1.641.52
2.20
1.65
2.0
3.0
4.0
1.0
1990
1995
2000
2007
Philippines
Cebu City
Cebu ProvinceRegion VII
Source: NSO (2008)
FIGURE 19.3.1-1 PAST POPULATION GROWTH RATE: REGION VII

19-8
TA
BL
E 1
9.3.
1-1
PAST
DE
MO
GR
APH
IC T
RE
ND
: RE
GIO
N V
II
Land
Are
a
1990
1995
2000
2007
(sq
km)
1990
1995
2000
2007
1990
-199
519
95-2
000
2000
-200
7
60,7
03,2
06
68,6
16,5
36
76,5
04,0
77
88,5
74,6
14
340,
575
17
8
20
1
22
5
26
0
2.
48
2.20
2.
11
7 C
entra
l Vis
ayas
4,59
4,12
4
5,01
4,58
8
5,70
6,95
3
6,39
8,62
8
15,8
86
28
9
31
6
35
9
40
3
1.
772.
621.
65
Boh
ol94
8,40
3
99
4,44
0
1,
139,
130
1,
230,
110
4,
821
197
206
236
255
0.95
2.75
1.10
Ceb
u1,
855,
815
1,
890,
357
2,
160,
569
2,
439,
005
5,
342
347
354
404
457
0.37
2.71
1.75
Neg
ros O
rient
al92
5,27
2
1,
025,
247
1,
130,
088
1,
231,
904
5,
386
172
190
210
229
2.07
1.97
1.24
Siqu
ijor
73,9
32
73,7
56
81,5
98
87,6
95
338
21
9
21
9
24
2
26
0
-0
.05
2.04
1.03
Ceb
u C
ity61
0,41
7
66
2,29
9
71
8,82
1
79
8,80
9
28
1
2,17
3
2,35
8
2,55
9
2,84
4
1.64
1.65
1.52
Lapu
-lapu
City
*17
3,74
4
21
7,01
9
29
2,53
0
58
*2,
990
3,
735
5,
035
*
4.55
4.36
Man
daue
City
180,
285
194,
745
259,
728
318,
575
12
15
,409
16
,645
22
,199
27
,229
1.
565.
932.
96So
urce
: N
atio
nal S
tatis
tics O
ffic
e
Phili
ppin
es
Reg
ion
Prov
ince
Act
ual P
opul
atio
nD
ensi
ty (p
erso
ns/s
q km
)Pa
st A
nnua
l PG
R

19-9
19.3.2 Economic Trend
GDP and GRDP of Region VII and industrial structure of Region VII is shown in Table 19.3.2-1 and 19.3.2-2, respectively, Region VII’s GRDP and Sectoral growth rate is shown in Figure 19.3.2-1 to 19.3.2-4. ● Region VII shares about 7.0% of the country’s economic output. ● The Region’s economic growth more or less followed that of the country. ● Economic structure of the Region is as follows: Primary Sector - - - - - - - - - - 10% Secondary Sector - - - - - - - - - - 29% Tertiary Sector - - - - - - - - - - 61% ● Primary sector economic growth rate was lower than that of the country for the period from
2003 to 2007. ● Secondary sector economic growth rate more or less followed that of the country with
slightly higher level. ● Tertiary sector also recorded similar growth rate of the country with slightly higher level.

19-10
6.00
7.18
5.40
4.95
20
03
20
04
20
05
20
06
20
07
10%
9%
8%
7%
6%
5%
4%
3%
2%
1%
-1%
-2%
-3%
-5%
-4%
0%
4.564.93
7.22
6.38
4.81
8.72
Philippines
Region VII
-5.34
2.00
5.18
3.49
1.74
20
03
20
04
20
05
20
06
20
07
10%
9%
8%
7%
6%
5%
4%
3%
2%
1%
-1%
-2%
-3%
-5%
-4%
0%
1.68
3.763.70
4.924.49
Philippines
Region VII
FIGURE 19.3.2-1 GDP AND GRDP (REGION VII) GROWTH RATE
FIGURE 19.3.2-2 PRIMARY SECTOR GROWTH RATE (REGION VII)
20
03
20
04
20
05
20
06
20
07
4.81
5.425.385.21
5.76
3.78
10%
9%
8%
7%
6%
5%
4%
3%
2%
1%
-1%
-2%
-3%
-5%
-4%
0%
2.72
4.00
7.17 7.09
Philippines
Region VII
10.2
6.47
6.517.21
7.73
8.80
7.00
20
03
20
04
20
05
20
06
20
07
10%
9%
8%
7%
6%
5%
4%
3%
2%
1%
-1%
-2%
-3%
-5%
-4%
0%
6.22 6.12
8.13
Philippines
Region VII
FIGURE 19.3.2-3 SECONDARY SECTOR GROWTH RATE (REGION VII)
FIGURE 19.3.2-4 TERTIARY SECTOR GROWTH RATE (REGION VII)
Source: All data of the above figures are taken from NSCB, 2008

19-11
2003
2004
2005
2006
2007
2003
2004
2005
2006
2007
4,31
6.4
4,87
1.6
5,44
4.0
6,03
2.8
6,64
8.2
100%
100%
100%
100%
100%
GRD
PR
egio
n VI
I29
6.5
337.
837
8.5
416.
946
2.0
6.9%
6.9%
7.0%
6.9%
6.9%
SOU
RC
E:
2008
Phi
lippi
ne S
tati
stic
al Y
earb
ook 2003
2004
2005
2006
2007
2002
-03
2003
-04
2004
-05
2005
-06
2006
-07
75.8
81.3
86.2
90.3
98.2
(100
%)
(100
%)
(100
%)
(100
%)
(100
%)
Prim
ary
9.6
9.9
10.1
9.5
10.0
Sect
or(1
2.7%
)(1
2.2%
)(1
1.7%
)(1
0.5%
)(1
0.2%
)Se
cond
ary
22.7
24.1
25.4
26.7
28.6
Sect
or(2
9.9%
)(2
9.6%
)(2
9.5%
)(2
9.6%
)(2
9.1%
)Te
rtiar
y43
.547
.350
.754
.059
.6Se
ctor
(57.
4%)
(58.
2%)
(58.
8%)
(59.
8%)
(60.
7%)
GDP
& G
RDP
in B
illio
n Pe
sos
at C
urre
nt P
rice
Reg
iona
l Sha
re (%
)T
AB
LE
19.
3.2-
1
GD
P A
ND
GR
DP
: R
EG
ION
VII
TA
BL
E 1
9.3.
2-2
I
ND
UST
RIA
L S
TR
UC
TU
RE
AN
D G
RO
WT
H R
AT
ESe
ctor
al G
RDP
(Bill
ion
Peso
s at
Con
stan
t Pric
e)Se
ctor
al E
cono
mic
Gro
wth
Rat
eRe
gion
Sect
or
GD
P
Reg
ion
VII
Tota
l4.
56
2.72
1.68
6.22
3.49
1.74
-5.3
44.
49
7.22
6.00
4.81
8.92
8.80
7.21
6.51
10.2
4
5.76
5.38
5.42
7.17

19-12
19.3.3 Employment
(1) Employed Persons by Major Industrial Group Employed persons by major industrial group is shown in Table 19.3.3-1 and summarized in Table 19.3.3-2.
TABLE 19.3.3-1 EMPLOYED PERSONS BY MAJOR INDUSTRY (REGION VII)
Philippines Region VII Philippines Region VII Industry 33,672 2,588 32,875 2,422 Agriculture, Hunting and Forestry 10,768 765 10,763 688 Fishing 1,393 107 1,408 129 Sub - Total (Primary) 12,161 872 12,171 817 Mining and Quarrying 135 12 116 15 Manufacturing 3,060 339 3,043 331 Electricity, Gas and Water 141 8 108 5 Construction 1,740 156 1,616 136 Sub - Total (Secondary) 5,076 515 4,883 487 Wholesale and Retail, Repair of Motor Vehicles, * 6,176 423 6,215 450 Hotel and Restaurants 907 70 871 57 Transport, Storage and Communication 2,600 161 2,471 158 Financial Intermediation 384 29 337 26 Real Estate, Renting and Business Activities 881 75 736 29 Public Administration & Defense, Compulsory Social Security 1,569 113 1,494 107 Education 1,043 80 989 65 Health & Social Work 396 24 362 26 Other Community, Social & Personal Service Activities 779 53 781 54 Private Household With Employed Persons 1,699 173 1,561 147 Extraterritorial Organizations & Bodies 3 - 3 * Sub - Total (Tertiary) 16,437 1,201 15,820 1,119
Year 2007 Year 2005 Major Industry
Source: National Statistics Office, 2008
TABLE 19.3.3-2 SUMMARY OF EMPLOYED PERSONS
BY MAJOR INDUSTRIAL GROUP Unit: 1,000 persons
Philippines Region VII 2005 2007 2005 2007
Primary Sector 12,171 (1.00)
12,161 (1.00)
817 (1.00)
872 (1.07)
Secondary Sector
4,883 (1.00)
5,076 (1.04)
487 (1.00)
515 (1.06)
Tertiary Sector 15,820 (1.00)
16,437 (1.04)
1,119 (1.00)
1,201 (1.07)
Total 32,875 (1.00)
33,672 (1.02)
2,422 (1.00)
2,588 (1.07)
Source: National Statistics Office, 2008

19-13
(2) Number of Establishments Table 19.3.3-3 shows number of establishments and number of employed at establishments.
TABLE 19.3.3-3 NUMBER OF ESTABLISHMENTS AND EMPLOYMENTS:
REGION VII
2005 2006 2007 2005 2006 2007
PHILIPPINES 782,980 783,065 783,869 5,479,297 4,984,883 5,187,793
7 CENTRAL VISAYAS 44,379 44,367 44,459 403,308 378,447 396,742
BOHOL 6,095 6,089 6,084 28,192 24,909 24,685
CEBU 28,560 28,556 28,651 328,564 312,178 330,071
NEGROS ORIENTAL 9,106 9,104 9,103 44,585 39,831 40,315
SIQUIJOR 618 618 621 1,967 1,529 1,671 Source :
NATIONAL STATISTICS OFFICEIndustry and Trade Statistics DepartmentStatistical Sampling and Operations Division2000 List of Establishments
REGION/PROVINCENo. of Establishments No. of Employments
19.3.4 Per Capita GDP and GRDP
Per capita GDP and GRDP at current price and constant price is shown in Table 19.3.4-1 and 19.3.4-2, respectively.
TABLE 19.3.4-1 PER CAPITA GRDP IN CURRENT PRICE: 2003 – 2007 unit: Peso
Region 2003 2004 2005 2006 200752,718 58,149 63,556 69,365 74,947 1.00
NCR National Capital Region 148,743 165,814 184,758 205,117 223,332 2.98CAR Cordillera Administrative 66,749 71,247 75,556 82,523 85,319 1.14Region I Ilocos 27,943 30,725 33,405 35,996 38,063 0.51Region II Cagayan Valley 26,829 30,474 30,369 33,799 36,605 0.49Region III Central Luzon 39,407 42,256 45,789 49,469 52,351 0.70Region IV-A CALABARZON 50,997 55,213 59,320 63,640 67,466 0.90Region IV-B MIMAROPA 36,538 38,710 43,406 45,420 49,331 0.66Region V Bicol 21,991 24,277 26,316 27,983 31,314 0.42Region VI Western Visayas 42,556 46,875 51,872 56,523 61,382 0.82Region VII Central Visayas 48,573 54,008 59,272 64,261 69,797 0.93Region VIII Eastern Visayas 25,743 29,225 31,223 33,480 33,645 0.45Region IX Zamboanga Peninsula 31,946 34,678 38,386 41,899 45,864 0.61Region X Northern Mindanao 52,436 58,329 62,850 69,197 75,883 1.01Region XI Davao Region 48,176 54,419 59,971 64,520 71,100 0.95Region XII SOCCSKSARGEN 39,960 45,019 47,826 52,384 57,708 0.77Region XIII Caraga 12,193 14,050 15,161 32,493 40,012 0.53ARMM Muslim Mindanao 24,531 26,449 28,194 16,303 16,829 0.22Source: National Statistical Coordination Board.
Philippines

19-14
TABLE 19.3.4-2 PER CAPITA GRDP IN CONSTANT PRICE: 2003 – 2007 unit: Peso
Region Growth Rate2003 2004 2005 2006 2007 2003-200713,252 13,789 14,186 14,681 15,429 3.87
NCR National Capital Region 31,730 33,867 35,742 37,856 40,252 6.13CAR Cordillera Administrative 17,848 18,111 17,919 18,208 19,120 1.74Region I Ilocos 7,209 7,442 7,727 7,988 8,286 3.54Region II Cagayan Valley 7,590 8,228 7,649 8,122 8,511 2.91Region III Central Luzon 11,092 11,054 11,142 11,448 11,904 1.78Region IV-A CALABARZON 13,853 14,068 14,159 14,439 14,891 1.82Region IV-B MIMAROPA 12,120 12,284 12,735 12,603 13,431 2.60Region V Bicol 6,214 6,442 6,632 6,691 7,067 3.27Region VI Western Visayas 11,699 12,347 12,825 13,100 13,842 4.29Region VII Central Visayas 12,419 13,010 13,518 13,917 14,829 4.54Region VIII Eastern Visayas 6,362 6,555 6,678 6,846 6,922 2.13Region IX Zamboanga Peninsula 9,482 9,672 10,159 10,147 10,679 3.02Region X Northern Mindanao 13,904 14,587 14,829 15,651 16,537 4.43Region XI Davao Region 12,842 13,455 13,892 14,157 14,866 3.73Region XII SOCCSKSARGEN 11,112 11,487 11,477 11,982 12,505 3.00Region XIII Caraga 6,516 6,589 6,690 6,994 7,452 3.41ARMM Muslim Mindanao 3,290 3,382 3,433 3,479 3,582 2.15Source: National Statist ical Coordination Board.
Per Capita GRDP
Philippines
Region VII’s per capita GRDP is slightly lower (90%) than that of the country. Region VII recorded higher per capita GRDP growth rate than the country.
19.3.5 Tourism
A report indicated that international tourist arrivals to the Philippines had increased from approximately 2.0 million in 2000 to 2.84 million in 2006, indicating an annual rate of roughly 6% (JBIC 2007). Department of Tourism noted that majority of these tourist arrivals come from Korea, USA and Japan followed by China, Taiwan, Australia, Hong Kong then Singapore, Canada, UK, Germany and Malaysia. The main tourism destinations in Central Philippines for foreign and domestic tourists in Central Philippines are Cebu, Boracay, Palawan, Bohol, Iloilo, and the two Negros Provinces, as shown in Table 19.3.5-1
TABLE 19.3.5-1 DISTRIBUTION OF TOURIST ARRIVALS
IN CENTRAL PHILIPPINES, 2006 Tourist Arrivals (‘000s)*
Destination Foreign Overseas Filipino
Domestic Total
Cebu 480,000 3,000 770,000 1,253,000Boracay 200,000 30,000 220,000 450,000Palawan 50,000 n/a 150,000 2000,000Bohol 45,000 5,000 170,000 220,000Iloilo 40,000 30,000 300,000 370,000Negro Occidental 30,000 15,000 380,000 370,000Negros Oriental 20,000 1,000 135,000 151,000
Source: JBIC 2007 tourism study *figures rounded

19-15
Table 19.3.5-1 shows that the premier destination is Cebu, where its main tourism products are: high quality beaches, dive sites, cultural heritage, among others. These are supplemented by good quality facilities including top-end resorts, located mainly at the island of Mactan. Albeit this note, although transport infrastructure is reasonable there are still some infrastructure facilities and services gaps like utilities, notably access to potable water. This further validates that coastal eco-tourism is the main tourism products in the region. A significant factor believed to contribute in the development of tourism in Central Visayas is the involvement of communities in tourism. Communities are hosts and direct providers of tourism services and local products and goods. Services are in the forms of provision of public transport services, lodging houses and tourism group guidance. Through small and medium enterprises (SMEs), communities provide local native goods and cultural entertainments.
Another positive feature of tourism in the Central Visayas is the promotion of complementing tourism guides either between or among provinces or within the respective provinces. This is notably observed between Cebu and Bohol and in the latter. In this aspect, provision of efficient transport system and the availability of intermodal transport are keys to this feature. Coastal eco-tourism, forest and mountain tourism products and cultural and heritage sites are the main tourism products in the region. This is notably true in Cebu and Bohol. The nautical highway system, notably with the presence of the Roll-on, Roll-off (Ro-Ro) intermodal transport system, is an important ingredient in the development of tourism not only in Central Visayas but in the country. The introduction of the nautical highway system indeed showed the relevance of the former to tourism, where tourists can visit more than one destination. As such, the provision of an efficient highway system is crucial in the accessibility and mobility of tourists in the region. Likewise, from the viewpoint of intermodal transport development, integration of airport and seaport to the road network system is a focal point for the development of tourism in the region.

CHAPTER 2O
PRESENT TRAFFIC CONDITIONS OF METRO CEBU
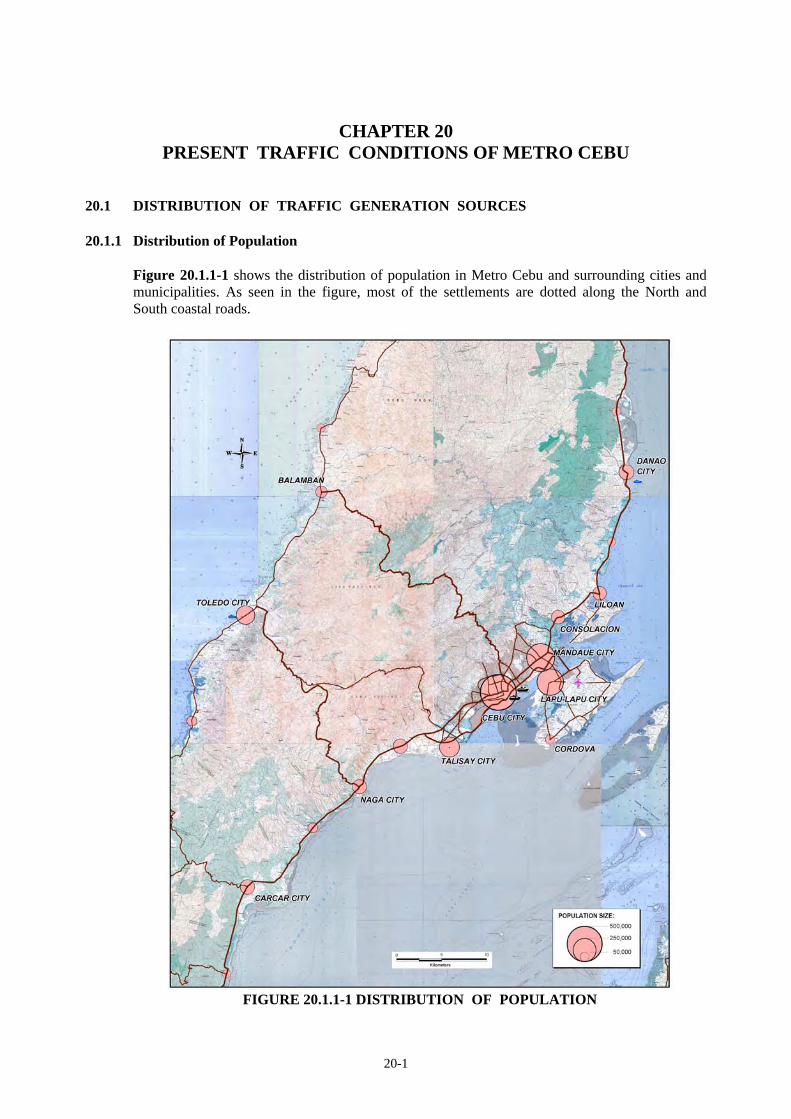
20-1
CHAPTER 20 PRESENT TRAFFIC CONDITIONS OF METRO CEBU
20.1 DISTRIBUTION OF TRAFFIC GENERATION SOURCES 20.1.1 Distribution of Population
Figure 20.1.1-1 shows the distribution of population in Metro Cebu and surrounding cities and municipalities. As seen in the figure, most of the settlements are dotted along the North and South coastal roads.
FIGURE 20.1.1-1 DISTRIBUTION OF POPULATION

20-2
20.1.2 Major Transport Facilities
(1) Ports
There are two (2) ports within the Study Area, namely Cebu Base Port and Danao Port. Number of ship calls and cargo traffic are presented in Table 20.1.2-1 and graphical in Figure 20.1.2.1 and Figure 20.1.2.2 respectively.
TABLE 20.1.2-1 PORT STATISTICS (YEAR 2008)
Cebu Base Port Danao Port
Domestic 68,959 N.A.
Foreign 757 N.A. No. of Ship calls
Total 69,716 N.A.
Domestic 10,700 70
Foreign 3,690 38 Cargo Traffic (1,000 M.T.)
Total 14,390 108
Number of Passengers N.A. N.A. Source: Port Interview by JICA Study Team
FIGURE 20.1.2-1 NUMBER OF SHIP CALLS
Cebu Base
Legends: 50,000 Domestic Foreign

20-3
FIGURE 20.1.2-2 CARGO TRAFFIC
(2) International Airport
There is only one (1) international airport which is Cebu International Airport located in Mactan Island. Airport statistics (such as number of flight, number of passenger and cargo traffic) of the said airport are shown in Table 20.1.2-2 and illustrated in Figure 20.1.2.3, Figure 20.1.2-4, and Figure 20.1.2-5.
TABLE 20.1.2-2 CEBU INTERNATIONAL AIRPORT STATISTICS (2007) Domestic Foreign Total
No. of Flight 12,006 3,692 15,698
No. of Passengers (1,000) 2,778 966 3,774
Cargo Traffic (M.T.) 170,468 91,775 262,243 Source: Airport Interview by JICA Study Team
Cebu Base
Danao P t
Legends: 10,000 ('000MT) Domestic Foreign

20-4
FIGURE 20.1.2-3 NUMBER OF FLIGHTS
FIGURE 20.1.2-4 NUMBER OF PASSENGERS
Cebu International Airport
Legends: 5,000 Domestic Foreign
Cebu International Airport
Legends: 1 Million Domestic Foreign
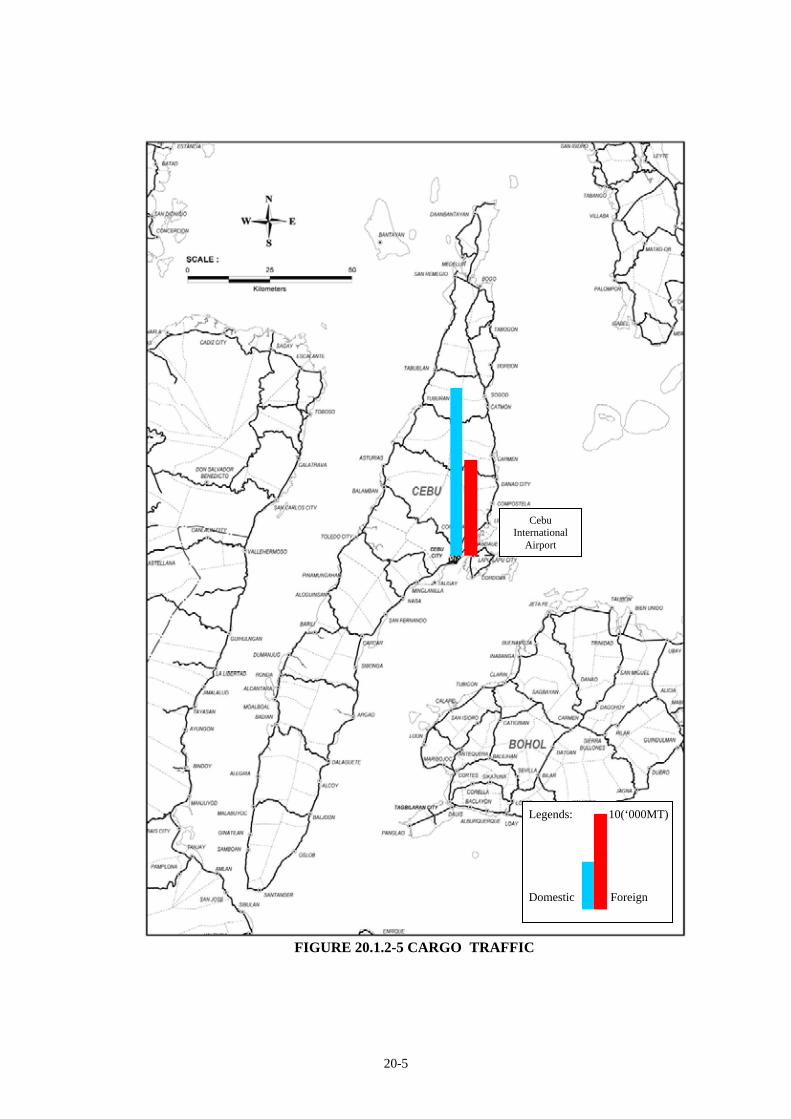
20-5
FIGURE 20.1.2-5 CARGO TRAFFIC
Cebu International
Airport
Legends: 10(‘000MT) Domestic Foreign
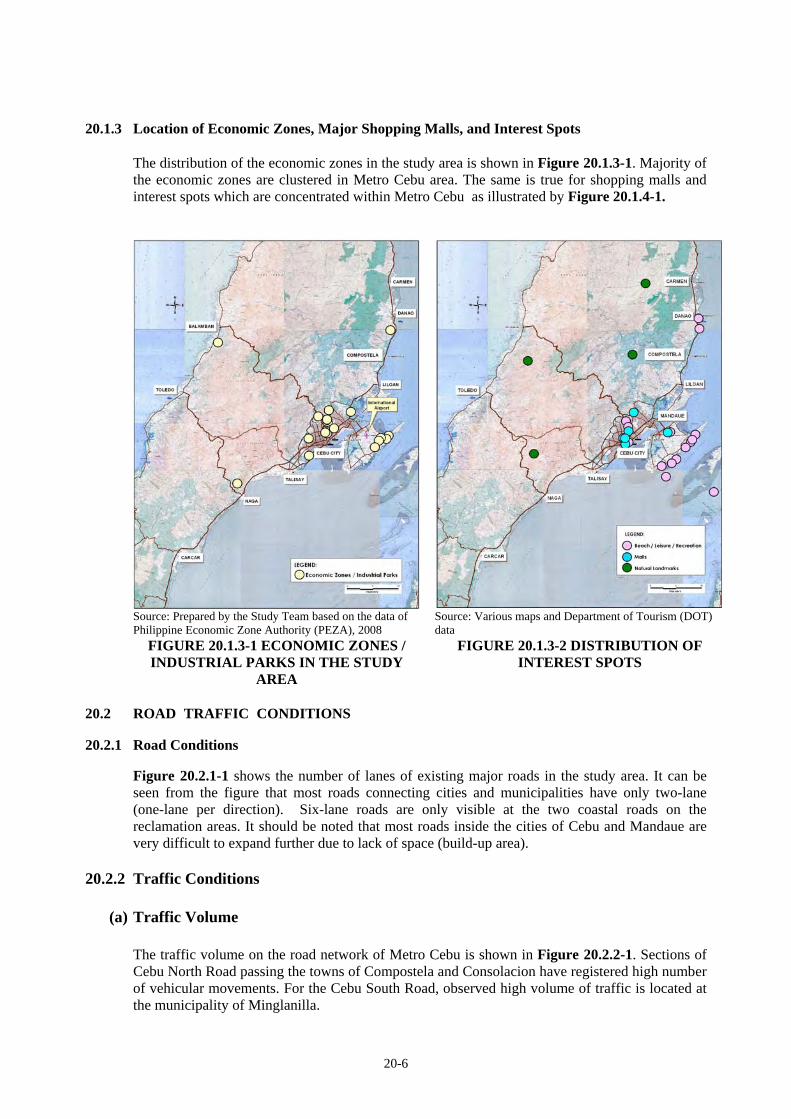
20-6
20.1.3 Location of Economic Zones, Major Shopping Malls, and Interest Spots
The distribution of the economic zones in the study area is shown in Figure 20.1.3-1. Majority of the economic zones are clustered in Metro Cebu area. The same is true for shopping malls and interest spots which are concentrated within Metro Cebu as illustrated by Figure 20.1.4-1.
Source: Prepared by the Study Team based on the data of Philippine Economic Zone Authority (PEZA), 2008
FIGURE 20.1.3-1 ECONOMIC ZONES / INDUSTRIAL PARKS IN THE STUDY
AREA
Source: Various maps and Department of Tourism (DOT) data
FIGURE 20.1.3-2 DISTRIBUTION OF INTEREST SPOTS
20.2 ROAD TRAFFIC CONDITIONS 20.2.1 Road Conditions
Figure 20.2.1-1 shows the number of lanes of existing major roads in the study area. It can be seen from the figure that most roads connecting cities and municipalities have only two-lane (one-lane per direction). Six-lane roads are only visible at the two coastal roads on the reclamation areas. It should be noted that most roads inside the cities of Cebu and Mandaue are very difficult to expand further due to lack of space (build-up area).
20.2.2 Traffic Conditions
(a) Traffic Volume The traffic volume on the road network of Metro Cebu is shown in Figure 20.2.2-1. Sections of Cebu North Road passing the towns of Compostela and Consolacion have registered high number of vehicular movements. For the Cebu South Road, observed high volume of traffic is located at the municipality of Minglanilla.

20-7
Taking into account the traffic inside the cities of Cebu, Mandaue and Lapu-lapu, it is observed that the highest number of traffic is registered at the M. Cuenco Avenue. Aside from being the main access road to Ayala Center, this road is also the main corridor of the upper settlements like Talamban. There is also high traffic volume observed at the two Mactan bridges which can be partly attributed to presence of ecozone and international airport at the Mactan Island.
Source: DPWH Atlas, 2007
FIGURE 20.2.1-1 ROAD’S NUMBER OF LANES
(b) Hourly Variation of Traffic The hourly variation of traffic is presented from Figure 20.2.2-2 to Figure 20.2.2-4 (see Annex 20.1 for the figures of other traffic survey sites). Inside the Mandaue City and Cebu City, it is rather difficult to discern the impact of a particular group – say office worker commuters – due to proximity of their locations. As a result, traffics generated by schools, offices, shopping malls,

20-8
ports and airports tend to mix. This is perhaps the reason on why the normal peak hour in the morning (7AM to 9AM) and afternoon (5PM to 7PM) is not recognizable as shown in hourly variation of traffic taken inside the city (Figure 20.2.2-2, Figure 20.2.2-3 and Figure 20.2.2-4) For the traffics observed at the “gate” of the city, traffic entering the city is higher than those leaving in the morning (7AM to 8PM) indicating that most part of this trip is “to work”. Peak hour of Talisay – Cebu section is from 4PM to 5PM where traffic leaving the city has high number. On the other hand, the Consolacion – Mandue section has their highest observed volume of vehicle from 2PM to 3PM where most of the traffic is entering the city. Traffic leaving Mandaue city turns higher than those entering at 4PM .
FIGURE 20.2.2-1. TRAFFIC VOLUME IN METRO CEBU
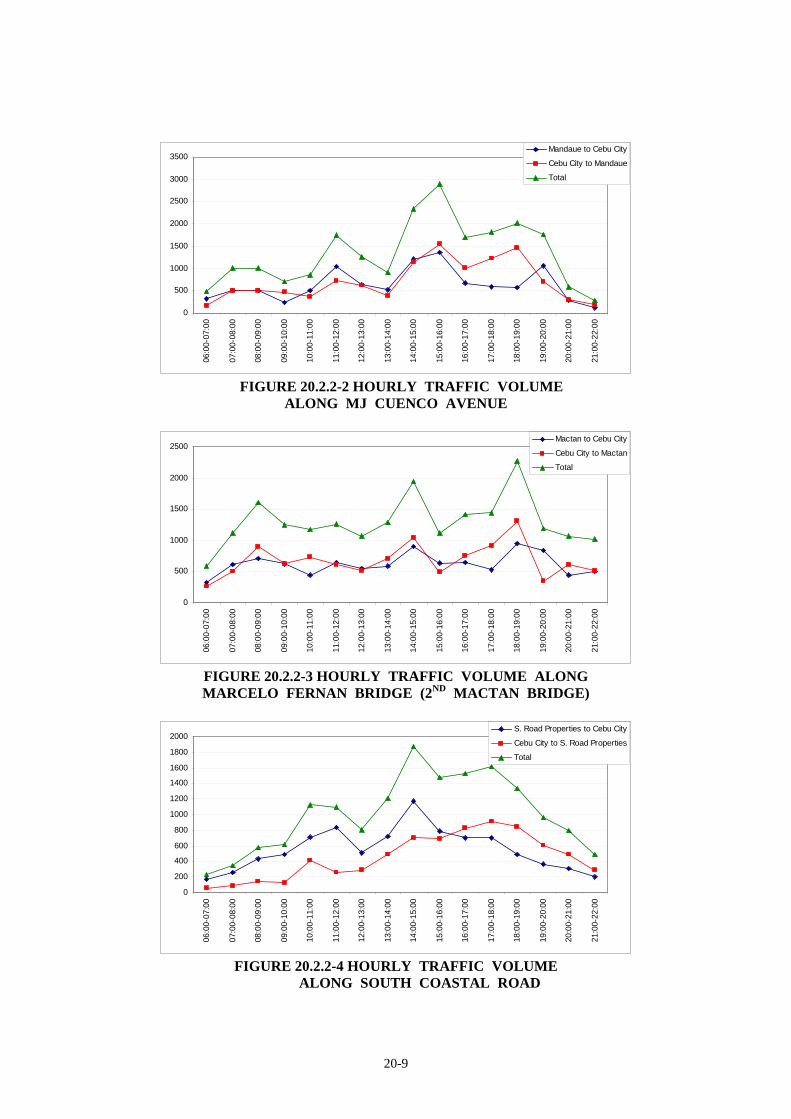
20-9
0
500
1000
1500
2000
2500
3000
3500
06:0
0-07
:00
07:0
0-08
:00
08:0
0-09
:00
09:0
0-10
:00
10:0
0-11
:00
11:0
0-12
:00
12:0
0-13
:00
13:0
0-14
:00
14:0
0-15
:00
15:0
0-16
:00
16:0
0-17
:00
17:0
0-18
:00
18:0
0-19
:00
19:0
0-20
:00
20:0
0-21
:00
21:0
0-22
:00
Mandaue to Cebu City
Cebu City to Mandaue
Total
FIGURE 20.2.2-2 HOURLY TRAFFIC VOLUME
ALONG MJ CUENCO AVENUE
0
500
1000
1500
2000
2500
06:0
0-07
:00
07:0
0-08
:00
08:0
0-09
:00
09:0
0-10
:00
10:0
0-11
:00
11:0
0-12
:00
12:0
0-13
:00
13:0
0-14
:00
14:0
0-15
:00
15:0
0-16
:00
16:0
0-17
:00
17:0
0-18
:00
18:0
0-19
:00
19:0
0-20
:00
20:0
0-21
:00
21:0
0-22
:00
Mactan to Cebu City
Cebu City to Mactan
Total
FIGURE 20.2.2-3 HOURLY TRAFFIC VOLUME ALONG MARCELO FERNAN BRIDGE (2ND MACTAN BRIDGE)
0
200
400
600
800
1000
1200
1400
1600
1800
2000
06:0
0-07
:00
07:0
0-08
:00
08:0
0-09
:00
09:0
0-10
:00
10:0
0-11
:00
11:0
0-12
:00
12:0
0-13
:00
13:0
0-14
:00
14:0
0-15
:00
15:0
0-16
:00
16:0
0-17
:00
17:0
0-18
:00
18:0
0-19
:00
19:0
0-20
:00
20:0
0-21
:00
21:0
0-22
:00
S. Road Properties to Cebu City
Cebu City to S. Road Properties
Total
FIGURE 20.2.2-4 HOURLY TRAFFIC VOLUME
ALONG SOUTH COASTAL ROAD

20-10
(c) Travel Time
The travel times of Cebu North and South Roads are presented in Figure 20.2.2-5. Selected routes inside the cities of Cebu, Mandaue and Lapu-lapu are available in Figure 20.2.2-6. Travel speed on each route is discussed below:
Route 1 – Motorists moving into the direction of Cebu City experienced traffic congestion as soon as they approach the sharp curve where the Liloan church stands. This congestion is experienced until they reach UN Avenue (junction to the 2nd Mactan Bridge). Travel speed per section is as follow: 19.16 km/hr for Liloan church – Liloan and Consolacion boundary, 15.58 km/hr for Liloan and Consolacion boundary - H. Abellana section and 7.01 km/hr for H. Abellana – UN Avenue section. Traffic moving away from Mandaue is again slowed down from the boundary of Cosolacion/Liloan until to the Liloan church.
Route 2 – Travelers of Cebu South Road entering Cebu City are exposed to heavy traffic from the junction of Cebu South Coastal Road until they reached the city center. Likewise, vehicles moving on the opposite direction are not spare with the traffic congestion where travel speed ranges from 15 km/hr to 19 km/hr.
Route 3 – Traffic moving from Lapu-lapu City to Mandaue City and then to Cebu City are experiencing congestion in the following sections: Plaridel St – UN Avenue, AC Cortes Ave. and Gen. Maxilom Ave. – D. Jakosalem St. Vehicles moving into opposite direction have their movement hampered in the following sections: South Road – V. Rama St., Osmena Boulevard – Logarta Ave., AS Fortuna to AC Fortona, and UN Avenue – 2nd Mactan Bridge.
Route 4 – Congested sections of this route are the following (H. Abellan to Pres. Osmena Boulevard): Cebu Country Club – Juan Luan Ave., Arch. Reyes Avenue – Gorodo Ave., Gen. Maxilom St. - Osmena Boulevard, and Colon St. – Plaza Independencia. Congested sections for reverse directions are the following: Plaza Independencia – Osmena Boulevard, Osmena Boulevard – Gen. Maxilom Street. The long stretch from Canduman Road Extention up to the exit to Cebu North road is also having a serious traffic problem where traffic speed is just around 10 km/hr.
Route 5 - Vehicles moving in the direction of Mandaue City are expected to experience slow movement at the following section: Plaridel St. – S. Cabahug St. and Hernan Cortes St. – junction of Gov. M. Cuenco Ave and M.L. Quezon Highway. Moving vehicles to opposite direction would also experience traffic congestions on the same sections.

20-11
30km~40km/hr
Over 40km/hr
L E G E N D
Less than 20km/hr20km ~ 30km/hr
Catmon ‐ Carmen Bdry.
Carmen ‐ Danao Bdry.
Carmen Municipal Road
Danao ‐ Compostela Bdry.
Compostela ‐ Liloan Bdry.
Liloan Church (curve)
Liloan ‐ Consolacion Bdry.
M. Fernan Bridge
H. Abella
Carcar ‐ San Fernando Bdry.
San Fernando ‐ Naga Bdry.
Naga ‐ Toledo Road
Minglanilla ‐ Talisay Bdry.
Talisay FlyoverSouth Road Beginning
Junction Cebu South Coastal Road
Route 1
Route 2
FIGURE 20.2.2-5 TRAVEL SPEED IN METRO CEBU

20-12
End of Runway
2nd Mactan Bridge
Plaridel St.UN Avenue
AC Cortes Ave.
AS Fortuna St.
M. Logarta Ave.
Juan Luna Ave.
Gen. Maxilom Ave.
D. Jakosalem St.Osmena Blvd.
V. Rama St.
Cebu South Road
30km~40km/hrOver 40km/hr
L E G E N D
Less than 20km/hr20km ~ 30km/hr
1st Mactan Bridge
Cebu North Road / H. AbellanaGov. Cunenco Ave. /
ML Quezon Highway
Pres. Osmena Blvd.
Route 3
Route 4
Route 5
FIGURE 20.2.2-6 TRAVEL SPEED IN LAPU-LAPU CITY,
MANDAUE CITY, CEBU CITY 20.2.3 Traffic Demand Management (Metro Cebu)
Metro Cebu, particularly Mandaue City and Cebu City have been experiencing traffic related problems as early as late 80s. Cebu City responded to this problem by creating the Cebu City Traffic Management Coordination Committee (CITOM). The following are traffic demand management measures currently implemented in Metro Cebu: Urban Traffic Control System utilizing the “Sydney Coordinated Adaptive Traffic System” (SCATS)
A total of 68 intersections in Metro Cebu were being signalized for Phase I project, wherein sixty-five (65) intersections are located within Cebu City. In 1993, all intersections and the Traffic Control Center were activated. Presently, there are 80 signalized intersections operating at its optimum level.
Truck Ban
Since the experimental scheme was started on March 9, 2009, large vehicles were banned, from 6 a.m. to 8:30 a.m. and 4 p.m. to 8:30 p.m., from passing through Lopez Jaena Street, M.C. Briones Street, J. Rizal Street along the national highway; U.N. Avenue leading to the Marcelo Fernan Bridge; A.C. Cortes Avenue, J. Briones Street, and Plaridel Street leading to the old Mactan Bridge; and, Ouano Avenue and A. Soriano Street at the Mandaue Reclamation Area.

20-13
Pay Parking To address the need to rationalize the use of the on-street parking in Cebu City, the
Sangguniang Panlungsod institutionalized Pay Parking in 1988. Since parking meters equipment is expensive, parking aides were hired by the city. At present, there are one hundred (100) parking aides employed by the City for this purpose. Pay Parking is also implemented in Lapu-lapu City since 2005.
Establishment of Public Transport Terminals
Cebu South Bus Terminal (CSBT), 1992 Cebu North Bus Terminal, 1994
Ordinance on Designation of Travel Lines for Public Transport Vehicles
Enactment of local ordinances on “travel lines” for public utility vehicles traveling in Cebu City and Lapu-lapu City.
20.3 FREIGHT MOVEMENT AND LOGISTIC CORRIDORS 20.3.1 Port/Airport Related Freight Movement
The truck OD survey was carried-out at the international ports and a lone airport. Based on the survey results, desire line map was prepared as shown in Figure 20.3.1-1 (see Annex 20.2 for individual desire line of port and airport). The major freight movements are between; ● Cebu City – Mandaue City ● Cebu City – Lapu-Lapu City ● Cebu City – Talisay City ● Cebu City – Naga City
FIGURE 20.3.1-1 FREIGHT MOVEMENT RELATED TO CEBU PORTS AND AIRPORT
(Trucks) 0 300 500
Total; 3992 Trucks

20-14
20.3.2 Logistic Corridors of Economic-zones
Three (3) Eco-zones are located around Cebu International Airport in Mactan Island. Location of Eco-zones and their logistics routes are shown in Figure 20.3.2-1. Freight movement is rather simple - from Eco-zone to either Cebu Port or Cebu International Airport. There are two (2) bridges connecting Cebu Island and Mactan Island. Most trucks use the First Mandaue-Mactan Bridge (2-lane bridge). Although the Second Mandaue-Mactan Bridge has 4-lanes, it is not frequently used by trucks.
LEGEND
Incoming to Ecozones
Outgoing from Ecozones
Ecozones in Cebu
Sea Port
Airport
MACTAN EXPORT PROCESSING ZONE I
AREA (ha) 150
NO. LOCATORS 102
MACTAN EXPORT PROCESSING ZONE II
AREA (ha) 63
NO. LOCATORS 45
CEBU LIGHT INDUSTRIAL PARK
AREA (ha) 60
NO. LOCATORS 10
% Share of Finished Products Using this Cebu International Port
Ecozone % of Products MEPZ I 100 MEPZ II 100 Cebu Light
% Share of Finished Products Using this Cebu International AirPort
Ecozone % of Products MEPZ I 100 MEPZ II 10-100 Cebu Light
FIGURE 20.3.2-1 ECONOMIC ZONES INTERVIEWED IN CEBU AREA

20-15
20.3.3 Comments on Problems Made by Economic-zones Locators
The problems identified by interviewed ecozones, manufacturing companies and trucking companies related to transportation are summarized below: Poor traffic management right outside the Mactan Export Processing Zone (MEPZ) area.
Traffic congestions due to limited capacity of the road networks
Narrow roads within city proper which easily build up heavy traffic.
Heavy traffic is encountered at MEPZ Gate 3 that causes delay in route to airport.
Generally, road transportation capacity is sufficient but tends to congest during early morning
hours when commuters report to work.
Quality of transportation needs upgrading. Multicabs are not safe for open highway use so they should not be allowed to operate. Tricycles also congest narrow streets which causes traffic problem.
One of our market is Europe and currently there is only limited flights to Europe
Unloading of cargoes inside the port takes time due to other port activities.
Access road leading to the factory is narrow and congested.
Electrical wires in some sections of the road are very low which affect our transportation of cargoes.
Port area is usually crowded of other trucking services which could jeopardize safety considering the danger of petroleum products.
Truck ban imposition hampers hauling operation. This cause delay on the delivery of our cargoes.
Roads are mostly not well-maintained and pot holes are abundant especially on the national roads

CHAPTER 21
FUTURE SOCIO-ECONOMIC FRAMEWOK AND REGIONAL DEVELOPMENT SCENARIO
OF METRO CEBU

21-1
CHAPTER 21 FUTURE SOCIO-ECONOMIC FRAMEWORK
AND REGIONAL DEVELOPMENT SCENARIO OF METRO CEBU 21.1 FUTURE SOCIO-ECONOMIC FRAMEWORK 21.1.1 Future Population
The same methodology as described in Section 10.1.1 was adopted. Population growth rate adopted is shown in Figure 21.1.1-1, and projected population is shown in Table 21.1.1-1.
TABLE 21.1.1-1 POPULATION PROJECTION: REGION VII (thousands)
2009 2010 2015 2020 2025 2030
92,171 94,024 103,201 112,276 121,013 129,213 1.40Region 7 Central Visayas 6,611 6,711 7,245 7,792 8,346 8,904 1.35
BOHOL 1,256 1,266 1,320 1,370 1,416 1,455 1.16
CEBU 2,525 2,569 2,795 3,034 3,284 3,547 1.40
NEGROS ORIENTAL 1,262 1,275 1,343 1,408 1,469 1,525 1.21
SIQUIJOR 89 90 94 97 100 103 1.15
Cebu City 823 835 900 969 1,042 1,119 1.36
Lapu-lapu City 316 329 391 453 513 566 1.79
Mandaue City 338 348 401 460 523 589 1.75Source: JICA Study Team.
City
Population Projection Region/Province
Philippines
2030/2009
Province
21.1.2 Economic Framework
Discussed in Section 10.1.2 of Chapter 10.
21.1.3 Employment at Job Site
The same methodology as described in Section 10.1.3 of Chapter 10 was adopted. Projected employment at job site is shown in Table 21.1.3-1.
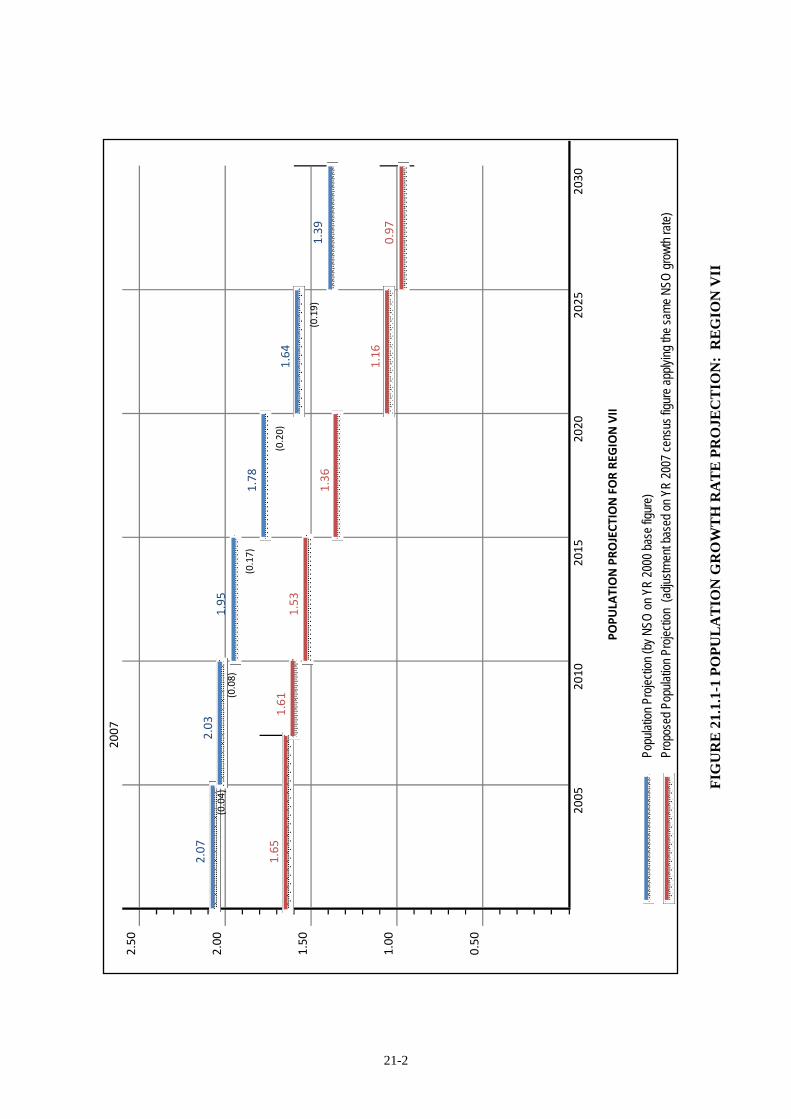
21-2
2.50
2.00
1.50
1.00
0.50
Popu
lation
Pro
jectio
n (by
NSO
on Y
R 20
00 ba
se fig
ure)
Prop
osed
Pop
ulatio
n Pro
jectio
n (a
djustm
ent b
ased
on Y
R 20
07 ce
nsus
figur
e app
lying
the s
ame N
SO gr
owth
rate)
POPU
LATION PRO
JECT
ION FOR RE
GION VII
2005
2010
2015
2020
2025
2030
2007
(0.04)
1.65
2.07
1.61
1.53
1.36
1.16
0.97
2.03
1.95
1.78
1.64
1.39
(0.08)
(0.17)
(0.20)
(0.19)
FIG
UR
E 2
1.1.
1-1
POPU
LA
TIO
N G
RO
WT
H R
AT
E P
RO
JEC
TIO
N:
RE
GIO
N V
II

21-3
TABLE 21.1.3-1 PROJECTED EMPLOYMENT AT JOB SITE: REGION VII
2009 2010 2015 2020 2025 2030PHILIPPINES 22,881 23,443 26,524 29,645 32,730 35,696 1.56Region 7 CENTRAL VISAYAS 1,866 1,917 2,235 2,556 2,874 3,161 1.69
BOHOL 114 117 139 158 175 190 1.67 CEBU 1,566 1,613 1,886 2,164 2,440 2,973 1.90 NEGROS ORIENTAL 177 182 206 233 259 281 1.59 SIQUIJOR 9 8 9 8 9 9 1.02
CEBU CITY (Capital) 494 508 595 683 772 853 1.73 LAPU-LAPU CITY (OPON) 164 169 198 227 255 281 1.71 MANDAUE CITY 174 179 209 239 270 298 1.71
Employment Projection (thousands) 2030/2009Region/City/Municipality
City
Province
Source: JICA Study Team
21-4
21.2 REGIONAL DEVELOPMENT SCENARIO 21.2.1 Trends and Directions of Regional Development
Chapter 19 showed the current land use and regional development of Region VII, particularly Metro Cebu. Given the present trend and shown by the economic indicators in Chapter 19, there will be no major deviation in the direction of regional development in Region VI. The region will continue to be the premier driving force in Central Philippines in terms in economic growth. Regional efforts will still be focused on improving the economic services and infrastructure support to enhance the driving forces of regional development. Improvement of the level of services of the region’s infrastructure facilities, notably in the transport system, will continue. Likewise, strengthening of the tourism services and improvement of facilities is seen to be a fundamental in the comprehensive planning of the region.
21.2.2 Regional Development Scenario
Characteristics of Metro Cebu can be summarized as follows: ● Metro Cebu has been developed at the narrow coastal plain. Topographical constraints force
the concentration of socio-economic activities at the narrow coastal area. ● Metro Cebu is the hub of people and cargo transportation not only of the Visayas Regions but
also of the country as well as international transportation being situated at the center of the Philippines.
● Metro Cebu is the core area for business, commercial and industrial development of the
Central Philippines. ● With the plentiful tourist attraction resources, Metro Cebu is the core area for the tourism
development. Based on the above characteristics of Metro Cebu, the development strategy was established as shown in Figure 21.2.2-1. ● Metro Cebu, particularly Cebu City, Mandaue City, Lapu-Lapu City and Talisay City shall
grow as the business, commercial and industrial core of the Central Philippines. ● The function of international and domestic transportation hub shall be further strengthened.

21-5
FIGURE 21.2.2-1 DEVELOPMENT STRATEGY: METRO CEBU

CHAPTER 22
FUTURE TRAFFIC DEMAND FORECAST FOR METRO CEBU

22-1
CHAPTER 22 FUTURE TRAFFIC DEMAND FORECAST FOR METRO CEBU
22.1 ANALYSES OF TRAFFIC SURVEY RESULTS
This chapter describes the OD survey results. Other survey results were discussed in Chapter 20.
22.1.1 Traffic Characteristics
(1) General
Roadside OD survey was conducted at six (6) stations. A number of samples and sample rate is shown in Table 22.1-1.
TABLE 22.1-1 ROADSIDE OD SURVEY STATION AND SAMPLE RATE No. Road Name Location No. of
Sample AADT Sample Rate
1 Cebu North Road Near Carmen Port 1267 5307 23.9%2 Cebu North Road Liloan & Consolacion 2216 27677 8.0%3 Quezon National Near 2nd Mactan 2956 52822 5.2%4 Cebu South Road Cebu & Talisay 2856 36594 7.8%5 Naga-Toledo Road Naga & Toledo 1623 4310 37.7%6 Cebu South Road Carcar & Silonga 960 3554 27.0%
Average 1946 21710 9.0%
(2) Traffic by Trip Purpose
Trip purpose is estimated through the OD data as illustrated in Figure 22.1.1-1. Of the total car trips 41% were ‘Private’ trips, 30% were ‘Business’ trips.
To/From Work6%
To/From School0%
Private41%
Leisure/Tourism2%
Others21%
Business30%
FIGURE 22.1.1-1 TRIP PURPOSE

22-2
(3) Average Number of Passengers by Vehicle Category
Vehicle OD is linked to passenger OD through the average number of passenger on board by type of vehicles as the vehicle occupancy rate. Table 22.1.1-2 shows the average number of passenger on board by type of vehicles.
TABLE 22.1.1-2 AVERAGE NUMBER OF PASSENGERS BY VEHICLE
CATEGORY AND BY ROAD (Person/vehicle, including Driver)
Station Car/ Taxi/ Van
Jeepney Mini-bus
Large Bus
2-Axle Truck
3-Axle Truck
Truck- Trailer
Delivery Van
Cebu North Rd. Near Carmen Port 4.0 6.5 26.6 38.3 3.7 2.6 3.5 2.7
Cebu North Rd. Liloan & Consolacion 3.3 8.6 28.3 50.1 3.4 2.7 3.1 2.4
Quezon National Near 2nd Mactan, 3.0 7.2 9.3 14.0 2.9 2.5 2.3 2.2
Cebu South Rd. Cebu & Talisay 3.2 7.4 26.4 43.8 3.6 2.7 2.6 2.8
Naga-Toledo Rd. Naga & Toledo 4.1 9.5 46.3 44.1 2.9 2.7 2.7 2.4
Cebu South Rd. Carcar & Sibonga 4.1 8.9 23.8 41.8 4.3 2.7 3.2 2.3
Average 3.6 7.6 26.6 42.4 3.4 2.6 3.1 2.5 The survey results of 3.6 passengers for Car and 7.6 passengers for Jeepney, 34.3 passengers for Bus are used in this study (see Table 22.1.1-3).
TABLE 22.1.1-3 AVERAGE NUMBER OF PASSENGERS ON BOARD BY VEHICLE CATEGORY
Vehicle Category Type of Vehicles Average No. of
Passengers (Person / veh.)
Car Car/Taxi/Van 3.6 Jeepney Jeepney 7.6
Bus Mini-Bus, Large-Bus 34.3
Truck 2-Axle Truck, 3-Axle Truck, Truck-Trailer, Delivery Van 3.0
(4) Traffic Type of Commodity
Three representative commodity items were selected in this study. They are Agri./ Fishery / Forestry Sectors, Mining/Construction Sectors, and Manufacturing Sectors. Others commodities not included in the first two categories are considered to include in the third. The results of total commodity volume by road are summarized in Table 22.1.1-4.

22-3
TABLE 22.1.1-4 TRAFFIC BY COMMODITY TYPE BY ROAD (ton/day)
Station Agri./ Fishery / Forestry
Mining/ Construction Manufacturing Total
1. Cebu North Rd. Near Carmen Port 545,757 90,214 324,827 960,798
2. Cebu North Rd. Liloan & Consolacion 1,245,730 243,930 316,780 1,806,440
3. Quezon National Near 2nd Mactan, 48,251 126,654 410 175,315
4. Cebu South Rd. Cebu & Talisay 194,083 - 19,315 213,398
5. Naga-Toledo Rd. Naga & Toledo 240,437 503,576 229,800 973,813
6. Cebu South Rd. Carcar & Sibonga 598,265 201,360 40,800 840,425
Total 2,872,522 1,165,734 931,932 4,970,188 Share (%) 49.4% 34.6% 16.0% 100.0%
(5) Average Loading by Type of Truck
Vehicle OD is linked to commodity OD through the average weight loaded by type of truck. Table 22.1.1-5 shows the average weight loaded by type of truck.
TABLE 22.1.1-5 AVERAGE LOADING BY TYPE OF TRUCK
(unit;kg)
Agri./
Fishery / Forestry
Mining/ Construction Manufacturing Gross Average
Loading* Net Average Loading**
2-AXLE TRUCK 4,499 7,146 1,236 4,415 2,055 3-AXLE TRUCK 14,260 13,491 15,704 14,363 5,961
TRUCK-TRAILER 12,666 12,778 9,386 11,920 4,883 DELIVERY VAN 3,466 1,000 4,330 3,679 1,266 Weighted Mean
TRUCK 8,088 11,217 8,177 8,654 3,600
* Empty trucks are excluded. ** Empty trucks are included.
The average loaded volume by 2-AXLE TRUCK is 2.1 tons, by 3-AXLE TRUCK 6.0 tons, by Trailer 4.9 tons and by Delivery Van 1.3 tons. The survey results, 3.6 tons for truck, are used in this study.
22.1.2 Present OD Table
(1) Procedure of Estimating the Present OD Tables
(a) The maximum entropy method was applied to obtain the OD tables of aggregated 4 vehicle
types. For the application of the maximum entropy method, it is necessary to utilize the traffic volumes by type of vehicle crossing the zones of the network.
(b) The traffic volumes crossing zone border were obtained from the traffic counting survey results
and supplemented by DPWH survey records.

22-4
(c) Under the process described above, the maximum entropy method was applied and the OD tables by vehicle category (Car, Jeepney, Bus and Truck) were produced. All Vehicle OD, Passenger car (including Jeepney and Bus) OD and Truck OD (large zone) are shown in Tables 22.1.2-1, 22.1.2-2 and 22.1.2-3.
(d) The average vehicle passenger occupancy rates and loading rates by commodity category
obtained from the roadside interview survey were then applied to each OD pair by vehicle classification, and the passengers and commodity for the OD pairs were obtained.
(e) Passenger OD of large zoning is shown in Table 22.1.2-4 and total commodity trips in Table
22.1.2-5.
(f) For the examination of the accuracy of OD tables, the established All vehicle OD was assigned on the present road network. Figure 22.1.2-1 shows the traffic volumes which resulted through traffic assignment procedure of the OD tables in the road network. The differences between surveyed traffic volumes and assigned volumes are presented in Figures 22.1.2-2. The assigned volumes in this manner show good consistency to the observed traffic.
(2) OD Tables and Traffic Flow
The concluded OD trips are presented in tables and the corresponding traffic flow is shown in figures. All of OD tables were obtained on small zoning base, and aggregated to large zoning base. Traffic zoning system is shown in Table 22.2.1-1. ODs trips presented in the report are those of All vehicles, Passenger Car, Truck and each of them is assigned graphically on the road network as traffic flow.
TABLE 22.1.2-1 ALL VEHICLES OD (LARGE ZONES)
(Vehicle) CEBUCITY
(Central)
CEBUCITY
(South)
CEBUCITY
(North)
CEBUCITY
(West)
LAPU-LAPUCITY
CORDOBA
CITY OFTALISAY
MINGLANILLA
CITY OFNAGA
MANDAUE CITY
CONSOLACION LILOAN COMPO
STELADANAO
CITY
CITY OFCARCA
R
Outsideof Metro
CebuTotal
CEBU CITY (Central) 17,371 10,194 36,951 1,025 4,327 37 5,131 3,769 1,495 5,322 1,543 1,513 586 403 767 3,001 93,435CEBU CITY (South) 12,149 4,113 4,186 163 1,110 201 4,960 2,228 2,662 2,611 121 141 7 58 259 323 35,292CEBU CITY (North) 14,624 8,837 3,827 39 1,712 17 896 579 237 1,357 101 582 35 92 102 394 33,431CEBU CITY (West) 128 147 23 371 504 11 93 69 150 125 28 84 0 4 4 258 1,999LAPU-LAPU CITY 8,022 1,003 2,700 1,492 39,706 1,458 644 606 303 13,001 2,604 831 46 278 64 703 73,461CORDOBA 45 14 17 7 907 557 39 13 203 229 91 4 0 0 0 0 2,126CITY OF TALISAY 6,263 4,096 1,096 159 532 33 3,441 353 1,134 684 85 73 0 0 84 259 18,292MINGLANILLA 4,620 1,881 474 63 494 11 301 1,660 489 213 183 74 1 2 0 142 10,608CITY OF NAGA 975 2,639 206 110 382 193 695 480 5,702 452 41 55 2 10 32 200 12,174MANDAUE CITY 5,798 2,474 1,419 153 12,312 205 667 449 624 20,541 2,701 3,376 236 525 47 1,152 52,679CONSOLACION 1,518 38 271 41 2,372 73 55 44 37 3,106 937 1,255 246 47 35 155 10,230LILOAN 1,378 127 304 85 1,555 1 28 107 54 3,898 1,386 1,061 1 72 42 163 10,262COMPOSTELA 233 1 179 5 121 0 37 1 6 492 100 3 141 0 0 43 1,362DANAO CITY 619 29 86 24 245 0 10 6 1 565 14 0 0 8 0 372 1,979CITY OF CARCAR 510 139 64 44 0 0 86 0 26 35 2 7 0 1 83 391 1,388Outside of Metro Cebu 2,376 609 451 265 442 0 288 194 210 1,103 118 117 52 574 563 1,260 8,622Total 76,629 36,341 52,254 4,046 66,721 2,797 17,371 10,558 13,333 53,734 10,055 9,176 1,353 2,074 2,082 8,816 367,340
TABLE 22.1.2-2 PASSENGER CAR (INCLUDING JEEPNEY & BUS) OD (LARGE ZONES)
(Vehicle) CEBUCITY
(Central)
CEBUCITY
(South)
CEBUCITY
(North)
CEBUCITY
(West)
LAPU-LAPUCITY
CORDOBA
CITY OFTALISAY
MINGLANILLA
CITY OFNAGA
MANDAUE CITY
CONSOLACION LILOAN COMPO
STELADANAO
CITY
CITY OFCARCA
R
Outsideof Metro
CebuTotal
CEBU CITY (Central) 15,838 9,815 36,560 1,023 4,034 37 4,367 2,884 1,300 4,255 1,371 1,427 558 371 754 2,706 87,300CEBU CITY (South) 11,751 3,789 4,182 158 1,048 184 4,854 2,203 2,632 2,178 120 141 2 58 256 287 33,843CEBU CITY (North) 14,074 8,823 3,388 35 1,668 17 860 544 220 1,155 90 539 34 85 102 328 31,962CEBU CITY (West) 122 143 21 342 498 11 84 67 133 111 24 84 0 0 4 215 1,859LAPU-LAPU CITY 7,655 949 2,628 1,440 38,070 1,419 594 553 283 11,900 2,384 717 25 258 64 619 69,558CORDOBA 44 14 17 7 877 499 39 13 180 226 89 4 0 0 0 0 2,009CITY OF TALISAY 5,686 3,992 1,069 142 528 33 3,348 339 1,054 625 83 73 0 0 84 176 17,232MINGLANILLA 3,482 1,847 468 63 443 11 294 1,479 256 209 174 58 1 0 0 77 8,862CITY OF NAGA 751 2,615 195 101 346 172 569 296 5,122 409 41 45 2 0 11 138 10,813MANDAUE CITY 4,497 2,123 1,318 136 11,449 203 587 442 602 18,310 2,128 3,052 200 459 34 818 46,358CONSOLACION 1,315 30 270 17 2,188 72 48 44 33 2,375 840 1,153 246 36 35 99 8,801LILOAN 1,250 126 267 85 1,456 1 20 95 37 3,489 1,185 977 0 67 42 110 9,207COMPOSTELA 188 1 158 0 105 0 37 1 1 430 100 0 128 0 0 33 1,182DANAO CITY 577 24 82 24 206 0 0 0 0 462 0 0 0 8 0 323 1,706CITY OF CARCAR 502 135 64 44 0 0 86 0 17 31 0 0 0 0 69 305 1,253Outside of Metro Cebu 2,049 518 381 228 362 0 159 162 136 685 71 74 48 522 490 1,133 7,018Total 69,781 34,944 51,068 3,845 63,278 2,659 15,946 9,122 12,006 46,850 8,700 8,344 1,244 1,864 1,945 7,367 338,963

22-5
TABLE 22.1.2-3 TRUCK OD (LARGE ZONES) (Vehicle)
CEBUCITY
(Central)
CEBUCITY
(South)
CEBUCITY
(North)
CEBUCITY
(West)
LAPU-LAPUCITY
CORDOBA
CITY OFTALISAY
MINGLANILLA
CITY OFNAGA
MANDAUE CITY
CONSOLACION LILOAN COMPO
STELADANAO
CITY
CITY OFCARCA
R
Outsideof Metro
CebuTotal
CEBU CITY (Central) 1,533 379 391 2 293 0 764 885 195 1,067 172 86 28 32 13 295 6,135CEBU CITY (South) 398 324 4 5 62 17 106 25 30 433 1 0 5 0 3 36 1,449CEBU CITY (North) 550 14 439 4 44 0 36 35 17 202 11 43 1 7 0 66 1,469CEBU CITY (West) 6 4 2 29 6 0 9 2 17 14 4 0 0 4 0 43 140LAPU-LAPU CITY 367 54 72 52 1,636 39 50 53 20 1,101 220 114 21 20 0 84 3,903CORDOBA 1 0 0 0 30 58 0 0 23 3 2 0 0 0 0 0 117CITY OF TALISAY 577 104 27 17 4 0 93 14 80 59 2 0 0 0 0 83 1,060MINGLANILLA 1,138 34 6 0 51 0 7 181 233 4 9 16 0 2 0 65 1,746CITY OF NAGA 224 24 11 9 36 21 126 184 580 43 0 10 0 10 21 62 1,361MANDAUE CITY 1,301 351 101 17 863 2 80 7 22 2,231 573 324 36 66 13 334 6,321CONSOLACION 203 8 1 24 184 1 7 0 4 731 97 102 0 11 0 56 1,429LILOAN 128 1 37 0 99 0 8 12 17 409 201 84 1 5 0 53 1,055COMPOSTELA 45 0 21 5 16 0 0 0 5 62 0 3 13 0 0 10 180DANAO CITY 42 5 4 0 39 0 10 6 1 103 14 0 0 0 0 49 273CITY OF CARCAR 8 4 0 0 0 0 0 0 9 4 2 7 0 1 14 86 135Outside of Metro Cebu 327 91 70 37 80 0 129 32 74 418 47 43 4 52 73 127 1,604Total 6,848 1,397 1,186 201 3,443 138 1,425 1,436 1,327 6,884 1,355 832 109 210 137 1,449 28,377
FIGURE 22.1.2-1 PRESENT TRAFFIC FLOW (YEAR 2009)

22-6
TABLE 22.1.2-4 PASSENGER OD (LARGE ZONES) (Person)
CEBUCITY
(Central)
CEBUCITY
(South)
CEBUCITY
(North)
CEBUCITY
(West)
LAPU-LAPUCITY
CORDOBA
CITY OFTALISAY
MINGLANILLA
CITY OFNAGA
MANDAUE CITY
CONSOLACION LILOAN COMPO
STELADANAO
CITY
CITY OFCARCA
R
Outsideof Metro
CebuTotal
CEBU CITY (Central) 88,176 72,514 197,730 7,250 15,774 161 21,768 11,862 7,175 21,541 6,714 9,098 3,564 3,019 15,209 48,982 530,537CEBU CITY (South) 80,765 22,644 26,464 1,328 4,169 662 26,119 14,901 18,611 10,260 468 524 7 209 1,538 1,249 209,918CEBU CITY (North) 73,278 47,900 16,194 326 6,569 97 3,547 2,210 932 5,714 364 2,908 122 306 367 1,469 162,305CEBU CITY (West) 814 1,521 92 2,254 2,081 52 350 265 487 408 217 429 0 0 14 2,257 11,241LAPU-LAPU CITY 36,606 3,548 10,574 7,016 229,904 8,966 2,146 2,035 1,047 60,948 13,376 4,613 94 1,197 230 3,033 385,333CORDOBA 194 50 89 25 5,402 2,577 140 47 648 942 344 14 0 0 0 0 10,473CITY OF TALISAY 32,742 23,806 5,367 855 2,081 119 27,345 2,796 7,039 2,845 299 263 0 0 606 678 106,841MINGLANILLA 13,177 11,376 2,257 231 1,635 40 2,615 11,074 1,036 756 1,026 209 4 0 0 277 45,713CITY OF NAGA 3,652 17,627 714 449 1,270 619 2,897 1,192 31,921 1,480 148 162 7 0 40 1,396 63,574MANDAUE CITY 23,423 10,393 6,297 510 62,694 955 2,121 2,219 3,435 86,018 18,259 18,555 1,032 2,814 122 13,628 252,476CONSOLACION 7,412 140 1,632 131 12,278 259 173 158 119 17,732 4,748 4,459 1,082 130 126 380 50,958LILOAN 6,016 462 1,353 433 8,812 4 72 342 133 20,112 5,281 4,873 0 509 151 1,410 49,962COMPOSTELA 1,196 4 1,201 0 382 0 133 4 4 2,776 360 0 590 0 0 119 6,767DANAO CITY 3,208 86 295 86 742 0 0 0 0 2,623 0 0 0 45 0 1,587 8,672CITY OF CARCAR 8,913 642 230 158 0 0 654 0 93 449 0 0 0 0 1,151 2,363 14,654Outside of Metro Cebu 26,288 2,196 1,756 3,141 2,050 0 600 599 538 4,733 256 620 189 2,519 2,228 8,968 56,680Total 405,860 214,907 272,245 24,193 355,842 14,510 90,682 49,705 73,217 239,338 51,859 46,726 6,691 10,747 21,783 87,796 1,966,102
TABLE 22.1.2-5 COMMODITY OD (LARGE ZONES)
(Tons) CEBUCITY
(Central)
CEBUCITY
(South)
CEBUCITY
(North)
CEBUCITY
(West)
LAPU-LAPUCITY
CORDOBA
CITY OFTALISAY
MINGLANILLA
CITY OFNAGA
MANDAUE CITY
CONSOLACION LILOAN COMPO
STELADANAO
CITY
CITY OFCARCA
R
Outsideof Metro
CebuTotal
CEBU CITY (Central) 5,519 1,364 1,408 7 1,055 0 2,750 3,186 702 3,841 619 310 101 115 47 1,062 22,086CEBU CITY (South) 1,433 1,166 14 18 223 61 382 90 108 1,559 4 0 18 0 11 130 5,216CEBU CITY (North) 1,980 50 1,580 14 158 0 130 126 61 727 40 155 4 25 0 238 5,288CEBU CITY (West) 22 14 7 104 22 0 32 7 61 50 14 0 0 14 0 155 504LAPU-LAPU CITY 1,321 194 259 187 5,890 140 180 191 72 3,964 792 410 76 72 0 302 14,051CORDOBA 4 0 0 0 108 209 0 0 83 11 7 0 0 0 0 0 421CITY OF TALISAY 2,077 374 97 61 14 0 335 50 288 212 7 0 0 0 0 299 3,816MINGLANILLA 4,097 122 22 0 184 0 25 652 839 14 32 58 0 7 0 234 6,286CITY OF NAGA 806 86 40 32 130 76 454 662 2,088 155 0 36 0 36 76 223 4,900MANDAUE CITY 4,684 1,264 364 61 3,107 7 288 25 79 8,032 2,063 1,166 130 238 47 1,202 22,756CONSOLACION 731 29 4 86 662 4 25 0 14 2,632 349 367 0 40 0 202 5,144LILOAN 461 4 133 0 356 0 29 43 61 1,472 724 302 4 18 0 191 3,798COMPOSTELA 162 0 76 18 58 0 0 0 18 223 0 11 47 0 0 36 648DANAO CITY 151 18 14 0 140 0 36 22 4 371 50 0 0 0 0 176 983CITY OF CARCAR 29 14 0 0 0 0 0 0 32 14 7 25 0 4 50 310 486Outside of Metro Cebu 1,177 328 252 133 288 0 464 115 266 1,505 169 155 14 187 263 457 5,774Total 24,653 5,029 4,270 724 12,395 497 5,130 5,170 4,777 24,782 4,878 2,995 392 756 493 5,216 102,157
FIGURE 22.1.2-2 ASSIGNED AND OBSERVED TRIPS
0
10,000
20,000
30,000
40,000
50,000
60,000
70,000
0 10,000 20,000 30,000 40,000 50,000 60,000 70,000
Assigned Trips(PCU/day)
Obs
erv
ed
Tri
ps(P
CU
/da
y)
R2=0.984

22-7
22.1.3 Desire Line
Desire line of all vehicles, Passenger Car, Public Transport (Jeepney and Bus) and Truck are illustrated in Figure 22.1.3-1.
All Vehicles
Passenger Car
Jeepney and Bus
Truck
FIGURE 22.1.3-1 DESIRE LINE (YEAR 2009)
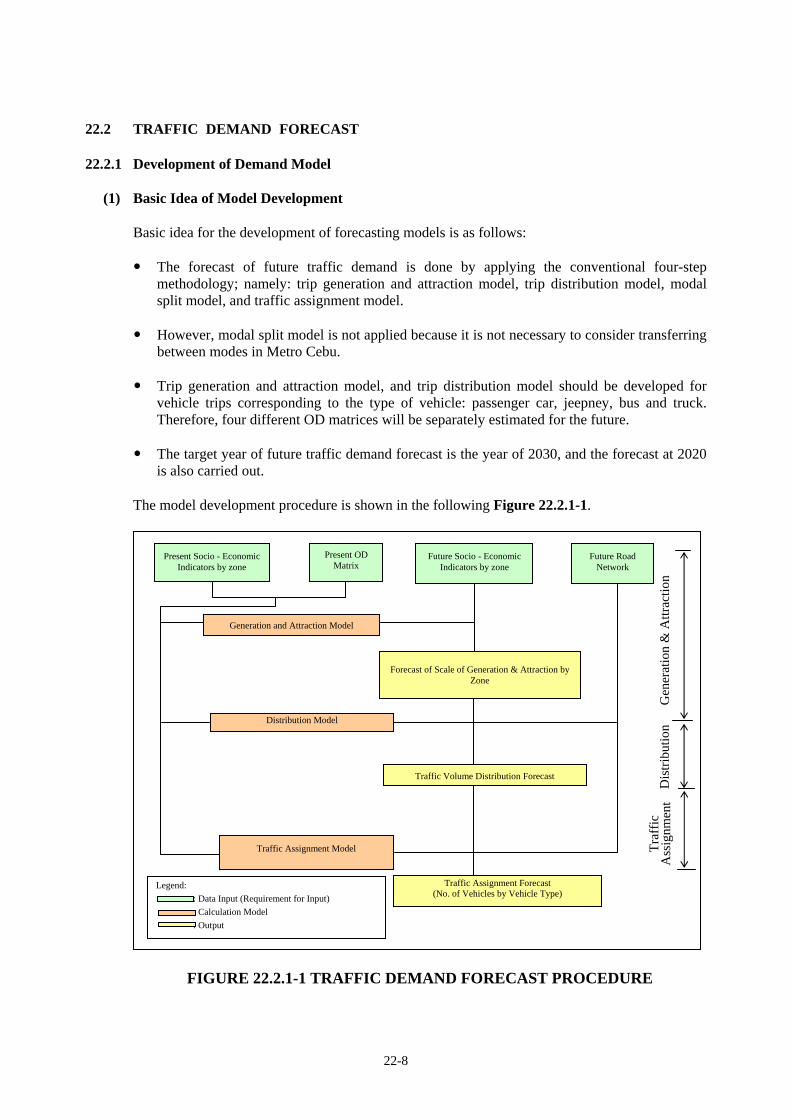
22-8
22.2 TRAFFIC DEMAND FORECAST 22.2.1 Development of Demand Model
(1) Basic Idea of Model Development
Basic idea for the development of forecasting models is as follows:
The forecast of future traffic demand is done by applying the conventional four-step
methodology; namely: trip generation and attraction model, trip distribution model, modal split model, and traffic assignment model.
However, modal split model is not applied because it is not necessary to consider transferring
between modes in Metro Cebu. Trip generation and attraction model, and trip distribution model should be developed for
vehicle trips corresponding to the type of vehicle: passenger car, jeepney, bus and truck. Therefore, four different OD matrices will be separately estimated for the future.
The target year of future traffic demand forecast is the year of 2030, and the forecast at 2020
is also carried out.
The model development procedure is shown in the following Figure 22.2.1-1.
FIGURE 22.2.1-1 TRAFFIC DEMAND FORECAST PROCEDURE
Legend: : Data Input (Requirement for Input) : Calculation Model : Output
Gen
erat
ion
& A
ttrac
tion
Dis
tribu
tion
Traf
fic
Ass
ignm
ent
Present Socio - Economic Indicators by zone
Present OD Matrix
Future Socio - Economic Indicators by zone
Future Road Network
Generation and Attraction Model
Distribution Model
Traffic Assignment Model
Forecast of Scale of Generation & Attraction by
Zone
Traffic Volume Distribution Forecast
Traffic Assignment Forecast (No. of Vehicles by Vehicle Type)
22-9
(2) Zone System in the Study Area The model predicts trips over the road network based on the attributes of traffic analysis zones (TAZ). Zonal Attributes used in trip generation including population and employment. A key component of the model development process was the development of zone system to cover the Study Area. The study area is defined from zone 1 to 73, Metro Cebu (1~23), other area (24~73) in traffic zoning system, outside the study area is defined from zone 74 and 92. (See Table 22.2.1-1 and Figure 22.2.1-2)

22-10
TABLE 22.2.1-1(1) TRAFFIC ZONING SYSTEM

22-11
TABLE 22.2.1-1(2) TRAFFIC ZONING SYSTEM
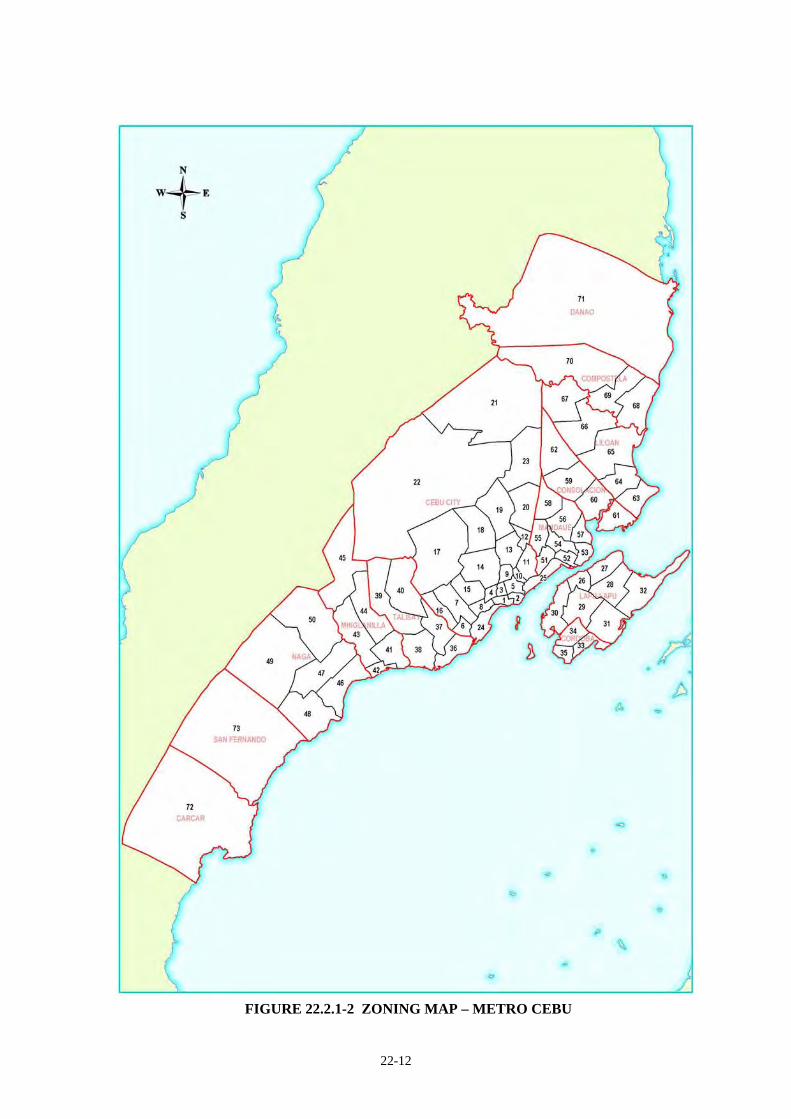
22-12
FIGURE 22.2.1-2 ZONING MAP – METRO CEBU
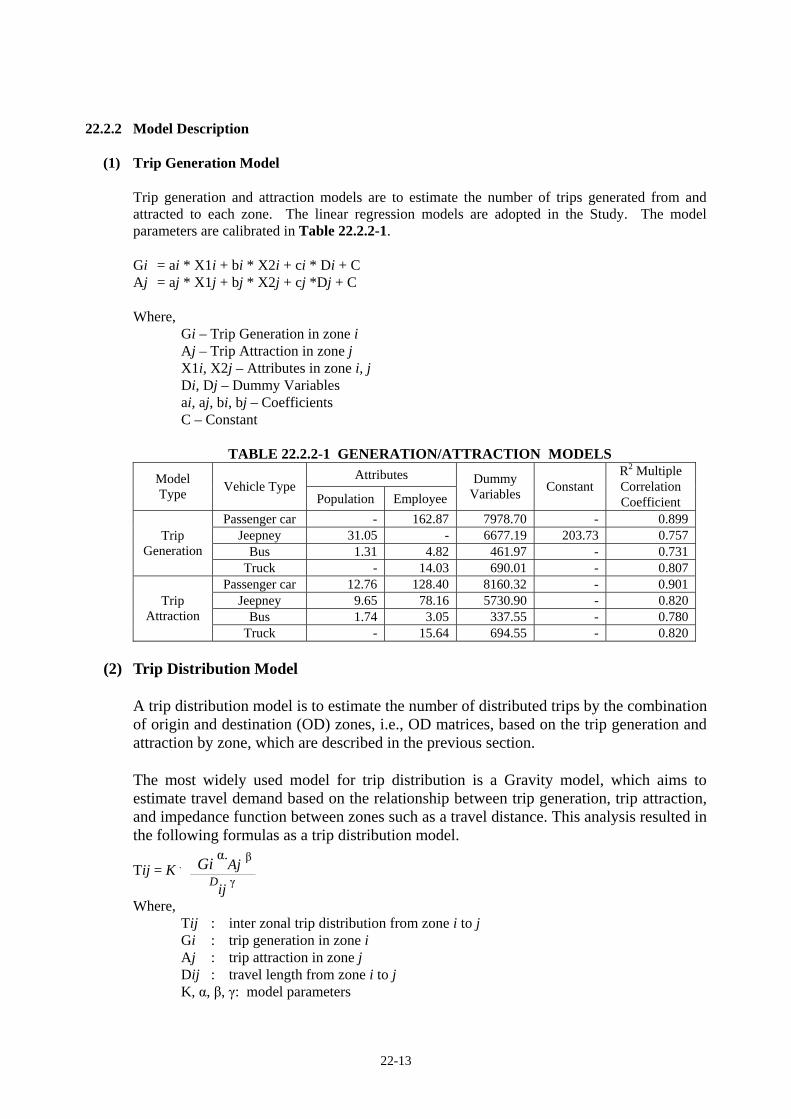
22-13
22.2.2 Model Description
(1) Trip Generation Model Trip generation and attraction models are to estimate the number of trips generated from and attracted to each zone. The linear regression models are adopted in the Study. The model parameters are calibrated in Table 22.2.2-1. Gi = ai * X1i + bi * X2i + ci * Di + C Aj = aj * X1j + bj * X2j + cj *Dj + C Where, Gi – Trip Generation in zone i Aj – Trip Attraction in zone j X1i, X2j – Attributes in zone i, j Di, Dj – Dummy Variables ai, aj, bi, bj – Coefficients C – Constant
TABLE 22.2.2-1 GENERATION/ATTRACTION MODELS Attributes Model
Type Vehicle Type Population Employee
Dummy Variables Constant
R2 Multiple Correlation Coefficient
Passenger car - 162.87 7978.70 - 0.899Jeepney 31.05 - 6677.19 203.73 0.757
Bus 1.31 4.82 461.97 - 0.731Trip
Generation Truck - 14.03 690.01 - 0.807
Passenger car 12.76 128.40 8160.32 - 0.901Jeepney 9.65 78.16 5730.90 - 0.820
Bus 1.74 3.05 337.55 - 0.780Trip
Attraction Truck - 15.64 694.55 - 0.820
(2) Trip Distribution Model
A trip distribution model is to estimate the number of distributed trips by the combination of origin and destination (OD) zones, i.e., OD matrices, based on the trip generation and attraction by zone, which are described in the previous section.
The most widely used model for trip distribution is a Gravity model, which aims to estimate travel demand based on the relationship between trip generation, trip attraction, and impedance function between zones such as a travel distance. This analysis resulted in the following formulas as a trip distribution model. Tij = K .
Where, Tij : inter zonal trip distribution from zone i to j Gi : trip generation in zone i Aj : trip attraction in zone j Dij : travel length from zone i to j K, α, β, γ: model parameters
Gi α.Aj β
Dij γ

22-14
TABLE 22.2.2-2 TRIP DISTRIBUTION MODEL Parameter
Vehicle Type α β γ K
R2 Multiple Correlation Coefficient
Passenger car 0.26962 0.26265 0.16356 2.78774 0.849Jeepney 0.34197 0.30590 0.39635 0.30395 0.806
Bus 0.22205 0.20014 0.03576 5.80972 0.819Truck 0.33677 0.31783 0.27748 0.34480 0.872
Calibration of the Gravity model is accomplished by developing adjustment factors. The adjustment factors can be determined by comparing model output and observed data. The model formula is shown as follows.
∑⋅=
nininin
ijijjiij DKA
DKAGT
Where, ijK : Adjustment factor between existing and model value for the zone pair of i and j
The output of a distribution model is a set of elements that show the travel flow between each pair of zones. However, the row totals of distribution elements do not match with trip generations and the column totals of distribution elements do not match with trip attractions. Therefore, an iteration is done until satisfied that the row totals match trip generations and the column totals match trip attractions.
(3) Assignment Model
JICA STRADA, which was developed by JICA, is used for traffic assignment simulation. This system provides two major types of highway assignment model, namely, incremental assignment and user equilibrium assignment. For this Study, the incremental assignment is employed. The incremental assignment divides the input OD matrix data into several increments and assigns each increment to the shortest route where the generalized cost is the least. Once the increments are assigned, link cost of each link is re-calculated and the shortest route is found again for the next increments. This calculation is repeated until the number of designated times.
22.2.3 Future Travel Demand Forecast
(1) Socio-economic Data for Demand Forecast Based on the existing socio-economic data, the future value by traffic zone for the development of trip production and attraction model is prepared. Table 22.2.3-1 summarizes the projection of population and employment in the future by area only for Cebu Province. The total population of Cebu Province is 4.9 million in 2020 and 5.8 million in 2030, while the number of employees is 2.2 million in 2020 and 2.7 million in 2030.

22-15
TABLE 22.2.3-1 SOCIO-ECONOMIC DATA FOR FUTURE DEMAND FORECAST Population Projection
(thousands) Employment Projection
(thousands) Region Province City/Municipality 2009 2020 2030 2009 2020 2030
CEBU CITY (Capital) 823.5 968.5 1,119.3 494.0 683.4 852.7
LAPU-LAPU CITY (OPON) 5 285.6 415.3 522.4 162.8 224.4 278.8
CORDOBA 48.8 72.3 99.6 7.8 10.8 13.4 CITY OF TALISAY 4 189.5 252.3 322.3 103.3 142.4 176.9
MINGLANILLA 109.7 156.4 195.8 50.1 69.0 85.8 CITY OF NAGA 3 99.9 128.0 158.0 72.0 99.2 123.3 MANDAUE CITY 337.9 460.5 588.9 173.7 239.5 297.6 CONSOLACION 96.4 154.2 214.8 42.3 58.2 72.4 LILOAN 101.7 165.7 248.5 39.1 53.9 67.0 COMPOSTELA 41.6 56.5 68.8 21.9 30.2 37.5 DANAO CITY 112.5 129.4 145.4 45.4 62.6 77.7 CITY OF CARCAR 2 104.0 121.9 138.0 20.3 28.0 34.8
SAN FERNANDO 102.4 117.5 131.1 15.7 21.6 26.8 SIBONGA 41.5 45.8 50.1 9.4 12.9 16.1 ARGAO 125.1 133.6 141.9 23.5 32.4 40.2 ALCOY 30.2 33.9 36.9 6.3 8.6 10.7 OSLOB 38.5 41.1 43.6 7.8 10.8 13.4 CARMEN 42.4 48.3 53.0 7.8 10.8 13.4 CATMON 57.4 64.1 70.8 11.0 15.1 18.8 CITY OF BOGO 1 137.1 156.2 170.9 23.5 32.4 40.2 BANTAYAN 296.4 318.6 334.9 47.0 64.7 80.4 SAN REMIGIO 70.9 80.9 89.3 14.1 19.4 24.1 TUBURAN 54.2 57.3 60.2 11.0 15.1 18.8 ASTURIAS 41.5 43.6 44.9 7.8 10.8 13.4 BALAMBAN 68.1 78.3 88.2 15.7 21.6 26.8 TOLEDO CITY 156.0 174.1 192.3 62.6 86.3 107.2 PINAMUNGAHAN 55.7 60.8 65.9 11.0 15.1 18.8 ALOGUINSAN b 26.7 29.6 32.1 4.7 6.5 8.0 BARILI 61.2 65.7 70.1 11.0 15.1 18.8 DUMANJUG 63.6 72.4 80.3 12.5 17.3 21.4 ALCANTARA 79.7 98.5 117.2 15.7 21.6 26.8
Region VII CEBU
ALEGRIA 72.5 77.4 82.2 14.1 19.4 24.1 Total 3,972.5 4,878.6 5,777.6 1,564.6 2,159.0 2,686.3
The increase of population and employment by traffic zone is displayed in Figure 22.2.3-1. The increase of these socio-economic values can be considered to affect the increase of trip production and attraction at each zone.

22-16
Population by Traffic Zone(1,000)
150
200920202030
Population
Employment
Employment by Traffic Zone(1,000)
100
200920202030
FIGURE 22.2.3-1 SOCIO-ECONOMIC DATA BY TRAFFIC ZONE

22-17
(2) Total Number of Generated Vehicle Trips The first step of forecasting procedure is to estimate the number of total trip generated in the Study Area. The number of generated trips by passenger vehicles such as passenger car, jeepney, and bus, is estimated by using the growth rate of population, while the number of generated cargo trips by truck is by the growth rate of employment. The result of estimation is shown in Table 22.2.3-2. The total number of vehicle trips in 2030 can be estimated at 628 thousand and that is 1.47 times of the number in 2009.
TABLE 22.2.3-2 TOTAL NUMBER OF VEHICLE TRIPS ESTIMATED
Year Passenger Car Jeepney Bus Truck Total Growth
Ratio
Population
Yearly Growth Rate
(%)
Employment
Yearly Growth
Rate (%)
2009 243,000 142,100 9,500 31,500 426,100 1.00 2010 247,700 144,800 9,700 32,400 434,600 1.02 1.93 2.86 2015 272,400 159,200 10,700 37,900 480,200 1.13 1.92 3.18 2020 298,400 174,400 11,700 43,500 528,000 1.24 1.84 2.78 2025 325,500 190,200 12,800 49,100 577,600 1.36 1.75 2.44 2030 353,400 206,500 13,900 54,200 628,000 1.47 1.66 1.98 2030/2009 1.45 1.45 1.46 1.72 1.47 1.45 1.72
(3) Trip Generation by Traffic Zone
Next, the trip generation and attraction of each traffic zone are calculated by using the models described in the previous section, and the above total number of trip generation is distributed into each traffic zone in proportion with the model value for the trip generation and attraction.
Figures 22.2.3-2 illustrates the number of vehicle trip generation and attraction, but excluding intra-zonal trips, in the year of 2030. The size of pi indicates the number of trips and colors indicate by mode: red is passenger car, green jeepney, blue bus, and yellow truck.

22-18
Trip Production by Traffic Zone(excluding intra-zonal trips)
50,00025,0005,000
CarJeepneyBusTruck
Trip Generation
Trip Attraction
Trip Attraction by Traffic Zone(excluding intra-zonal trips)
50,00025,0005,000
CarJeepneyBusTruck
FIGURE 22.2.3-2 TRIP GENERATION AND ATTRACTION IN 2030 BY TRAFFIC ZONE

22-19
(4) Trip Distribution
The trip generation and attraction distributed to each TAZ are next distributed into the elements of the OD matrix by using the trip distribution model.
The OD matrix is shown in the following Table 22.2.3-3.
TABLE 22.2.3-3 OD MATRIX OF ALL VEHICLES IN 2030 No. City/Municipality 1 2 3 4 5 6 7 8 9 10 11 Total
1 Cebu City (capital) 180,556 28,456 1,834 16,245 7,744 8,574 39,123 6,693 6,269 999 7,420 303,913
2 Lapu-Lapu City (opon) 5 34,295 48,152 1,568 1,979 903 266 15,029 4,175 3,045 22 3,631 113,065
3 Cordoba 0 840 542 0 0 0 0 0 0 0 0 1,382 4 City of Talisay 4 16,214 1,808 0 5,934 1,751 2,242 3,312 170 0 0 93 31,524 5 Minglanilla 6,845 948 0 1,709 3,022 2,024 1,321 0 0 0 513 16,382 6 City of Naga 3 9,275 507 0 2,209 1,266 5,354 1,089 0 0 0 474 20,174 7 Mandaue City 38,764 11,981 40 3,098 1,071 746 26,863 3,512 3,328 28 4,242 93,673 8 Consolacion 6,269 2,975 0 290 0 29 3,981 1,938 407 0 1,281 17,170 9 Liloan 5,013 3,621 0 0 0 0 6,023 491 2,193 0 291 17,632 10 Compostela 168 0 0 0 0 0 0 0 0 219 0 387 11 Others 7,082 536 0 53 79 0 1,045 0 0 0 4,000 12,795
Total 304,481 99,824 3,984 31,517 15,836 19,235 97,786 16,979 15,242 1,268 21,945 628,098
22.3 “DO NOTHING” CASE TRAFFIC ASSIGNMENT
The following figures illustrate the result of traffic assignment in cases of “Do-Nothing” case. Figures 22.3-1 shows the result of traffic assignment in the year of 2020 and Figures 22.3-2 shows the result in the year 2030.

22-20
FIGURE 22.3-1 TRAFFIC ASSIGNMENT RESULT OF “DO-NOTHING” CASE IN 2020

22-21
FIGURE 22.3-2 TRAFFIC ASSIGNMENT RESULT OF “DO-NOTHING” CASE IN 2030

CHAPTER 23
ENVIRONMENTAL AND SOCIAL CONSIDERATIONS FOR METRO CEBU

23-1
CHAPTER 23 ENVIRONMENTAL AND SOCIAL CONSIDERATIONS
FOR METRO CEBU 23.1 NATURAL CONDITION AND URBAN DEVELOPMENT OF THE STUDY AREA
Natural conditions of the Study Area such as topographic, geological, meteorological conditions, flood prone areas and environmentally protected areas were discussed in Section 19.1 of Chapter 19. Urban development has been concentrated at narrow coastal plain areas, and it is now expanding towards the hill-sides. Road network development must be implemented under above natural conditions and urban development trends in due consideration of minimization of adverse impacts on environmental and social conditions.
23.2 HIGHWAY PLANNING TO MINIMIZE ADVERSE IMPACTS OF ENVIRONMENTAL AND SOCIAL CONDITIONS
The widening of the existing roads and construction of new roads were proposed in Chapter 24. The following environmental and social considerations must be exercised;
(1) Widening of the Existing Roads
● Widening of existing roads should be planned within the existing road ROW. If necessary, the design standards may be relaxed to achieve these objectives.
● In many cases, a part of a house, shanties, fences are encroaching the existing road ROW, DPWH should properly consult with such owners and compensate at a reasonable price.
● In case new ROW acquisition is inevitable, consultation meetings with the affected people should be held to explain why land acquisition is needed and how the Government would compensate their properties, then the consent of the affected people should be obtained.
(2) New Road Construction
● Most proposed roads are planned in the rapidly urbanizing areas and topographically difficult
locations. ● Alignment selection must be done carefully. Several alternative alignments should be studied
to select an optimum alignment. ● In order to select an optimum alignment, all critical areas in terms of natural and social
conditions must be identified. Latest satellite photos should be utilized to achieve these objectives. Alignments should be studied to avoid or not to hit the identified critical areas. An alignment that minimizes adverse environmental and social impacts should be selected as an optimum alignment.
● In order to minimize environmental and social impacts, appropriate design standards should be selected.
● Consultation meetings with the concerned people should be held from the stage of planning up to the detailed design and construction stage. Constant dialogue with the concerned people should be made for the successful implementation of the project.
● For new road construction, DPWH needs to undertake detailed feasibility study including EIA study of which recommended TOR is shown in Annex 13.2.

CHAPTER 24
HSH DEVELOPMENT STRATEGY FOR METRO CEBU

24-1
CHAPTER 24 HSH DEVELOPMENT STRATEGY FOR METRO CEBU
24.1 IDENTIFIED ISSUES
Identified issues are as follows;
ARTERIAL ROAD NETWORK ● Existing arterial road network is rather simple except highly urbanized areas of Cebu,
Talisay, Mandaue Cities, and served by Cebu North Road in the Northern area and Cebu South Road in the southern area.
● Above network implies that there is no alternative route, thus, when Cebu North Road
or Cebu South Road becomes impassable due to natural calamity or a bridge collapse, the hinterland area becomes totally isolated.
● In the highly urbanized area, two transport corridors are formed.
- Central transport corridor (Cebu North Road and Cebu South Road) - Coastal transport corridor, which is about to be completed (Cebu South Coastal
Road and S. Osmena Blvd.) ● All roads in the highly urbanized area are narrow. Most of roads are 4-lane undivided.
Though several roads are 6-lane divided. Widening of those roads is extremely difficult due to heavy roadside development.
● Urbanization is expanding towards hilly area, since narrow coastal plain is highly
urbanized. However, road development along the hillside is not achieved yet. TRAFFIC CONDITIONS ● Cebu North Road from Liloan towards Cebu City is experiencing traffic congestion. ● Cebu South Road from Minglanilla towards Cebu City also suffers traffic congestion. ● Most roads within Cebu, Mandaue and Talisay Cities are experiencing traffic
congestion. ● Travel speed of above roads is less than 20 km/hr. CURRENT MEASURES ● To cope up with above problems, CEBU CITY is studying the introduction of Bus
Rapid Transport (BRT) system, and Cebu Province is studying the introduction of Light Rail Transit (LRT) system.

24-2
24.2 POLICY AND STRATEGY FOR DEVELOPMENT OF HSH 24.2.1 HSH Development Objectives
HSH development objectives are established as follows;
HSH DEVELOPMENT OBJECTIVES ● To decongest traffic on arterial roads of Metro Cebu. ● To achieve integration of socio-economic activities of Metro Cebu. ● To enhance the tourism industry. ● To recover international competitiveness of industries. ● To promote sound urban expansion.
24.2.2 HSH Development Strategy
HSH development strategies are established as follows;
DEVELOPMENT OBJECTIVES
To decongest of traffic on arterial roads.
To achieve integration of socio-
economic activities of Metro Cebu.
To enhance the tourism industry.
To recover international competitiveness of industries.
To promote sound urban
expansion.
DEVELOPMENT STRATEGY
To promote transport facilities with higher service level.
To provide alternative transport
routes.
To provide high standard transportation access to tourism zones.
To improve modal linkage.
To provide transport facilities
which guide sound urban expansion.
STRATEGY TO FORMULATE HSH NETWORK
HSH network shall be limited to HSH-2, since formation of HSH-1 is difficult due to the following reasons; - Traffic demand from outside the highly urbanized area is still low to require HSH-1. - In the highly urbanized area, roads are too narrow to accommodate HSH-1. - One candidate for HSH-1 is a new hillside road. This road must be connected by
interchanges to existing radical roads at a short interval in order to attract enough traffic on this road, however, construction of interchanges is quite difficult due to topographical constraints.