chapter 17 the management and control of quality · chapter 17 - the management and control of ......
TRANSCRIPT
Chapter 17 - The Management and Control of Quality
17-1
Chapter 17 The Management and Control of Quality
Cases 17-1 Precision Systems, Inc., by Suresh S. Kalgnanam and Ella Mae Matsumura (Source: Copyright
© 1998 by the Institute of Management Accountants, Montvale, NJ). 17-2 Kelsey Hospital (Source: Arnold Schneider and John T. Large, Global Perspectives in
Accounting Education, Vol. 1 (2004), pp. 17-24. The purpose of this case is to have students analyze and categorize costs of quality in a nonprofit health care setting. The case describes the need for a quality costing system in a hospital and the development of such a system for two primary treatments (intubation and bronchodilator treatments) performed in the respiratory therapy department of the hospital. A list of items pertaining to quality costs is presented and described for analysis, estimation, and categorization.
17-3 Union Pacific Railroad: Using Cost of Quality in Environmental Management (Source:
Cases from Management Accounting Practice Volumes 10 and 11, Edited by Lawrence P. Carr, Copyright by Institute of Management Accountants, 1997). This case presents a good introduction to capital improvement justification as well as cost-of-quality (COQ) concepts. It can be used to reinforce the idea of justifying projects (and is therefore usable in conjunction with Chapter 12: Capital Budgeting) on the basis of not only cash savings but also based on “softer” savings such as cost avoidance, reducing future liabilities, efficiency savings, and the cost of non-compliance with the latest governmental regulations.
Readings 17-1: “GE Takes Six Sigma Beyond the Bottom Line” by G. T. Lucier and S. Seshadri, Strategic Finance (May 2001), pp. 40-46. This article reports on the success of GE Medical Systems Inc.’s Six-Sigma effort. The article describes the training programs for employees in statistical process control and services and information offered by the Web site of the company to support the quality improvement efforts of more than 300,000 employees world-wide. Discussion Questions: 1. What is a Six Sigma approach? 2. Describe the processes that GE used to implement its Six-Sigma program. 3. What are black belts? What roles do black belts play in GE’s Six Sigma program? 17-2: “Accounting for Quality with Nonfinancial Measures: A Simple No-Cost Program for the Small Company” by Ronald C. Kettering, Management Accounting Quarterly (Spring 2001), pp. 14-19. The author of this article argues that, to improve product/service quality, even small companies can develop and use nonfinancial, low-cost data to improve performance and customer satisfaction.
Chapter 17 - The Management and Control of Quality
17-2
Discussion Questions: 1. In terms of a Cost of Quality (COQ) framework for managing and controlling quality costs, distinguish between
cost of conformance and cost of non-conformance. Into what subdivisions can each of these two broad categories of quality-related costs be made? What is the definition of each of the four categories of quality cost in a typical COQ report?
2. Provide an overview of the three-step approach that the author of this paper recommends as a “no-cost” approach that can be used by smaller (i.e., more resource-constrained) organizations to monitor and control quality.
3. Provide at least two examples of non-financial quality indicators for each of the four categories of quality-related costs typically included in a COQ report.
17-3: “Implementing Corporate Sustainability: Measuring and Managing Social and Environmental Impacts” by Marc Epstein, Strategic Finance (January 2008), pp. 25-31. This article is an excerpt of the award-winning book by the author: Making Sustainability Work: Best Practices in Managing and Measuring Corporate Social, Environmental and Economic Impacts, Berrett-Koehler Publishers (2008). It is also one of a series of four articles, based on the book, published in Strategic Finance. Discussion Questions: 1. What is the primary business issue and the primary accounting issue addressed by the author of this article? 2. Provide an overview of the “Corporate Sustainability Model” developed by the author of this article (see Figure 1). 3. How is the Corporate Sustainability Model similar to and different from Exhibits 17.1 and 17.2? 4. What is the importance of the examples provided in Table 1 of the article? 17-4: “Making the Cost of Quality Practical” by Steve Ball, Strategic Finance (July 2006), pp. 34-41. The author of this article discusses conditions under which a Cost of Quality (COQ) program may be warranted, as well as how to establish a COQ system in practice. Four specific examples of using a COQ program to improve managerial decision-making are presented in the article. Discussion Questions: 1. What, in your opinion, is the overall purpose of (or message in) this article? 2. Provide a succinct summary of the author’s conceptualization of quality and quality costs? (Hint: Refer to Tables 1 and 2.) 3. What is the difference between “fully loaded” and “variable” costs? According to the author, why is this distinction important? 4. What is the primary value of the information contained in Table 6 of this article? 17-5: “The Lowdown on Lean Accounting: Should Management Accountants Get on the Bandwagon—or Not?” by Anton Van Der Werwe and Jeffrey Thompson, Strategic Finance (February 2007), pp. 26-33. The authors of this article called for reasoned debate regarding the role of “lean accounting” in accounting practice. As such, they raise some interesting questions for both proponents and opponents of “lean accounting.” Discussion Questions: 1. What two criteria are offered by the authors as the basis for evaluating the role of lean accounting in organizations today? 2. Which specific assertions of lean accounting are examined by the authors of this article? 3. What conclusions do the authors draw in response to the two questions raised at the outset of this article?
Chapter 17 - The Management and Control of Quality
17-3
17-6: “Unleash the Power of Lean Accounting” by Jan P. Brosnahan, Journal of Accountancy (July 2008), pp. 60-66. (Available at: http://www.journalofaccountancy.com/Issues/2008/Jul/UnleashthePowerofLeanAccounting.htm) The author is divisional controller at Watlow Electric Manufacturing Company (www.watlow.com), which recently introduced a lean accounting system to support its move to “lean.” This article provides a perspective regarding the motivation behind these moves and the associated benefits of the changes implemented at Watlow Electric. Discussion Questions: 1. How does the author of this article define the term “lean accounting” and what does she indicate as some of the primary methods of “lean accounting”? 2. In what sense does the author see a deficiency in terms of using traditional accounting systems when an organization adopts a lean manufacturing strategy? 3. What is meant by the term “value stream management” (VSM) and how, specifically, was this instituted at Watlow Electric? 4. What implementation challenges did Watlow experience as it moved from a traditional accounting and control system to VSM? 17-7: “Why Do We Need Lean Accounting and How Does It Work?” by Brian H. Maskell and Frances A. Kennedy, The Journal of Corporate Accounting and Finance (March/April 2007), pp. 59-73. (Published online in Wiley InterScience, www.interscience.wiley.com, DOI 10.1002/jcaf.20293.) The authors of this article offer a rationale for a change from traditional accounting and control systems to “lean accounting.” As well, they provide an overview of the workings of a lean accounting system. Discussion Questions: 1. Some managers might contend that “lean manufacturing” is just another fad. How do the authors respond to this assertion? 2. Provide a short summary of the deficiencies of traditional accounting and control systems, as suggested by the authors of this article. 3. As proposed by the authors, what are the three primary objectives of a “lean accounting system”? 4. What lean accounting methods and tools are available to support the three primary objectives referred to in (3) above? (Hint: Please refer to Exhibit 5 in the article.) 17-8: “A Six Sigma Approach to Internal Audits” by Shaun Aghili, Strategic Finance (February 2009), pp. 38-43. The author of this article provides an overview of the Six Sigma process, as well as how that process might be applied to the development or strengthening of internal control processes. Discussion Questions: 1. According to the author, what is the motivation for devoting resources to the development of an effective internal control system? 2. What are the elements of the performance-improvement model typically used to implement Six Sigma projects? 3. What role is played by “cause-and-effect” diagrams in a typical Six Sigma project? What is the “Pareto principle” and how is this applied to Six Sigma implementation? 3. Provide a brief summary of Six Sigma certifications.
Chapter 17 - The Management and Control of Quality
17-17
Case 17-3: Union Pacific Railroad—Using Cost of Quality in Environmental Management
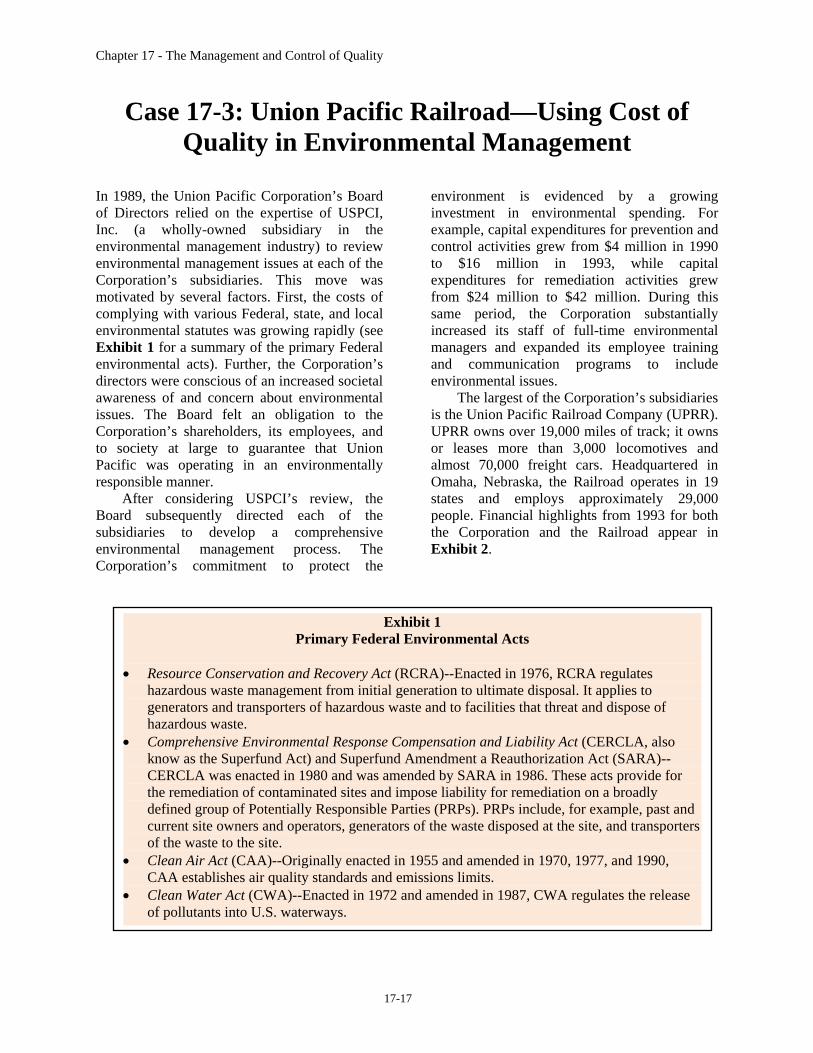
In 1989, the Union Pacific Corporation’s Board of Directors relied on the expertise of USPCI, Inc. (a wholly-owned subsidiary in the environmental management industry) to review environmental management issues at each of the Corporation’s subsidiaries. This move was motivated by several factors. First, the costs of complying with various Federal, state, and local environmental statutes was growing rapidly (see Exhibit 1 for a summary of the primary Federal environmental acts). Further, the Corporation’s directors were conscious of an increased societal awareness of and concern about environmental issues. The Board felt an obligation to the Corporation’s shareholders, its employees, and to society at large to guarantee that Union Pacific was operating in an environmentally responsible manner. After considering USPCI’s review, the Board subsequently directed each of the subsidiaries to develop a comprehensive environmental management process. The Corporation’s commitment to protect the
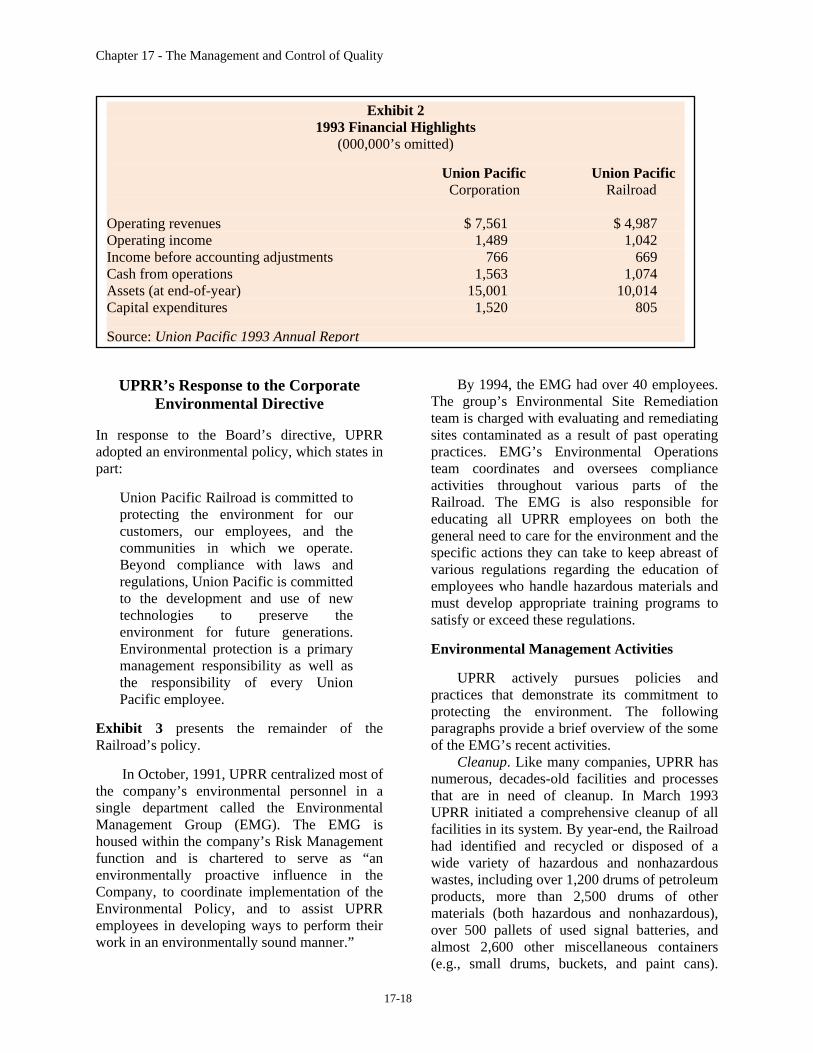
environment is evidenced by a growing investment in environmental spending. For example, capital expenditures for prevention and control activities grew from $4 million in 1990 to $16 million in 1993, while capital expenditures for remediation activities grew from $24 million to $42 million. During this same period, the Corporation substantially increased its staff of full-time environmental managers and expanded its employee training and communication programs to include environmental issues. The largest of the Corporation’s subsidiaries is the Union Pacific Railroad Company (UPRR). UPRR owns over 19,000 miles of track; it owns or leases more than 3,000 locomotives and almost 70,000 freight cars. Headquartered in Omaha, Nebraska, the Railroad operates in 19 states and employs approximately 29,000 people. Financial highlights from 1993 for both the Corporation and the Railroad appear in Exhibit 2.
Exhibit 1 Primary Federal Environmental Acts
• Resource Conservation and Recovery Act (RCRA)--Enacted in 1976, RCRA regulates
hazardous waste management from initial generation to ultimate disposal. It applies to generators and transporters of hazardous waste and to facilities that threat and dispose of hazardous waste.
• Comprehensive Environmental Response Compensation and Liability Act (CERCLA, also know as the Superfund Act) and Superfund Amendment a Reauthorization Act (SARA)--CERCLA was enacted in 1980 and was amended by SARA in 1986. These acts provide for the remediation of contaminated sites and impose liability for remediation on a broadly defined group of Potentially Responsible Parties (PRPs). PRPs include, for example, past and current site owners and operators, generators of the waste disposed at the site, and transporters of the waste to the site.
• Clean Air Act (CAA)--Originally enacted in 1955 and amended in 1970, 1977, and 1990, CAA establishes air quality standards and emissions limits.
• Clean Water Act (CWA)--Enacted in 1972 and amended in 1987, CWA regulates the release of pollutants into U.S. waterways.
Chapter 17 - The Management and Control of Quality
17-18
UPRR’s Response to the Corporate Environmental Directive
In response to the Board’s directive, UPRR adopted an environmental policy, which states in part:
Union Pacific Railroad is committed to protecting the environment for our customers, our employees, and the communities in which we operate. Beyond compliance with laws and regulations, Union Pacific is committed to the development and use of new technologies to preserve the environment for future generations. Environmental protection is a primary management responsibility as well as the responsibility of every Union Pacific employee.
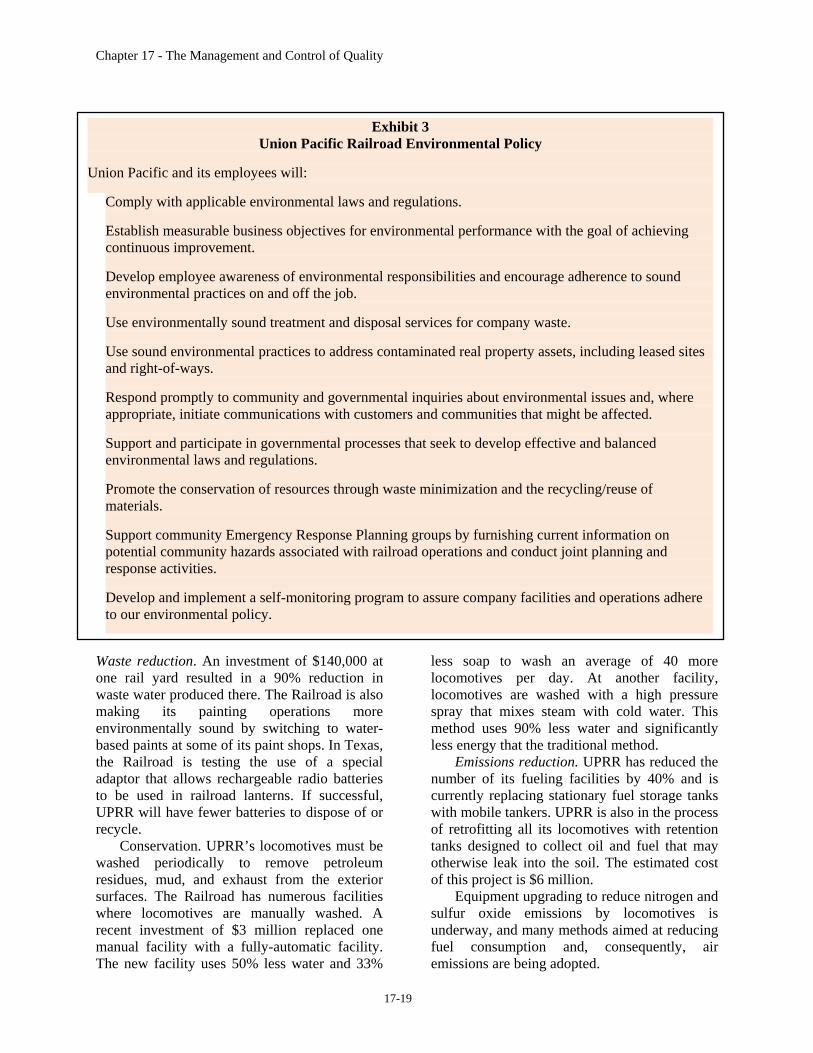
Exhibit 3 presents the remainder of the Railroad’s policy. In October, 1991, UPRR centralized most of the company’s environmental personnel in a single department called the Environmental Management Group (EMG). The EMG is housed within the company’s Risk Management function and is chartered to serve as “an environmentally proactive influence in the Company, to coordinate implementation of the Environmental Policy, and to assist UPRR employees in developing ways to perform their work in an environmentally sound manner.”
By 1994, the EMG had over 40 employees. The group’s Environmental Site Remediation team is charged with evaluating and remediating sites contaminated as a result of past operating practices. EMG’s Environmental Operations team coordinates and oversees compliance activities throughout various parts of the Railroad. The EMG is also responsible for educating all UPRR employees on both the general need to care for the environment and the specific actions they can take to keep abreast of various regulations regarding the education of employees who handle hazardous materials and must develop appropriate training programs to satisfy or exceed these regulations. Environmental Management Activities UPRR actively pursues policies and practices that demonstrate its commitment to protecting the environment. The following paragraphs provide a brief overview of the some of the EMG’s recent activities. Cleanup. Like many companies, UPRR has numerous, decades-old facilities and processes that are in need of cleanup. In March 1993 UPRR initiated a comprehensive cleanup of all facilities in its system. By year-end, the Railroad had identified and recycled or disposed of a wide variety of hazardous and nonhazardous wastes, including over 1,200 drums of petroleum products, more than 2,500 drums of other materials (both hazardous and nonhazardous), over 500 pallets of used signal batteries, and almost 2,600 other miscellaneous containers (e.g., small drums, buckets, and paint cans).
Exhibit 2 1993 Financial Highlights
(000,000’s omitted) Union Pacific Union Pacific Corporation Railroad Operating revenues $ 7,561 $ 4,987 Operating income 1,489 1,042 Income before accounting adjustments 766 669 Cash from operations 1,563 1,074 Assets (at end-of-year) 15,001 10,014 Capital expenditures 1,520 805 Source: Union Pacific 1993 Annual Report
Chapter 17 - The Management and Control of Quality
17-19
Waste reduction. An investment of $140,000 at one rail yard resulted in a 90% reduction in waste water produced there. The Railroad is also making its painting operations more environmentally sound by switching to water-based paints at some of its paint shops. In Texas, the Railroad is testing the use of a special adaptor that allows rechargeable radio batteries to be used in railroad lanterns. If successful, UPRR will have fewer batteries to dispose of or recycle. Conservation. UPRR’s locomotives must be washed periodically to remove petroleum residues, mud, and exhaust from the exterior surfaces. The Railroad has numerous facilities where locomotives are manually washed. A recent investment of $3 million replaced one manual facility with a fully-automatic facility. The new facility uses 50% less water and 33%
less soap to wash an average of 40 more locomotives per day. At another facility, locomotives are washed with a high pressure spray that mixes steam with cold water. This method uses 90% less water and significantly less energy that the traditional method. Emissions reduction. UPRR has reduced the number of its fueling facilities by 40% and is currently replacing stationary fuel storage tanks with mobile tankers. UPRR is also in the process of retrofitting all its locomotives with retention tanks designed to collect oil and fuel that may otherwise leak into the soil. The estimated cost of this project is $6 million. Equipment upgrading to reduce nitrogen and sulfur oxide emissions by locomotives is underway, and many methods aimed at reducing fuel consumption and, consequently, air emissions are being adopted.
Exhibit 3 Union Pacific Railroad Environmental Policy
Union Pacific and its employees will:
Comply with applicable environmental laws and regulations. Establish measurable business objectives for environmental performance with the goal of achieving continuous improvement. Develop employee awareness of environmental responsibilities and encourage adherence to sound environmental practices on and off the job. Use environmentally sound treatment and disposal services for company waste. Use sound environmental practices to address contaminated real property assets, including leased sites and right-of-ways. Respond promptly to community and governmental inquiries about environmental issues and, where appropriate, initiate communications with customers and communities that might be affected. Support and participate in governmental processes that seek to develop effective and balanced environmental laws and regulations. Promote the conservation of resources through waste minimization and the recycling/reuse of materials. Support community Emergency Response Planning groups by furnishing current information on potential community hazards associated with railroad operations and conduct joint planning and response activities. Develop and implement a self-monitoring program to assure company facilities and operations adhere to our environmental policy.
Chapter 17 - The Management and Control of Quality
17-20
UPRR is currently experimenting with alternative fuels as a long-term approach to the reduction of those emissions. UPRR’s Cost of Quality System and the
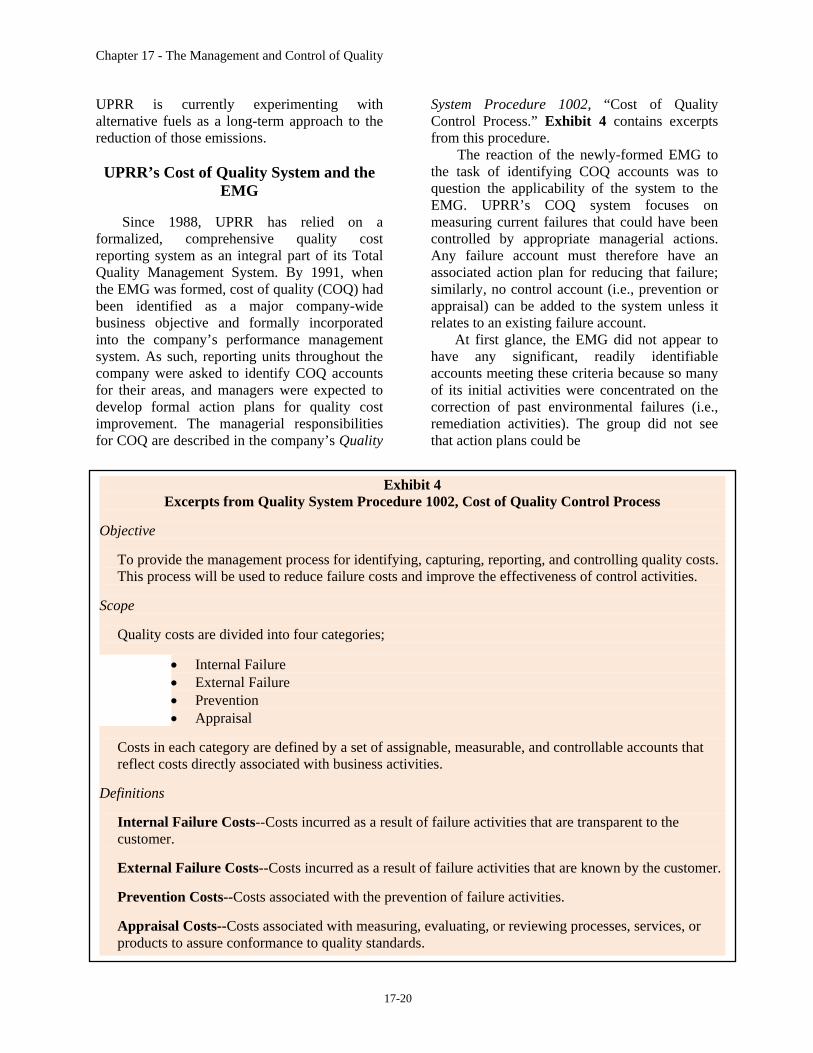
EMG Since 1988, UPRR has relied on a formalized, comprehensive quality cost reporting system as an integral part of its Total Quality Management System. By 1991, when the EMG was formed, cost of quality (COQ) had been identified as a major company-wide business objective and formally incorporated into the company’s performance management system. As such, reporting units throughout the company were asked to identify COQ accounts for their areas, and managers were expected to develop formal action plans for quality cost improvement. The managerial responsibilities for COQ are described in the company’s Quality
System Procedure 1002, “Cost of Quality Control Process.” Exhibit 4 contains excerpts from this procedure. The reaction of the newly-formed EMG to the task of identifying COQ accounts was to question the applicability of the system to the EMG. UPRR’s COQ system focuses on measuring current failures that could have been controlled by appropriate managerial actions. Any failure account must therefore have an associated action plan for reducing that failure; similarly, no control account (i.e., prevention or appraisal) can be added to the system unless it relates to an existing failure account. At first glance, the EMG did not appear to have any significant, readily identifiable accounts meeting these criteria because so many of its initial activities were concentrated on the correction of past environmental failures (i.e., remediation activities). The group did not see that action plans could be
Exhibit 4 Excerpts from Quality System Procedure 1002, Cost of Quality Control Process
Objective To provide the management process for identifying, capturing, reporting, and controlling quality costs.
This process will be used to reduce failure costs and improve the effectiveness of control activities. Scope Quality costs are divided into four categories;
• Internal Failure • External Failure • Prevention • Appraisal
Costs in each category are defined by a set of assignable, measurable, and controllable accounts that
reflect costs directly associated with business activities. Definitions Internal Failure Costs--Costs incurred as a result of failure activities that are transparent to the
customer. External Failure Costs--Costs incurred as a result of failure activities that are known by the customer. Prevention Costs--Costs associated with the prevention of failure activities. Appraisal Costs--Costs associated with measuring, evaluating, or reviewing processes, services, or
products to assure conformance to quality standards.
Chapter 17 - The Management and Control of Quality
17-21
established to eliminate past occurrences, nor could any related controls be currently established to prevent those past failures. During EMG’s second year of existence, the head of Risk Management (to whom the EMG reported) urged the group to reconsider these views concerning the primary nature of its activities. He observed that the company’s environmental management practices were not perfect and could therefore be improved. He also pointed to the environmentally-related fines that the company was being assessed for current failures. (These fines were already being accumulated in COQ accounts for other departments.) In his opinion, COQ could help the EMG become more proactive, so he assigned a team the responsibility of identifying COQ accounts. The team members identified several areas for investigation in their search for potential COQ accounts. First, the team members ascertained that an assessment of customer requirements could prove worthwhile, since failure to meet customer requirements could result in controllable failure costs. They also recognized that an identification of the group’s largest expenditures could reveal opportunities for improvement in control activities. Additional COQ accounts might be revealed by a careful review of the figures routinely reported elsewhere for their applicability to the COQ reporting framework. Conceivably, some COQ-related measures were already in place, but had simply not been defined as such. Finally, the team determined that an evaluation and review of EMG’s goals might suggest some new COQ accounts, since failure to properly specify and attain the goals could cause otherwise unnecessary expenses for the company. The following sections describe a few of the COQ accounts that were ultimately identified by the team. COQ Related to Customer Requirements The EMG has both external and internal customers. The external customers include the various city, state, and federal agencies overseeing environmental regulations. Internal customers include all the other company departments receiving EMG services. External customers. External customers’ requirements are specified in numerous (and
regularly changing) regulations and laws applicable to the geographic are covered by the Union Pacific’s system. If UPRR fails to meet the external customers’ requirements, the customers’ dissatisfaction is expressed in the form of citations or letter complaining about, or serving notice on, violations to the present standards. Improved performance by the EMG would materialize in the form of fewer citations and, ultimately, in fewer fines and penalties. Applying COQ concepts, the team determined that failure costs for each current incident could be estimated based on past experience. A failure cost per incident was estimated by dividing the total number of incidents in a recent year into the total dollar amount paid out in fines and penalties in the same year. In any given month, the current COQ is thus reported to be the current month’s number of incidents multiplied by the historical rate per incident. The team recognizes that the measure is flawed in that the actual pay-outs in any given year may typically relate to failures that occurred in prior years. However, the figure is accepted as an acceptable, rough estimate; it can be refined over time to reflect what the net present value (NPV) of the actual payment will be when the incident is eventually settled (normally, in two or three years). Internal customers. The internal customers’ primary requirement is to minimize their own environmental costs. To these customers, sound environmental management practices (dictated to them by the EMG) sometimes seem to fail the cost-benefit criterion. For example, maintaining proper documentation of all 55-gallon drums is a time-consuming task that might not appear to have any payback. However, if a container’s record is lost or if the label is destroyed, the contents must be analyzed to determine what was in the drum so that the contents can be disposed of properly. For COQ reporting purposes, the team determined the cost of analyzing the contents of a 55-gallon drum to be the simple average derived from bills received over a 12-month period. In any given reporting period, the COQ is estimated as the number of drums analyzed times the historical average analysis cost per drum. Actual analysis costs cannot be used on a timely basis because the number of drums tested
Chapter 17 - The Management and Control of Quality
17-22
and the results of the tests are not linked in the accounting system. COQ in the Large Expenditure Categories The EMG’s largest expenditures are associated with the clean-up of old sites. As discussed earlier, these costs are being incurred to correct past failures and are, by definition, not appropriate for inclusion in UPRR’s COQ system. In developing its COQ accounts, the EMG team took a proactive view, however, and asked whether the clean-ups were being done to “World Class” standards. For example, they questioned whether the costs incurred were appropriate given the amount of material handled. They also expressed concern that the clean-up activities should reflect the latest in technology and process control. A resulting account that the team developed is one that measures the disposal of diesel fuel-contaminated soil (the largest category of soil disposal). Before developing the account, the team reviewed the literature and interviewed consultants and subcontractors to determine the most efficient operations, i.e., a “World Class” standard. The new COQ account would reflect any costs incurred above this standard. Initially, the cost of disposing of one ton of hydrocarbon-contaminated soil was in excess of $50 a ton. The best operation was processing it at $23 a ton. The difference between the two costs times the tonnage handled is now reported as a failure account in the COQ system. Essentially, the account represents EMG’s failure to meet an operating efficiency standard for disposal of the contaminated soil. This account focuses management attention on a significant environmental cost. It serves as a constant reminder to EMG management that the group can process larger quantities of soil and clean up sites faster if it can reduce the efficiency gaps. Another large cost incurred by the EMG is the cost of treating water coming from various UPRR shops and fueling facilities. Because the Railroad consumes a million gallons of diesel fuel per day, even a slight spillage rate implies that many gallons of diesel fuel are deposited into waste-water treatment facilities each day. In addition, the use of non-biodegradable soaps and
cleaning solvents increases the need for treatment chemicals and lowers the probability that the water can flow directly into local sewage facilities. In defining a related COQ account, the EMG took an aggressive stance and viewed the cost of the company’s waste-water treatments costs as a total failure cost. The EMG’s position was simple: if the discharge water coming from the various shops and facilities always met the local standards, UPRR would incur no treatment costs. The COQ account was then defined as any actual costs incurred. This particular account motivates various groups within UPRR to work together to reduce spillage at the company’s fueling facilities, decrease the use of non-biodegradable solvents and soaps, and ensure that waste engine oil is disposed of properly. The EMG also focused on the large expenditures associated with retrofitting all locomotives with retention tanks, or “catch” pans. As mentioned earlier, these pans minimize the amount of hydrocarbons dropped on the ground. Based on a survey of “best” practices, the EMG determined that the average locomotive leaks one quart of oil products per day. The group used this rate to estimate the amount of soil an average locomotive contaminates while idling in a year and incorporated the measure into a COQ failure account. (The idle time is considered more important because the amount of oil products leaked by a moving locomotive is significantly less.) The COQ is the estimated cost of removing and treating the soil that the leaking hydrocarbons would contaminate during normal operating conditions. The account helps management track improvements associated with the retrofitting project. It also encourages management to reduce future exposures by installing catch basins at all major yards where locomotives stand idling for extended periods. Other COQ-Related Measures Available in the Company’s Existing System Another COQ account resulting directly from a review of the group’s existing reports is the cost of cleaning up reportable, environmental spills that occur in the “normal” course of business. Such spills happen for a number of
Chapter 17 - The Management and Control of Quality
17-23
reasons, ranging from a customer’s failure to secure a valve on a 30,000-gallon tank to a track maintenance crew’s dropping a 5-gallon can of cleaning solvent at a siding. The cleanup costs associated with these incidents vary widely depending on the nature of the spill; further, there is typically a time delay between the incident date and the receipt of the final bill for cleanup. For these reasons, each period’s COQ is estimated using an average historical cost per incident. The account allows the EMG Group to assess the potential magnitude the spillages on an ongoing basis. The managers use this account to detect the presence of patterns in the spills and to evaluate the effectiveness of the corrective action programs at specific locations. COQ Accounts Related to the EMG’s Goals A major objective of the EMG is to prevent environmental contaminations. Recognizing the potential for small diesel fuel spills during routine refueling operations, the EMG established a COQ account to draw attention to the cumulative effects of these spills. This account assigned a dollar value to the amount of diesel fuel contained in a sample of the waste-oil recovery tank at major fueling facilities. The COQ was estimated as the difference between the price paid for a gallon of diesel fuel and the price per gallon received from the oil recovery company. This account focuses attention on the cost of fueling-mishaps. The EMG is not responsible for fueling the locomotives, but is responsible for running the waste-water treatment facilities and for cleaning up any spills. EMG managers believe this account can help the Group improve its own practices regarding waste-water treatment; they also believe that the account will motivate managers in other departments to focus on the elimination of these fuel spillages.
Summary The examples presented in this case demonstrate how UPRR relies on COQ as a management tool in the environmental area. Given that the Railroad has a long-standing commitment to total quality management (TQM) and has experienced tremendous success with its use of COQ in other departments, the
application of COQ to the environmental area does not require much “stepping out of the box” thinking. In this instance, all that was necessary was for the COQ team to consider some relatively simple questions like: • What do the customers require, and what
costs are incurred when their requirements are not met?
• Where is most of the money being spent, and are the related activities being performed to “World Class” standards?
• What measurements are already in place that do not reflect a financial impact, and what is the associated cost of failure?
• What are the group’s goals or objectives, and what is the cost of not achieving those goals or objectives?
Determining the cost of not meeting the standard or requirement in each of these four categories is actually a fairly straightforward cost accounting exercise. The Railroad views COQ as a useful management tool for all of its reporting units. Once costs have been assigned to each failure, management attention is focused on the largest account. Reducing the failure rate on these accounts not only improves the process, but also leads management to focus on other failure activity-reductions. In many cases, failure reductions result in significant, immediate cash savings that can be applied to employee recognition programs as well as to the prevention of failures in other areas.
Suggested Questions 1. How valid is the cost of future cleanup of
the soil contaminated by the locomotive dripping oil and grease onto the soil? What additional information would you require before including this cost in a “return on investment” (ROI) analysis for the installation of the collection pans under the locomotive?
2. Identify your criteria for failure costs and
explain how you would classify the total cost of the waste-water facilities. Is it a failure or a prevention cost? What are the best arguments for and against using the cost
Chapter 17 - The Management and Control of Quality
17-24
of the waste-water facilities to justify the higher cost of biodegradable soaps and solvents?
3. Looking at the trend in waste water
standards established by the Environmental Protection Agency (EPA), would you feel comfortable closing these facilities permanently? Why or why not?
4. How realistic is it to hold a manager
responsible for reducing the company’s operating costs to a “World Class” standard as indicated by the disposal of contaminated soil example? What additional information would you like to have before basing your salary increase on meeting such a target?
5. Put yourself in the place of an external
auditor working for a public accounting firm. Looking at the four situations outlined in the questions above, would you feel obligated to require any notes, disclosures, or comments before issuing an opinion? Under what circumstances would you feel obligated to require a disclosure of the situation?
a. What about the current liability of all
the soil contaminated by past years’ running of locomotives without drip pans?
b. Assume that during the study of the
waste-water treatment plants it was found that none of the plants could handle a five-year rain. The fine for each occurrence was $100,000 for each plant. Would you require a
disclosure contained within the financial statements? Give reasons supporting your position.
6. Looking at the case, what failure costs can
you identify... a. at your place of business? b. at this college or university? c. in the teaching of this course? d. what costs would you assign to each of
the failures you identify? 7. As the Chief Financial Officer (CFO) of the
company, when would you begin to feel uncomfortable assigning costs to these environmental failures? Discuss the ethical questions that would be involved in limited the generation of failure costs that are based upon noncompliance or continued contamination of the environment, resulting in possible violation of future regulations. During your discussion, address how you would minimize the financial liability of potential litigation associated with the production and distribution of asbestos and tobacco products.
8. Under what conditions could you see a cost
of quality (COQ) system working? What are the key enablers of a such as system if attempted in your organization. Discuss the arguments you would use to start or “kill” a COQ system.
9. What are the major differences between a
COQ system as presented in the case and an Activity-Based costing (ABC) system? What are the similarities?
Chapter 17 - The Management and Control of Quality
17-25
Reading 17-1: GE Takes Six Sigma Beyond the Bottom Line
by Gregory T. Lucier and Sridhar Seshadri Imagine working for a company where every employee is required to go through two weeks of intensive training in statistical process control. Then at the end of this training, participants are required to demonstrate proficiency by completing two projects that directly improve either company or customer performance.
On top of that, the company’s website provides 24/7 access to the tools and methodology required to support the quality improvement efforts of more than 300,000 employees world-wide. The site is constantly and consistently measuring and quantifying thousands upon thousands of active projects.
Has your satellite TV system somehow mingled the contents of the business channel with a late-night science fiction film? No. You’re experiencing GE’s Six Sigma quality program, one that has netted the corporation such amazing results that now GE’s customers are clamoring for help. GETTING STARTED Roll back to 1981, when Jack Welch first took the helm at GE and began to transform (or reshape) the company from a $25 billion bureaucratic quagmire into a well-run and highly respected $100 billion giant. Welch understood the “command and control” management approach had run its course and spent the next 20 years resolutely pursuing other options, borrowing best practices, and implementing winning strategies.
Through the remainder of the ‘80s, GE employed corporate-wide streamlining to get the fat out of its organization while maintaining the muscle. In 1989, as the tumult began to settle, Welch realized the need to empower employees and give them a greater level of participation in the decision-making process. Despite a decade of change, the level of hierarchy and top-down communication had remained an impediment. To solve this, Welch launched an initiative known as Work-OutTM, which is designed to facilitate focused decision making, resolve issues, and improve processes. A Work-Out session is
generally led by those closest to a process or issue, with the goal toward finding workable solutions and developing action plans. Work-Out can be used to eliminate unnecessary steps and streamline tasks or to remove barriers between different departments or reporting levels. Built into this process are mechanisms for ensuring management buy-in and follow-through.
Some Work-Out session examples are: • Improving back-office processing with new
financial systems, • Improving internal paperwork flow, and • Streamlining approval processes.
By the mid-’90s it was time to shake things up again, this time with a focus on quality. Not because GE wasn’t performing well, but because feedback from employees convinced the CEO that, despite top- and bottom-line growth, quality wasn’t where it should be.
Welch decided Six Sigma was the way to go. He had learned about Six Sigma from Larry Bossidy, a former GE executive who left to take the helm at Allied Signal, a company then implementing the program. Bossidy introduced Welch to Mikel Harry of the Six Sigma Academy and to this breakthrough strategy for statistical process control. Jack Welch had always maintained that GE must look outside itself to identify and adopt best practices wherever they could be found. So in the spring of 1995, Welch asked Bossidy to share his unique Six Sigma philosophy with GE’s executive council. They were impressed. Welch set targets out past five years and proclaimed Six Sigma the largest, most significant initiative ever undertaken at GE. Since that proclamation, Six Sigma has been implemented aggressively and has become deeply ingrained in the corporation’s culture. The company has deployed the methodology more extensively than any other to date, and maintaining its vitality continues to be a top priority. Throughout GE, there’s a commonly echoed phrase...Six Sigma is “The Way We Work.” Acquiring and using Six Sigma skills is considered a core competency for leadership roles, and each year new “stretch” goals and projects are established.
Chapter 17 - The Management and Control of Quality
17-26
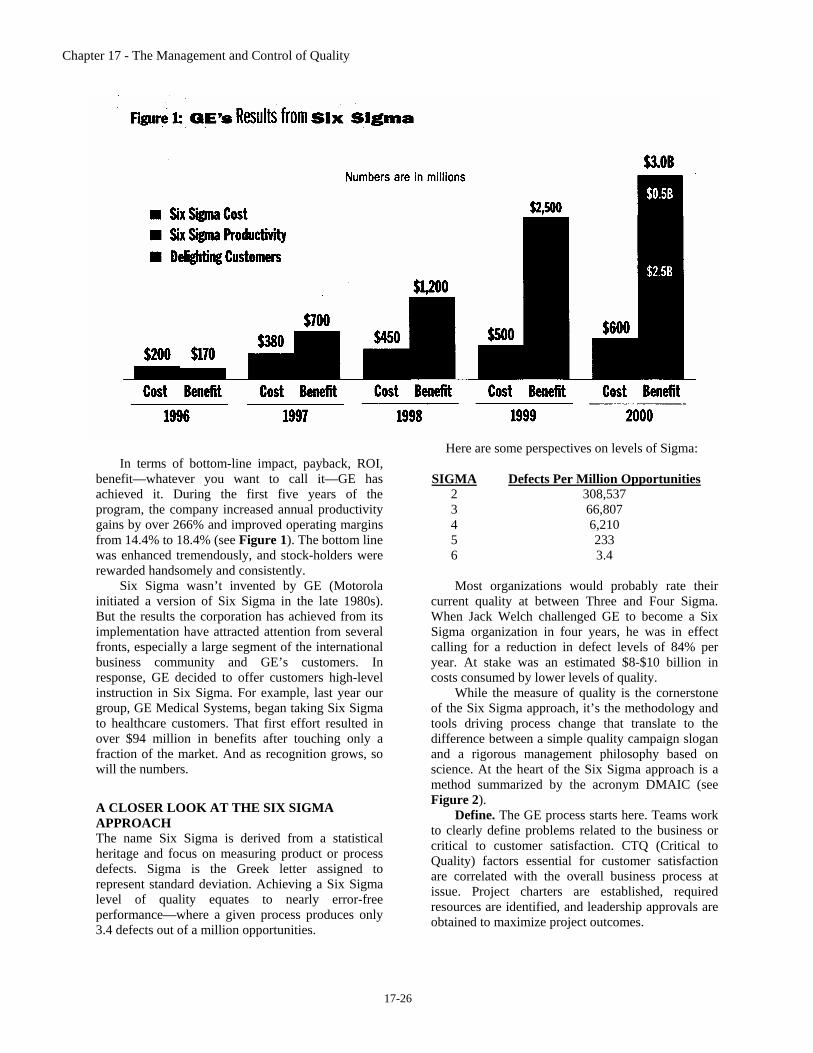
In terms of bottom-line impact, payback, ROI,
benefit—whatever you want to call it—GE has achieved it. During the first five years of the program, the company increased annual productivity gains by over 266% and improved operating margins from 14.4% to 18.4% (see Figure 1). The bottom line was enhanced tremendously, and stock-holders were rewarded handsomely and consistently.
Six Sigma wasn’t invented by GE (Motorola initiated a version of Six Sigma in the late 1980s). But the results the corporation has achieved from its implementation have attracted attention from several fronts, especially a large segment of the international business community and GE’s customers. In response, GE decided to offer customers high-level instruction in Six Sigma. For example, last year our group, GE Medical Systems, began taking Six Sigma to healthcare customers. That first effort resulted in over $94 million in benefits after touching only a fraction of the market. And as recognition grows, so will the numbers.
A CLOSER LOOK AT THE SIX SIGMA APPROACH The name Six Sigma is derived from a statistical heritage and focus on measuring product or process defects. Sigma is the Greek letter assigned to represent standard deviation. Achieving a Six Sigma level of quality equates to nearly error-free performance—where a given process produces only 3.4 defects out of a million opportunities.
Here are some perspectives on levels of Sigma:
SIGMA Defects Per Million Opportunities 2 308,537 3 66,807 4 6,210 5 233 6 3.4
Most organizations would probably rate their
current quality at between Three and Four Sigma. When Jack Welch challenged GE to become a Six Sigma organization in four years, he was in effect calling for a reduction in defect levels of 84% per year. At stake was an estimated $8-$10 billion in costs consumed by lower levels of quality.
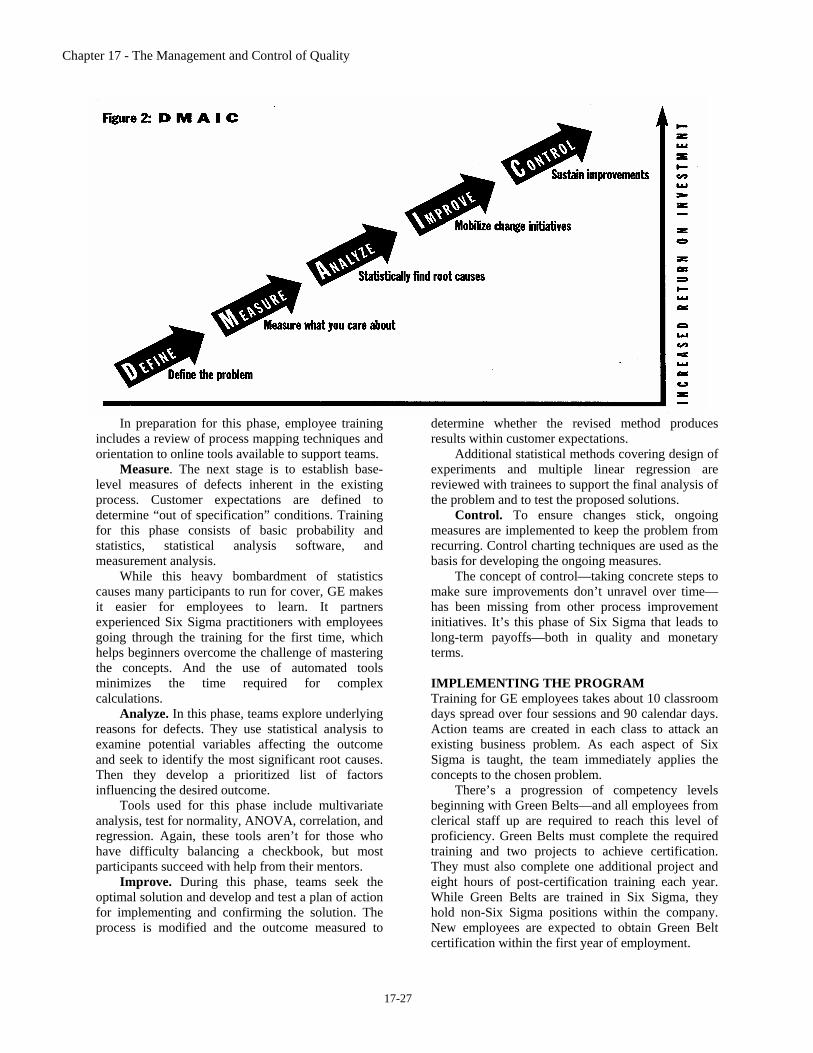
While the measure of quality is the cornerstone of the Six Sigma approach, it’s the methodology and tools driving process change that translate to the difference between a simple quality campaign slogan and a rigorous management philosophy based on science. At the heart of the Six Sigma approach is a method summarized by the acronym DMAIC (see Figure 2).
Define. The GE process starts here. Teams work to clearly define problems related to the business or critical to customer satisfaction. CTQ (Critical to Quality) factors essential for customer satisfaction are correlated with the overall business process at issue. Project charters are established, required resources are identified, and leadership approvals are obtained to maximize project outcomes.
Chapter 17 - The Management and Control of Quality
17-27
In preparation for this phase, employee training includes a review of process mapping techniques and orientation to online tools available to support teams.
Measure. The next stage is to establish base-level measures of defects inherent in the existing process. Customer expectations are defined to determine “out of specification” conditions. Training for this phase consists of basic probability and statistics, statistical analysis software, and measurement analysis.
While this heavy bombardment of statistics causes many participants to run for cover, GE makes it easier for employees to learn. It partners experienced Six Sigma practitioners with employees going through the training for the first time, which helps beginners overcome the challenge of mastering the concepts. And the use of automated tools minimizes the time required for complex calculations.
Analyze. In this phase, teams explore underlying reasons for defects. They use statistical analysis to examine potential variables affecting the outcome and seek to identify the most significant root causes. Then they develop a prioritized list of factors influencing the desired outcome.
Tools used for this phase include multivariate analysis, test for normality, ANOVA, correlation, and regression. Again, these tools aren’t for those who have difficulty balancing a checkbook, but most participants succeed with help from their mentors.
Improve. During this phase, teams seek the optimal solution and develop and test a plan of action for implementing and confirming the solution. The process is modified and the outcome measured to
determine whether the revised method produces results within customer expectations.
Additional statistical methods covering design of experiments and multiple linear regression are reviewed with trainees to support the final analysis of the problem and to test the proposed solutions.
Control. To ensure changes stick, ongoing measures are implemented to keep the problem from recurring. Control charting techniques are used as the basis for developing the ongoing measures.
The concept of control—taking concrete steps to make sure improvements don’t unravel over time—has been missing from other process improvement initiatives. It’s this phase of Six Sigma that leads to long-term payoffs—both in quality and monetary terms.
IMPLEMENTING THE PROGRAM Training for GE employees takes about 10 classroom days spread over four sessions and 90 calendar days. Action teams are created in each class to attack an existing business problem. As each aspect of Six Sigma is taught, the team immediately applies the concepts to the chosen problem.
There’s a progression of competency levels beginning with Green Belts—and all employees from clerical staff up are required to reach this level of proficiency. Green Belts must complete the required training and two projects to achieve certification. They must also complete one additional project and eight hours of post-certification training each year. While Green Belts are trained in Six Sigma, they hold non-Six Sigma positions within the company. New employees are expected to obtain Green Belt certification within the first year of employment.
Chapter 17 - The Management and Control of Quality
17-28
All other “Belts” are 100% Six-Sigma assign-
ments and are selected from the top performers in our talent pipeline: • Black Belts act as technical and cultural change
agents for quality. They are leaders of small teams implementing/executing the Six Sigma method-ology in business-related projects, and they coach Green Belts on their projects. Today there are more than 4,500 Black Belts within GE.
• Master Black Belts teach, mentor, and develop Six Sigma tools and are full-time teachers of the Six Sigma process. Today there are over 800 Master Black Belts within GE.
• Champions back and promote the Six Sigma initiative and work with executives to help drive
initiatives into daily operations and business metrics.
The mentoring structure behind Six Sigma training and the full-time dedication of the Black Belts and Master Black Belts have provided the momentum necessary to complete thousands of projects at GE. THE PAYBACK
To evaluate the payback of the significant commit-ment during the initial five-year implementation, we can look at individual projects and the cumulative results of thousands of projects.
One division recently reduced its annual expense for teleconferencing by $1.5 million encompassing a total of 19 million minutes. Another team cut
Taking Six Sigma to Customers Once we had proof that the system really works, we decided to take Six Sigma beyond internal projects. Our group, GE Medical Systems, is offering its expertise to customers to enhance value and provide additional benefits.
The healthcare industry continues to experience monumental changes and tough challenges. Lower reimbursement, competition, and consolidation have transformed organizations from a 1980s’ model—targeting quality at all costs—to today’s approach where quality and efficiency must be the driving forces in the delivery of care.
In the 1990s, the industry saw a bevy of quality and reengineering consultants attempt to remedy the situation, but such efforts at cost cutting were quickly cancelled by the need to rehire personnel. Old operational habits also died hard for a lack of sustainable change management that should have included—among other elements—skills transfer.
The healthcare industry has quickly responded to the promise of Six Sigma. As of December 2000, GE Medical Systems reported 1,149 active Six Sigma projects for customers. GE even created a service unit expressly dedicated to providing Six Sigma management tools and processes to healthcare organizations requesting more extensive assistance in improving performance.
Is it working? Yes. Commonwealth Health Corporation, a 478-bed medical center in Kentucky, began its journey to implement a Six Sigma improvement culture over three years ago. Results have been overwhelming as the medical center reports a reinvigorated and transformed management culture. Within a mere 18 months, errors in one ordering process were reduced over 90%, overall operating expenses had been reduced by $800,000, and employee survey results had improved by 20%. These results were from a single division within the organization. Now the medical center has realized improvements in excess of $1.5 million and is expanding the program to other areas.
One of the main reasons the program is working is because customers determine project scope, acquire on-site training and tools, and verify the benefits they have received. During last year alone, 466 customer projects were completed that resulted in $91.2 million in customer benefits. Because it relies on rigorous statistical methods and puts control mechanisms in place, Six Sigma actually connects the dots among quality, cost, process, people, and accountability.
Some customers are using GE’S Six Sigma program to achieve even higher measures of success. As part of their Star Initiative, a system-wide performance improvement effort, Virtua Health of Marlton, N.J., saw the Six Sigma program as an opportunity to vault their system to the next level of clinical quality, patient satisfaction, and financial performance. Walter Ettinger, M.D., executive vice president at Virtua, credits the partnership with GE and the use of the Six Sigma program as helping to make vital changes in the organization. “The Six Sigma program has provided everyone in the organization with a common language and toolbox for achieving our objectives. The methodology is sound, and we have begun to get buy-in from our medical staff, who are very results oriented and turned off by initiatives du jour. Our goal is to use Six Sigma to create an outstanding experience for our patients, which is the first priority of our Trustees.”
Chapter 17 - The Management and Control of Quality
17-29
customer order processing time in half. As a rule of thumb, GE managers expect that each project will save between $50,000 and $150,000.
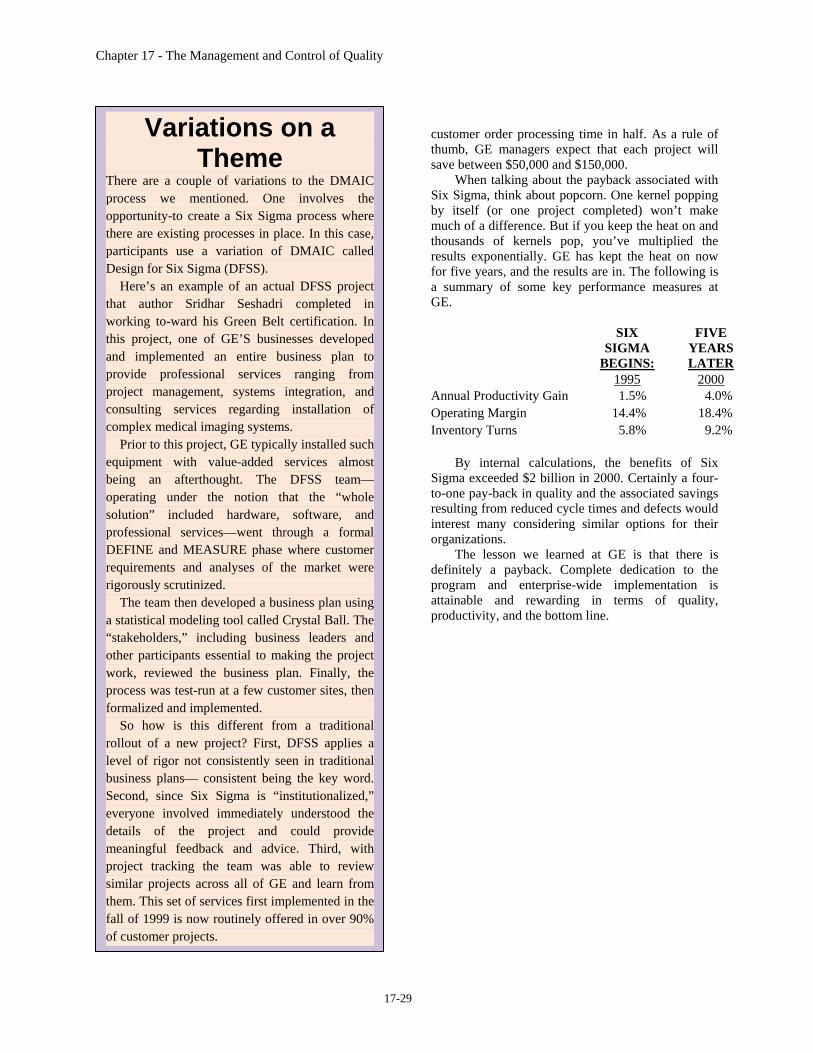
When talking about the payback associated with Six Sigma, think about popcorn. One kernel popping by itself (or one project completed) won’t make much of a difference. But if you keep the heat on and thousands of kernels pop, you’ve multiplied the results exponentially. GE has kept the heat on now for five years, and the results are in. The following is a summary of some key performance measures at GE.
SIX
SIGMA BEGINS:
FIVE YEARS LATER
1995 2000 Annual Productivity Gain 1.5% 4.0% Operating Margin 14.4% 18.4% Inventory Turns 5.8% 9.2%
By internal calculations, the benefits of Six
Sigma exceeded $2 billion in 2000. Certainly a four-to-one pay-back in quality and the associated savings resulting from reduced cycle times and defects would interest many considering similar options for their organizations.
The lesson we learned at GE is that there is definitely a payback. Complete dedication to the program and enterprise-wide implementation is attainable and rewarding in terms of quality, productivity, and the bottom line.
Variations on a Theme
There are a couple of variations to the DMAIC process we mentioned. One involves the opportunity-to create a Six Sigma process where there are existing processes in place. In this case, participants use a variation of DMAIC called Design for Six Sigma (DFSS).
Here’s an example of an actual DFSS project that author Sridhar Seshadri completed in working to-ward his Green Belt certification. In this project, one of GE’S businesses developed and implemented an entire business plan to provide professional services ranging from project management, systems integration, and consulting services regarding installation of complex medical imaging systems.
Prior to this project, GE typically installed such equipment with value-added services almost being an afterthought. The DFSS team—operating under the notion that the “whole solution” included hardware, software, and professional services—went through a formal DEFINE and MEASURE phase where customer requirements and analyses of the market were rigorously scrutinized.
The team then developed a business plan using a statistical modeling tool called Crystal Ball. The “stakeholders,” including business leaders and other participants essential to making the project work, reviewed the business plan. Finally, the process was test-run at a few customer sites, then formalized and implemented.
So how is this different from a traditional rollout of a new project? First, DFSS applies a level of rigor not consistently seen in traditional business plans— consistent being the key word. Second, since Six Sigma is “institutionalized,” everyone involved immediately understood the details of the project and could provide meaningful feedback and advice. Third, with project tracking the team was able to review similar projects across all of GE and learn from them. This set of services first implemented in the fall of 1999 is now routinely offered in over 90% of customer projects.
Chapter 17 - The Management and Control of Quality
17-30
Reading 17-2: Accounting for Quality with Nonfinancial Measures: A Simple No-Cost Program
for the Small Company
Executive Summary: Over the last two decades, large American firms competed in the global arena by applying traditional cost-cutting techniques to justify having to lower prices to match those of foreign firms. In order to make the extensive cost cuts to meet a competitor’s price, product or service quality often was either sacrificed or ignored. As Japan and other countries continued to offer higher-quality goods and services at competitive prices, many large American companies met the challenge and achieved world-class status by adopting total quality management (TQM) programs. TQM programs, although expensive, are not reserved solely for large organizations. Many of the techniques can be easily adapted to fit the small firm. Successful companies today rate customer satisfaction as priority number one, and they direct everything toward increasing it. Customers expect value. To meet this challenge, small firms must provide customers with exactly what they want—high quality at a low price. The small firm can achieve benefits similar to those achieved by large firms with their costly quality programs by using nonfinancial measures to identify and monitor quality. By following the procedures suggested with this simple no-cost program, small firms can increase product or service quality with a minimum of effort. QUALITY COSTS A company needs to understand quality costs before it starts any quality improvement program—especially with the suggested approach of using nonfinancial measures. The cost of quality is a cost classification that encompasses all costs involved in making a firm’s product or delivering a service that meets a customer’s specifications or expectations the first time. The costs include those specifically associated with the achievement (conformance) or non-achievement (nonconformance) of the quality of the product or service. Thus, the costs of quality have two components: (1) the costs of conformance, which are costs incurred to make sure the product or service is right the first time, and (2) the costs of nonconformance, which are costs incurred to correct a problem or irregularity. The components are inversely related. If a company spends money on the costs of conformance, the costs of nonconformance should be reduced. On the other hand, if the company pays little attention to the costs of conformance, the costs of nonconformance should escalate. Most firms that account for quality costs further separate conformance costs into two
subcategories: (1) prevention costs, which are costs to prevent defects and failures initially, and (2) appraisal costs, which are the costs to measure and evaluate products and services to ensure conformance to quality standards. Typically, nonconformance costs also are classi-fied further into two subcategories: (1) internal failure costs, which are costs incurred when defects are discovered before the product is shipped or the service delivered to the customer, and (2) external failure costs, which are costs incurred after delivery of defective goods or services. Examples of typical costs for each of the four subcategories are shown in Table 1. As Table 1 shows, the costs of quality are a significant portion of a product or service’s total cost. Various studies have reported that these costs range anywhere from 25% for manufacturing firms to as high as 40% for service firms. Therefore, quality does have a sizable impact on profits. Although the simple approach presented does not account for costs, it is imperative that users of the approach understand the tremendous impact that quality costs have on profits as well as the inverse relationship of conformance and nonconformance categories.
Chapter 17 - The Management and Control of Quality
17-31
NO-COST APPROACH Measuring and accounting for the costs of quality are expensive, but the process is an essential step in TQM programs. The large firms that achieved world-class status committed the resources to accomplish these tasks, and the results speak for themselves. Most small firms do not have the resources to measure and account for the specific quality costs. If managers of small firms were able to see the importance of applying monetary amounts to their efforts to improve product or service quality, perhaps they might find additional resources. On the other hand, monetary amounts can always be applied to nonfinancial measures at a point in the future when and if resources become available to upgrade a simple quality program to full TQM status. Because the essential key of TQM is to improve quality, the principle of this approach is to identify the activity that needs to be improved and monitor only the nonfinancial element(s) of the activity while not worrying about applying monetary amounts to the measures of the activity. The reasoning for this view is that as the activity is improved, the costs will take care of themselves. Therefore, this simple program for controlling quality is a three-step approach that can be used with any spreadsheet program: (1) identify the appropriate nonfinancial quality measures that should be monitored; (2) record the measures in a spreadsheet on a timely basis; and (3) prepare timely quality reports using the data recorded in the spreadsheet. Identifying Nonfinancial Quality Measures Nonfinancial measures represent information and analyses that are not expressed in monetary equivalents. Management accountants have always been responsible for analyzing nonfinancial data, but the majority of their time was spent on reporting these data in dollars and cents. The principle of this simple approach is to not waste time and effort to report the data in monetary equivalents but to simply report the nonfinancial data and look for trends in the measures. For example, if a small company found that the number of items requiring rework was increasing monthly, then it should take action immediately. If the number of reworked items can be reduced, then costs will be reduced and profits enhanced. The appropriate nonfinancial measures that a manager or owner decides to monitor will be different for each firm
Chapter 17 - The Management and Control of Quality
17-32
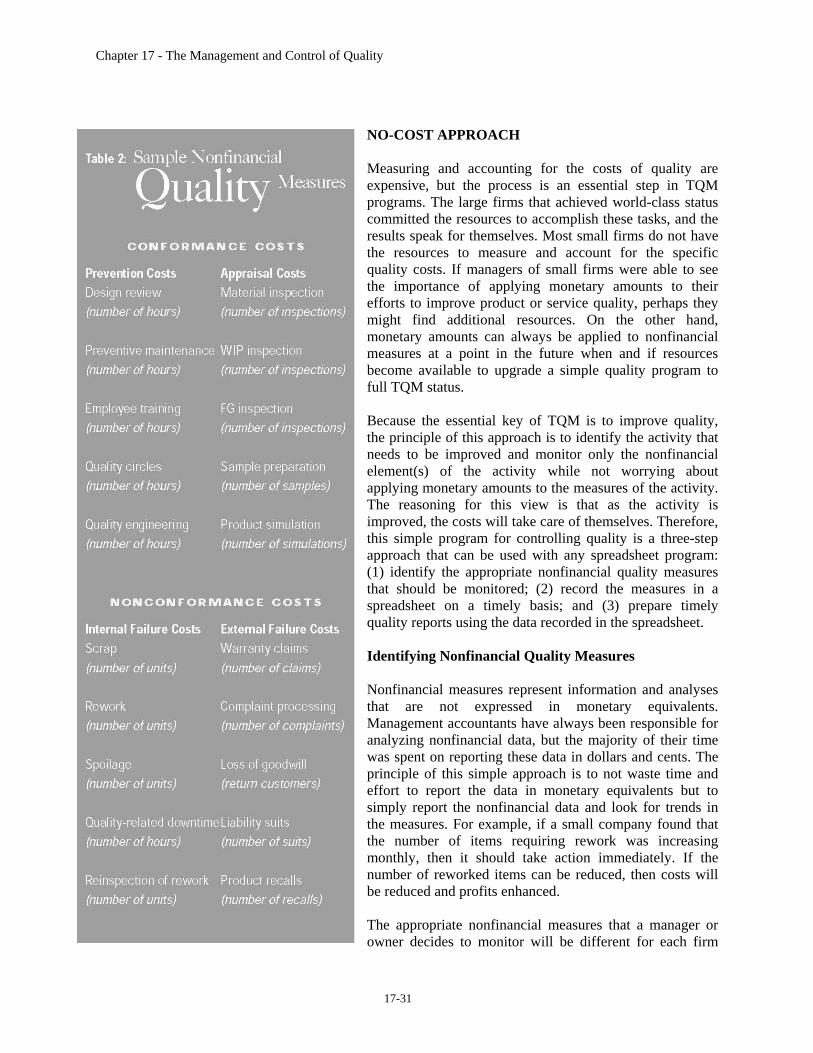
and would be selected after a careful analysis of the complete product or service cycle. For example, some measures, such as customer complaints and warranty claims, will be appropriate for most companies. Other measures, such as trends in throughput time, would be appropriate for manufacturing firms. Users must select those measures that will assist the company with its move toward producing a higher-quality product or service. Even though many firms will select only nonconformance measures to monitor and improve, they should also select conformance measures when possible because of the inverse relationship between the two categories as demonstrated earlier. The more effort expended toward conformance measures typically reduces the effort expended toward fixing a problem or irregularity. The inclusion of a conformance measure, such as preventive maintenance hours or the number of hours of employee training per week, will sometimes be used only to validate the fact that conformance tasks are being done and not necessarily to indicate that the measures should be fixed or improved. The nonconformance measures are those that must be improved and will probably comprise the bulk of a firm’s measures. Table 2 lists one of many possible nonfinancial quality measures for each of the cost categories listed in Table 1. Notice that each measure is in units, hours, or events. Recording the Measures in a Spreadsheet Once the appropriate nonfinancial measures of quality are selected, the measures must be recorded in a table so that the data can be analyzed. Any spreadsheet can be used for this purpose, even though the data could be easily tabulated by hand. A spreadsheet works best because it makes the next step of preparing the report very easy and allows for the presentation of the data in various graphical formats with a minimum of effort.
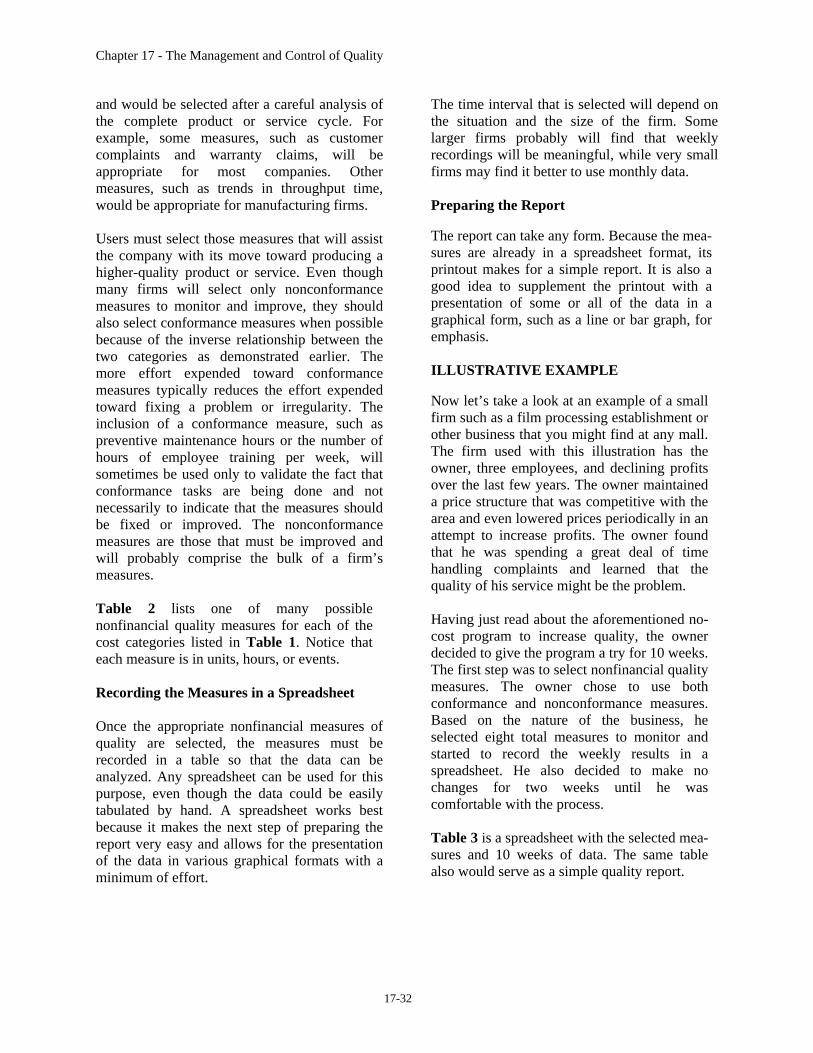
The time interval that is selected will depend on the situation and the size of the firm. Some larger firms probably will find that weekly recordings will be meaningful, while very small firms may find it better to use monthly data. Preparing the Report The report can take any form. Because the mea-sures are already in a spreadsheet format, its printout makes for a simple report. It is also a good idea to supplement the printout with a presentation of some or all of the data in a graphical form, such as a line or bar graph, for emphasis. ILLUSTRATIVE EXAMPLE Now let’s take a look at an example of a small firm such as a film processing establishment or other business that you might find at any mall. The firm used with this illustration has the owner, three employees, and declining profits over the last few years. The owner maintained a price structure that was competitive with the area and even lowered prices periodically in an attempt to increase profits. The owner found that he was spending a great deal of time handling complaints and learned that the quality of his service might be the problem. Having just read about the aforementioned no-cost program to increase quality, the owner decided to give the program a try for 10 weeks. The first step was to select nonfinancial quality measures. The owner chose to use both conformance and nonconformance measures. Based on the nature of the business, he selected eight total measures to monitor and started to record the weekly results in a spreadsheet. He also decided to make no changes for two weeks until he was comfortable with the process. Table 3 is a spreadsheet with the selected mea-sures and 10 weeks of data. The same table also would serve as a simple quality report.
Chapter 17 - The Management and Control of Quality
17-33
After two weeks of recording the data, and before he even thought of printing a report, the owner saw that the number of units that were scrapped and reworked were more than he had realized. He was further surprised by the number of complaints and warranty claims that were submitted. He thought there really was truth to the adage that you must see something in writing to believe it. The owner made his first changes in the third week by requiring an hour of maintenance on the machines and an hour of training for all employees. He also mandated that one shipment each of incoming material and outgoing products would be inspected thoroughly. He noticed an almost instant decline in the number of scrapped and reworked units and complaints.
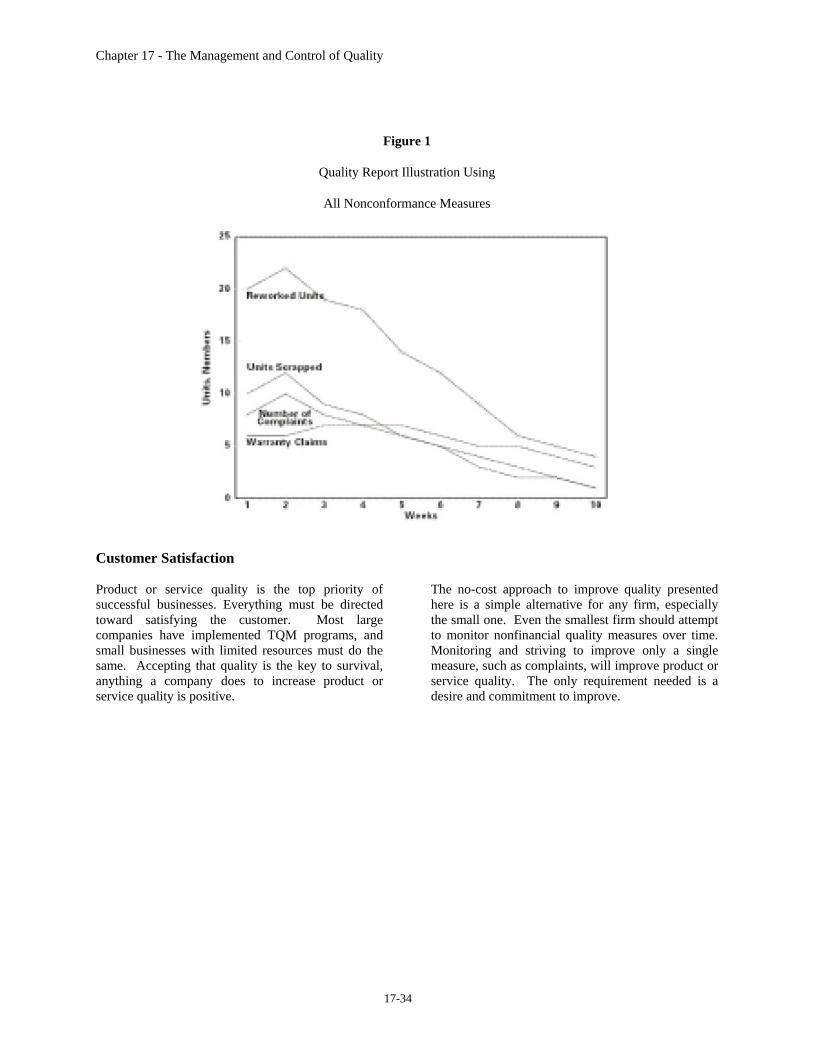
As the weeks stretched out, he increased mainte-nance, training, and inspections. The nonconfor-mance measures continued to improve until the measures were within what he considered acceptable. By the 10th week he was able to adjust downward the maintenance and training hours required. Step three of the program calls for a written report of the data. The owner did nothing more than print the spreadsheet in its present state with the 10 weeks of data. The report looked exactly like it appeared on his computer screen and thus, the same as Table 3. After defining four ranges of data, he printed a line graph of the four nonconformance measures for the 10 weeks to supplement the report. The supplement is shown as Figure 1.
Chapter 17 - The Management and Control of Quality
17-34
Figure 1
Quality Report Illustration Using
All Nonconformance Measures
Customer Satisfaction Product or service quality is the top priority of successful businesses. Everything must be directed toward satisfying the customer. Most large companies have implemented TQM programs, and small businesses with limited resources must do the same. Accepting that quality is the key to survival, anything a company does to increase product or service quality is positive.
The no-cost approach to improve quality presented here is a simple alternative for any firm, especially the small one. Even the smallest firm should attempt to monitor nonfinancial quality measures over time. Monitoring and striving to improve only a single measure, such as complaints, will improve product or service quality. The only requirement needed is a desire and commitment to improve.
Chapter 17 - The Management and Control of Quality
17-35
Reading 17-3: Implementing Corporate Sustainability: Measuring and Managing Social and Environmental
Impacts by Marc J. Epstein
Large and small companies alike have recognized that more effective management of stakeholder impacts and relationships is critical to success. The question of whether or why they should pay attention to issues of social and environmental responsibility is no longer up for discussion. The challenge is how. And it isn’t only the senior corporate managers who are faced with these issues of sustainability implementation. Financial executives play a critical role in developing processes that will lead to improvements in both social and financial performance. Integrating social and environmental impacts into both operational and capital investment decisions requires expertise that typically lies in the finance functions. Accounting and financial analyses that are part of costing, capital investment decisions, and performance evaluations are important components of the business case that must be made to provide information for managerial decisions regarding corporate social responsibility. Implementing strategies for managing corporate social, environmental, and economic impacts (sustainability) is thus an important challenge for senior executives, who are often confronted with how to manage the paradox of improving social and financial performance simultaneously. Business unit and facility managers are pressured to deliver profits, and their performance is typically measured primarily on profits. So there’s significant incentive pressure that can often make it difficult to obtain alignment of strategy, structure, systems, performance measures, and rewards to facilitate effective implementations. Often it’s also difficult to obtain the resources to effectively manage the various drivers of social and environmental performance. What should managers do?
MANAGING CORPORATE SUSTAINABILITY Corporations have become more sensitive to social issues and stakeholder concerns and are striving to become better corporate citizens. Whether the motivation is concern for society and the environment, government regulations, stakeholder pressures, or economic profit, the result is that most managers must make significant changes to manage their social, economic, and environmental impacts more effectively. The best practices in corporate sustainability performance are no longer focused primarily on companies like Ben & Jerry’s or The Body Shop as they were 10 or 20 years ago. Now companies like GE and Wal-Mart (along with many others) are leading the way with significant financial and organizational commitments to social and environmental issues. And all companies, large and small, in high- and low-impact industries, are finding these issues increasingly important. As companies search for ways to improve their performance, determining the best approaches to thoroughly integrate social and environmental concerns into all parts of company operations still causes challenges. These challenges exist because implementing sustainability is fundamentally different from implementing other strategies in an organization.
• For operating goals, the direct link to profit is usually clear.
• For innovation, though long term and also often difficult to predict and measure, the intermediate goal is new products, and the ultimate goal is increased profit.
• For sustainability, the goal is to achieve excellence in both social and financial performance simultaneously. Managing and measuring this paradox creates
Chapter 17 - The Management and Control of Quality
17-36
significant challenges. Since the primary goal of business is to earn a profit, incentive pressures exist that cause managers to make decisions to improve profitability. When actions improve both social and financial performance simultaneously (win-win), this is simpler. But when there’s a significant financial cost in improving social or environmental performance, managers are faced with a dilemma of how to make the choices and which actions to take.
All this means it’s difficult to implement the proper systems to pursue sustainability and to evaluate the impacts of sustainability on financial performance and the tradeoffs that ultimately must be made. Often it’s unclear how tradeoffs between financial and social performance should be made. There is also considerable uncertainty about how shareholders will respond to these tradeoffs. Moreover, the tradeoffs keep changing: Today, shareholders may want the company to place substantial weight on social performance and the environment, and at other times they may want the company to place more weight on short-term profits. Sometimes there are no additional costs—such as when emissions are reduced, which improves both the environment and company cleanup costs—but sometimes being a good corporate citizen does cost more in current costs (though it may still have a big payoff in improved corporate reputation and thus improved sales). The costs of implementing sustainability are also changing constantly. For example, potential technology improvements may reduce equipment costs, so it would be far cheaper to implement pollution reduction processes later rather than at an earlier point in time. Even when a company thinks that sustainability is providing financial benefits, the benefits can, at best, be measured over long time horizons only. This makes it difficult to measure the impact of social and environmental performance and to quantify the resulting benefits. The constant uncertainty about how much sustainability is necessary, the constantly changing emphasis on and costs of implementing sustainability, and the long time
horizons necessary to measure the financial benefits of sustainability make it difficult to implement sustainability in the same way that other corporate strategic initiatives are implemented. To improve the integration of social and environmental impacts into day-to-day management decisions, companies must tie the measurement and reporting of these impacts into decision-making processes. Further, they must measure and report these impacts in financial terms and then integrate them into the traditional investment models. THE CORPORATE SUSTAINABILITY MODEL To implement a sustainability strategy effectively, it’s critical that managers:
• Understand the causal relationships among the various actions that can be taken;
• Understand the impact of these actions on sustainability performance;
• Understand the likely reactions of the corporation’s various stakeholders;
• Understand the potential and actual impact on financial performance;
• Integrate sustainability into operational, strategic, and resource allocation decisions;
• Assist colleagues in managing the paradox of improving social and financial performance simultaneously;
• Recognize that strategy, leadership, and implementation tools are essential components.
To measure their success in achieving a sustainability strategy, companies must understand these interrelationships and establish relevant performance metrics. Then they can improve operational decision making and “make the business case” for a sustainability strategy through a better linking with the ultimate impacts of the strategy on both the company and society. Based on extensive company experiences and academic research, I developed a Corporate
Chapter 17 - The Management and Control of Quality
17-37
Sustainability Model (Figure 1) to describe the drivers of corporate sustainability performance, the actions that managers can take to affect that performance, and the consequences of those actions on both corporate social and financial performance. By carefully identifying and articulating the drivers of social and environmental performance and measuring and managing the broad effects of both good and bad performance on the corporation’s various stakeholders, managers can make a significant contribution to both the company and society. This permits better integration of that information into the day-to-day operational decisions and makes social concerns part of the organization. So far, managers and academics have said that they have found the Corporate Sustainability Model useful. EXPLAINING THE MODEL Let’s take a look at the Corporate Sustainability Model. Inputs include the external context (regulatory and geographical), the internal context (mission, strategy, structure, and systems), the business context (industry sector, customers, and products), and the human and financial resources available to the corporation. These inputs guide the decisions of leaders and the processes that the organization undertakes to improve its sustainability. They provide a foundation for understanding the complex factors that leaders should consider and often take the form of constraints that must be addressed. For example, companies in the chemical business will typically have higher environmental impacts, and those that manufacture in China will have additional product quality, safety, and labor issues (as we have seen in the press recently) that are part of the inputs that may not be easily changed but that impact sustainability. After evaluating the inputs and their likely effects on sustainability and financial performance, leaders can develop the appropriate processes to improve sustainability. The sustainability strategy, structure, systems, programs, and actions have three major sets of impacts: corporate financial costs and benefits of actions, social and environmental impact, and
financial impact through sustainability performance. The managerial actions taken lead to sustainability performance (positive or negative) and stakeholder reactions (outputs) that ultimately affect long-term corporate financial performance (outcomes). Also included in the model are continual feedback loops that leaders can use to evaluate and improve corporate strategies. Managers should customize this general framework to reflect their particular internal, external, or business context. They must map a corporate performance framework that reflects their specific concerns and interests in sustainability performance and that provides rewards for supportive managerial actions. A fundamental aspect of this framework is the distinction between intermediate results and financial outcomes. In Figure 1, Arrow 1 portrays processes that have immediate and identifiable costs and benefits that affect long-term corporate financial performance. Arrow 2, on the other hand, shows the impact of the various inputs and processes on sustainability performance. Arrow 3 shows how corporate financial performance is impacted by stakeholder reactions to corporate sustainability performance. Therefore, intermediate outputs, such as environmental and social performance, public image, employee hiring, and market share, must be monitored to determine the effectiveness of sustainability management practices. Arrow 3 depicts what is often termed “the business case” for sustainability or corporate social responsibility. Whereas Arrow 2 portrays the effect of sustainability actions on social performance, Arrow 3 reflects how, through stakeholder reactions, the social performance affects financial performance. Thus, sustainability or social performance should be seen as both an intermediate output and an outcome. That is, it’s important to understand, measure, monitor, and manage social performance because of concern for societal impacts and for long-term corporate financial performance.
Chapter 17 - The Management and Control of Quality
17-38
The feedback process is an important aspect of the Corporate Sustainability Model that will challenge and change strategies and assumptions. Various mechanisms must be in place so that it doesn’t rely exclusively on the data related to financial performance. Indeed, appropriate management control systems should feed back information on potential environmental and social impacts, sustainability performance (at all organizational levels), sustainability initiatives, stakeholder reactions, and corporate financial performance. INTEGRATING SUSTAINABILITY The costing, capital investment decision, and performance evaluation processes are critical elements in any successful implementation, and the role of the financial executive is central to them. The financial executive can provide significant additional assistance and guidance with the tools described here. He/she can do the required measurements to fit into the capital investment request processes and/or can provide guidance and assistance in how to do the performance measurements to aid in the analysis and decision making. Turning strategy into actions and then into successful performance improvement is accomplished in part through the effective use of various management systems such as human resource management, costing, capital budgeting, performance measurement, and incentive systems. These systems are instrumental in achieving positive sustainability impacts and in improving stakeholder reactions as well as financial performance. They influence innovation, productivity, costs, revenues, capacity availability, and quality. These decisions about the design and implementation of the management systems to put into place help determine the company’s competitive stance and long-term positioning. An evaluation of the cash flows associated with the costs, benefits, and risks associated with alternative decisions is required. A more complete analysis that is aided by the financial professionals can help make the capital investment decision-making process more complete since the costs, benefits, and risks are analyzed and measured
more thoroughly. These are often not measured because the managers aren’t expert in performance measurement and the financial professionals haven’t focused on applying both the financial and nonfinancial measures discussed here—these do improve analysis and decisions. Before investing in a new location, Royal Dutch Shell employs a human rights institute to conduct country risk assessments, highlighting any human rights risks managers should consider when making a decision as to whether to enter the country. Alcoa, like many others, has established a comprehensive capital expenditure review process for environment, health, and safety that analyzes benefits and costs more carefully. Companies are increasingly trying to improve their costing of social and environmental impacts. At Canon, each department bears the financial burden of its own waste processing. With this new program, waste generated by each workplace is collected at a recycling center where the department, type of waste, and amount are recorded. Each department is then assessed a waste processing fee for the waste produced. As companies improve the costing of social and environmental impacts—often using approaches like activity-based costing (ABC)—they gain a better understanding of the complete costs of products, services, processes, and other activities. This can lead to improved understanding and management of both sustainability and financial performance. Corporate incentive and reward systems are often a critical piece of the alignment process. Some companies have developed comprehensive self-assessment programs to focus their organization’s efforts on performance areas that create value for the company’s stakeholders and that help sustain long-term improvements. Then they often establish targets to measure improvements and develop a set of rewards for individuals and teams to reward improved social and environmental performance. Other companies have tied individual performance reviews and compensation
Chapter 17 - The Management and Control of Quality
17-39
explicitly to sustainability performance, establishing social and environmental performance as a critical variable for compensation in incentive systems. For example, Wal-Mart has linked executive bonuses to diversity in its hiring practices. At Shell, environmental and social aspects can be a 20% component of performance measurement and bonuses. As companies move toward more systematic implementation of sustainability, the processes to implement sustainability, including the ones described earlier and measured in Table 1, and the measurement of performance become increasingly important. Whether companies want to bring these factors explicitly or implicitly into performance evaluation and rewards, improved measurement and management are critical. The potential costs, risks, and benefits are increasing, so the measurement and integration of these impacts into capital investment decision systems and return on investment (ROI) calculations, costing systems, and performance measurement systems become increasingly important—as does the role of the financial executive, who has the skills to do the measurements and analysis necessary to improve these decisions and who is the one generally responsible for the capital investment and costing analysis. (A comprehensive approach for the integration of social, environmental, and political issues into capital investment decisions and ROI calculations will be the focus of a related article in next month’s issue.) IMPLEMENTING THE FRAMEWORK AND MEASURING RESULTS Many companies haven’t focused on quantifying the link connecting sustainability actions, sustainability performance, and financial gain and haven’t focused on making the “business case” for corporate social responsibility. Instead, they act in socially responsible ways because they believe it’s “the right thing to do.” Yet programs put in place solely for this reason are vulnerable because they are subject to the whim of shifting public priorities, changing corporate leadership, and financial cycles.
Only by making the “business case” for social and environmental performance can managers truly integrate social and environmental aspects into their business strategies. This is challenging because the costs and benefits of a sustainability strategy aren’t firmly lodged in any one function or business unit. Further, many economic benefits of sustainability initiatives are often seen as intangible and therefore difficult to measure. Measuring hazardous waste generated is relatively straightforward, measuring employee satisfaction is more difficult, and measuring the impact of a company on society is even more difficult. And converting these impacts into monetary terms provides additional challenges. But for each of these we know the number isn’t zero, and each represents an output that relates to the success of a sustainability strategy. Sustainability benefits are also often longer term, making them more challenging to relate to current organizational performance. Nevertheless, the measures are important for management decisions and to facilitate continuous improvement. These systems also provide the proper tools for feedback and corrective actions. Table 1 provides a small sample of measures for the inputs, processes, outputs, and outcomes in the Corporate Sustainability Model. Companies typically select a small number of measures and customize them to meet their corporate strategies. The measures should be quantifiable, in either absolute or percentage terms, as well as complete and controllable. Also, all measures should be clearly linked in a causal relationship. Various tools and techniques are available to measure the different aspects of sustainability performance. For example, customer surveys are powerful tools that help companies better understand the benefit of sustainability investments for increasing revenue or decreasing costs related to their customers. They provide valuable information regarding opportunities to improve overall profitability. Internally, surveys, focus groups, and other techniques are increasingly being used to measure and monitor employee and other stakeholder reactions and provide feedback. Dow Chemical has established community advisory panels in most
Chapter 17 - The Management and Control of Quality
17-40
of the communities in which it has facilities, and they serve as a voice of the community. These panels have suggested a variety of efforts such as emergency response education for residents, community projects, and local hiring. In addition, further statistical analysis should be performed to analyze and test the validity of the customized model. As companies evaluate the initial model’s performance, they will inevitably add links and drop others because there isn’t enough evidence of a strong relationship. This phase is critical because it’s here that a final model emerges and the focus shifts to applying the model to support decision making. Internal and external factors may challenge and change assumptions and strategies. Thus, in light of new information, metrics and links must be continuously updated and reassessed. Although measurement may be imprecise, it certainly is relevant. Social and environmental impacts should be included in ROI calculations for more effective managerial decision-making at all organizational levels. Well designed measurement systems aid in evaluating the impacts of sustainability initiatives on financial performance and the tradeoffs that ultimately must be made when there are many competing organizational constraints and numerous barriers to implementation. ASSETS AND OPPORTUNITIES Without appropriate management systems, corporations may not reap the benefits associated with sustainability performance. The alignment of strategy, structure, management systems, and performance measures is essential for companies to be able to coordinate activities and motivate employees toward implementing a sustainability strategy. This must be viewed over a long time horizon so that both the leading and lagging indicators of performance can be examined. The Corporate Sustainability Model provides a comprehensive approach for examining, measuring, and managing the drivers of corporate sustainability. It has been extensively tested and revised in both academic and
managerial studies and implementations. Managers can use it to gain a greater understanding of the impacts of the various past, pending, and future corporate decisions on both the company and society. And it can help them make a sustainability strategy part of a company’s regular operations and tie it to the specific actions that will improve both sustainability performance and financial performance. A careful identification and measurement of key performance drivers improves the strategy implementation process. This model can provide guidance to both researchers and managers that will help them better analyze and manage these drivers and to manage social and environmental impacts more effectively. Global companies are increasingly faced with difficult dilemmas. Particularly, there is significant pressure to reduce costs in the supply chain. Yet by switching to lower-cost suppliers, various social and environmental impacts may increase, and the reactions from various stakeholders—including employees, customers, regulators, and community activists—may have a detrimental effect on financial performance. Senior management is often faced with complex facility location decisions that in simpler times could be completed by examining differentials in labor, shipping, and raw material costs. Now social, environmental, and political risk must become part of the calculus. The results of corporate decisions are being scrutinized more closely than ever before. Some companies have been ineffective in the development and implementation of a strategy for addressing environmental and social concerns or integrating these issues into day-to-day management decisions. In contrast, leading companies view social and environmental responsiveness as an asset and an opportunity, not as a liability or cost. They recognize that an investment in the structures and systems to ensure strong social and environmental performance often pays dividends in terms of improved process and production quality, improved production efficiency and yields, improved innovation, lower risk, improved reputation, and increased profitability.
Chapter 17 - The Management and Control of Quality
17-41
Marc J. Epstein, Ph.D., is Distinguished Research Professor of Management at Jones Graduate School of Management at Rice University in Houston, Texas. Prior to joining Rice, he was a professor at Stanford Business School, Harvard Business School, and INSEAD (European Institute of Business Administration). He has focused extensively on the implementation of corporate social and environmental impacts for most of his career. One of his 18 books, Measuring Corporate Environmental Performance: Best Practices for Costing and Managing an Effective Environmental Strategy, was originally supported by FAR and published by IMA
in conjunction with Irwin and McGraw-Hill. It won the prestigious AAA/AICPA award for the Notable Contribution to Accounting Literature. This article is adapted from his book, Making Sustainability Work: Best Practices in Managing and Measuring Corporate Social, Environmental and Economic Impacts, that was published this month (January 2008) by Greenleaf Publishing in the U.K. and by Berrett-Koehler Publishers in the U.S. (www.bkconnection.com). You can reach Marc at [email protected].
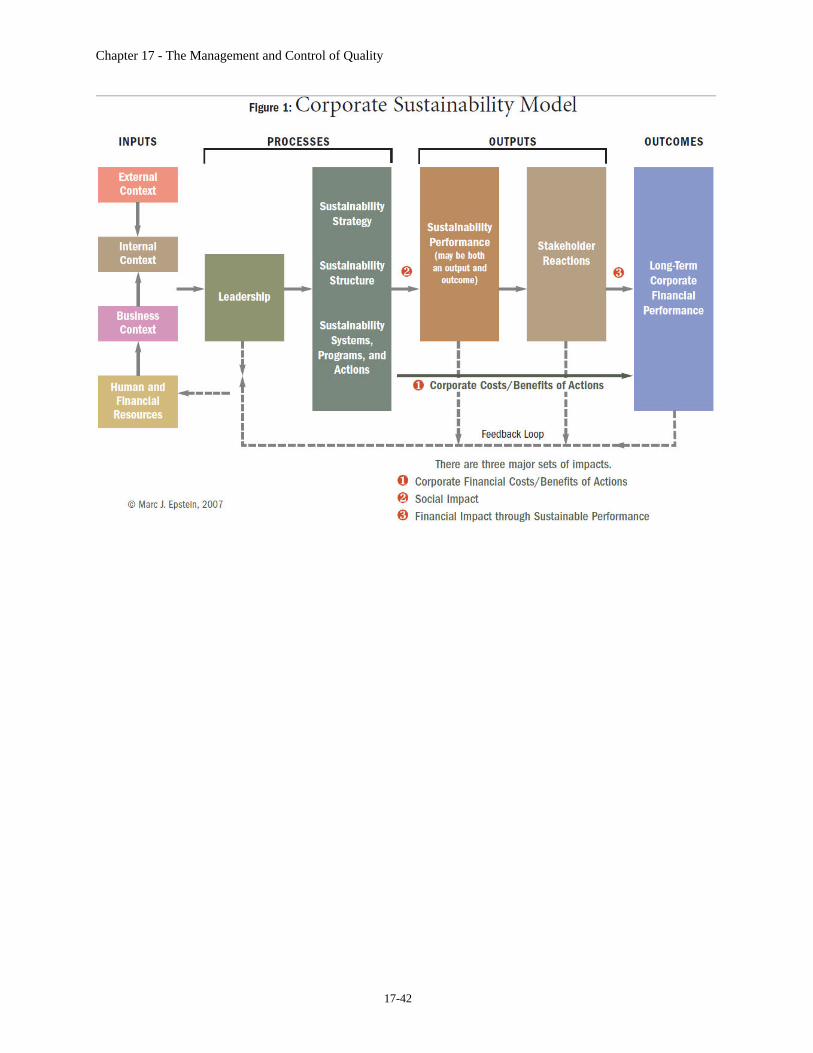
Chapter 17 - The Management and Control of Quality
17-42
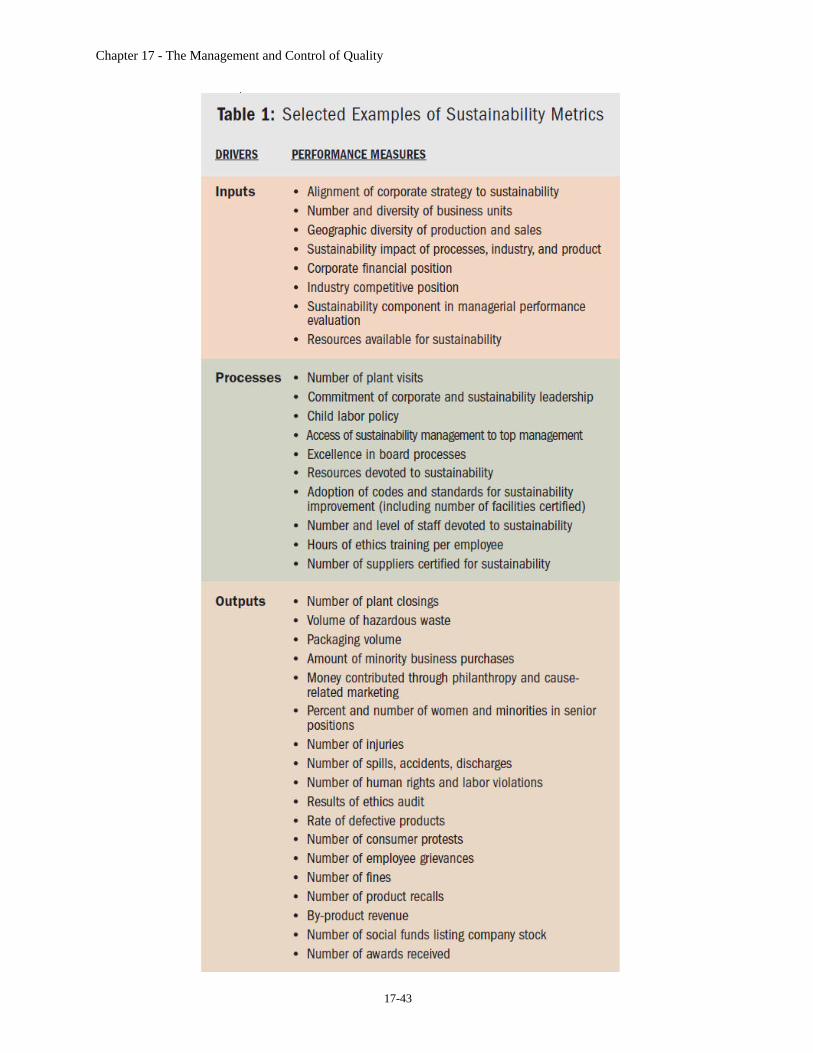
Chapter 17 - The Management and Control of Quality
17-43
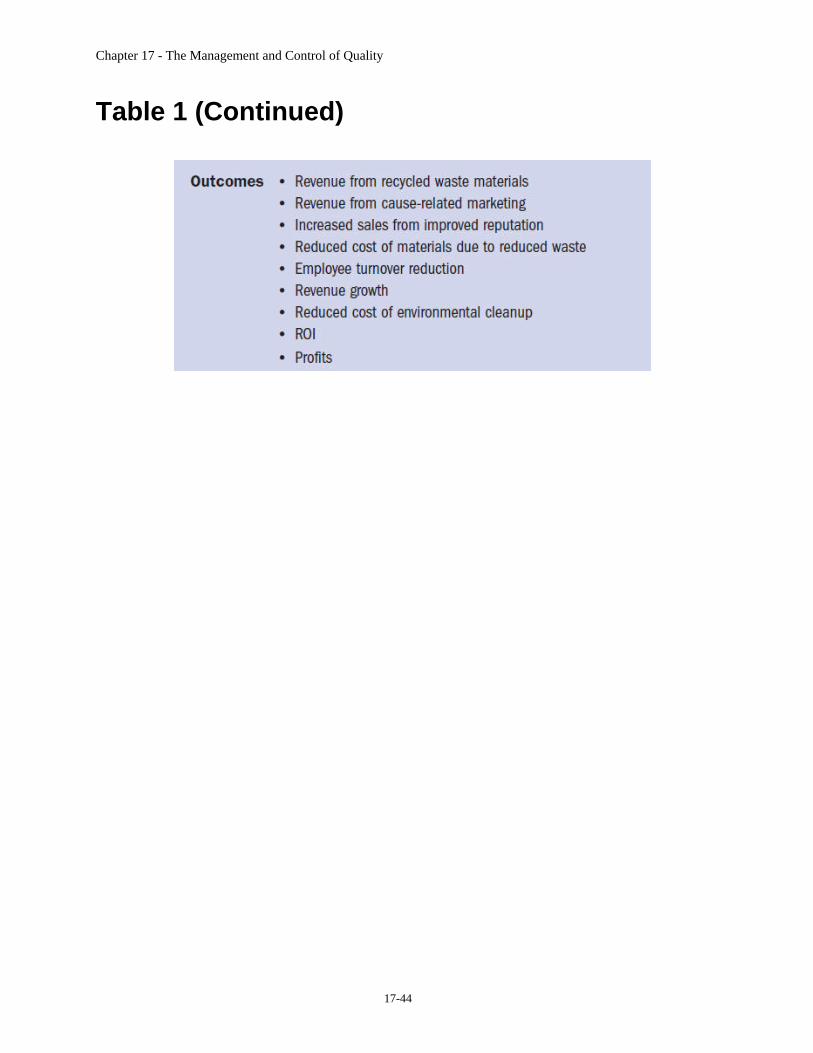
Chapter 17 - The Management and Control of Quality
17-44
Table 1 (Continued)
Companies will often declare that quality
or customer satisfaction is now their
top priority while still obviously need-
ing to deliver financial returns. These
quality goals seem to conflict with the
financial goals and are frequently met
with employee and even supply chain skepticism. This
uncertainty is often a result of past quality efforts that
have been abandoned as financial pressures have, no
doubt, taken top priority or the quality programs haven’t
yielded tangible results.
Fortunately, you can avoid this scenario by under-
standing the cause-and-effect relationship between quali-
ty and financial performance—i.e., the cost of quality
(COQ). COQ is a tool for determining the optimal level
of investment in preventative and appraisal activities that
yield at least offsetting reductions in failure costs while
improving customer satisfaction.
If your company can’t answer the following questions,
then it will benefit from a COQ system.
1. If an improvement in reliability increases customer
satisfaction, where is the point of diminishing returns?
2. What level of quality will optimize both financial
returns and customer satisfaction?
3. How can we align the goal-setting process for business
and quality metrics?
4. To what extent will meeting more of your customer
needs improve revenue or reduce customer turnover,
and, therefore, how much should you be willing to
invest to meet these needs?
5. Do you have any budgetary tools to forecast the finan-
cial impact of necessary quality-improvement goals?
6. How can we make the quality-cost information
actionable?
7. How do we balance the quality of components from
suppliers and their costs?
8. How much is a customer willing to pay for the more
timely receipt of products or services or for more reli-
able products?
COQ has the potential to be a useful tool in optimizing
both quality and financial returns, yet it frequently turns
into a high-level estimate of the costs associated with
poor quality without providing the operational-level
decision-making tools truly needed. Costs are often ana-
lyzed and controlled within each division, while quality
problems, underlying root causes, corrective actions,
related costs, and long-term preventative activities will
span multiple divisions. That’s why it becomes important
to recognize when decisions impacting quality are made
in one division but generate costs in another division,
typically downstream.
Before we continue, what exactly are quality costs?
They’re the costs associated with preventing, appraising,
finding, and correcting defective work (Table 1 provides
more details). Although revenues aren’t directly included
in this definition, they will be factored into any mature
analysis. Quality can certainly impact customer loyalty
and customer acquisition costs.
Figure 1 shows optimal quality costs. There are an infi-
nite number of process designs and investment levels in
conformance activities that will generate differing combi-
nations of the curves in Figure 1 (representing investment
in conformance activities and nonconformance costs).
The optimal combination will generate the lowest total
Management Accounting
MAKING THECOST OF QUALITY PRACTICAL
34 STRATEG IC F INANCE I J u l y 2006
J u l y 2006 I S TRATEG IC F INANCE 35
COQ when adding both sets of
costs together. Finding that
combination is both a
challenge and the goal.
HOW TO DEVELOP ACOQ SYSTEMThere are two general
approaches to developing a
COQ process and system: a top-
down approach that typically
relies on macro esti-
mates of quality
costs or a bottom-up
approach that develops
specific models to esti-
mate costs at a more detailed
level. Typically, you must use a
bottom-up approach if you want your COQ
analysis to yield actionable data and a sufficient
understanding for driving operational decisions.
The only scenario where a top-down approach might
make sense would be when senior management doesn’t
support using a COQ system until they see the magni-
tude of costs involved. In this case, I would use the eight
questions I posed earlier to illustrate the need. If this
doesn’t stimulate senior management commitment, then
you can either take a couple of specific issues and develop
decision-making tools that could become part of a broad-
er COQ system later or develop a top-down macro esti-
mate of quality costs. Later I’ll discuss examples of tools
developed around specific issues that are part of a
bottom-up approach. If
senior management
makes a commitment
to this process after
seeing a macro-level top-
down estimate of quality costs,
then go back and create the
tools and COQ mea-
surement system
from the bottom
up. If your compa-
ny uses activity-
based costing
(ABC), it will make
the development of
the COQ system easier,
but it isn’t a substitute.
Before we look at practical
examples using a bottom-up approach, let’s
discuss customer satisfaction feedback. The other
critical factor that you should integrate into your
analysis is the impact on the customer, both in terms of
customer satisfaction and their cost impact. To drive
internal decision making, many companies create a cus-
tomer satisfaction index (CSI) based on various forms of
feedback to better understand the elements of customer
satisfaction. If your firm has developed any organized
customer feedback and understanding like a CSI, then
you should use it in conjunction with the quality-cost
analysis to guide decision making. Even though some of
these factors will be hard to quantify, you should know
what’s driving customer satisfaction and dissatisfaction.
Y PRACTICAL B Y S T E V E B A L L
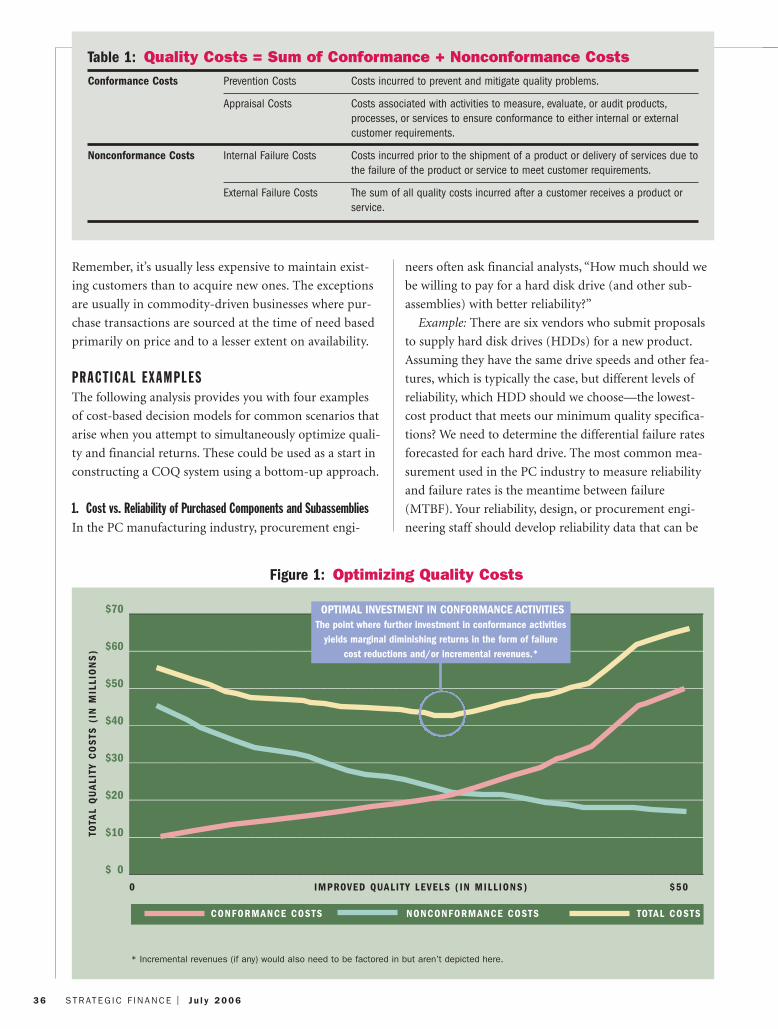
Remember, it’s usually less expensive to maintain exist-
ing customers than to acquire new ones. The exceptions
are usually in commodity-driven businesses where pur-
chase transactions are sourced at the time of need based
primarily on price and to a lesser extent on availability.
PRACT ICAL EXAMPLES The following analysis provides you with four examples
of cost-based decision models for common scenarios that
arise when you attempt to simultaneously optimize quali-
ty and financial returns. These could be used as a start in
constructing a COQ system using a bottom-up approach.
1. Cost vs. Reliability of Purchased Components and Subassemblies In the PC manufacturing industry, procurement engi-
neers often ask financial analysts, “How much should we
be willing to pay for a hard disk drive (and other sub-
assemblies) with better reliability?”
Example: There are six vendors who submit proposals
to supply hard disk drives (HDDs) for a new product.
Assuming they have the same drive speeds and other fea-
tures, which is typically the case, but different levels of
reliability, which HDD should we choose—the lowest-
cost product that meets our minimum quality specifica-
tions? We need to determine the differential failure rates
forecasted for each hard drive. The most common mea-
surement used in the PC industry to measure reliability
and failure rates is the meantime between failure
(MTBF). Your reliability, design, or procurement engi-
neering staff should develop reliability data that can be
36 STRATEG IC F INANCE I J u l y 2006
Table 1: Quality Costs = Sum of Conformance + Nonconformance CostsConformance Costs Prevention Costs Costs incurred to prevent and mitigate quality problems.
Appraisal Costs Costs associated with activities to measure, evaluate, or audit products,processes, or services to ensure conformance to either internal or externalcustomer requirements.
Nonconformance Costs Internal Failure Costs Costs incurred prior to the shipment of a product or delivery of services due tothe failure of the product or service to meet customer requirements.
External Failure Costs The sum of all quality costs incurred after a customer receives a product orservice.
* Incremental revenues (if any) would also need to be factored in but aren’t depicted here.
$70 ________________________________________________________________________________________________
$60 ________________________________________________________________________________________________
$50 ________________________________________________________________________________________________
$40 ________________________________________________________________________________________________
$30 ________________________________________________________________________________________________
$20 ________________________________________________________________________________________________
$10 ________________________________________________________________________________________________
$ 0 ________________________________________________________________________________________________
Figure 1: Optimizing Quality Costs
TOTA
L Q
UA
LITY
CO
STS
(IN
MIL
LIO
NS
)
0 IMPROVED QUALITY LEVELS ( IN MILLIONS) $50
OPTIMAL INVESTMENT IN CONFORMANCE ACTIVITIESThe point where further investment in conformance activities
yields marginal diminishing returns in the form of failurecost reductions and/or incremental revenues.*
CONFORMANCE COSTS NONCONFORMANCE COSTS TOTAL COSTS
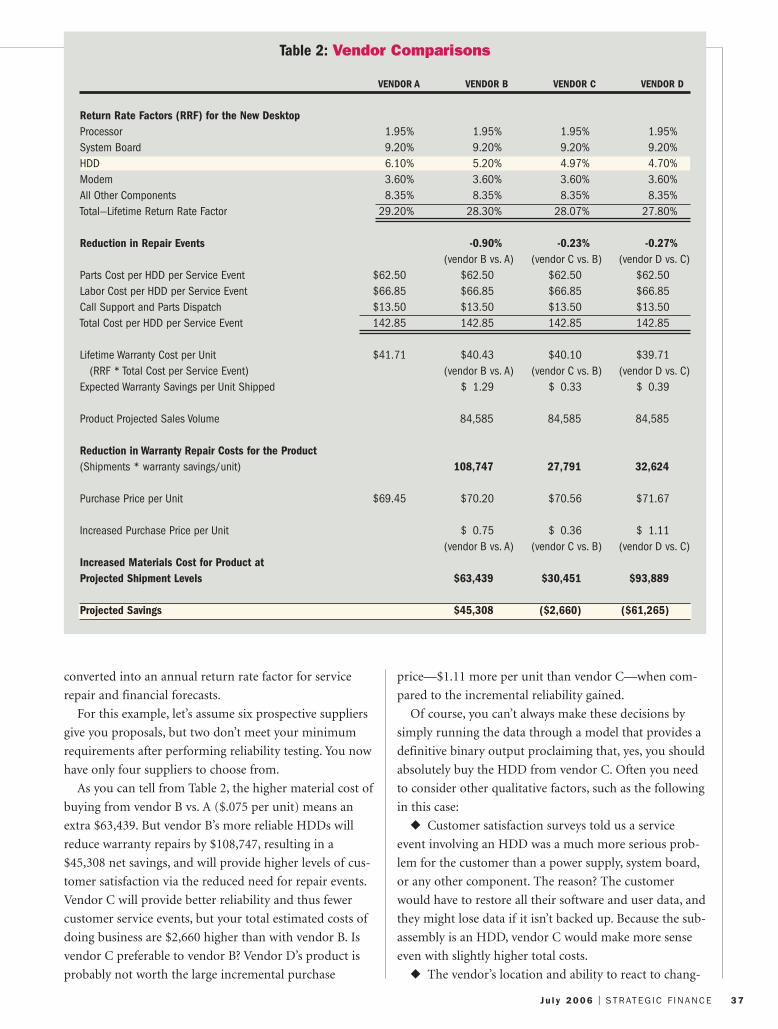
converted into an annual return rate factor for service
repair and financial forecasts.
For this example, let’s assume six prospective suppliers
give you proposals, but two don’t meet your minimum
requirements after performing reliability testing. You now
have only four suppliers to choose from.
As you can tell from Table 2, the higher material cost of
buying from vendor B vs. A ($.075 per unit) means an
extra $63,439. But vendor B’s more reliable HDDs will
reduce warranty repairs by $108,747, resulting in a
$45,308 net savings, and will provide higher levels of cus-
tomer satisfaction via the reduced need for repair events.
Vendor C will provide better reliability and thus fewer
customer service events, but your total estimated costs of
doing business are $2,660 higher than with vendor B. Is
vendor C preferable to vendor B? Vendor D’s product is
probably not worth the large incremental purchase
price—$1.11 more per unit than vendor C—when com-
pared to the incremental reliability gained.
Of course, you can’t always make these decisions by
simply running the data through a model that provides a
definitive binary output proclaiming that, yes, you should
absolutely buy the HDD from vendor C. Often you need
to consider other qualitative factors, such as the following
in this case:
◆ Customer satisfaction surveys told us a service
event involving an HDD was a much more serious prob-
lem for the customer than a power supply, system board,
or any other component. The reason? The customer
would have to restore all their software and user data, and
they might lose data if it isn’t backed up. Because the sub-
assembly is an HDD, vendor C would make more sense
even with slightly higher total costs.
◆ The vendor’s location and ability to react to chang-
J u l y 2006 I S TRATEG IC F INANCE 37
Table 2: Vendor Comparisons
VENDOR A VENDOR B VENDOR C VENDOR D
Return Rate Factors (RRF) for the New DesktopProcessor 1.95% 1.95% 1.95% 1.95%System Board 9.20% 9.20% 9.20% 9.20%HDD 6.10% 5.20% 4.97% 4.70%Modem 3.60% 3.60% 3.60% 3.60%All Other Components 8.35% 8.35% 8.35% 8.35%Total—Lifetime Return Rate Factor 29.20% 28.30% 28.07% 27.80%
Reduction in Repair Events -0.90% -0.23% -0.27%(vendor B vs. A) (vendor C vs. B) (vendor D vs. C)
Parts Cost per HDD per Service Event $62.50 $62.50 $62.50 $62.50Labor Cost per HDD per Service Event $66.85 $66.85 $66.85 $66.85Call Support and Parts Dispatch $13.50 $13.50 $13.50 $13.50Total Cost per HDD per Service Event 142.85 142.85 142.85 142.85
Lifetime Warranty Cost per Unit $41.71 $40.43 $40.10 $39.71(RRF * Total Cost per Service Event) (vendor B vs. A) (vendor C vs. B) (vendor D vs. C)
Expected Warranty Savings per Unit Shipped $ 1.29 $ 0.33 $ 0.39
Product Projected Sales Volume 84,585 84,585 84,585
Reduction in Warranty Repair Costs for the Product(Shipments * warranty savings/unit) 108,747 27,791 32,624
Purchase Price per Unit $69.45 $70.20 $70.56 $71.67
Increased Purchase Price per Unit $ 0.75 $ 0.36 $ 1.11(vendor B vs. A) (vendor C vs. B) (vendor D vs. C)
Increased Materials Cost for Product atProjected Shipment Levels $63,439 $30,451 $93,889
Projected Savings $45,308 ($2,660) ($61,265)
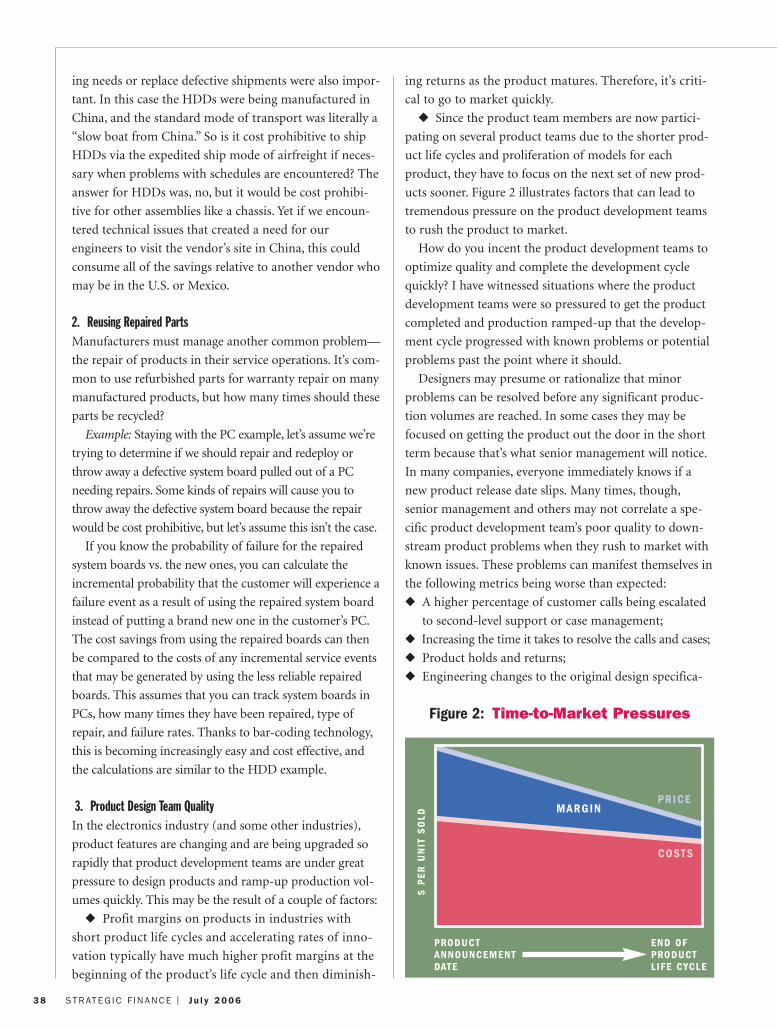
ing needs or replace defective shipments were also impor-
tant. In this case the HDDs were being manufactured in
China, and the standard mode of transport was literally a
“slow boat from China.” So is it cost prohibitive to ship
HDDs via the expedited ship mode of airfreight if neces-
sary when problems with schedules are encountered? The
answer for HDDs was, no, but it would be cost prohibi-
tive for other assemblies like a chassis. Yet if we encoun-
tered technical issues that created a need for our
engineers to visit the vendor’s site in China, this could
consume all of the savings relative to another vendor who
may be in the U.S. or Mexico.
2. Reusing Repaired PartsManufacturers must manage another common problem—
the repair of products in their service operations. It’s com-
mon to use refurbished parts for warranty repair on many
manufactured products, but how many times should these
parts be recycled?
Example: Staying with the PC example, let’s assume we’re
trying to determine if we should repair and redeploy or
throw away a defective system board pulled out of a PC
needing repairs. Some kinds of repairs will cause you to
throw away the defective system board because the repair
would be cost prohibitive, but let’s assume this isn’t the case.
If you know the probability of failure for the repaired
system boards vs. the new ones, you can calculate the
incremental probability that the customer will experience a
failure event as a result of using the repaired system board
instead of putting a brand new one in the customer’s PC.
The cost savings from using the repaired boards can then
be compared to the costs of any incremental service events
that may be generated by using the less reliable repaired
boards. This assumes that you can track system boards in
PCs, how many times they have been repaired, type of
repair, and failure rates. Thanks to bar-coding technology,
this is becoming increasingly easy and cost effective, and
the calculations are similar to the HDD example.
3. Product Design Team QualityIn the electronics industry (and some other industries),
product features are changing and are being upgraded so
rapidly that product development teams are under great
pressure to design products and ramp-up production vol-
umes quickly. This may be the result of a couple of factors:
◆ Profit margins on products in industries with
short product life cycles and accelerating rates of inno-
vation typically have much higher profit margins at the
beginning of the product’s life cycle and then diminish-
ing returns as the product matures. Therefore, it’s criti-
cal to go to market quickly.
◆ Since the product team members are now partici-
pating on several product teams due to the shorter prod-
uct life cycles and proliferation of models for each
product, they have to focus on the next set of new prod-
ucts sooner. Figure 2 illustrates factors that can lead to
tremendous pressure on the product development teams
to rush the product to market.
How do you incent the product development teams to
optimize quality and complete the development cycle
quickly? I have witnessed situations where the product
development teams were so pressured to get the product
completed and production ramped-up that the develop-
ment cycle progressed with known problems or potential
problems past the point where it should.
Designers may presume or rationalize that minor
problems can be resolved before any significant produc-
tion volumes are reached. In some cases they may be
focused on getting the product out the door in the short
term because that’s what senior management will notice.
In many companies, everyone immediately knows if a
new product release date slips. Many times, though,
senior management and others may not correlate a spe-
cific product development team’s poor quality to down-
stream product problems when they rush to market with
known issues. These problems can manifest themselves in
the following metrics being worse than expected:
◆ A higher percentage of customer calls being escalated
to second-level support or case management;
◆ Increasing the time it takes to resolve the calls and cases;
◆ Product holds and returns;
◆ Engineering changes to the original design specifica-
38 STRATEG IC F INANCE I J u l y 2006
$ P
ER
UN
IT S
OLD
PRODUCT ANNOUNCEMENT DATE
END OF PRODUCT LIFE CYCLE
COSTS
PRICEMARGIN
Figure 2: Time-to-Market Pressures
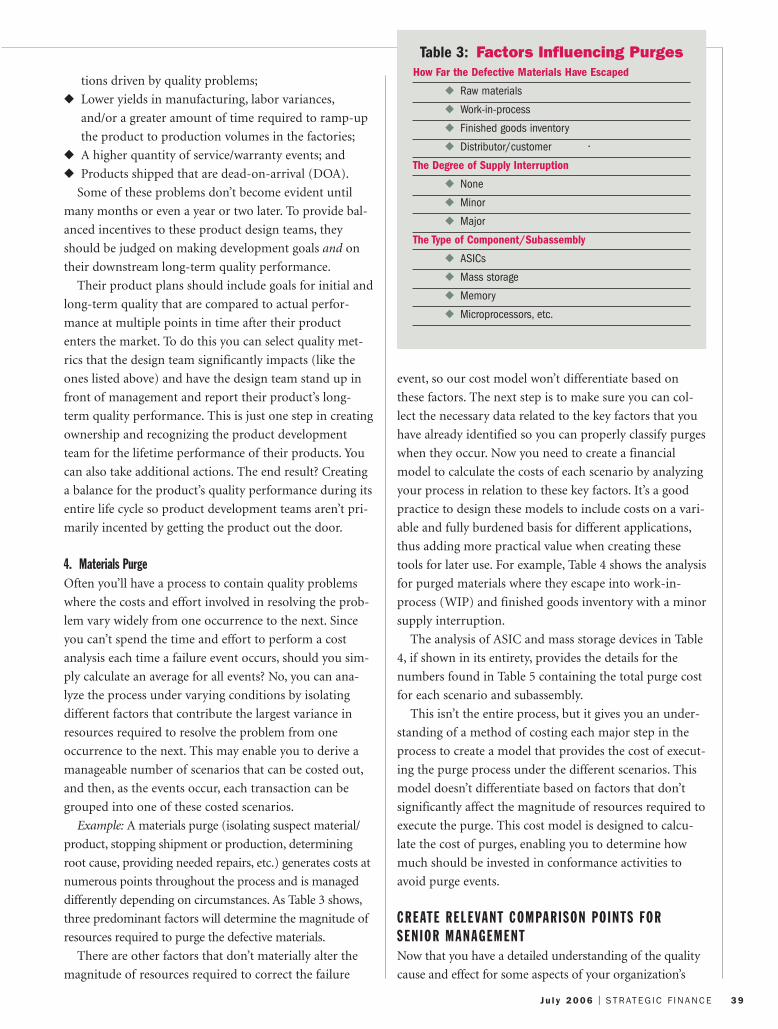
tions driven by quality problems;
◆ Lower yields in manufacturing, labor variances,
and/or a greater amount of time required to ramp-up
the product to production volumes in the factories;
◆ A higher quantity of service/warranty events; and
◆ Products shipped that are dead-on-arrival (DOA).
Some of these problems don’t become evident until
many months or even a year or two later. To provide bal-
anced incentives to these product design teams, they
should be judged on making development goals and on
their downstream long-term quality performance.
Their product plans should include goals for initial and
long-term quality that are compared to actual perfor-
mance at multiple points in time after their product
enters the market. To do this you can select quality met-
rics that the design team significantly impacts (like the
ones listed above) and have the design team stand up in
front of management and report their product’s long-
term quality performance. This is just one step in creating
ownership and recognizing the product development
team for the lifetime performance of their products. You
can also take additional actions. The end result? Creating
a balance for the product’s quality performance during its
entire life cycle so product development teams aren’t pri-
marily incented by getting the product out the door.
4. Materials PurgeOften you’ll have a process to contain quality problems
where the costs and effort involved in resolving the prob-
lem vary widely from one occurrence to the next. Since
you can’t spend the time and effort to perform a cost
analysis each time a failure event occurs, should you sim-
ply calculate an average for all events? No, you can ana-
lyze the process under varying conditions by isolating
different factors that contribute the largest variance in
resources required to resolve the problem from one
occurrence to the next. This may enable you to derive a
manageable number of scenarios that can be costed out,
and then, as the events occur, each transaction can be
grouped into one of these costed scenarios.
Example: A materials purge (isolating suspect material/
product, stopping shipment or production, determining
root cause, providing needed repairs, etc.) generates costs at
numerous points throughout the process and is managed
differently depending on circumstances. As Table 3 shows,
three predominant factors will determine the magnitude of
resources required to purge the defective materials.
There are other factors that don’t materially alter the
magnitude of resources required to correct the failure
event, so our cost model won’t differentiate based on
these factors. The next step is to make sure you can col-
lect the necessary data related to the key factors that you
have already identified so you can properly classify purges
when they occur. Now you need to create a financial
model to calculate the costs of each scenario by analyzing
your process in relation to these key factors. It’s a good
practice to design these models to include costs on a vari-
able and fully burdened basis for different applications,
thus adding more practical value when creating these
tools for later use. For example, Table 4 shows the analysis
for purged materials where they escape into work-in-
process (WIP) and finished goods inventory with a minor
supply interruption.
The analysis of ASIC and mass storage devices in Table
4, if shown in its entirety, provides the details for the
numbers found in Table 5 containing the total purge cost
for each scenario and subassembly.
This isn’t the entire process, but it gives you an under-
standing of a method of costing each major step in the
process to create a model that provides the cost of execut-
ing the purge process under the different scenarios. This
model doesn’t differentiate based on factors that don’t
significantly affect the magnitude of resources required to
execute the purge. This cost model is designed to calcu-
late the cost of purges, enabling you to determine how
much should be invested in conformance activities to
avoid purge events.
CREATE RELEVANT COMPARISON PO INTS FORSENIOR MANAGEMENTNow that you have a detailed understanding of the quality
cause and effect for some aspects of your organization’s
J u l y 2006 I S TRATEG IC F INANCE 39
Table 3: Factors Influencing PurgesHow Far the Defective Materials Have Escaped
◆ Raw materials
◆ Work-in-process
◆ Finished goods inventory
◆ Distributor/customer •
The Degree of Supply Interruption
◆ None
◆ Minor
◆ Major
The Type of Component/Subassembly
◆ ASICs
◆ Mass storage
◆ Memory
◆ Microprocessors, etc.
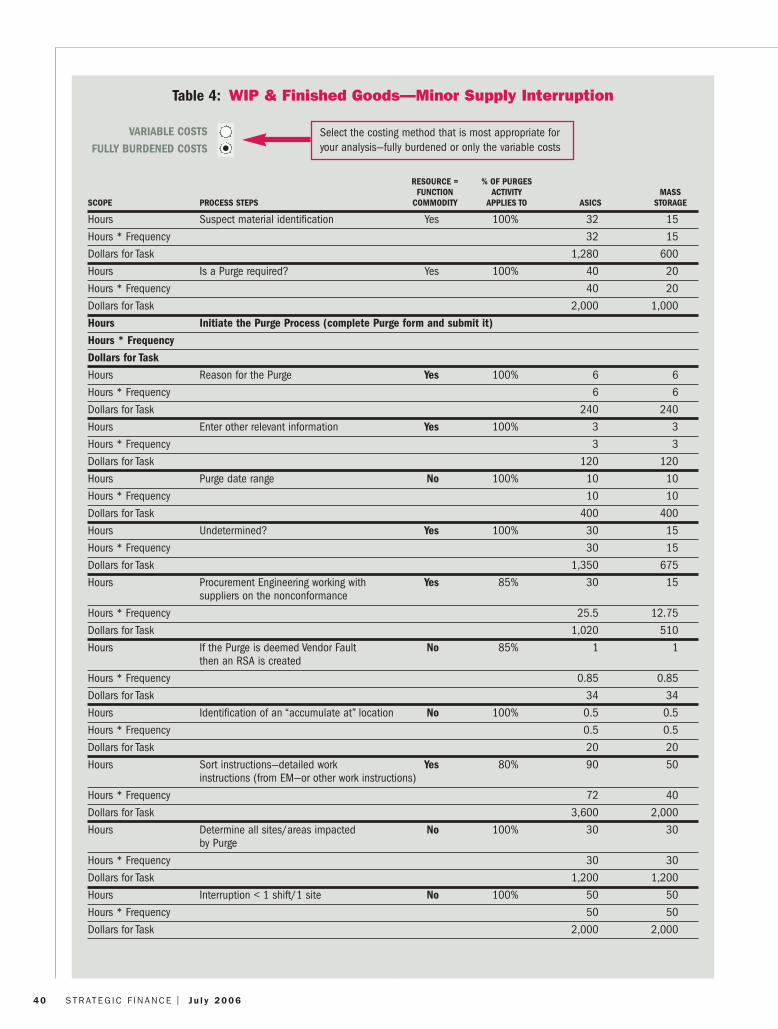
40 STRATEG IC F INANCE I J u l y 2006
Table 4: WIP & Finished Goods—Minor Supply Interruption
VARIABLE COSTS
FULLY BURDENED COSTS
RESOURCE = % OF PURGESFUNCTION ACTIVITY MASS
SCOPE PROCESS STEPS COMMODITY APPLIES TO ASICS STORAGE
Hours Suspect material identification Yes 100% 32 15
Hours * Frequency 32 15
Dollars for Task 1,280 600
Hours Is a Purge required? Yes 100% 40 20
Hours * Frequency 40 20
Dollars for Task 2,000 1,000
Hours Initiate the Purge Process (complete Purge form and submit it)
Hours * Frequency
Dollars for Task
Hours Reason for the Purge Yes 100% 6 6
Hours * Frequency 6 6
Dollars for Task 240 240
Hours Enter other relevant information Yes 100% 3 3
Hours * Frequency 3 3
Dollars for Task 120 120
Hours Purge date range No 100% 10 10
Hours * Frequency 10 10
Dollars for Task 400 400
Hours Undetermined? Yes 100% 30 15
Hours * Frequency 30 15
Dollars for Task 1,350 675
Hours Procurement Engineering working with Yes 85% 30 15suppliers on the nonconformance
Hours * Frequency 25.5 12.75
Dollars for Task 1,020 510
Hours If the Purge is deemed Vendor Fault No 85% 1 1then an RSA is created
Hours * Frequency 0.85 0.85
Dollars for Task 34 34
Hours Identification of an “accumulate at” location No 100% 0.5 0.5
Hours * Frequency 0.5 0.5
Dollars for Task 20 20
Hours Sort instructions—detailed work Yes 80% 90 50instructions (from EM—or other work instructions)
Hours * Frequency 72 40
Dollars for Task 3,600 2,000
Hours Determine all sites/areas impacted No 100% 30 30by Purge
Hours * Frequency 30 30
Dollars for Task 1,200 1,200
Hours Interruption < 1 shift/1 site No 100% 50 50
Hours * Frequency 50 50
Dollars for Task 2,000 2,000
Select the costing method that is most appropriate foryour analysis—fully burdened or only the variable costs
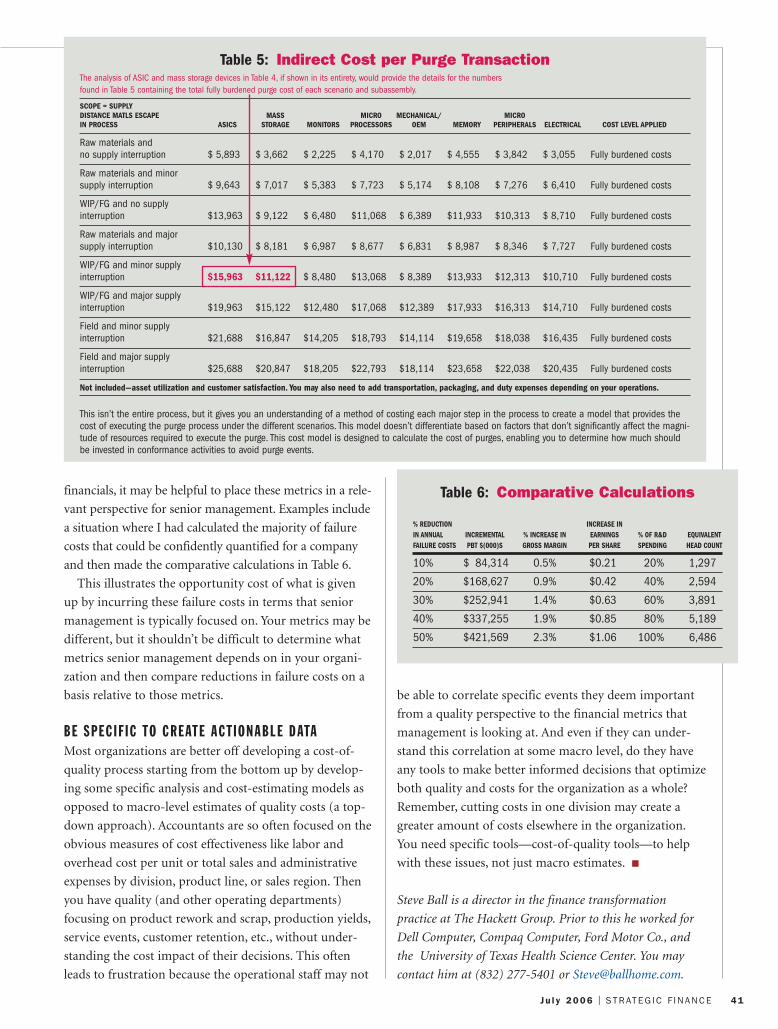
financials, it may be helpful to place these metrics in a rele-
vant perspective for senior management. Examples include
a situation where I had calculated the majority of failure
costs that could be confidently quantified for a company
and then made the comparative calculations in Table 6.
This illustrates the opportunity cost of what is given
up by incurring these failure costs in terms that senior
management is typically focused on. Your metrics may be
different, but it shouldn’t be difficult to determine what
metrics senior management depends on in your organi-
zation and then compare reductions in failure costs on a
basis relative to those metrics.
BE SPEC IF IC TO CREATE ACT IONABLE DATA Most organizations are better off developing a cost-of-
quality process starting from the bottom up by develop-
ing some specific analysis and cost-estimating models as
opposed to macro-level estimates of quality costs (a top-
down approach). Accountants are so often focused on the
obvious measures of cost effectiveness like labor and
overhead cost per unit or total sales and administrative
expenses by division, product line, or sales region. Then
you have quality (and other operating departments)
focusing on product rework and scrap, production yields,
service events, customer retention, etc., without under-
standing the cost impact of their decisions. This often
leads to frustration because the operational staff may not
be able to correlate specific events they deem important
from a quality perspective to the financial metrics that
management is looking at. And even if they can under-
stand this correlation at some macro level, do they have
any tools to make better informed decisions that optimize
both quality and costs for the organization as a whole?
Remember, cutting costs in one division may create a
greater amount of costs elsewhere in the organization.
You need specific tools—cost-of-quality tools—to help
with these issues, not just macro estimates. ■
Steve Ball is a director in the finance transformation
practice at The Hackett Group. Prior to this he worked for
Dell Computer, Compaq Computer, Ford Motor Co., and
the University of Texas Health Science Center. You may
contact him at (832) 277-5401 or [email protected].
J u l y 2006 I S TRATEG IC F INANCE 41
Table 5: Indirect Cost per Purge TransactionThe analysis of ASIC and mass storage devices in Table 4, if shown in its entirety, would provide the details for the numbersfound in Table 5 containing the total fully burdened purge cost of each scenario and subassembly.
SCOPE = SUPPLYDISTANCE MATLS ESCAPE MASS MICRO MECHANICAL/ MICROIN PROCESS ASICS STORAGE MONITORS PROCESSORS OEM MEMORY PERIPHERALS ELECTRICAL COST LEVEL APPLIED
Raw materials and no supply interruption $ 5,893 $ 3,662 $ 2,225 $ 4,170 $ 2,017 $ 4,555 $ 3,842 $ 3,055 Fully burdened costs
Raw materials and minor supply interruption $ 9,643 $ 7,017 $ 5,383 $ 7,723 $ 5,174 $ 8,108 $ 7,276 $ 6,410 Fully burdened costs
WIP/FG and no supply interruption $13,963 $ 9,122 $ 6,480 $11,068 $ 6,389 $11,933 $10,313 $ 8,710 Fully burdened costs
Raw materials and major supply interruption $10,130 $ 8,181 $ 6,987 $ 8,677 $ 6,831 $ 8,987 $ 8,346 $ 7,727 Fully burdened costs
WIP/FG and minor supply interruption $15,963 $11,122 $ 8,480 $13,068 $ 8,389 $13,933 $12,313 $10,710 Fully burdened costs
WIP/FG and major supplyinterruption $19,963 $15,122 $12,480 $17,068 $12,389 $17,933 $16,313 $14,710 Fully burdened costs
Field and minor supply interruption $21,688 $16,847 $14,205 $18,793 $14,114 $19,658 $18,038 $16,435 Fully burdened costs
Field and major supply interruption $25,688 $20,847 $18,205 $22,793 $18,114 $23,658 $22,038 $20,435 Fully burdened costs
Not included—asset utilization and customer satisfaction. You may also need to add transportation, packaging, and duty expenses depending on your operations.
This isn’t the entire process, but it gives you an understanding of a method of costing each major step in the process to create a model that provides thecost of executing the purge process under the different scenarios. This model doesn’t differentiate based on factors that don’t significantly affect the magni-tude of resources required to execute the purge. This cost model is designed to calculate the cost of purges, enabling you to determine how much shouldbe invested in conformance activities to avoid purge events.
Table 6: Comparative Calculations
% REDUCTION INCREASE ININ ANNUAL INCREMENTAL % INCREASE IN EARNINGS % OF R&D EQUIVALENTFAILURE COSTS PBT $(000)S GROSS MARGIN PER SHARE SPENDING HEAD COUNT
10% $ 84,314 0.5% $0.21 20% 1,297
20% $168,627 0.9% $0.42 40% 2,594
30% $252,941 1.4% $0.63 60% 3,891
40% $337,255 1.9% $0.85 80% 5,189
50% $421,569 2.3% $1.06 100% 6,486
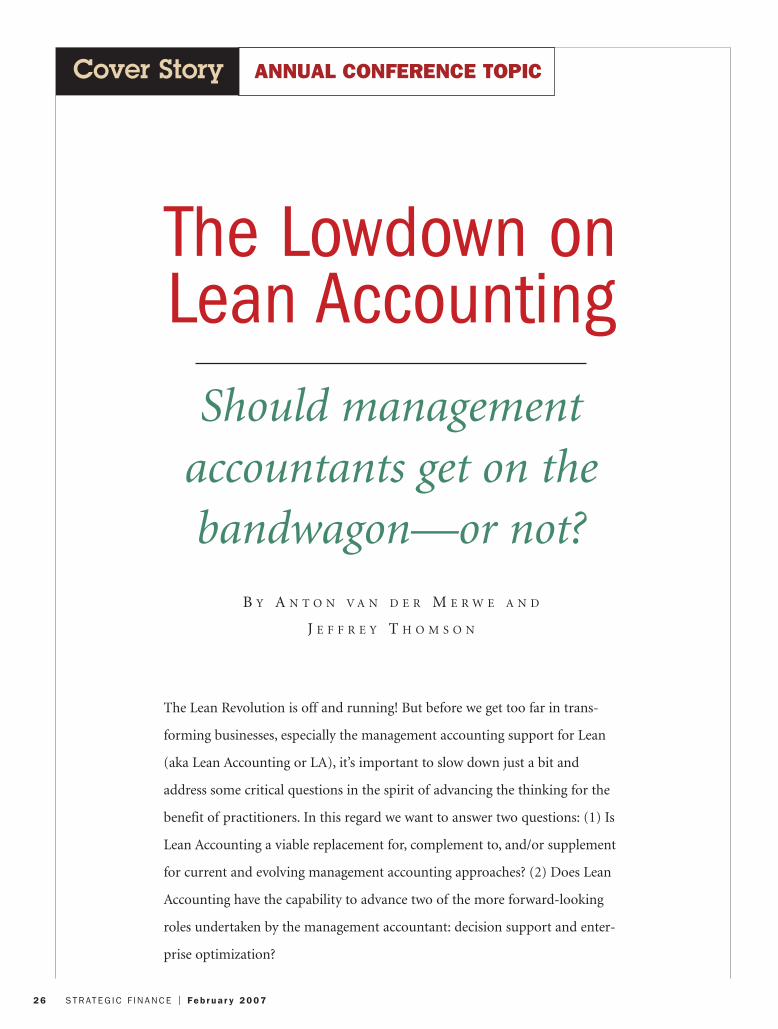
The Lean Revolution is off and running! But before we get too far in trans-
forming businesses, especially the management accounting support for Lean
(aka Lean Accounting or LA), it’s important to slow down just a bit and
address some critical questions in the spirit of advancing the thinking for the
benefit of practitioners. In this regard we want to answer two questions: (1) Is
Lean Accounting a viable replacement for, complement to, and/or supplement
for current and evolving management accounting approaches? (2) Does Lean
Accounting have the capability to advance two of the more forward-looking
roles undertaken by the management accountant: decision support and enter-
prise optimization?
Cover Story
26 STRATEG IC F INANCE I Feb r ua r y 2007
The Lowdown onLean Accounting
Should managementaccountants get on thebandwagon—or not?
B Y A N T O N V A N D E R M E R W E A N D
J E F F R E Y T H O M S O N
ANNUAL CONFERENCE TOPIC
Lean thinking, the foundation for Lean Accounting,
has a history of demonstrable benefit and is likely to have
a significant impact on the U.S. business landscape. Lean
refers to the management system of applying Lean princi-
ples to operations, and Lean Accounting refers to
attempts to derive monetary management information
based on Lean principles. This unique bond between an
operations flow design approach (Lean) and a manage-
ment accounting approach means the process of coming
to terms with LA has a number of distinctive traits. The
management accountant is required to gain an under-
standing of Lean thinking, principles, and practices, and a
manufacturing shop floor emphasis requires that those
from service industries dig a little deeper before they will
be comfortable. A careful scrutiny of LA literature
(books, articles, the Lean Accounting Summit in Septem-
ber 2006, etc.) reveals a number of assertions (and/or
strong implications) related to management accounting
that require technical analysis and broader, more open
debate for the benefit of practitioners. The process of
evaluating LA requires addressing four aspects of the case
for it as presented: (1) LA’s assertions as stated in the lit-
erature, (2) understanding the implications of these
assertions, (3) questioning the operations-centric view of
LA, and (4) evaluating LA’s decision support capabilities.
It’s important to point out up front that the primary
purpose of this article is to provide a fair assessment of
Lean Accounting as viable today or its potential to pro-
vide benefit in the transformation of the profession. In
the “Lean land rush,” many assertions have been made
that can easily be construed as declarative statements of
fact: Accounting is the problem, other approaches have
no place in the world of Lean, and more. These state-
ments have been made in numerous Lean articles and
books, at the Lean Accounting Summit, and in other
forums. When they previewed this article, thought leaders
in the Lean Accounting community questioned whether
the three assertions included for elaboration would result
in a distorted view of or misinformation with regard to
Lean Accounting. We subsequently provided references
that point to the pervasiveness of these assertions in the
LA discourse. As we already said, we believe that “Lean
thinking” has real transformational potential but that
broader perspectives, fewer declarative statements lacking
empirical evidence, and open debate including technical
analysis are required if management accounting practi-
tioners are to benefit in the end. (You can view and
download presentations from the Lean Accounting Sum-
mit at www.leanaccountingsummit.com/
2006presentations. These materials provide background,
cases, and more and, in some cases, the “assertions” that
we keep referencing.)
Our concern isn’t with Lean “extremism” in terms of
its potential to help transform the profession—it’s with
those who suggest that Lean Accounting is THE ONLY
answer. We strongly believe that exploration, understand-
ing potentially complementary management accounting
approaches, and fact-based discussion will help achieve
the ultimate objective: providing transformation
approaches to help practitioners in an increasingly com-
plex and competitive business environment. The profes-
sion doesn’t need a repeat of the “ABC cult,” the “EVA
cult,” or “pick your ‘save the world’” cult in the Lean envi-
ronment, so this article is intended to also serve as an
intervention and a wake-up call for management accoun-
tants to get engaged from a leadership and technical
perspective.
COMING TO TERMS WITH LA ASSERT IONSThere are at least three assertions in Lean Accounting
that justify closer scrutiny: (1) Accounting is the problem,
(2) all conversion costs (in Lean Accounting, conversion
costs are defined as all value stream costs except materials
and purchased outside services) are fixed, and (3) claims
for support of external reporting.
Accounting Is the ProblemFirst, in the reasoning by some in the Lean movement
that accounting is the problem, LA uses a weak straw per-
son as its target and basis for the call to action—full
28 STRATEG IC F INANCE I Feb r ua r y 2007
Our concern isn’t with Lean “extremism” in terms of its potential to help transform the profession—it’s
with those who suggest that Lean Accounting is THE ONLY answer.
absorption standard costing, which is infamous for its
deficiencies in decision support. In the LA discourse,
examples abound that highlight the perils of arbitrary
indirect cost allocations in full absorption standard cost-
ing. In particular, the dangers of allocating overhead costs
are highlighted. No one objects to the examples sighted
because the credibility of full absorption standard costing
was already demolished by activity-based costing (ABC)
in the 1980s and early 1990s.
Nevertheless, the discussion often proceeds as if full
absorption standard costing and all other traditional
approaches are equally flawed. But the fact is that a tradi-
tional approach like direct costing doesn’t absorb any
overhead or even fixed costs; an approach like Resource
Consumption Accounting (RCA) makes no arbitrary
assignments at all—i.e., the principle of causality governs
every assignment (the word “allocate” refers to arbitrary
cost mapping and the word “assign” to cost mapping
based on cause-and-effect relationships—i.e., applying
the principle of causality); and ABC has made advances
in better understanding capacity costs and simplified data
collection. In addition, many management accountants
(including one of the authors, who was an SBU CFO at a
large telecom) have used ABC for “process costing”—
integrated cross-functional processes tied together to pro-
duce an output (similar to LA’s value stream). Making
comparisons to a weak sister (full absorption costing)
and putting all advances of the past 20 years into the
same trash bin aren’t in the spirit of fact-based debate on
behalf of the practitioner. We have long stated that the
management accounting profession needs to accelerate its
transformation to increase its relevance, but comparisons
to methods everyone knows are weak and to the “accoun-
tant” from 20 years ago (numbers cruncher in the back
office vs. strategic business partner on the front lines of
decision making) create an artificially wide gap between
the current and aspirational states of the profession.
All Conversion Costs Are Fixed Second, the assertion—or very strong implication—in
the LA literature that all conversion costs are fixed isn’t
unique to Lean Accounting. The Theory of Constraints
(TOC) can probably be credited with this view of cost
behavior. This view is a hallmark of so-called simple solu-
tions to management accounting and typically considers
material cost as the only cost relevant to a whole host of
decisions. As we will show, what’s implied is that these
“fixed costs” are actually unavoidable costs. This practice
(the “blended cost concept error”) confuses operational
cost concepts (fixed and variable) with decision cost con-
cepts (unavoidable and avoidable).
This error is least detrimental for decisions dealing
with small changes within the relevant range when the
two sets of cost concepts more closely align (e.g., a vari-
able cost isn’t that different from an incremental cost).
But wider-ranging decisions that affect step-fixed cost
relationships pose a serious challenge because the avoid-
able cost in these instances comprises both fixed and
variable costs. The blended cost concept error results in
understating the benefits of wider-ranging decisions and
eliminating these decision options or simply ignoring
them (refer to the make-buy example below). The error
also raises another question for Lean Accounting:
unavoidable under which specific decision scenario? The
principle of “different costs for different purposes” has
been well understood in management accounting for a
very long time.
LA Can Transform External Reporting, TooThird, when it comes to support for external reporting,
Lean Accounting strongly implies that it has the ability to
Feb r ua r y 2007 I S TRATEG IC F INANCE 29
The Lean Accounting Value Stream
Lean Accounting follows the Lean operational princi-
ple of one-touch flow design for the management
accounting information it provides. LA proposes a
single cost collector—the value stream. A value
stream is defined as all the activities required to
bring a product or service from conception through
to the customer, including related information pro-
cessing, logistics, and the collection of money.
From a management accounting perspective, the
total cost of all the resources plus any product
material and outside service costs are included in
the value stream cost object. The value stream
income statement serves as the primary tool in pro-
viding monetary information for decision making and
reflects revenues from which direct material and all
people, machine, and other conversion costs are
deducted to obtain value stream profit. A value
stream profit margin (profit divided by revenue) is
calculated. Although an average product cost is
sometimes calculated, Lean Accounting insists that
product unit cost isn’t necessary—in fact, not
needed—for decision making as a Lean enterprise.
transform traditional financial accounting (external
reporting of financial and notes disclosures based on
GAAP/FASB) just as it aspires to transform management
accounting (decision support, planning, and control). Yet
our review of the existing Lean literature and presenta-
tions at the Lean Accounting Summit reveal that the only
meaningful support in the area of financial accounting is
inventory valuation. Other integration points with finan-
cial accounting are rarely mentioned. Does supporting
them run foul of Lean’s aversion to transaction recording
(too complex; why does the shop floor need transaction-
level detail to run the business?) and LA’s notion of a sin-
gle cost object—its value stream? The need to isolate and
capitalize certain costs (e.g., asset under construction),
collecting and invoicing costs incurred for work done
internally and paid for by an insurer or, similarly, work
paid for by the original equipment manufacturer (OEM)
under warranty or for recalls doesn’t seem to be consid-
ered by LA as “required” complexities under the law (add
Sarbanes-Oxley to the mix).
The problem gets worse in service industries. For exam-
ple, consider a repair facility that receives the customer’s
item (e.g., a jet engine) or healthcare—both
are required to provide the customer a
detailed invoice that’s different for every
item repaired or customer served.
Statement of Financial Accounting Stan-
dards (SFAS) No. 151, “Inventory Costs—
an amendment of ARB No. 43, Chapter 4,”
requires that excess/idle capacity cost be
reported as a period expense and not
absorbed to the product. This also poses a
challenge for Lean Accounting. Excess/idle capacity costs
exclude any variable cost. For example, preventative
machine maintenance is a fixed cost and must be includ-
ed in excess/idle capacity costs, while repairs are consid-
ered a variable cost and would be excluded. We don’t
believe that Lean Accounting can make this distinction
because of its blended cost concept error, which seems to
consider all machine-related costs as fixed.
IMPL ICAT IONS OF THESE INS IGHTS As we said, there seems to be a land rush to grab the gold
mine potential some see in the Lean movement that’s
similar to the ABC land rush of the 1980s and 1990s,
which—at least initially—created clutter and confusion,
not costing advances for practitioners. For example, one
presentation at the Lean Accounting Summit described
rolling outlooks and other means to improve (if not
replace) today’s planning and budgeting processes as
“Lean planning.” An approach to simplify Sarbanes-Oxley
compliance was referred to as “Lean SOX.” Business
process improvement, transformational change, and
elimination of wasteful practices are not the sole domain
of Lean, and expanding the net in this manner impacts
credibility. But the planning and compliance ideas are
good ones and should stand on their own as delivering
transformational value to practitioners.
The assertion that accounting is the problem is too sim-
plistic and impairs the credibility of Lean Accounting as
an evolving body of knowledge with transformational
potential. For example, the claim that accounting causes
undue inventory build-up is obviously a problem in per-
formance measurement and not accounting. The larger
issue, in our view, isn’t accounting per se but the incon-
sistent application of the principle of causality in some
traditional management accounting approaches. As we
indicated, some approaches don’t commit this error, and
the broad guilt-by-association brush that LA applies to
full absorption accounting is invalid.
The Lean Accounting claim for support of external
reporting clearly requires more study,
including an evaluation of the complexity
of fully meeting all requirements. The point
here isn’t that LA violates GAAP. We didn’t
investigate its ability to provide compliance
information in a vanilla manufacturing
environment—given its manufacturing
roots, we presume this isn’t an issue. Our
concern is with a broader application of
Lean principles and LA, e.g., in service
industries such as transportation.
At the very least, open debate and market research
(e.g., case studies of LA beyond the manufacturing shop
floor) into a number of simplistic assumptions underly-
ing LA will have to be undertaken. These include the
practice of blending cost concepts, claims of no need for
transaction logging, and managing the performance of
the entire business (service and/or manufacturing) with
Lean Accounting’s single cost object.
The blended cost concept error has broader implications,
and we will reference some specific examples from the
Lean Accounting literature. The effects of this error gravi-
tate toward inferior decision support because our sense is
that LA spurns operational modeling (the traditional use
of the concepts fixed and variable) in the name of sim-
plicity and the notion that “the shop floor” is the center
of the universe where the “real” decisions are made and
30 STRATEG IC F INANCE I Feb r ua r y 2007
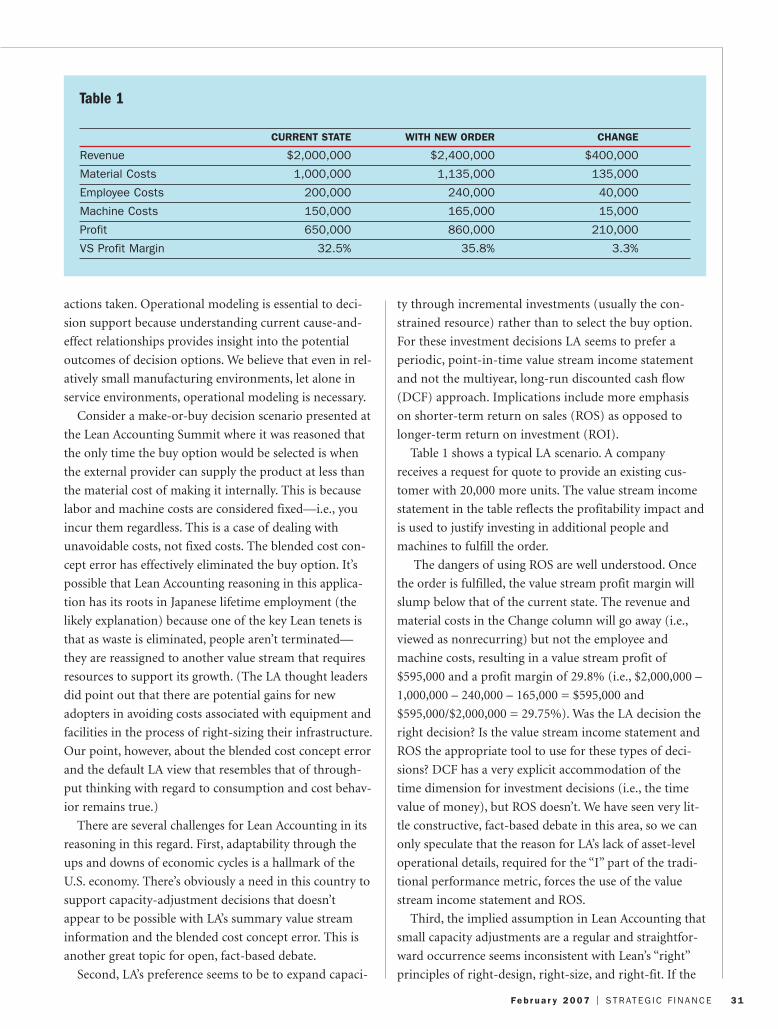
actions taken. Operational modeling is essential to deci-
sion support because understanding current cause-and-
effect relationships provides insight into the potential
outcomes of decision options. We believe that even in rel-
atively small manufacturing environments, let alone in
service environments, operational modeling is necessary.
Consider a make-or-buy decision scenario presented at
the Lean Accounting Summit where it was reasoned that
the only time the buy option would be selected is when
the external provider can supply the product at less than
the material cost of making it internally. This is because
labor and machine costs are considered fixed—i.e., you
incur them regardless. This is a case of dealing with
unavoidable costs, not fixed costs. The blended cost con-
cept error has effectively eliminated the buy option. It’s
possible that Lean Accounting reasoning in this applica-
tion has its roots in Japanese lifetime employment (the
likely explanation) because one of the key Lean tenets is
that as waste is eliminated, people aren’t terminated—
they are reassigned to another value stream that requires
resources to support its growth. (The LA thought leaders
did point out that there are potential gains for new
adopters in avoiding costs associated with equipment and
facilities in the process of right-sizing their infrastructure.
Our point, however, about the blended cost concept error
and the default LA view that resembles that of through-
put thinking with regard to consumption and cost behav-
ior remains true.)
There are several challenges for Lean Accounting in its
reasoning in this regard. First, adaptability through the
ups and downs of economic cycles is a hallmark of the
U.S. economy. There’s obviously a need in this country to
support capacity-adjustment decisions that doesn’t
appear to be possible with LA’s summary value stream
information and the blended cost concept error. This is
another great topic for open, fact-based debate.
Second, LA’s preference seems to be to expand capaci-
ty through incremental investments (usually the con-
strained resource) rather than to select the buy option.
For these investment decisions LA seems to prefer a
periodic, point-in-time value stream income statement
and not the multiyear, long-run discounted cash flow
(DCF) approach. Implications include more emphasis
on shorter-term return on sales (ROS) as opposed to
longer-term return on investment (ROI).
Table 1 shows a typical LA scenario. A company
receives a request for quote to provide an existing cus-
tomer with 20,000 more units. The value stream income
statement in the table reflects the profitability impact and
is used to justify investing in additional people and
machines to fulfill the order.
The dangers of using ROS are well understood. Once
the order is fulfilled, the value stream profit margin will
slump below that of the current state. The revenue and
material costs in the Change column will go away (i.e.,
viewed as nonrecurring) but not the employee and
machine costs, resulting in a value stream profit of
$595,000 and a profit margin of 29.8% (i.e., $2,000,000 –
1,000,000 – 240,000 – 165,000 = $595,000 and
$595,000/$2,000,000 = 29.75%). Was the LA decision the
right decision? Is the value stream income statement and
ROS the appropriate tool to use for these types of deci-
sions? DCF has a very explicit accommodation of the
time dimension for investment decisions (i.e., the time
value of money), but ROS doesn’t. We have seen very lit-
tle constructive, fact-based debate in this area, so we can
only speculate that the reason for LA’s lack of asset-level
operational details, required for the “I” part of the tradi-
tional performance metric, forces the use of the value
stream income statement and ROS.
Third, the implied assumption in Lean Accounting that
small capacity adjustments are a regular and straightfor-
ward occurrence seems inconsistent with Lean’s “right”
principles of right-design, right-size, and right-fit. If the
Feb r ua r y 2007 I S TRATEG IC F INANCE 31
Table 1
CURRENT STATE WITH NEW ORDER CHANGE
Revenue $2,000,000 $2,400,000 $400,000
Material Costs 1,000,000 1,135,000 135,000
Employee Costs 200,000 240,000 40,000
Machine Costs 150,000 165,000 15,000
Profit 650,000 860,000 210,000
VS Profit Margin 32.5% 35.8% 3.3%
whole infrastructure is truly right-sized to the initial fac-
tory outlay, it doesn’t follow that expanding capacity is a
small venture. Moreover, for many industries, capacity
increments don’t always come in right-sized steps. For
example, a commercial airline flight simulator costs
$100M, and there are no right-sized flight simulators.
How is this investment decision supported using LA
principles and information?
MORE QUEST IONSThe argument that management accounting is a model of
the goods and services consumed in operations that pro-
vides insight in related monetary values for decision sup-
port will find no naysayer. Management accounting is
about modeling, and the closer you can get to the thing
being modeled the better. Throughout management
accounting’s history, causality has enjoyed an unquestion-
able position as the overriding modeling principle. For
example, Alexander Church based his 1910 discussion of
the appropriate treatment of excess/idle capacity costs on
cause-and-effect relationships. Traditional thinking rec-
ognizes different sets of principles for operations flow
design (as good or as bad as those might be) and for
deriving monetary management information for decision
support.
The overriding nature of Lean’s “one-piece flow” sim-
plification principle in LA is evident when you consider
the resultant value stream income statement. Causality
apparently isn’t the guiding principle because common
fixed costs (e.g., excess/idle capacity costs) are allocated to
the value stream and used in product-related decisions
(e.g., taking on a new order, outsourcing, make-buy). All
of the costs associated with Lean’s one-piece-flow princi-
ple are considered relevant. Excess and idle capacity may
have little if anything to do with the outputs being pro-
duced by the value stream. In fact, they have more to do
with outputs that weren’t produced.
Again, in the relatively simple environment of a small
manufacturing operation—the “shop floor”—it may be
possible to directly assign soft and hard assets. But given
more complex operations (including service industries)
and customer demands for bundled products and servic-
es (customer micro-segmentation), dynamic shared
resources are a business reality, and causality is critical for
decision-making purposes. This means that the manage-
ment accounting profession must think outside the box
in creating technically sound, efficient business solutions
that support decision making in this complex environ-
ment. One of the basic tenets is for management to
understand the impact of decisions (both strategic and
tactical) on consumption and efficient utilization of
resources throughout the value chain.
DECIS ION SUPPORT WITH LEAN ACCOUNT INGThe culmination of Lean Accounting’s assertions and
application of production-flow design principles to deci-
sion support information is nowhere more aptly illustrat-
ed than looking at a decision scenario presented at the
Lean Accounting Summit. Consider the following example
used to demonstrate LA’s superior decision support capa-
bilities. A company uses a 15% margin percentage hurdle
rate for accepting new orders. Table 2 shows profit margin
percentages for full absorption standard costing and the
value stream for an order received. (Margins are the antic-
ipated margins if the order is accepted; all alternatives use
the same basic cost data but allocate costs differently to
the product and value stream, respectively. The standard
costing gross margin was used in this illustration. No rea-
son was given during the presentation as to why the stan-
dard costing contribution margin wasn’t used.)
Table 2APPROACH FULL ABSORPTION STD COST LEAN ACCOUNTING
Margin Percentage: 6% 24%
As was argued in the session, full absorption standard
costing would turn the order down, and LA shows the
order should be accepted, primarily because LA allocates
less total cost to products than full absorption standard
costing does.
Consider the same scenario with two changes: (1) The
hurdle margin percentage required is 30%, and (2) a
causally derived gross margin is added as shown in Table
3. (The causally derived gross margin is based on assign-
ing costs only to product for which cause-and-effect rela-
tionships can be identified.) Note that a causally derived
margin (using any of a number of existing approaches)
would easily be higher than the value stream profit mar-
gin because the common fixed costs of excess/idle capaci-
ty would be excluded.
Table 3APPROACH LEAN ACCOUNTING CAUSAL MARGIN
Margin Percentage: 24% 32%
With this hurdle rate, Lean Accounting would reject
the order, but an approach that focuses on cause-and-
effect behavior would accept the order. In the original LA
32 STRATEG IC F INANCE I Feb r ua r y 2007
illustration, the price was set by the mar-
ket, which means that using the product’s
contribution margin would be more
appropriate. But Lean Accounting espouses
that product costs and therefore product
profitability aren’t necessary for business
decision making. The point of this simple
example is this: Fact-based debate that
includes operational managers in service environments
and qualified management accountants is a good thing
for advancing the body of knowledge. Declarative state-
ments about the benefits of LA without supporting case
studies or empirical analysis will be seen by practitioners
as selling a solution vs. advancing a solution, especially
those who have been subject to the selling of ABC/EVA/
ERP/BPM/CPM/CRM/ERM…and the beat goes on.
LET ’S CLOSE THE GAPLean thinking has a history of success and the potential
for providing significant benefit to adopters. The princi-
ples of eliminating waste, replacing rather than duplicat-
ing, empowering workers, customer pull vs. company
push, etc. are important tenets to help improve U.S. glob-
al competitiveness. In a world where cross-functional
teams with a strong and independent management
accounting advocate are becoming more prevalent to
drive business performance, the value stream concept to
deliver customer value has the potential to improve busi-
ness performance dramatically.
Let’s summarize our answers to the two central ques-
tions we raised in the introduction. First, is Lean
Accounting ready to replace, complement, or supplement
existing or evolving management accounting approaches/
change initiatives? At best, possibly beyond the shop floor
in a relatively simple manufacturing environment, the
answer is that LA in full deployment is premature until
there is more technical depth and understanding as to
how it supports operational decision making, strategic
planning, and external reporting.
The second central question, “Does LA support deci-
sion making and enterprise optimization?” is probably a
clearer “no” if the center of the universe extends beyond
the shop floor. The goal should be to advance the debate
on these important issues, not dismiss the debate as being
characteristic of old-school accountants who want to go
back to the days of full absorption accounting.
Frankly, we are all too smart for that approach, and
practitioners have no tolerance for creating more clutter
and what seem to be characterized as one-size-fits-all
solutions.
Although “Lean thinking” and the Lean
enterprise have clear potential, the “Lean
Accounting movement” in the U.S. requires
an intervention. We must eliminate declar-
ative statements that suggest that even
exploring the integration of existing or
evolving management accounting change
initiatives isn’t in the spirit of Lean because they are too
complex. Many examples abound, and we see the possi-
bilities for integration on behalf of the practitioner, but
we certainly don’t have all the answers. We do know that
open debate/discussion is required at a more technical
level. Accounting or management accounting isn’t the
root of the problem, but management accountants must
step up and ensure that technically sound solutions are in
place to dramatically improve business performance in an
increasingly complex global market.
We and many others have long maintained that the
management accounting profession must accelerate its
transformation to increase its relevance to management.
Scores of research studies, including those conducted by
the Institute of Management Accountants (IMA®), IBM,
PricewaterhouseCoopers, and CFO magazine, support our
contention that the CFO organization has come a long way
in evolving from simply a counter of wealth to also serving
as a creator of wealth and from strictly performance
reporter to performance contributor. All these studies also
clearly indicate that there is still a large gap between the
current state of reality and aspirations of the profession.
There are many transformational “change initiatives” in the
profession today (ABC/ABM, RCA/GPK, EVA, ERM, bal-
anced scorecard, business intelligence/data mining, the
“rebirth” of Six Sigma and quality assurance, interactive
data, strategy-based planning, budgeting, etc.). A process
predicated on fact-based research and debate and that
addresses the complexities of modern business is much
more likely to be successful and “practitioner friendly.” ■
Anton van der Merwe is a member of Alta Via Consulting,
LLC, in South Lebanon, Ohio. You can reach him at (513)
257-7451 or [email protected].
Jeffrey Thomson is vice president of research at the Institute
of Management Accountants (IMA®). You can reach him at
(201) 474-1586 or [email protected].
Lean is a topic at IMA’s Annual Conference June 16-20.
For details, visit www.imaconference.org.
Feb r ua r y 2007 I S TRATEG IC F INANCE 33
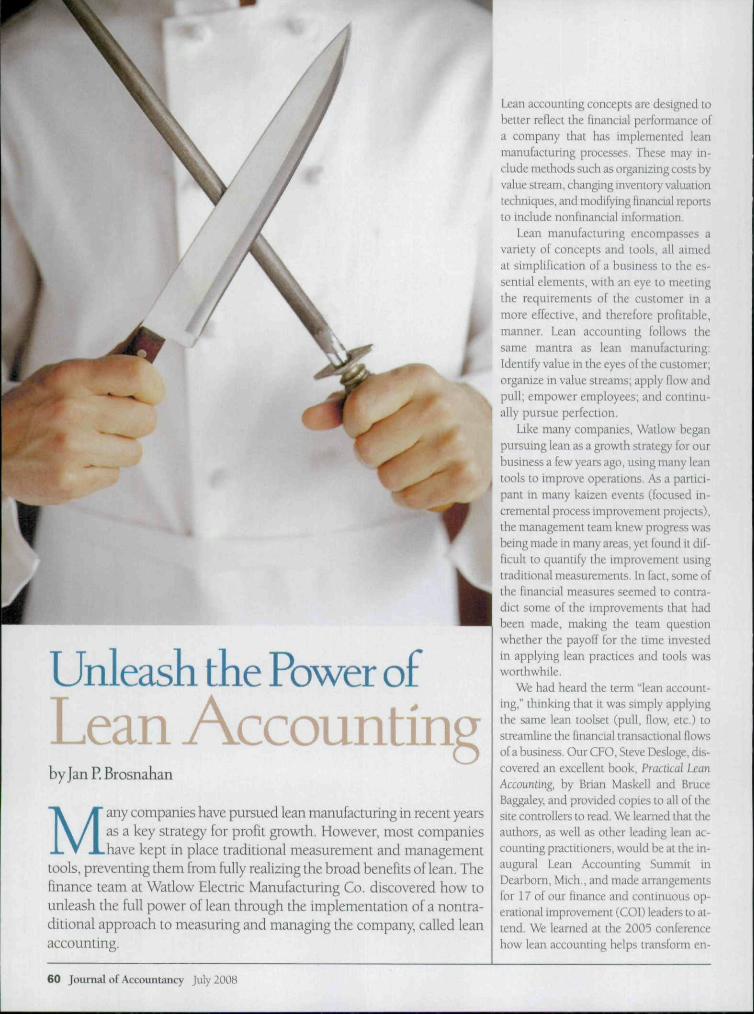
I
m
I
Unleash the Power of
Lean Accountingby [an P. Brosnahan
Many companies have pursued lean manufacturing in recent yearsas a key strategy for profit growth. However, most companieshave kept in place traditional measurement and management
tools, preventing them from fully realizing the broad benefits of lean. Thefinance team at Watlow Electric Manufacturing Co. discovered how tounleash the tuU power of lean through the implementation of a nontra-ditional approach to measuring and managing the company, called leanaccounting.
Lean accounting concepts are designed tobetter reflect the financial performance ofa company thai has implemented leanmanufacturing processes. These may in-clude methods such as organizing costs byvalue stream, changing inventory valuationtechniques, and modifying financial reportsto include nonfinancial informaiion.
Lean manufacturing encompasses avariety of concepts and tools, all aimedai simplification of a business to the es-senilal elements, with an eye to meetingthe requirements of the customer in amore effective, and therefore profitable,manner. Lean accounting follows thesame mantra as lean manufacturing:Identify value in the eyes of the customer;organize in value streams; apply flow andpull; empower employees; and continu-ally pursue perfection,
Like many companies. Watlow beganpursuing lean as a growth strategy for ourbusiness a few years ago, tising many leanli'ols to improve operations. As a partici-ji.int m many kaizen events (focused in-cremental process improvement paijects),lhe management team knew progress wasbf ing made in tnan)' areas, yet found it dif-iicult to quantify the improvement using1 raditional measurements. In fact, some ofthe financial measures seemed to contra-dict some of the improvements that hadbeen made, making the team questionwhether the payotT for the time investedin applying lean practices and tools wasworthwhile.
We had heard the term "lean account-ing," thinking that it was simply applyingthe same lean toolset (pull, flow, etc) tostreamline the financial transactional fiowsof a business. Our CFO. Steve Desloge, dis-covered an excellent book. Practical LeanAccoimling. by Brian Maskell and BruceBaggaley, and provided copies to all of thesite controllers to read. We learned thai theauthors, as well as other leading lean ac-counting practitioners, would be at the in-augural Lean Accounting Summit inDearborn, Mich,, and made arrangementsfor 17 of our finance and continuous op-craiional improvement (COD leaders to at-tend. We learned at ihe 200'i conferencehow lean accounting helps transform en-
60 Journal of Accountancy July 2008
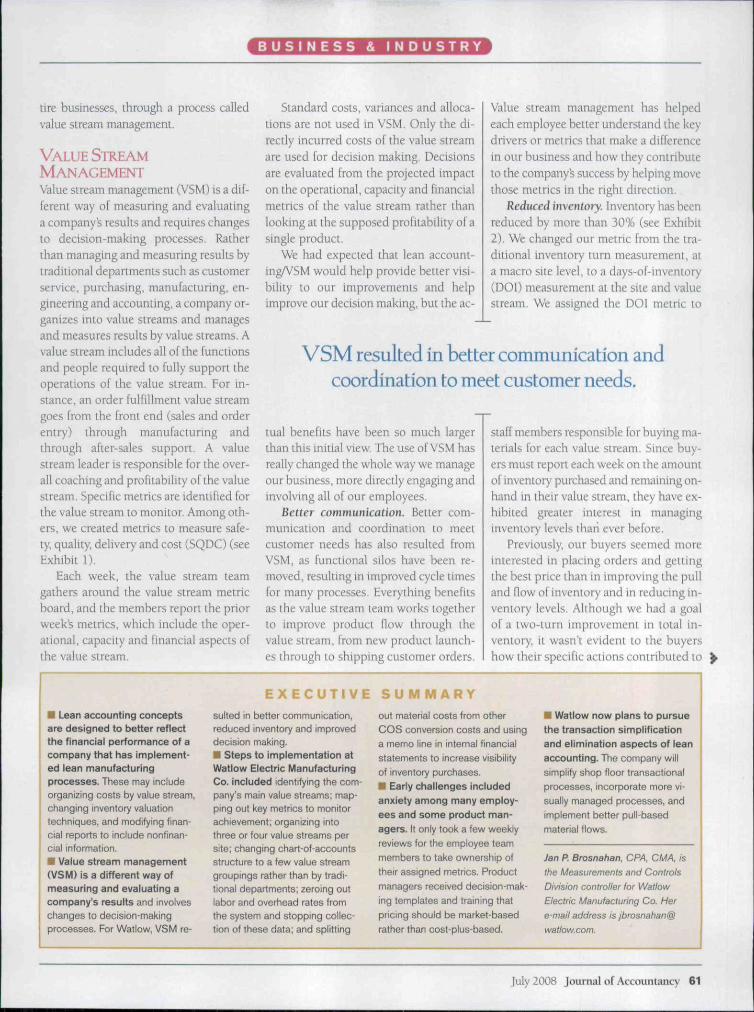
B U S t N E S S & I N D U S T R Y
tire businesses, through a process calledvalue stream management.
VALUE STREAMMANAGEMENTValue stream management (VSM) is a dif-ferent way of measuring and evaluatinga company's results and requires changesto decision-making processes. Ratherthan managing and measuring results bytraditional departments such as customerservice, purchasing, manufacturing, en-gineering and accounting, a company or-ganizes into value streams and managesand measures results by value streams, Avalue stream includes all of the functionsand people required to fully support theoperations of the value stream. For in-stance, an order fulfillment value streamgoes from the front end (sales and orderentry) through manufacturing andthrough after-sales support. A valuestream leader is responsible for the over-all coaching and profilability of ihe valuestream. Specific metrics are identified forthe value stream to monitor. Among oth-ers, we created metrics to measure safe-ty, quality, deliver)' and cost (SQDC) (seeExhibit n .
Each week, the value stream teamgathers around the value stream metricboard, and the members report the priorweek's metrics, which include the oper-alional, capacity and financial aspects oflhe value stream.
Standard cosLs, variances and alloca-tions are not used in VSM, Only lhe di-rectly incurred costs of the value streamare used for decision making. Decisionsare evaluated from the projected impacton lhe operational, capacity and financialmetrics of lhe value stream rather thanlooking at the supposed profitability of asingle product.
We had expected that lean account-ingA/SM would help provide better visi-bility to our improvements and helpimprove our decision making, but the ac-
Value stream management has helpedeach employee better understand lhe keydrivers or metrics ihai make a differencein our business and how they contributeto the company's success by helping movethose metrics in the right direction.
Reduced inventory. Inventory has beenreduced by more than 30% (see Exhibit2). We changed our metric from the tra-ditional inventory mm measurement, ata macro site level, to a days-of-inventory(DOl) measurement at the site and valuestream. We assigned lhe DOl metric to
VSM resulted in better communication andcoordination to meet customer needs.
tual benefits have been so much largerthan this initial view. The use of VSM hasreally changed the whole way we manageour business, more directly engaging andinvolving all of our employees.
Better communication. Better com-munication and coordination to meetcustomer needs has also resulted fromVSM, as functional silos have been re-moved, resulting in improved cycle timesfor many processes. Everything benefitsas the value stream team works togetherto improve product flow through thevalue stream, from new product launch-es through to shipping customer orders.
staff members responsible for buying ma-terials for each value stream. Since buy-ers must report each week on the amountof inventory purchased and remaining on-hand in their value stream, they have ex-hibited greater interest in managinginventory levels than ever before.
Previously, our buyers seemed moreinterested in placing orders and gettingthe best price ihan in improving the pulland flow of inventory and in reducing in-ventory levels. Although we had a goalof a two-turn improvement in total in-ventoiy, it wasn't evident to lhe buyershow their specific actions contributed to
E X E C U T I V E S U M M A R Y• Lean accounting conceptsare designed to better reflectthe financial performance of acompany that has implement-ed lean manufacturingprocesses. These may includeorganizing costs by value stream,changing inveniory valuationtechniques, and modifying finan-cial reports to include nonfinan-cial information.
• Value stream management(VSM) is a different way ofmeasuring and evaluating acompany's results and involveschanges to decision-makingprocesses. For Watlow, VSM re-
sulted in betlBr communication,reduced inventory and improveddecision making.• Steps to implementation atWatlow Electric ManufacturingCo. included identifying the com-pany's main value streams; map-ping out key metrics to monitorachievement; organizing intothree or four value streams persite; changing chart-of-accountsstructure to a few value streamgroupings rather than by tradi-tional departments; zeroing outlabor and overhead rales fromthe system and stopping collec-tion of these data; and splitting
out material costs from otherCOS conversion costs and usinga memo line in intemal financialstatements to increase visibilityof inventory purchases.• Early challenges includedanxiety among many employ-ees and some product man-agers. It only took a few weeklyreviews for the employee teammembers to take ownership oftheir assigned metrics. Productmanagers received decision-mak-ing templates and training thatpricing should be market-basedrather than cost-plus-based.
• Watlow now plans to pursuethe transaction simplificationand elimination aspects of leanaccounting. The company willsimplify shop floor transactionalprocesses, incorporate more vi-sually managed processes, andimplement better pull-basedmaterial flows.
Jan P. Brosnahan, CPA, Ch^A, is
the Measurements and Controls
Division controller for Watlow
Electric Manufacturing Co. tier
e-mail address is jbrosnahan@
July 2008 Journal of Accountancy 61
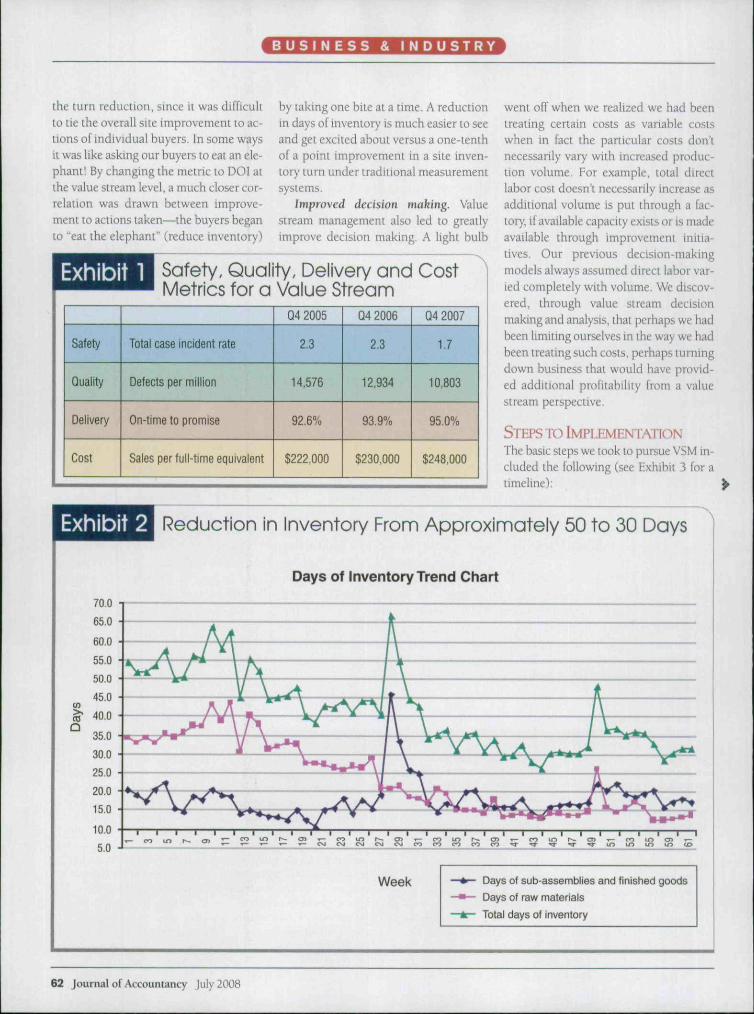
B U S I N E S S & I N D U S T R Y
the turn reduction, since it was difficultto tie the overall site improvement to ac-tions of individual buyers. In some waysit was like asking our buyers to eat an ele-phant! By changing the metric to DOl atthe value stream level, a much closer cor-relation was drawn between improve-ment to actions taken—the buyers beganlo "eat the elephant" {reduce inventory)
by taking one bite at a time. A reductionin days of inventory is much easier to seeand get excited about versus a one-tenthof a point improvement in a site inven-tory turn under traditional measurementsystems.
Improved decision making. Valuestream management also led to greatlyimprove decision making. A Ught bulb
Exhibit 1 Safety, Quality, Delivery and CastMetrics far a Value Stream
Safety
Quality
Delivery
Cost
Total case incident rate
Detects per million
On-time to promise
Sales per full-time equivalent
Q4 2005
2.3
14,576
92.6%
$222,000
Q4 2006
2.3
12,934
93,9%
$230,000
Q4 2007
1.7
10,803
95.0%
$248,000
went off when we realized we had beentreating certain costs as variable costswhen in fact the particular costs don'tnecessarily vary with increased produc-tion volume. For example, total directlabor cost doesn't necessarily increase asadditional volume is put through a fac-tor}', if available capacity exists or is madeavailable through improvement initia-tives. Our previous decision-makingmodels always assumed direct labor var-ied completely wiih volume. We discov-ered, through value stream decisionmaking and analysis, that perhaps we hadbeen limiting ourselves in the way we hadbeen treating such costs, perhaps turningdovm business that would have provid-ed additional profitability from a valuestream perspective.
STEPS TO 1MPI.£MENIATIONThe basic steps we took to pursue VSM in-cluded the following (see Exhibit 3 for atimeline):
Exhibit 2 Reduction in Inventory From Appraximately 50 ta 30 Days
Days of Inventory Trend Chart
70.0
65,0
60.0
Q r^^
Week Days of sub-assemblies and finished goods
Days of raw materials
Total days of inventory
62 Journal of Accountancy July 2008
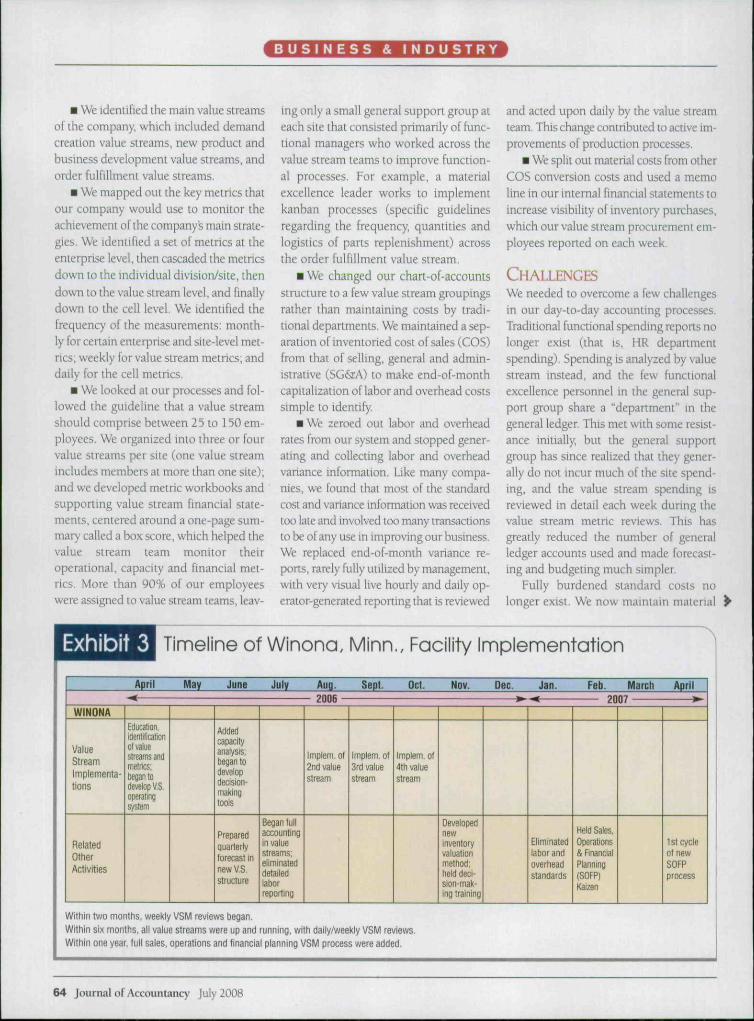
B U S I N E S S & I N D U S T R Y
• We identified the main value streamsof the company, which included demandcreation value streams, new product andbusiness development value streams, andorder fulfillment value streams.
• We mapped out the key metrics lhatour company would use to monitor theachievement of the company's main strate-gies. We identified a set of metrics at theenterprise level, then cascaded the metricsdovra to the individual division/site, thendown to the value stream level, and finallydown to the cell level. We identified thefrequency of the measuremenis: month-ly for certain enterprise and site-level met-rics; weekly for value stream metrics; anddaily for the cell metrics.
• We looked at our processes and fol-lowed the guideline that a value streamshould comprise between 25 to 150 em-ployees. We organized into three or fourvalue streams per site (one value streamincludes members at more ihan one site);and we developed metric workbooks andsupporting value stream financial state-ments, centered around a one-page sum-mary called a box score, which helped thevalue stream team monitor theiroperational, capacity and financial met-rics. More than 90% of our employeeswere assigned to value stream teams, leav-
ing only a small general support group ateach site that consisled primarily of func-tional managers who worked across thevalue stream teams to improve function-al processes. For example, a materialexcellence leader works to implementkanban processes (specific guidelinesregarding the frequency, quantities andlogistics of pans replenishment) acrosslhe order fulfillment value stream.
• We changed our chart-of-accountsstructure to a few value stream groupingsrather than maintaining costs by tradi-tional departments. We maintained a sep-aration of inventoried cost of sales (COS)from that of selling, general and admin-istrative (.SG&rA) to make end-of-monthcapitalization of labor and overhead costssimple Lo identify
• We zeroed out labor and overheadrates from our system and stopped gener-ating and collecting labor and overheadvariance information. Like many compa-nies, we found that most of the standardcost and variance informaiion was receivedtoo laie and involved too many transactionsto be of any use in improving our business.We replaced end-of-monih variance re-ports, rarely fully utilized by management,with very visual live hourly and daily op-erator-generated reporting that is reviewed
and acted upon daily by the value streamteam. This change contributed to active im-provements of production processes.
• We spill oui material costs from otherCOS conversion costs and used a memoline in our internal financial statements toincrease visibility of inventory purchases,which our value stream procurement em-ployees reported on each week.
CHALLENGESWe needed to overcome a few challengesin our day-to-day accounting processes.Traditional functional spending reports nolonger exist (that is. HR departmentspending), Spending is analyzed by valuestream instead, and the few funclionalexcellence personnel in the general sup-port group share a "department" in thegeneral ledger. This met with some resist-ance initially, but lhe general supportgroup has since realized that they gener-ally do not incur much of the site spend-ing, and the vaiue stream spending isreviewed in detail each week during thevalue stream metric reviews, This hasgreatly reduced the number of generalledger accounts used and made forecast-ing and budgeting much simpler
Fully burdened standard costs nolonger exist. We now maintain material
Exhibit 3 Timeline af Winona, Minn., Faciiity Implementatian
WINONA
ValueStreamImplemenla-tions
RelatedOtherActivities
April May June July Aug. Sept. Oct. Nov. Dec. Jan. Feb. March April
Education,identificationofvaliestreams andmetrics:began todeveiopV.S.operatingsystem
Addedcapacityanaivsis;began todevelopdecision-makingtoois
Preparedquarterlylorecast innew V.S.structure
Began fullaccountingin valuestreams;eliminateddetailedlaborreporting
Implem. of2nd valuestream
Implem, of3rd valuestream
Implenfi, o(4tti valuestream
Developednewinventoryvaluationmetbod;held deci-sion-mak-ing tfaining
Eliminatedlabor andoverheadstandards
Held Sales,Operations& FmanciaiPlanning(SOFP)Kaizen
tst cycleof newSOFPprocess
Within two mofitlis, weekiy VSM reviews began.Within six months, all vaiue streams were up and running, witti daiiy/weekiy VSM reviews.Within one year, full sales, operations and financial planning VSM process were added.
64 Journal of Accountancy July 2008
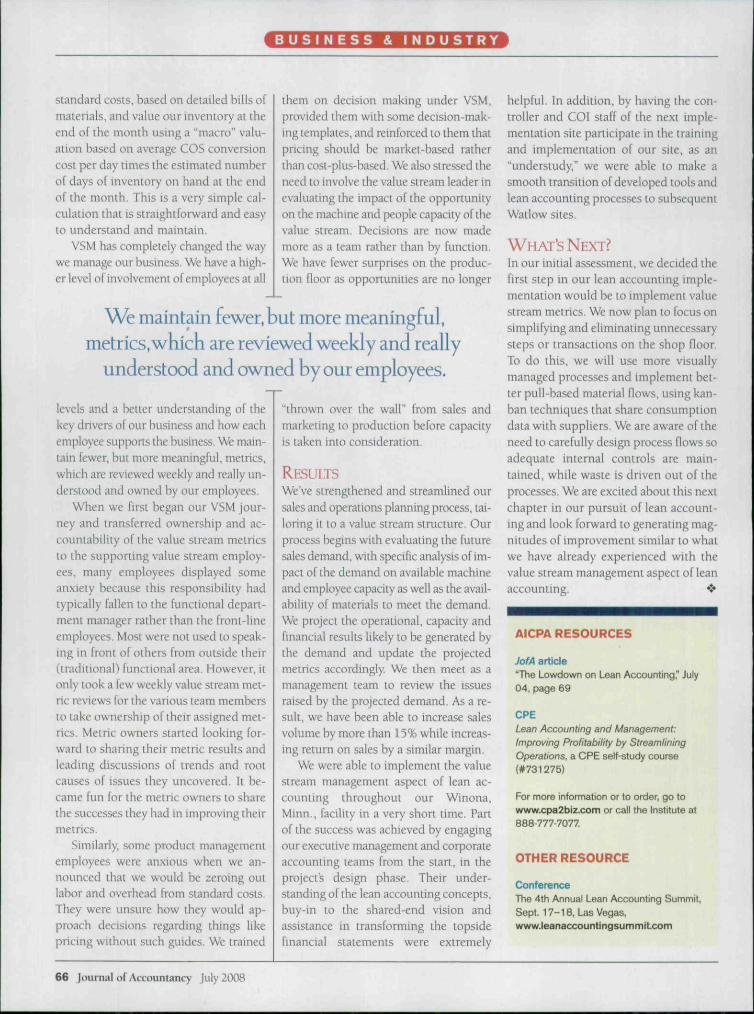
B U S I N E S S & I N D U S T R Y
standard costs, based on detailed bills oftnaterials, and value our inventory at theend of lhe month using a "macro" valu-ation based on average COS conversioncost per day times the estimated numberof days of inventory on hand at the endof lhe month. This is a ver)' simple cal-culation that is straightforward and easyto understand and maintain.
VSM has completely changed lhe waywe manage our business. We have a high-er level of involvement of employees at all
ihem on decision making under VSM,provided thetii with some decision-mak-ing templates, and reinforced to them thatpricing should be market-based raiherihan cost-plus-based. We also stressed theneed to involve the value stream leader inevaluating the impact of the opportunityon the machine and people capacity of thevalue slream. Decisions are now mademore as a team rather than by function.We have fewer surprises on the produc-tion floor as opportunities are no longer
We maintain fewer, but more meaningful,metrics, which are reviewed weekly and really
understood and owned by our employees.
levels and a lietter understanding of thekey drivers of our business and how eachemployee supports the business. We main-tain fewer, but more meaningful, metrics,which are reviewed weekly and really un-derstood and owned by our employees.
When we firsi began our VSM jour-ney and transferred ownership and ac-countability of lhe value stream metricsto the supporting value stream employ-ees, many employees displayed someanxiety because this responsibility hadLypicalty fallen Lo the functional depart-ment manager rather than lhe front-lineemployees. Most were not used to speak-ing in from of others from outside their(tradiiionaO functional area. However, itonly look a few weekly value stream met-ric reviews for the various team membersto take ownership of their assigned met-rics. Metric owners started looking for-ward to sharing their metric results andleading discussions of trends and rootcauses of issues they uncovered. It be-came fun for lhe metric owners to sharethe successes they had in improving theirmeUics,
Similarly, some product managementemployees were anxious when we an-nounced that we would be zeroing ouilabor and overhead from standard costs.They were unsure how they would ap-proach decisions regarding ihings likepricing without such guides. We trained
"thrown over the wall" from sales andmarketing to production before capacityis taken into consideration.
RESULTSWe've strengthened and streamlined oursales and operations planning process, tai-loring it to a value stream structure. Ourprocess begins with evaluating the futuresales demand, with specific analysis of im-pact of the dctnand on available machineand employee capacity as well as the avail-ability of materials to meet the demand.We projeci the operational, capacity andfinancial results likely lo be generated bylhe demand and update the projectedmetrics accordingly. We then meet as atnanagetneni team to review lhe issuesraised by the projected demand. As a re-sult, we have been able to increase salesvolume by more than 15% while increas-ing return on sales by a similar margin.
We were able to implement the valuestream management aspect of lean ac-counting throughout our Winona,Minn., facility in a very short time. Partof the success was achieved by engagingour executive management and corporateaccounting teams from the stari, in theprojects design phase. Their under-standing of the lean accounting concepts,buy-in to lhe shared-end vision andassistance in transforming lhe topsidefinancial statements were extremely
helpful. In addition, by having the con-troller and COl staff of lhe next imple-mentation site participate in the trainingand implementation of our site, as an"understudy," we were able to make asmooth t ransition of developed tools andlean accounting processes to subsequentWatlow sites.
WHAI'SNEXT?In our initial assessment, we decided thefirst step in our lean accounting imple-mentation would be 10 implement valuestream metrics. We now plan to focus onsimplifying and eliminating unnecessarysteps or transactions on the shop floor.To do this, we will use more visuallymanaged processes and implement bet-ter pull-based maierial flows, using kan-ban techniques lhat share consumptiondata with suppliers. We are aware of theneed to carefully design process flows soadequate internal controls are main-tained, while wasie is driven out of theprocesses. We are excited about this nextchapter in our pursuit of lean account-ing and look forward to generating mag-niiudes of improvement similar to whatwe have already experienced with thevalue stream management aspect of leanaccounting. •
AlCPA RESOURCES
JofA article"The Lowdown on Lean Accounting," July04, page 69
CPELean Accounting and Management:Improving Profitability by StreamliningOperations, a CPE self-study course(#731275)
For more information or to order, go towww.cpa2biz.com or call the Institute at888777-7077.
OTHER RESOURCE
ConferenceThe 4th Annual Lean Accounting Summit,Sept. t7-18, Las Vegas,www.leanaccountjngsummit.com
66 Jiiumal of Accountancy July 2008