chapter 18 constitutive modeling of wind energy potential
TRANSCRIPT

375
Copyright © 2013, IGI Global. Copying or distributing in print or electronic forms without written permission of IGI Global is prohibited.
Chapter 18
DOI: 10.4018/978-1-4666-2208-1.ch018
Constitutive Modeling of Wind Energy Potential of Selected Sites in Nigeria:
A Pre-Assessment Model
ABSTRACT
In this chapter, the authors present the result of a study carried out to develop a pre-assessment model that can be used to carry out a preliminary study on the availability of wind energy resources of a site. 21 years’ (1987 – 2007) monthly average wind speeds for 18 locations in Nigeria were used to create the simple constitutive model. The locations span across the six geopolitical zones of the nation with three stations from each zone. Various statistical procedures were employed in the development of the model. The outcome gave an empirical model, which if employed, will lead to determining the mod-est range of wind energy potential of a site. Further, the results from this model were compared with those from the well-established two-parameter Weibull statistical distribution function and found to be reasonably adequate. Thus with this model, decision on site selection for complete assessment can be made without much rigour.
INTRODUCTION
The impact of electricity to a nation cannot be overemphasized. The socio-economic growth of national economies has been proved to depend to a large extent on the balance between demand and
supply of electrical energy. Moreover, the level of availability and utilization of energy in a country is reported to be responsible for the increase or decrease in the population of a community, it is also directly linked to the growth of national product (Hermann, 2001). Countries with low
O. O. AjayiCovenant University, Nigeria
R. O. FagbenleObafemi Awolowo University, Nigeria
J. KatendeBotswana International University of Science and Technology, Botswana

376
Constitutive Modeling of Wind Energy Potential of Selected Sites in Nigeria
energy availability and high-energy demand have been found to have correspondingly high propor-tion of poverty, illiteracy and migration. Also, the principles of the millennium development goals, access to information technology systems and im-proved telecommunication, literacy programmes and birth control policies will not do well if the current trend of energy shortages experienced by developing nations is not addressed globally (Hermann, 2001).
However, energy production has over the years been dependent to a large extent on fossil fuels in the form of coal, oil and natural gas. An estimate revealed that, 65% of the global sources of energy generation are from fossil fuels (Stiebler, 2008; Ajayi et al., 2010). It is reported. In Nigeria for instance, that major telecommunication systems and masts depend majorly on electricity produced from diesel generators on a daily basis. The emis-sions from this source have been found to include various gases, which have direct or indirect effects on the ozone layer. This creates a depleting effect of the layer and also in the process interferes with the self-cooling of the natural atmosphere (Ajayi et al., 2010).
Recently, concerns over the environment’s quality have become subjects of global discussion, prompting various legislations, debates and decla-rations. Majority of the arguments have favoured the reduction of anthropogenic emissions that are deleterious to the environment and promotes the utilization of renewable energy resources for power generation (Ajayi et al., 2010). However, utilization of renewable energy resources, such as wind, for power generation in a given location requires the first step of resource assessment. This is in order to have adequate information on the intensity and viability of its prospects at the location (Fadare, 2009; Islam et al., 2009). The development of wind as a source of renewable electricity in developing countries, especially Af-rica, has been hindered by the absence of adequate measurements and/or assessment studies (Ajayi et al., 2013b). It is worthy of note that, before em-
barking on wind energy investments, the investors would first want to know the magnitude of likely wind energy output from a site’s wind speed. A complete resource assessment therefore ranges from site selection and preparation, installation of wind speed measuring equipment, data gather-ing, analyses, and modelling to decision making. The analyses and modelling stage is critical to the study as it exposes the site’s potential and degree of viability for a wind-to-power project. Various means exist for modelling wind energy potential of a site.
Based on the aforementioned, modelling can be explained to mean a process of creating suitable and qualified approximations which could be used to replace real life systems, repetitive or fluctuating data, or phenomena. However, without appropriate models, foretelling climatic variables, such as wind resources, will be a process that becomes expensive and could be frustrating. Several studies have been conducted and published on using statistical prob-ability density functions to describe wind speed frequency distributions. Some of those that have been used in time past (pre-1970 analyses) range from using standard parametric distributions to distributions that relate to applying the principle of maximum entropy. Some authors have also suggested the use of univariate and bivariate distributions, unimodal, bimodal, bitangential and hybrid distributions (Justus, 1978; Auwera, 1980; Koeppl, 1982; Ozerdem, 2003; Shata & Hanitsh, 2006; Ramirez & Carta, 2006; Akpinar & Akpina, 2007; Tar, 2007; Chang & Tu, 2007; Shamilov et al., 2008; Carta et al., 2009).
In the post-1970 analyses, better statistical models surfaced. The use of the gamma distribu-tion function of two parameters (scale and shape parameters), normal and lognormal, Rayleigh, Weibull and other statistical distributions were proposed (Ozerdem, 2003; Akpinar & Akpina, 2007; Ngala et al., 2007; Carta et al., 2009). Ac-cording to Carta et al. (2009), the Rayleigh distri-bution function of one parameter corresponds to the chi-distribution for two degrees of freedom.

377
Constitutive Modeling of Wind Energy Potential of Selected Sites in Nigeria
It also coincides with the 2-parameter Weibull distribution when the shape parameter (k) of the latter takes the value 2. The probability distribu-tion has enjoyed wide application in wind speed analysis either exclusively or in combination with Weibull probability distribution. Moreover, of these two and other probability distribution methods, the Weibull distribution technique has enjoyed more emphasis. It has been employed in various regions of the world fundamentally for evaluating wind energy potential, carrying out the statistical analyses of wind characteristics, wind power density. In the estimation of the energy output and performance of wind energy systems, etc. (Burton et al., 2001; Kose et al., 2004; Akpinar & Akpinar, 2005a; Akpinar & Akpinar, 2005b; Fadare, 2008; Yang et al., 2008; Carta et al., 2009; Kamau et al., 2009; Soon-Duck, 2010).
However, the use of these models, especially the Rayleigh and Weibull distributions involve the utilization of a set of historical wind speed data covering some period of years for statistical significance. Based on this, some investors may be unwilling to commit resources to embark on this task since they are not sure of the outcome. This therefore creates a need for the development of an empirical model that can be used as a first stop before complete assessment study. Such model when available will serve as a pre-assessment model and aid in the selection of a site for complete resource assessment. The modelling procedure involved employing wind speed data set of some years to create a simple model that can be used for a site’s pre-assessment study. The outcome from this empirical model will give rise to a modest estimation as well as the least magnitude of wind energy potential of the site.
MATERIALS AND METHODS
Data used for the study were 21 years’ (1987-2007) monthly mean wind speeds at 10 m heights
obtained from the Nigeria meteorological depart-ment, Oshodi. These data covered for 18 stations spread across the six geopolitical zones of Nigeria, with a station per state and three states per zone out of the 36 states of the federation. The data were then analyzed on annual basis. Figure 1 gives the annual average wind profile distribution for all the stations covering the period of analyses, while Figure 2 gives the range of annual average wind speeds for each station. Figure 3 presents the 21 years annual average wind speed per sta-tion. Table 1 gives the information relating to the station location.
MODELING TOOLS
Wind Power
The average power extractable from the wind by a wind turbine is estimated to vary with the cube of average wind speed as:
P A Cx
vp ii
x
=⎛
⎝⎜⎜⎜⎜
⎞
⎠⎟⎟⎟⎟∑1
21 3ρ (1)
where:
P = Power Flux, ρ = air density, νi = wind speeds, Cp = Coefficient of power, x = number of data points, A = wind turbine rotor area
Wind Energy Flux Density
The average wind energy per unit rotor area of a turbine, extractable from the wind by a wind turbine is obtained from the average power by:
E P Ti= × ×η (2)

378
Constitutive Modeling of Wind Energy Potential of Selected Sites in Nigeria
where:
η = turbine efficiency,Ti = mean period
The mean period, Ti, is given by the Rayleigh probability distribution model as:
T T ei
v
vm
m=−
−⎛
⎝⎜⎜⎜⎜⎜
⎞
⎠
⎟⎟⎟⎟⎟
max
π4
12
(3)
Figure 2. 21 years’ annual range of wind speeds for each station
Figure 1. 21 years’ annual average wind speed for all distribution stations

379
Constitutive Modeling of Wind Energy Potential of Selected Sites in Nigeria
Figure 3. 21 years’ annual average wind speed for each station
Table 1. Details of the meteorological stations
Station Station No. Latitude (N) Longitude (E) State Elevation (m) Density (kg/m3)
Onitsha 65245 06.09’ 06.47’ Anambra 67.0 1.2173Lagos Island 65205 06.26’ 03.25’ Lagos 2.0 1.2248Maiduguri 65082 11.51’ 13.05’ Borno 353.8 1.1842Potiskum 65073 11.42’ 11.02’ Yobe 414.8 1.1771Enugu 65257 06.28’ 07.33’ Enugu 141.8 1.2086Ibadan 65208 07.26’ 03.54’ Oyo 227.2 1.1988Jos 65134 09.52’ 08.45’ Plateau 1217.0 1.085Port-Harcourt 65250 04.51’ 07.01’ Rivers 19.5 1.2228Ilorin 65101 08.29’ 04.35’ Kwara 307.4 1.1895Katsina 65028 13.01’ 07.41’ Katsina 517.6 1.1653Sokoto 65010 13.01 ‘ 05.15’ Sokoto 350.8 1.1845Gusau 65015 12.10’ 06.42’ Zamfara 463.9 1.1715Abuja 65125 09.15’ 07.00’ Fct 343.1 1.1854Owerri 65252 05.29’ 07.00’ Imo 91.0 1.2145Warri 65236 05.31’ 05.44’ Delta 6.1 1.2243Benin 65229 06.19’ 05.06’ Edo 77.8 1.216Nguru 65064 12.53’ 10.28’ Yobe 343.1 1.1854Ondo 65222 07.06’ 04.50’ Ondo 287.3 1.1919

380
Constitutive Modeling of Wind Energy Potential of Selected Sites in Nigeria
where:
Tmax = maximum time period for a year in hours = 8760 hrs. per year.
Substituting Equation 9 into Equation 8 gives:
E C vave p m evvmm= × × ×
−⎛
⎝
⎜⎜⎜⎜⎜⎜
⎞
⎠
⎟⎟⎟⎟⎟⎟
−⎛
⎝
⎜⎜⎜⎜⎜⎜⎜10529 52 3 4
12
. ηπ
⎜⎜⎜
⎞
⎠
⎟⎟⎟⎟⎟⎟⎟⎟⎟⎟
(4)
where:
Eave = Average wind energy flux density
Equation 4 is the general expression for annual wind energy flux density in Whr/m2yr.
Since 10529 52. × ×Cp η is a constant, it therefore follows that:
E f vave m= ( ) (5)
Based on the relation of Equation 5, the exact relationship between vm and Eave can be determined through the procedure of regression statistics. This will lead to the determination of the constitutive relationship between vm and Eave.
The 2-Parameter Weibull Statistics
In order to determine the accuracy of the model generated, it became necessary to determine the degree of convergence of the results from the model with those from a well established statistics. The 2-parameter Weibull statistical distribution was therefore employed according to literature (Akpinar and Akpinar, 2005a; Keyhani et al., 2010; Fagbenle et al., 2011). The magnitude of the annual wind energy per unit area obtained from the Weibull statistics (EWeibull) can be evaluated from (Keyhani et al., 2010),
E ckTWeibull i= + ×
⎛
⎝⎜⎜⎜⎜
⎞
⎠⎟⎟⎟⎟⎟
12
1 33ρ Γ (6)
where:
c = Weibull scale parameter (m/s) and k = Weibull shape parameter.
The scale and shape parameters of the Weibull are evaluated from:
kv
km
= ≤ ≤⎛
⎝
⎜⎜⎜⎜⎜
⎞
⎠
⎟⎟⎟⎟⎟( )σ
- .1 086
1 10 (7)
cv
k
m=+
⎛
⎝⎜⎜⎜⎜
⎞
⎠⎟⎟⎟⎟⎟
Γ 1 1 (8)
where Γ is the gamma function of () given by:
Γ x e u duu x( ) = − −∞
∫ 1
0
(Keyhani et al., 2010), σ =
standard deviation (m/s).
Performance Estimation of the Weibull Statistics
Before the Weibull results can be applied to this study, its predictive accuracy to the actual mea-sured wind speed values (vactual,) were evaluated using the some statistics. These are the coefficient of determination, R2, the Root Mean Square Error (RMSE) and the Nash-Sutcliffe model Coefficient Of Efficiency (COE) (Ajayi et al., 2011; Ajayi et al. 2011). Based on these, the Weibull result is judged accurate if the values of R2 and COE are closer to 1 or the values of RMSE are closer to zero.

381
Constitutive Modeling of Wind Energy Potential of Selected Sites in Nigeria
RESULTS AND DISCUSSION
Wind Profile Characteristics
Figure 1 shows the annual mean wind speed pro-files across the stations. While some stations such as those of Enugu, Ondo, Benin, Ilorin, Abuja, Potiskum, Maiduguri, Nguru and Jos demonstrated stable monthly mean wind speeds’ distribution across the period, others reveal fluctuations in their profiles. However, the annual fluctuations of wind speeds profiles across the period for all stations are not very pronounced except for Jos in Plateau state. Figure 2 shows the annual wind speed range across the 21 years period and reveals that Jos station had the best wind speed range, followed by Katsina, Sokoto and Gusau, while Onitsha and Ondo experienced the least. More-over, on the 21 years average values, Jos has the best wind energy potential followed by stations in the North-West geopolitical zones of Nigeria.
Ranking the stations in each geopolitical zones according to their monthly and yearly wind profiles showed that the stations in the North-West zone have the greatest potential for wind energy harvest, followed by those of North-Central, North-East, South-East, South-West and South-South zones. Based on the data from the 18 locations of this study, it can be deduced that stations and sites in the northern Nigeria are capable of large wind-to-power projects, while those of the southern parts are capable of medium to small scale (or standalone) projects except for Enugu and Lagos Island.
Modelling Wind Energy Potential of the Sites, Zones, and Nation
Equation 4 was employed for the modelling. The equation reveals that the values of Eave depend on vm, Cp and η respectively. Thus with the different values of vm and varying values of η and Cp, the magnitudes of Eave can be evaluated for the dif-ferent stations. However, carrying out a regression
analysis of Eave depend on vm for different values of η while keeping Cp constant gives Figure 4 for Onitsha. The range of η used lay within 0 15 1. .≤ ≤η
Figure 4 shows that:
E vave m= β 2 657. (9)
Further observing Figure 4 also reveal the relation:
β η= ( )f (10)
Based on Equations 9 and 10, it became nec-essary to establish the exact relationship between Eave and vm. This gives Figure 5 after a regression of β against η.
Thus combining Equations 9 and 10 from Figures 4 and 5 gives Equation 11 for Onitsha as:
E vave = × ×10900 2 657η . (11)
Varying the values of CP, as was done for η gave Equation 11 as:
E C vave p m= × × ×10900 2 657η . (12)
Equation 12 is therefore the constitutive wind energy model which is suitable for analyzing wind energy situation of Onitsha station. Repeating the procedure for the other stations gave Equations 13 to 29.
Katsina: E vave Cp m= ×× ×8657 2 805η . (13)
Sokoto: E vave Cp m= ×× ×8617 2 807η . (14)
Gusau: E vave Cp m= ×× ×8966 2 786η . (15)
385
Constitutive Modeling of Wind Energy Potential of Selected Sites in Nigeria
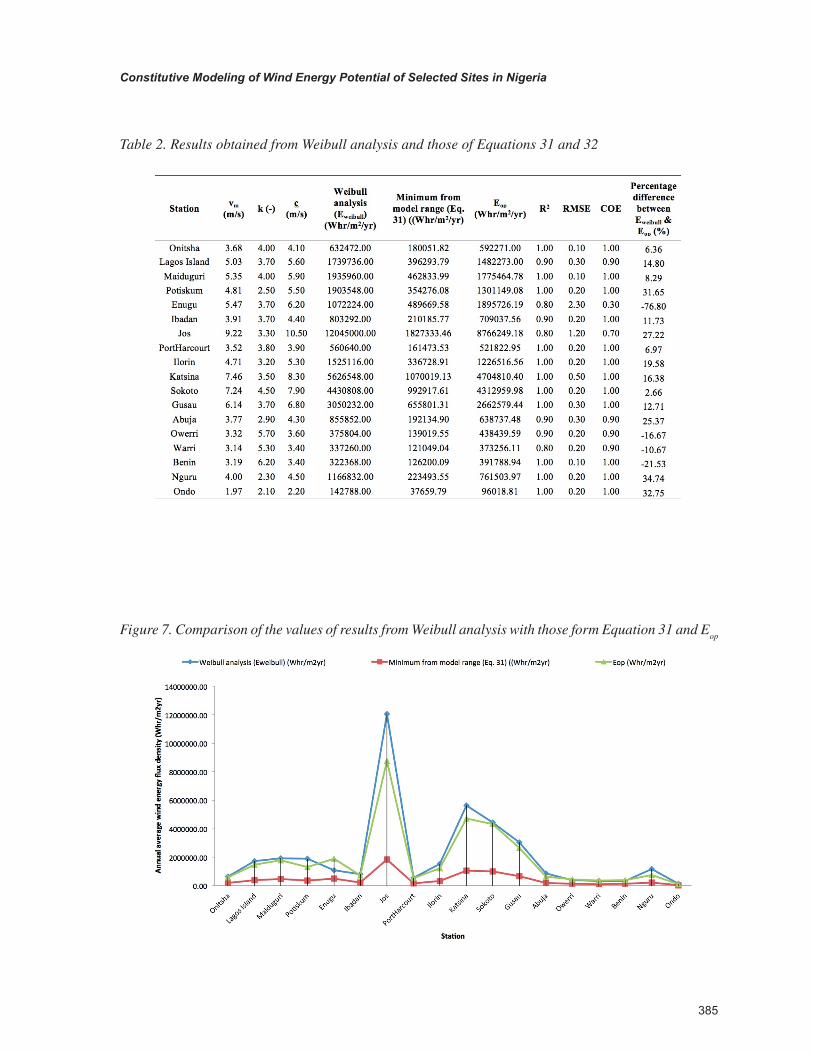
Table 2. Results obtained from Weibull analysis and those of Equations 31 and 32
Figure 7. Comparison of the values of results from Weibull analysis with those form Equation 31 and Eop

384
Constitutive Modeling of Wind Energy Potential of Selected Sites in Nigeria
Based on the aforementioned, Figures 6 pres-ents the values of average wind energy per unit area of each stations corresponding to employing the individual models of Equations 12 to 29 and range of Equation 31
Figure 6 shows that the results from employing Equations 12 to 30 fall within that of Equation 31. This therefore means that Equation 31 is a better model representation for all the stations and in the geopolitical zones and anywhere in the country. Thus with this model, predictions can be made on the likely range of average wind energy flux density that can be generated from a site/station when the average wind speed of the site and station is known. Moreover, since investors are always interested in the optimum (Eop) value of the wind energy that can be harvested from a particular wind speed value, the maximum of Equation 31 is selected and called the optimum or maximum modest average wind energy harvest-able from a site/station. This is given as:
E vop Cp m= × × ×13105 2 928η . (32)
Equation 32 can therefore be the useful model for estimating the most probable maximum likeli-hood magnitude of wind energy per unit area from any site in Nigeria.
Evaluation of the Performance of the Model Represented by Equation 32
Since Equation 32 can give the probable maximum value of wind energy flux density of any location in Nigeria, it became important to estimate its accuracy. In order to determine this, the 2-param-eter Weibull statistical distribution was fitted to the wind speed data set employed for this study. Some of the Weibull results are presented in Table 2. The outcome of the Weibull analysis (EWeibull) was then compared to the results of employing the minimum of Equation 31 and also the results of Eop. This is shown in Figure 7.
Table 2 shows that the model representation of Equation 32 predicted between 65 and above 100% of the value values of EWeibull. However, at each point the percentage difference was negative, the value of Eop was more than EWeibull. It is noted that for Enugu, Owerri, Warri, and Benin where
Figure 6. Magnitude of wind energy per unit area corresponding to Equations 12 to 30 and the model range of Equation 31

383
Constitutive Modeling of Wind Energy Potential of Selected Sites in Nigeria
Maiduguri: E vave Cp m= ×× ×9732 2 739η . (16)
Potiskum: E vave Cp m= ×× ×10074 2 720η . (17)
Nguru: E vave Cp m= ×× ×10216 2 707η . (18)
Jos: E vave Cp m= ×× ×8100 2 837η . (19)
Ilorin: E vave Cp m= ×× ×10133 2 712η . (20)
Abuja: E vave Cp m= ×× ×10697 2 673η . (21)
Lagos Island: E vave Cp m= ×× ×9502 2 752η . (22)
Ibadan: E vave Cp m= ×× ×10513 2 684η . (23)
Ondo: E vave Cp m= ×× ×10409 2 726η . (24)
Enugu: E vave Cp m= ×× ×9859 2 731η . (25)
Owerri: E vave Cp m= ×× ×10732 2 665η . (26)
Port-Harcourt: E vave Cp m= ×× ×10530 2 684η . (27)
Warri: E vave Cp m= ×× ×10753 2 663η . (28)
Benin: E vave Cp m= ×× ×10697 2 668η . (29)
The R2 values that relates to the models all lie within 0.998 R2≤ ≤ 1 000. . This reveals that the models as they are, are adequate at explaining over 99% variations in the average wind energy per unit area of the locations.
Doing the same for the nation in order to obtain the national model gave Equation 30. This was obtained by taking the arithmetic mean of the annual wind speeds of all the stations.
National model:
E vave Cp m= ×× ×9712 2 738η . (30)
Range of Average Wind Energy Potential
Each of Equations 12 to 29 gives the magnitude of wind energy per unit area that can be harvested from the station. Moreover, for the purpose of simplicity and ease of application, it became necessary to develop a model which can be used to determine the maximum and minimum range of values of wind energy per unit area that can be harvested from any sites within the nation. This was achieved by employing the statistical tolerance limit method together with the set of Equations 12 to 29. The outcome gave Equation 31.
6793 28 131052 518 2 928. . .× × × ×× ×≤ ≤η ηC Cp m p mv E vave
(31)
Thus with Equation 31, the range of average wind energy per unit area can be determined. This i s g i v e n t o l i e w i t h i n E vave Cp m= × × ×6793 28 2 518. .η a n d E vave Cp m= × × ×13105 2 928η . (Whr/m2yr.).

382
Constitutive Modeling of Wind Energy Potential of Selected Sites in Nigeria
Figure 4. Regression plots of wind energy against annual wind speed for Onitsha
Figure 5. Regression of coefficient of speed against the turbine efficiency

386
Constitutive Modeling of Wind Energy Potential of Selected Sites in Nigeria
the values of Eop were more than EWeibull, the excess prediction of Eop were between 11 and 77%. While those of Owerri, Warri and Benin were reasonably low, that of Enugu was high (see Figure 7). The reason for this is explained by the values of RMSE (2.30) and COE (0.3). The values of these estima-tion parameters contradicted the interpretation given earlier. The interpretation to this phenom-enon is given in Ajayi et al. (2011). This is given as, the greater than the actual measured data is the value of the Weibull prediction, the closer to or greater than 1.0 is the value of RMSE and the closer to zero the value of COE. Thus it means that at this point there is an over prediction by the Weibull result. This invariably referred to the fact that the percentage difference is expected to be less than the 77%. Further to this, apart from the results for Potiskum, Nguru and Ondo stations, the values of Eop reasonably predicted the Weibull results (EWeibull). The percentage differences for the other stations apart from the three aforemen-tioned are above 72% of the Weibull results. Based on this, it can be concluded that the model repre-sentation of Equation 32 is adequate for a pre-
assessment study of a site. It can reasonably predict good enough percentages of wind energy harvestable from a site and therefore could lead to accurate decision making on a site.
When the model was tested with other pub-lished results (Akpinar and Akpinar, 2005a; Kamau et al., 2009; Keyhani et al., 2010) it gave Figure 8. Sulaiman et al. (2002) carried out the study of the wind characteristics of four different locations in Oman out of which two (Salalaha and seeb) were employed. Akpinar and Akpinar (2005a) carried out the statistical analysis of the wind speed data of Keban-Elazig, Turkey. Kamau et al. (2009) on the other hand studied the 6 years wind data for Marsabit Kenya, while Keyhani et al. (2010) carried out the assessment of wind energy potential for power generation of Tehran, Iran. The studies employed the 2-parameter Weibull statistical distribution for the analyses. Figure 8 shows that apart from kamau et al. (2010), Equation 32 reasonably predicted the results of the other researches. Figure 8 therefore reveals that the model represented by Equation 32 can be used as a preliminary check to predict the likely
Figure 8. Comparison of the results from Eop with published Weibull results

387
Constitutive Modeling of Wind Energy Potential of Selected Sites in Nigeria
potential of wind energy harvestable from a site before embarking on detailed assessment study of such site.
CONCLUSION
The development of a model suitable for car-rying out the pre-assessment study of a site has been developed. Although it is always necessary to embark on a thorough assessment study of a site proposed for a wind farm, investors would however want to know the viability of such site before hand. This is as to be able to arrive at a preliminary decision that a complete assessment study would depend on. Such questions as to how much on the least and what optimum or maximum modest value is likely to be the situation of the wind energy distribution of the location can be evaluated by simply knowing the magnitude of the average wind speeds of a location or a region. Most times such information is available at a national (meso-scale) level and at times site’s specific local level. With the knowledge of such wind speeds and the use of models of Equations 31 and 32, it is possible to determine the minimum and optimum (or maximum modest) values of wind energy flux density of the local site or region.
REFERENCES
Ajayi, O. O., Fagbenle, R. O., & Katende, J. (2011). Wind profile characteristic and econo-metrics analysis of wind power generation of a site in Sokoto State, Nigeria. Energy Science and Technology, 1(2), 54–66.
Ajayi, O. O., Fagbenle, R. O., Katende, J., & Okeniyi, J. O. (2011). Availability of wind energy resource potential for power generation at Jos, Nigeria. Frontiers of Energy.
Ajayi, O. O., Fagbenle, R. O., Katende, J., & Okeniyi, J. O. (2011). Availability of wind energy resource potential for power generation at Jos, Nigeria. Frontier of Energy 5(4), 376-385.
Ajayi, O. O., Fagbenle, R. O., Katende, J., Okeniyi, J. O., & Omotosho, O. A. (2010). Wind energy potential for power generation of a local site in Gusau, Nigeria. International Journal of Energy for a Clean Environment 11 (1-4), 99-116.
Akpinar, E. K., & Akpinar, S. (2005a). A statis-tical analysis of wind speed data used in instal-lation of wind energy conversion systems. En-ergy Conversion and Management, 46, 515–532. doi:10.1016/j.enconman.2004.05.002.
Akpinar, E. K., & Akpinar, S. (2005b). An assess-ment on seasonal analysis of wind energy charac-teristics and wind turbine characteristics. Energy Conversion and Management, 46, 1848–1867. doi:10.1016/j.enconman.2004.08.012.
Akpinar, S., & Akpinar, E. K. (2007). Wind energy analysis based on maximum entropy prin-ciple (MEP)-type distribution function. Energy Conversion and Management, 48, 1140–1149. doi:10.1016/j.enconman.2006.10.004.
Auwera, L. V., Meyer, F., & Malet, L. M. (1980). The use of the Weibull three-parameter model for estimating mean wind power densities. Journal of Applied Meteorology, 19, 819–825. doi:10.1175/1520-0450(1980)019<0819:TUOTWT>2.0.CO;2.
Burton, T., Sharpe, D., Jenkins, N., & Bossanyi, E. (2001). Wind energy handbook. Hoboken, NJ: Wiley. doi:10.1002/0470846062.
Carta, J. A., Ramı’rez, P., & Velázquez, S. (2009). A review of wind speed probability distributions used in wind energy analysis: Case studies in the Canary Islands. Renewable & Sustainable Energy Reviews, 13, 933–955. doi:10.1016/j.rser.2008.05.005.

388
Constitutive Modeling of Wind Energy Potential of Selected Sites in Nigeria
Chang, T. J., & Tu, Y. L. (2007). Evaluation of monthly capacity factor of WECS using chrono-logical and probabilistic wind speed data: A case study of Taiwan. Renewable Energy, 32, 1999–2010. doi:10.1016/j.renene.2006.10.010.
Fadare, D. A. (2009). Modeling of solar energy potential in Nigeria using artificial neural net-work model. Applied Energy, 86(9), 1410–1422. doi:10.1016/j.apenergy.2008.12.005.
Fadare, D. A. A. (2008). Statistical analysis of wind energy potential in Ibadan, Nigeria, based on Weibull distribution function. The Pacific Journal of Science and Technology, 9(1), 110–119.
Fagbenle, R. O., Katenje, J., Ajayi, O. O., & Okeniyi, J. O. (2011). Assessment of wind energy potential of two sites in North-East, Nigeria. Re-newable Energy, 36, 1277–1283. doi:10.1016/j.renene.2010.10.003.
Islam, M. D., Kubo, I., Ohadi, M., & Alili, A. A. (2009). Measurement of solar energy radiation in Abu Dhabi, UAE. Applied Energy, 86, 511–515. doi:10.1016/j.apenergy.2008.07.012.
Justus, C. G. (1978). Winds and wind system performance. Philadelphia, PA: Franklin Institute Press.
Kamau, J. N., Kinyua, R., & Gathua, J. K. (2010). 6 years of wind data for Marsabit, Kenya average over 14 m/s at 100 m hub height: An analysis of the wind energy potential. Renewable Energy, 36(6), 1298–1302. doi:10.1016/j.renene.2009.10.008.
Koeppl, G. W. (1982). Putnam’s power from the wind. New York: Van Nostrand Reinhold.
Ngala, G. M., Alkali, B., & Aji, M. A. (2007). Viability of wind energy as a power generation source in Maiduguri, Borno state, Nigeria. Renew-able Energy, 32(13), 2242–2246. doi:10.1016/j.renene.2006.12.016.
Ozerdem, B., & Turkeli, M. (2003). An investi-gation of wind characteristics on the campus of Izmir Institute of Technology, Turkey. Renewable Energy, 28, 1013–1027. doi:10.1016/S0960-1481(02)00155-6.
Ramirez, P., & Carta, J. A. (2006). The use of wind probability distributions derived from the maximum entropy principle in the analysis of wind energy: A case study. Energy Conversion and Management, 47, 2564–2577. doi:10.1016/j.enconman.2005.10.027.
Shata, A. S. A., & Hanitsch, R. (2006). Evaluation of wind energy potential and electricity genera-tion on the coast of Mediterranean Sea in Egypt. Renewable Energy, 31, 1183–1202. doi:10.1016/j.renene.2005.06.015.
Soon-Duck, K. (2010). Uncertainty analysis of wind energy potential assessment. Journal of Applied Energy, 87, 856–865. doi:10.1016/j.apenergy.2009.08.038.
Sulaiman, M. Y., Akaak, A. M., Wahab, M., Zakaria, A., & Suradi, J. (2002). Wind character-istics of Oman. Energy, 27, 35–46. doi:10.1016/S0360-5442(01)00055-X.
Tar, K. (2007). Some statistical characteristics of monthly average wind speed at various heights. Renewable & Sustainable Energy Reviews, 12(6), 1712–1724. doi:10.1016/j.rser.2007.01.014.
Yang, G., Du, Y., & Chen, M. (2008). Computer aided investigation towards the wind power gen-eration potentials of Guangzhou. Computer and Information Science, 1(3), 13–19.
ADDITIONAL READING
Adekoya, L.O., & Adewale. (1992). Wind energy potential of Nigeria. Renewable Energy, 2(1), 35–39. doi:10.1016/0960-1481(92)90057-A.
389
Constitutive Modeling of Wind Energy Potential of Selected Sites in Nigeria
Çetin, N. S., Yurdusev, M. A., Ata, R., & Özdemir, A. (2005). Assessment of optimum tip speed ratio of wind turbines. Mathematical and Computa-tional Applications, 10(1), 147–154.
El Bassam, N., & Maegaard. (2004). Integrated renewable energy for rural communities: Plan-ning guidelines and technological application. Amsterdam: Elsevier LTD.
Han, S. G., Yu, & Park. (2007). PSCAD/EMTDC-based simulation of wind power generation system. Renewable Energy, 32(1), 105–117. doi:10.1016/j.renene.2005.12.008.
Ramirez, P., & Carta, J. A. (2006). The use of wind probability distributions derived from the maximum entropy principle in the analysis of wind energy: A case study. Energy Conversion and Management, 47, 2564–2577. doi:10.1016/j.enconman.2005.10.027.
Sorensen, H. A. (1983). Energy conversion sys-tems. New York: Wiley.
Stiebler, M. (2008). Wind energy systems for electric power generation, green energy, and technology. London: Springer.
Wood, D. (2011). Small wind turbine: Analysis, design, and application. London: Springer-Velag. doi:10.1007/978-1-84996-175-2.